ionics, inc. and subsidiaries · ionics, inc. and subsidiaries (the group) ionics, inc. (the parent...
TRANSCRIPT


IONICS, INC. AND SUBSIDIARIES ________________________________________
(Company’s Full Name)
Circuit Street,
Light Industry and Science Park of the Philippines I, Bo. Diezmo, Cabuyao City, Laguna, Philippines
________________________________________
(Company’s Address)
(049) 508 - 1111 _________________________________________
(Telephone Number)
2016/12/31
_________________________________________
(Fiscal Year Ending)
(month & day)
Annual Audited Financial Statements
(SRC Form 17-A) ________________________________________________
Form Type
________________________________________________
Amendment Designation (if applicable)
_________________________________________
Period Ended Date
__________________________________________
Secondary License Type and File Number

2
IONICS, INC. AND SUBSIDIARIES
TABLE OF CONTENTS
SEC FORM 17-A
Page
PART I - BUSINESS AND GENERAL INFORMATION
Item 1 Business 5
Item 2 Properties 11
Item 3 Legal Proceedings 12
Item 4 Submission of Matters to a Vote of Security Holders 12
PART II - OPERATIONAL AND FINANCIAL INFORMATION
Item 5 Market for Issuer’s Common Equity and
Related Stockholder Matters
12
Item 6 Management’s Discussion and Analysis or
Plan of Operation
14
Item 7 Financial Statements 17
Item 8 Changes in and Disagreements With Accountants on
Accounting and Financial Disclosure
25
PART III - CONTROL AND COMPENSATION INFORMATION
Item 9 Directors and Executive Officers of the Issuer 26
Item 10 Executive Compensation 30
Item 11 Security Ownership of Certain Beneficial
Owners and Management
32
Item 12 Certain Relationships and Related Transactions 34
PART IV - CORPORATE GOVERNANCE
Item 13 Corporate Governance 35
PART V - EXHIBITS AND SCHEDULES
Item 14 a. Exhibits and Reports on SEC Form 17-C 36
b. Reports on SEC Form 17-C (Current Report) 36
SIGNATURES 40
INDEX TO FINANCIAL STATEMENTS AND
SUPPLEMENTARY SCHEDULES
INDEX TO EXHIBITS

3
SECURITIES AND EXCHANGE COMMISSION
SEC FORM 17-A
ANNUAL REPORT PURSUANT TO SECTION 17
OF THE SECURITIES REGULATION CODE AND SECTION 141
OF THE CORPORATION CODE OF THE PHILIPPINES
1. For the fiscal year ended December 31, 2016
2. SEC Identification Number 107432
3. BIR Tax Identification No. 000-124-671-000
4. Exact name of issuer as specified in its charter IONICS, INC.
5. Province, Country or other jurisdiction of incorporation or organization
Laguna, Philippines
6. Industry Classification Code: (SEC Use Only)
7. Circuit Street, Light Industry and Science Park of the Philippines I, 4025
Bo. Diezmo, Cabuyao City, Laguna, Philippines
Address of principal office Postal Code
(049) 508-1111 and Fax Number (049) 508-1111 loc. 309
Issuer's telephone number, including area code
9. In 1996, the Company changed its principal place of business from Makati, Metro Manila to
Cabuyao, Laguna.
10. Securities registered pursuant to Sections 8 and 12 of the SRC, or Sec. 4 and 8 of the SRC
Title of Each Class Number of Shares of Common Stock
Outstanding and Amount of Debt Outstanding
Common P=1.00 par value per share, with 857,974,992
issued shares and 832,261,992 outstanding
shares (net of 25,713,000 shares of treasury
stock)
11. Are any or all of these securities listed on a Stock Exchange?
Yes [ x ] No [ ]
If yes, state the name of such stock exchange and the classes of securities listed therein:
Philippine Stock Exchange Common
4
12. Check whether the issuer:
(a) has filed all reports required to be filed by Section 17 of the SRC and SRC Rule 17 thereunder
or Section 11 of the SRC and SRC Rule 11(a)-1 thereunder, and Sections 26 and 141 of The
Corporation Code of the Philippines during the preceding twelve (12) months (or for such shorter
period that the registrant was required to file such reports);
Yes [ x ] No [ ]
(b) has been subject to such filing requirements for the past ninety (90) days.
Yes [ x ] No [ ]
13. Based on the closing price at the Philippine Stock Exchange on December 29, 2016 at US$0.032
per share, the Company’s common shares held by non-affiliates as of December 31, 2016 would
have a current market price of US$15,457,597.
14. Check whether the issuer has filed all documents and reports required to be filed by Section 17 of
the Code subsequent to the distribution of securities under a plan confirmed by a court or the
Commission.
Yes [ x ] No [ ]

5
PART I - BUSINESS AND GENERAL INFORMATION
Item 1. Business
Ionics, Inc. and Subsidiaries (The Group)
Ionics, Inc. (the Parent Company)
The Parent Company was incorporated in the Philippines on September 10, 1982 and started
commercial operations in July 1987 to engage in electronic manufacturing services business.
In September 1999, the Parent Company transferred its primary manufacturing business to a
majority owned subsidiary, Ionics EMS, Inc. (IEMS). Net assets with a book value of P=530
million as of April 30, 1999 were transferred to IEMS under a tax-free exchange for shares of
stock of IEMS. Accordingly, the Parent Company ceased to be a manufacturing company and
amended its primary purpose from that of a manufacturing entity to that of a holding
company.
In relation to the voluntary delisting of IEMS from the official list of Singapore Exchange
Securities Trading Limited (Singapore Exchange), the Parent Company acquired an additional
104,801,455 shares or 6.72% ownership over IEMS.
Ionics EMS, Inc.(IEMS)
IEMS was incorporated on September 21, 1999 to take over the electronic manufacturing
services business of the Parent Company. Certain assets and liabilities of the Parent Company
were transferred to IEMS in a restructuring exercise that took effect on May 1, 1999. Its
operations include printed circuit board assembly, box build assembly (finished product
assembly), disk drive, magnetic head assembly, compact disk read-write assembly, systems
and subsystems assembly, as well as design and testing services.
On February 25, 2000, IEMS offered its shares of stock to the public and became a public
company listed in the Singapore Exchange. In accordance with the Singapore Exchange
Listing Rule 1311, IEMS gave notice to the Singapore Exchange on March 4, 2008 that it has
recorded: (a) pre-tax losses for the three most recently completed consecutive financial years;
and (b) an average daily market capitalization of less than SGD$40.00 million over the last
120 days on which trading was not suspended for a full market day. Pursuant to the said
listing rule, IEMS was notified of inclusion on the Watch-list effective March 5, 2008. On
March 02, 2010, IEMS and the Parent Company jointly announced the proposed voluntary
delisting of IEMS from the official list of Singapore Exchange pursuant to Rules 1307 and
1309 of the Listing Manual of the SGX-ST. Subsequently, SGX-ST confirmed that the last
day of trading was June 8, 2010 and the closing date was June 15, 2010. On June 23, 2010,
the Company was officially delisted from the SGX-ST.
On August 12, 2010, the Board of Directors approved to set-up a company in the United
States which shall serve as a full service design and prototyping house in Silicon Valley.
Ionics Properties, Inc. (IPI) IPI was incorporated on July 8, 1997 primarily to own the land, buildings, houses, apartments
and other structures of whatever kind of the Ionics Group of Companies. IPI started
commercial operations in January 1998.

6
Ionics Circuits, Limited (ICL)
Formerly Rising Moon Limited, ICL was incorporated in the Cayman Islands on July 5, 2000
with limited liability. On February 14, 2001 Rising Moon changed its corporate name to ICL.
On March 22, 2005, the company registered address is Scotia Centre, 4th floor, George Town,
Grand Cayman, Cayman Islands.
Iomni Precision, Inc. (Iomni) Iomni was incorporated in the Philippines on June 20, 2000 primarily to manufacture and sell high-precision plastic products, parts, and injection molds and related products of every kind and description, and other disposition of plastic parts and related products, for its own account as principal or in a representative capacity. The company registered office address is No. 14 Mountain Drive, Light Industry and Science Park of the Philippines II, Brgy. La Mesa, Calamba City, Laguna. As of December 31, 2007, Iomni was 70% owned by the Parent Company. On January 20,
2008, the Parent Company acquired the remaining 30% of Iomni, thus it became a wholly-
owned subsidiary.
Synertronix, Inc. (SI)
SI was registered with the Securities and Exchange Commission on May 10, 1990, to
manufacture, purchase or otherwise acquire, buy and sell retail and wholesale, assemble,
produce, or otherwise dispose of, and generally deal in components, parts and devices of all
kinds and types used in connection with electronic and electrical machinery, appliances and
equipment including but not limited to capacitors, semi-conductors, condensers and
transformers for export abroad and for constructive exports to local companies. SI started
commercial operations in June 1998.
On August 15, 2003, the Parent Company decided to discontinue the operations of SI.
On July 2, 2014, the Parent Company decided to sell the land and building of SI.
Line of Business
The Group is a total one-stop shop Electronics Manufacturing Services (EMS) provider. It has
been the EMS solutions provider to some of the world’s biggest Original Equipment
Manufacturers (OEM) for over 38 years.
There are basically two general categories of electronics manufacturers or assemblers in the
region: the Original Equipment Manufacturer (OEM) and the Contract Electronics
Manufacturer (CEM). OEMs are companies who are leaders in PC, Computer Peripherals,
Telecommunications, Consumer Electronics, Automotive, Industrial and Medical Equipment.
On the other hand, CEMs are firms involved in the production of electronic items similar to
those produced by OEMs. These firms are basically independent, third party manufacturers or
assemblers which do not have any corporate affiliations with their respective customers.
CEMs therefore undertake subcontracting work only, and generally provide labor and
manufacturing overhead as their basic inputs in the assembly of electronic products.
The Group is essentially a CEM. Most of the Group’s “end” products, therefore, are
components and sub-assembly which are eventually used as inputs for the finished products of
its customers. The Group can accommodate most types of electronic manufacturing and
assembly projects. Customers provide the specifications and blue print or prototype of a
component or product that they want to be manufactured or assembled and the Group delivers
the finished item.

7
The Group provides “On Consignment” or “Turnkey” manufacturing arrangements to its
clients. Under an “On Consignment” arrangement, the Group furnishes labor and
manufacturing overhead inputs, while the product design and raw or input materials are
provided by the customer. Under the “Turnkey” arrangement, the Group provides all
production inputs for its clients. The product design, however, is still provided and owned by
the client.
In 2002, one of the Group’s subsidiaries had successfully offered design services to its
customer and also added an Original Design Manufacturer (ODM) component to its business
line.
Products
The following is a brief description of the primary products produced by the Group:
Telecommunication Products
Wireless broadband products
Wired telecom products
Fiber Optics - Synchronous Optical Networks
Infrastructure and Backplanes
Wi-Fi based RFID Tags
Telephone Ring Generators
Satellite Receivers and LONB’s
Service Gateways
Optical Network Pole Cabinets
Two-way handheld Radios
Wi-Fi Modules
Mobile Phone SIM’s for Roaming
Automotive Products
GPS Navigation System
RF Tuners
Vehicle Security Systems
Electronic Dashboards
Engine Sensors
Engine Starters
Car Antenna Control System
Automotive Multi-Media Device
Computer Products / Peripherals
Micro Drives
Motherboards
PCBA for HDD and Optical Drives
CD-RW and DVD-RW Optical Drives
Flip Chip on Flex for HDD
Adaptive PFC Power Supplies
Headless Computers
Radio Repeaters
Main boards for projectors
Power Supplies for projectors
Sub-assemblies for printers
RMA Services

8
Consumer Products
E-Books
Personal Media Player
USB Drives
DVD Players and Recorders
Recorder / One Touch Media Upload Converter
Home Speaker Systems
IPOD Docking Units
GPS for SLR Cameras and Golf
Electronic Ballasts
Electronics Fishing Devices
Digipass Security Tool
Display Signages
Electronically Controlled Chemical Dispensers
High Fidelity Sound Systems
TV Tuners for Tablets
RFID systems for petroleum distribution
Tap payment devices for gas stations
Label writers
Overhead Projector
Home Automation Controllers
Cellphone Security
Cellphone sub-assemblies
Electronic Keylocks
Gaming Assemblies
Smartplugs
Industrial Products
Agricultural Tags
Medical Products
Digital Thermometers
Personal Health Care Products
Telehealth devices
Plastic Products
Enclosures
Sub-assemblies for Printers, Copiers and Optical Drives
Concentrators for Solar Cells
High Voltage Connectors for X-Ray
Automotive Plastics - Air Intake manifold & Fuel Delivery Modules
Air Tight Wi-Fi Antenna Cover
Wiring Harness Protectors
Hayabusa
Information on export sales and the relative contribution of each segment (based on product
line) to total sales are fully disclosed in Note 29 to Audited Consolidated Financial
Statements.
Significant Customers
The top five customers collectively accounted for 68.64% and 74.87% of the Group’s sales
in 2016 and 2015, respectively. The Group anticipates that concentration of business in

9
major customers will continue in the foreseeable future, although the Group’s management
started new relationships with other customers.
One customer accounted for approximately 19.33% and 43.21% of net sales in 2016 and 2015,
respectively. Contracts with the customers are on a continuing basis and the Group has been in
business with them for many years.
Distribution Method
The bulk of the Group’s products are intermediate products which are shipped to the
customers’ manufacturing plants in Asia, USA and Europe for incorporation or further
assembly into the final finished products.
Competition, Status of New Products and Business Risk
The Group competes with other electronic manufacturers both domestic and foreign. The
market for PCBA and the other product lines of the Group are subject to normal price, service,
and quality competition. Among the Group’s top competition are from the following:
Flextronics
Jabil
Sanmina-SCI
Venture
IMI
EMS
Tsukiden While the traditional PC peripheral business has driven to build IEMS’ strength in the telecommunications, automotive, electronics and medical and consumer product lines, IEMS has shifted its resources and established more flexible and adaptable manufacturing platforms so it can readily shift production into various products and components on the same production floor. IEMS will continue its profitable growth path; it plans to grow more in global sales and marketing, to focus on telecommunication, automotive, medical and IoT (internet of things). There is no publicly-announced new product that will require material amount of the resources of the Group. The following are the major risks that the Group has: 1. Credit Risk
2. Liquidity Risk
3. Market Risk
Details of the above risks were fully discussed in Note 4 of the Audited Consolidated
Financial Statements.
The Group has a Risk Management Committee which conducts meetings on a quarterly basis
to discuss and analyze these major risks and decide on the measures on how to manage these
risks.
Sources and Availability of Raw Materials
The customers under a consignment arrangement supply the bulk of raw material components
needed in the manufacturing of their products. However, in response to global competition,
the Group started building up its raw materials inventory for turnkey transactions. Among the
principal suppliers of the Group are the following:
10
Relm Wireless Corp
Ceragon Networks
SJS Precision Corporation
Arrow Electronics Asia(S) Pte. Ltd
Panasonic Factory Solutions Asia
WPG South Asia PTE. Ltd.
Excelpoint Systems (Pte) Ltd.
Future Electronics Inc.
Air Liquide Pipeline Utilities Serv
The Group has entered into non-cancellable purchase commitments with its suppliers. Purchases of raw materials and supplies are based on ordinary purchase transactions covered by a purchase order.
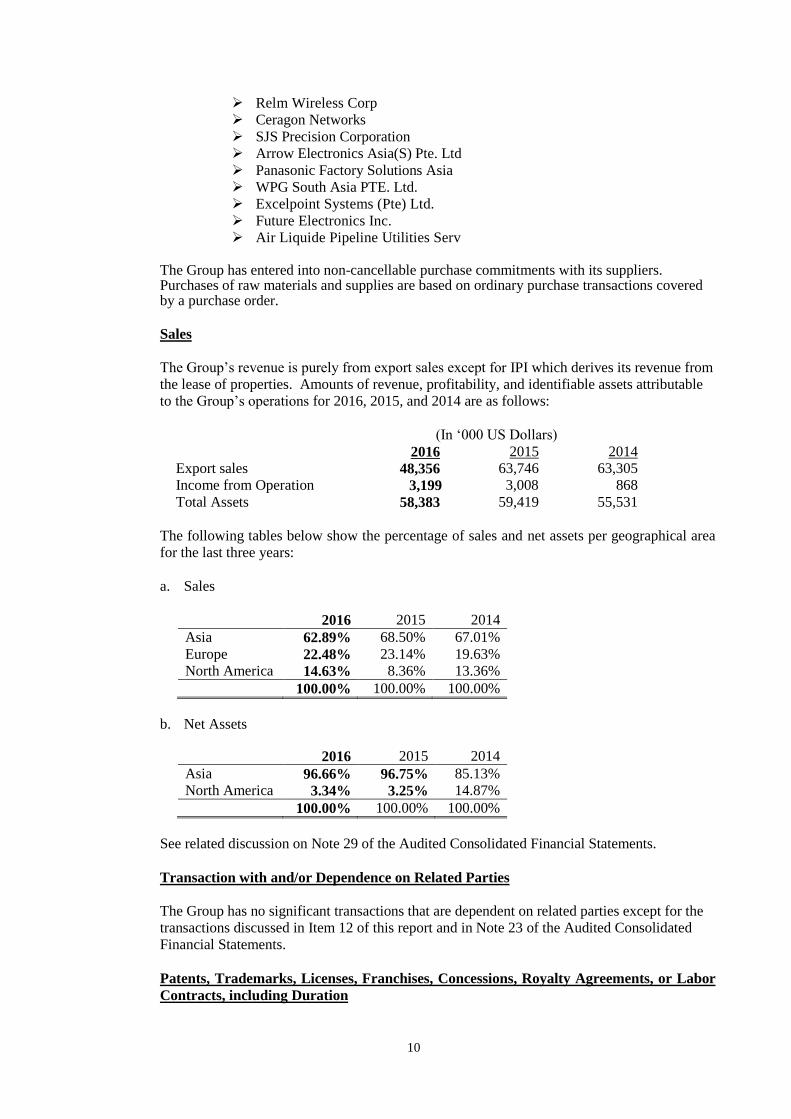
Sales
The Group’s revenue is purely from export sales except for IPI which derives its revenue from
the lease of properties. Amounts of revenue, profitability, and identifiable assets attributable
to the Group’s operations for 2016, 2015, and 2014 are as follows:
(In ‘000 US Dollars)
2016 2015 2014
Export sales 48,356 63,746 63,305 Income from Operation 3,199 3,008 868 Total Assets 58,383 59,419 55,531
The following tables below show the percentage of sales and net assets per geographical area
for the last three years:
a. Sales
2016 2015 2014
Asia 62.89% 68.50% 67.01%
Europe 22.48% 23.14% 19.63%
North America 14.63% 8.36% 13.36%
100.00% 100.00% 100.00%
b. Net Assets
2016 2015 2014
Asia 96.66% 96.75% 85.13%
North America 3.34% 3.25% 14.87%
100.00% 100.00% 100.00%
See related discussion on Note 29 of the Audited Consolidated Financial Statements.
Transaction with and/or Dependence on Related Parties
The Group has no significant transactions that are dependent on related parties except for the
transactions discussed in Item 12 of this report and in Note 23 of the Audited Consolidated
Financial Statements.
Patents, Trademarks, Licenses, Franchises, Concessions, Royalty Agreements, or Labor
Contracts, including Duration

11
Not applicable to the Group.
Need for Any Governmental Approval of Principal Products or Services
None
Effect of Existing or Probable Governmental Regulations on the Business
None
Estimate of Amount Spent for Research and Development Activities of the Last
Completed Fiscal Year
None
Cost and Effects of Compliance with Environmental Laws
IEMS’ plants are located in industrial parks with a centralized water treatment system.
Employees
As of December 31, 2016, the Group has a total of 1,515 employees consisting of seventy-
eight (78) managers, four hundred nine (409) administrative personnel and one thousand
twenty eight (1,028) factory workers.
Aside from basic salaries, employees receive vacation and sick leave credits, transportation
allowance, free medical and dental benefits, group insurance benefits and funeral assistance.
There is no existing collective bargaining agreement or labor union in the Group.
Debt Issues
Not applicable to the Group.
Investment Company Securities
Not applicable to the Group.
Item 2. Properties
As of December 31, 2016 the Group’s manufacturing, design and prototyping operations are
conducted in the following plants:
The EMS-2 Plant is located at the Light Industry and Science Park of the Philippines II (LISP
II) in Calamba City, Laguna and has an area of 1,375 square meters. The property is leased
from Iomni from January 16, 2017 to January 15, 2018.
The EMS-5 and EMS-6 Plants are located at the LISP I in Cabuyao City, Laguna and have an
aggregate area of 9,035square meters. The land and the building thereon are owned by the
Parent Company. The plants are leased to IEMS for a period of five (5) years from May 1,
2004 to April 30, 2009. Monthly rental is US$4.35 per square meter in the first year with an
annual escalation rate of 5%. The new lease agreement is subject to yearly renewal at the rate
of US$4.50 per square meter for EMS-5 and EMS-6.

12
The EMS-7 Plant is located at the LISP II also in Calamba City, Laguna and has an aggregate
area of 17,710 square meters. The land and building thereon are owned by IPI. The property
is leased to IEMS for a period of five (5) years from January 1, 2001 to December 31, 2005.
On June 1, 2005, IEMS terminated its lease agreement for Plant 7 and the facility was rented
out to another PEZA-registered company.
The plant of Iomni is also located in LISP II in Calamba City, Laguna. It has an aggregate total area of 10,893.15 square meters of covered factory building and paved open space. The land is leased from a non-related third party from January 16, 2016 to January 31, 2021. Ionics EMS (USA), Inc. is located at 5488 Marvell Lane, Santa Clara, California, USA.
Item 3. Legal Proceedings
As of December 31, 2016, there are no materials pending legal proceedings to which the
Parent Company or any of its subsidiaries is a party or of which any of their properties is a
subject.
Item 4. Submission of Matters to a Vote of Security Holders
There were no matters submitted to a vote of security holders for the fourth quarter of 2016.
PART II - OPERATIONAL AND FINANCIAL INFORMATION
Item 5. Market for Registrant’s Common Equity and Related Stockholder Matter
(Amounts in US Dollar) (Amounts in PhP)
HIGH LOW HIGH LOW
Latest price as of March 30, 2017 0.030 0.030 1.52 1.49
2016
First Quarter 0.064 0.061 2.93 2.82
Second Quarter 0.050 0.049 2.36 2.32
Third Quarter 0.045 0.045 2.20 2.16
Fourth Quarter 0.032 0.031 1.58 1.54
2015
First Quarter 0.014 0.014 0.63 0.62
Second Quarter 0.012 0.012 0.56 0.53
Third Quarter 0.084 0.068 3.94 3.18
Fourth Quarter 0.055 0.052 2.58 2.54
2014
First Quarter 0.009 0.009 0.42 0.42
Second Quarter 0.016 0.015 0.69 0.66
Third Quarter 0.014 0.014 0.65 0.62
Fourth Quarter 0.014 0.013 0.62 0.59
The Parent Company’s common stock is listed in the Philippine Stock Exchange.
The number of shareholders of record as of December 31, 2016 is 874 holding a total of
844,579,992 outstanding common shares.

13
The following were the top 20 stockholders based on the number of shares held and
percentage to total shares outstanding as of March 15, 2017:
Class of Securities
Name
No. of
Shares
%
Common Aqua Holdings, Inc. 335,153,100 39.13
Common PCD Nominee Corp.-Filipino 307,273,892 35.87
Common Leonardo Siguion Reyna * 75,006,000 8.76
Common PCD Nominee Corp.-Non Filipino 62,567,900 7.30
Common Lawrence C. Qua 27,454,760 3.21
Common Ionics Properties, Inc. 14,059,000 1.64
Common Raymond C. Qua 8,562,350 1.00
Common Meliton C. Qua 6,497,362 0.76
Common Cecilia Q. Chua 5,584,412 0.65
Common Ma.Asuncion Q. Cedilla 4,640,616 0.54
Common Pan Malayan Management & Investment 2,154,000 0.25
Common Virginia Judy Q. Dy 1,033,603 0.12
Common Benjamin S. Geli 470,000 0.05
Common Teh Min Yang 466,000 0.05
Common Telengtan Brothers & Sons Inc. 400,000 0.05
Common Abeto A.Uy 250,000 0.03
Common Que Liong Hee 100,000 0.01
Common Jose L. Cuisia Jr. 100,000 0.01
Common Romeo Villonco and/or Thelma V.
Mabanta 100,000 0.01
Common Arsenia C. Dy 99,000 0.01
*deceased
Dividends per Share
2016 None
2015 None
2014 None
Description of Any Restriction that Limits the Payment of Dividends on Common Shares
Dividends shall be declared at such time and in such percentage as the Board of Directors may
determine, but no dividends shall be declared or paid except from the surplus profits arising
from its business nor shall any dividends be declared that will impair the capital of the Parent
Company.
Recent Sales of Unregistered or Exempt Sales
There are no recent sales of unregistered or exempt securities, including any recent issuance of
securities constituting an exempt transaction.
Description of Registrant’s Securities The registrant has an authorized capital stock of 1,000,000,000 shares with par value of PhP1.00 per share. The issued and outstanding shares as of December 31, 2016 are 856,574,992.

14
No transfer of stock or interests which will reduce the ownership of Filipino citizens to less
than the required percentage of the capital stock as provided by existing laws shall be allowed
or permitted to be recorded in the books of the Parent Company.
Debt Securities
There are no issuances of debt securities.
Stock Options
There are no issuances of stock options.
Securities Subject to Redemption or Call
There are no issuances of securities subject to redemption or call.
Warrants
There are no issuances of warrants.
Market Information for Securities Other Than Common Equity
There is no material information relating to securities other than the Parent Company’s
common equity.
Other Securities
There are no issuances of other securities.
Item 6. Management Discussion and Analysis or Plan of Operation
Management Plan for the Year 2017
Ionics EMS, Inc. (IEMS)
IEMS maintains a positive outlook for 2017 for a continuing profitable trajectory. It aims to expand
its global sales and marketing, focusing still on the telecommunication, automotive, medical and the
IoT (internet of things) sectors.
IEMS will further invest in advanced and automated manufacturing equipment that will excel in
operational efficiency and generate high margins.
IEMS’ supply chain thrust is to partner synergistically with distributors and suppliers to tap mutual
business opportunities.
While IEMS is characterized by a very strong cash flow generated by its operations, it has an added
advantage of available resources which it can avail of from its Parent Company to support, if and
when the need arises.
Iomni Precision, Inc. (Iomni)
The high and rising logistical costs in recent years have triggered a continuing localization thrust by
multinational firms to produce their mechanical parts, i.e. plastic parts, in the country as it is "near
source" instead of importing from a distant supplier abroad and convenient to the final product
assembly facility.

15
While the automotive requirements constitute a significant segment in the sales of Iomni, said
company still targets to develop more products in the other sectors to maintain balance in its customer
portfolio.
To increase productivity, enhance efficiency and accommodate market expansion, Iomni looks at
upgrading some more of its injection equipment which it has already started.
Ionics Properties, Inc. (IPI)
The property market is robust and the revenue stream from IPI's property rentals is stable and
consistent. Further, existing property contracts of IPI were renewed by three to ten years.
As of filing date, the management of the Group is not aware of:
a) any significant expenditures for product research and development; b) any expected significant change in number of employees; c) any known trends, events or uncertainties that have or are reasonably likely to have a material
impact on the registrant’s short term or long term liquidity;
d) any event that will trigger direct or contingent financial obligation that is material to the Group,
including any default or acceleration of an obligation;
e) any material off-balance sheet transactions, arrangements, obligations (including contingent
obligations), and other relationships of the Group with unconsolidated entities or other persons
created during the reporting period;
f) any known trends, events or uncertainties that have or that are reasonably expected to have a
material impact on the net sales or revenues or income from continuing operations; and
g) any seasonal aspects that had a material effect on the financial condition or results of operations.
Sources of liquidity are expected from the Group’s internal cash flow from the results of operations
and from the Group’s external borrowings.
Below are the consolidated key financial ratios for the years ended December 31, 2016 and 2015.
December 31, 2016 December 31, 2015
Revenue (Decline) Growth (0.23%) 0.47% Gross Profit Margins 13.32% 9.63% Net Income Margins 5.59% 4.50% Return on Equity 6.69% 7.46% Current Ratio 3.04:1 2.50:1 Leverage Ratio (0.10:1) 0.07:1 Debt to Equity Ratio 0.37:1 0.49:1 Asset to Equity Ratio 1.37:1 1.49:1 Interest Coverage Ratio 25.62:1 81.51:1
1. Revenue Growth
The revenue growth is the Group’s increase in revenue for a given period. Revenue
growth is computed by deducting prior year revenue from current year revenue and
dividing it by revenue of the prior year. The result is expressed in percentage.

16
2. Gross Profit Margin
The gross profit margin reflects the management’s policies related to pricing and
production efficiency. This is computed by dividing gross profit by net sales. The result
is expressed in percentage.
3. Net Income Margins
Net income margin is the ratio of the Group’s net income after tax for a given period.
This is computed by dividing net income by net sales. The result is expressed in
percentage.
4. Return on Equity
The return on equity is the ratio of the Group’s net income to stockholders’ equity. This is
computed by dividing net income by total stockholders’ equity. The result is expressed in
percentage. This measures the management’s ability to generate returns on their
investments.
5. Current Ratio
The current ratio is the ratio of the Group’s current resources and its current obligations.
This is computed by dividing current assets by current liabilities. The result is expressed
in ratio.
6. Leverage Ratio Leverage ratio shows the balance that the Group’s management has struck between forces
of risk versus cost. This is computed by dividing net debt by the sum of total equity and
net debt.
7. Debt to Equity Ratio The debt to equity ratio indicates the relative proportion of equity and debt used to finance
the Group’s assets. This is computed by dividing total liabilities by equity.
8. Asset to Equity Ratio Asset to equity ratio shows the relationship of the total assets of the Group to the portion
owned by shareholders. This is computed by dividing total assets by equity.
9. Interest Coverage Ratio Interest coverage ratio is the ratio of the Group’s ability to meet its interest payments. This
is computed by dividing the sum of income before income taxes and finance costs by the
finance costs.
As of filing date, the management of the Group is not aware of:
a) any known trends, demands, commitments, events or uncertainties that will have a
material impact on the issuer’s liquidity;
b) any events that will trigger direct or contingent financial obligation that is material to the
Group, including any default or acceleration of an obligation;
c) all material off-balance sheet transactions, arrangements, obligations (including contingent
obligations), and other relationships of the Group with unconsolidated entities or other
persons created during the reporting period;
d) any material commitments for capital expenditures, the general purpose of such
commitments and the expected sources of funds for such expenditures;
e) any known trends, events or uncertainties that have had or that are reasonably expected to
have a material favorable or unfavorable impact on net sales/ revenues/ income from
continuing operations;

17
f) any significant elements of income or loss that did not arise from the issuer’s continuing
operations; and g) any seasonal aspects that had a material effect on the financial condition or results of
operations.
The causes for any material change from period to period which shall include vertical and horizontal analysis of any material item were disclosed in pages 18 to 24 of this report.
Financial Performance 2016 CONSOLIDATED RESULTS OF OPERATIONS 2016 is another challenging year for the Group. On the topline, revenue from telecommunication and
automotive products significantly dropped but the increasing consignment business has mitigated the
impact of the dropped in turnkey sales to the bottom line.
Consolidated sales dropped by 24% from US$63.746 million in 2015 to US$48.356 million this year.
Despite the 24% decreased in sales, consolidated net income slightly dropped from US$2.925 million in
2015 to US$2.802 million in 2016.
The Group’s rental income increased by US$0.171 million or 7.15% from US$2.395 million in 2015 to
US$2.567 million in 2016 due to rental rate on additional space in one of the existing facility. The
Group reported a gross income of US$6.394 million in 2016 from US$6.373 million in 2015.
Operating expenses increased from US$3.024 million in 2015 to US$3.749 million in 2016. Management prudence call to provided impairment of Goodwill in a subsidiary amounting to US$0.217 million and receivable from a customer amounting to US$0.160 million in 2016. Further, fixed selling expenses has increased to reinforce the sales team of the operating subsidiary. The summarized revenues and net income (losses) of the Group for the year ended December 31, 2016 are as follows:
(In US Dollars)
COMPANY
REVENUE
NET INCOME (LOSS)
Parent Company 477,567 (4,177,158)*
IEMS 45,869,403 1,446,239
IPI 2,527,023 1,943,684
ICL 226,098 162,449
Iomni 2,802,893 (356,582)
Synertronix 5 (983)
TOTAL 51,902,989 (982,351)
Reclass/Eliminating entries (600,062) 1,819,317*
Consolidated 51,302,927 2,801,668 *Including Parent Company take up of impairment loss on investment and advances to Iomni and Synertronix
which was eliminated in the consolidation.

18
CONSOLIDATED FINANCIAL POSITION As of December 31, 2016, the consolidated assets of the Group amounted to US$58.383 million which
is US$1.036 million lower than the December 31, 2015 figure of US$59.419 million. The decrease in
the Group’s total assets was due to decrease in receivables and inventories due to lower sales.
Current ratio improved to 304% in 2016 from 250% in 2015 while debt to equity ratio improved from
49% in 2015 to 37% in 2016. For the year ended December 31, 2016, the Group has continuously
improved its cash position from the cash flows generated from operations.
At the end of December 31, 2016, the Group’s long-term debt has increased to US$1.057 million from
US$1.024 million in 2015 due to acquisition of machinery and equipment thru equipment loan from a
foreign financial institution. INDIVIDUAL RESULT OF OPERATIONS The individual performance of the subsidiaries for the year ended December 31, 2016 is as follows: Ionics EMS (IEMS)
IEMS turnover decreased by US$15.115 million or 24.85% from US$60.835 million in 2015 to
US$45.720 million in 2016. Consistent with its move in 2015 to expand its consignment business and
prudently manage overhead and indirect cost, and despite the 25% dropped in sales, gross profit
increased by US$0.048 million from US$4.340 million in 2015 to US$4.388 million in the same
period of 2016.
Other income decreased from US$0.23 million in 2015 to US$0.10 million in 2016 due to lower
foreign exchange gain.
Operating expenses increased from US$2.58 million in 2015 to US$2.70 million in 2016 due to
impairment of receivables and increase in fixed selling expense to reinforce its sales team.
With the foregoing, IEMS reported a net income of US$1.45 million in 2016 from a net income of
US$1.65 million in 2015.
Ionics Properties, Inc. (IPI) IPI, the subsidiary engaged in real estate holdings remained profitable with increase net income of US$ 1.944 million in 2016 from US$1.870 million in 2015, due to additional lease contract with the existing Lessee. Ionics Circuits, Limited (ICL) ICL, the offshore investment subsidiary reported a net income of US$0.162 million in 2016 from a net loss of US$0.152 million in 2015, due to equity take up in the net income of investment in an associate. Synertronix, Inc. (SI) SI reported a net loss for the year ended December 31, 2016 of US$$0.001 million from US$0.009 million in 2015. Iomni Precision, Inc. (Iomni) Iomni, the plastic injection molding unit, has experience a decrease in sales from US$2.964 million in
2015 to US$2.657 million in 2016. Iomni, reported a net loss of US$0.149 million in 2015 to

19
US$0.357 million in 2016. 2015 CONSOLIDATED RESULTS OF OPERATIONS The Group registered a turnover of US$63.746 million, slightly higher than the previous year's $63.305
million. It generated an income of $2.925 million from an income of $1.049 million in 2014. Increase in
income was due to higher demand from customers under consignment agreement.
The Group’s rental income decreased by US$0.132 million or 5.21% from US$2.527 million in 2014 to
US$2.395 million in 2015 due to rental rate reduction of a renewed long term lease contract with a third
party. The Group reported a gross income of US$6.373 million in 2015 from US$5.143 million in
2014.
With the foregoing, operating expenses slightly decreased from US$3.913 million in 2014 to US$3.024 million in 2015, due to the cost minimization of the Group. The summarized revenues and net income (losses) of the Group for the year ended December 31, 2015 are as follows:
(In US Dollars)
COMPANY
REVENUE
NET INCOME (LOSS)
Parent Company 1,484,453 865,218
IEMS 61,072,895 1,650,689
IPI 2,357,457 1,870,088
ICL 32,388 (152,124)
Iomni 3,101,592 (148,902)
Synertronix - (9,196)
TOTAL 68,048,785 4,075,774
Reclass/Eliminating entries (1,627,649) (1,150,690)
Consolidated 66,421,136 2,925,084 CONSOLIDATED FINANCIAL POSITION As of December 31, 2015, the consolidated assets of the Group amounted to US$59.419 million which
is US$3.889 million higher than the December 31, 2014 figure of US$55.531 million. The increase in
the Group’s total assets was due to increase in Property, Plant and Equipment and Cash and Cash
equivalents funded by net cash flows from operations and bank loans.
Current ratio improved to 252% in 2015 from 249% in 2014 while debt to equity ratio remained at
49%. For the year ended December 31, 2015, the Group has continuously improved its cash position
from the cash flows generated from operations.
At the end of December 31, 2015, the Group’s long-term debt has increased to US$1.017 million from
US$0.136 million in 2014 due to acquisition of machinery and equipment. INDIVIDUAL RESULT OF OPERATIONS The individual performance of the subsidiaries for the year ended December 31, 2015 is as follows: Ionics EMS (IEMS)

20
IEMS and its subsidiary reported a slight increase in sales of US$60.835 million in 2015 from
US$60.173 million in 2014. The increase in sales is due to increase in its consignment business.
With the continuing increase in consignment business, gross profit increased by US$1.102 million
from US$3.238 million in 2014 to US$4.340 million in the same period of 2015.
Operating expenses increased from US$2.493 million in 2014 to US$2.584 million in 2015 due to
higher sales subject to commission.
With the foregoing, IEMS report a net income of US$1.651 million in 2015 from a net income of
US$0.638 million in 2014.
Ionics Properties, Inc. (IPI) IPI, the subsidiary engaged in real estate holdings remained profitable with a reduced net income of US$ 1.870 million in 2015 from US$2.002 million in 2014, due to rental rate reduction of a renewed long term lease contract with a third party. Ionics Circuits, Limited (ICL) ICL, the offshore investment subsidiary has further reduced its losses from US$0.814 million in 2014 to US$0.152 million in 2015 despite an equity take up in the net loss of investment in an associate amounting US$0.400 million. Synertronix, Inc. (SI) SI reported a net loss for the year ended December 31, 2015 of US$$0.009 million from US$0.137 million in 2014. Iomni Precision, Inc. (Iomni)
Iomni, the plastic injection molding unit, has experience a decrease in sales from US$3.242 million in
2014 to US$2.964 million in 2015. Despite the decrease in sales, due to continuing process
improvement and strong cost controls, it has reported an improved performance from a net loss of
US$0.403 million to US$0.149 million.
Operating expenses decreased to US$0.213 million in 2015 from US$0.219 million in 2014.
2014 CONSOLIDATED RESULTS OF OPERATIONS The Group registered a turnover of US$63.305 million. Though slightly lower than the previous year's
$64.356 million, it generated an income of $1.049 million from a loss of $2.740 million in 2013. A key
element was the gainful reversal of the major manufacturing subsidiary.
The Group’s rental income increased by US$0.472 million or 22.97% from US$2.055 million in 2013
to US$2.527 million in 2014 due to a new third party lease contracts which started in Q4 2013. The
Group reported a gross income of US$5.143 million in 2014 from US$1.987 million in 2013.
With the foregoing, operating expenses decreased from US$4.935 million in 2013 to US$3.913 million in 2014, due to a drop in sales, which is subject to commission and lower amount of impairment loss compared in 2013.

21
The summarized revenues and net income (losses) of the Group for the year ended December 31, 2014 are presented as follows:
(In US Dollars)
COMPANY
REVENUE
NET INCOME
(LOSS)
Parent Company 2,422,170 1,856,230
IEMS 60,309,166 653,206
IPI 2,458,577 1,967,062
ICL (102,716) (814,277)
Iomni 3,410,708 (403,305)
Synertronix 186,107 (137,073)
TOTAL 68,684,012 3,121,844
Reclass/Eliminating entries (2,652,369) (2,087,193)
Consolidated 66,031,643 1,034,651 CONSOLIDATED FINANCIAL POSITION As of December 31, 2014, the consolidated assets of the Group amounted to US$55.549 million which
is US$1.585 million lower than the US$57.135 million as of December 31, 2013. The decrease in the
Group’s total assets was mainly due to decrease in inventories.
Current ratio improved to 249% in 2014 from 221% in 2013. Likewise, Debt to equity ratio improved
to 49% in 2014 from 57% in 2013. For the year ended December 31, 2014, the Group has continuously
improved its cash position from the cash flows generated from operations.
At the end of December 31, 2014, the Group’s long-term debt has decreased to US$0.136 million from
US$0.371 million in 2013. INDIVIDUAL RESULT OF OPERATIONS The individual performance of the subsidiaries for the year ended December 31, 2014 is as follows: Ionics EMS (IEMS)
IEMS and its subsidiary’s reported sales of US$60.173 million in 2014 from US$61.436 million in
2013.
The full year cost benefits of IEMS plants consolidation and production line realignment implemented
during the second half of 2013, and the higher mix of consignment business in 2014 have contributed
to the significant improvement of IEMS’s gross margin to US$3.238 million in 2014 from 0.420
million in 2013.
Operating expenses decreased from US$2.655 million in 2013 to US$2.493 million in 2014 due to
lower sales that are subject to commission.
With the foregoing, IEMS reported a net income of US$0.638 million in 2014 from a net loss of
US$1.993 million in 2013.
Ionics Properties, Inc. (IPI) IPI, the subsidiary engaged in real estate holdings, increased its net income to $2.002 million in 2014 from $1.625 million in 2013 due to new third party lease contracts. Property rentals have been a
22
consistent earner for the Group and the existing contracts were renewed by five to ten years. Ionics Circuits, Limited (ICL) ICL, the investment subsidiary, reported a net loss of US$0.814 million in 2014 as compared to a net loss of US$1.779 million in 2013. In 2014, management provided for the impairment loss on its direct and indirect investment in Pacific Synergies IV and Astute Networks, Inc., amounting to US$0.204 and US$0.500 million, respectively. In 2013, similar impairment provisions were provided as a prudent move to cover the investments in Alphion and Pacific Synergy. Synertronix, Inc. (SI) SI reported a net loss for the year ended December 31, 2014 amounted to US$$0.137 million from US$0.101 million in 2013. Iomni Precision, Inc. (Iomni) Iomni’s turnover in 2014 increased by US$0.116 million or 4% from US$3.127 in 2013 to US$3.242
million in 2014. Iomni, however, reported a gross loss of US$0.179 million in 2014 from a gross loss
of US$0.183 million in 2013.
Operating expenses decreased to US$0.219 million in 2014 from US$0.235 million in 2013.With the
foregoing, Iomni reported a net loss of US$0.403 million in 2014 and US$0.419 million in 2013.
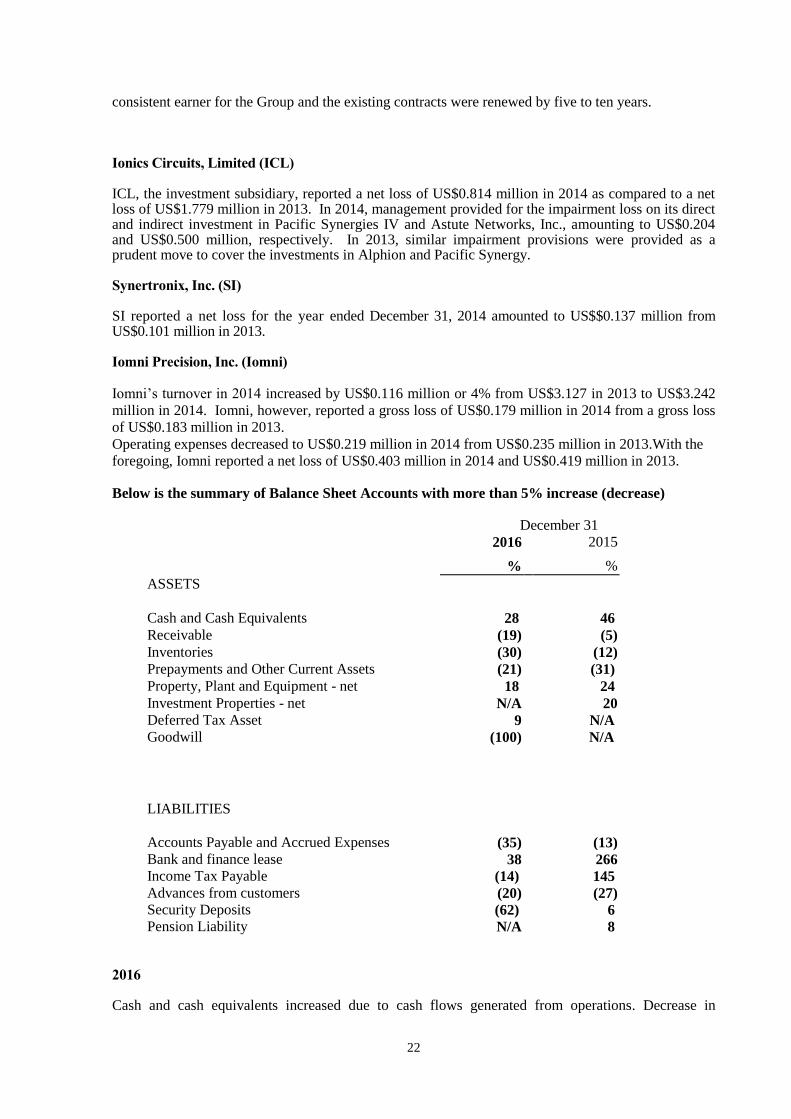
Below is the summary of Balance Sheet Accounts with more than 5% increase (decrease)
December 31
2016 2015
% %
ASSETS
Cash and Cash Equivalents 28 46
Receivable (19) (5)
Inventories (30) (12) Prepayments and Other Current Assets (21) (31)
Property, Plant and Equipment - net 18 24
Investment Properties - net N/A 20
Deferred Tax Asset
Goodwill
9
(100)
N/A
N/A
LIABILITIES
Accounts Payable and Accrued Expenses (35) (13)
Bank and finance lease 38 266
Income Tax Payable (14) 145
Advances from customers (20) (27)
Security Deposits (62) 6
Pension Liability N/A 8
2016 Cash and cash equivalents increased due to cash flows generated from operations. Decrease in

23
receivables was due to significant collections from customers and lower customer demands. The decreased in inventories was attributable to the decline in the forecasted sales of turnkey accounts which results to lower inventory purchases. Decrease in Prepayments and other current assets was due to decrease in advances to suppliers which are also related to decline in turnkey projects. Property, plant and equipment increased due to additional acquisition of machineries and equipment. Deferred tax asset increase due to tax adjustments. Goodwill decreased due to the impairment loss recognized during the year. Accounts payable and accrued expenses decreased due to controlled purchases in response to lower turnkey projects. Bank and finance lease increased due to availment of equipment loan during the year. Advances from customers decreased due to lower sales volume for the year. The decrease in security deposits was due to reclassification to unearned rent income account. 2015 Cash and cash equivalents increased due to cash flows generated from operations. The decrease in receivables was due to improved collection performance. The decrease in inventories was due to decrease in raw materials as a result of decrease in turnkey sales and controlled material purchases. Prepayments and other current assets decreased due to lower advances to suppliers for its raw materials. Property, plant and equipment increased due to additional acquisition of machineries and equipment and purchased of Land. Accounts payable and accrued expenses decreased due to controlled purchases to minimize exposure on inventory purchases. Bank and finance lease increased due to availment of equipment loan during the year. Income tax payable increased due to additional tax provision. Advances from customers increased due to implementation of risk management measures on aging inventories. The increase in security deposits was due to three months rental deposit from a new contract of lease signed by a third party and IPI. Pension Liability increased due to additional accrual for the year. 2014 Cash and cash equivalents increased due to cash flows generated from operations. Increased in
receivables was due to sales to a new customer. The decrease in inventories was due to controlled
material purchases to reduce exposures with some turnkey customers. Prepayments and other current
assets increased due to advance payment made to suppliers. Investments available for sales decreased
due to impairment of investment in Pacific Synergies IV, Astute Networks, Inc., Eagle Ridge Golf and
Country Club. Property, plant and equipment increased due to additional acquisition of machineries
and equipment for production use. Investment properties decreased due to sale of Synertronix’s land
and building. Accounts payable and accrued expenses decreased due to lower purchases for
inventories as a result of low customer demand and production requirements. Bank loans decreased
due to payment made during the period. Income tax payable increased due to additional tax provision
and reversal of deferred tax assets. Advances from customers decreased due to offsetting of the
advances against the receivables. The decrease in security deposits was due to reclassification of
Advance rental to Unearned rent income. Pension Liability increased due to additional accrual for the
year.
Item 7. Financial Statements
The Group’s consolidated financial statements and schedules listed in the accompanying Index to
Financial Statements and Supplementary Schedules (page 68) are filed as part of this Form 17-A
1. General Notes to Financial Statements:
See Audited Consolidated Financial Statements.
Assets subject to lien and restriction on sales of assets:
Not applicable to the Group.
Restriction which limits the availability of Retained Earnings for dividend declaration:

24
See related discussion on Note 2 of the Audited Consolidated Financial Statements.
Commitments and Contingent Liabilities:
See related discussion on Leases under Note 24 of the Audited Consolidated Financial Statements.
Material Related Party Transactions which affect the Financial Statements:
The Parent Company has no significant related party transactions with its subsidiaries, affiliates
and stockholders that affect the Financial Statements except for the matters discussed in Note 23
to the Audited Consolidated Financial Statements.
Bonus, Profit Sharing and Other Similar Plans:
The Group has an employee car plan and profit sharing for its BOD and Management.
Interest Cost:
IEMS paid interest on bank loans and financial institution.
2. Subsidiaries
As of December 31, 2016, the details of investments and advances to subsidiaries are as follows:
Subsidiaries % owned Investment Advances
IPI 100 US$1,535,578 US$700,000
ICL 100 2,579,265 95,567
Iomni 100 1,886,156 200,000
IEMS 97 36,969,459 10,563,655
3. Cash and Cash Equivalents
Out of the total cash and cash equivalents of US$13,143,948 as of December 31 2016,
US$890,585 is peso-denominated. This represents savings deposit and current accounts in local
banks.
4. Accounts Receivable - Others
Receivable from customers other than sales US$1,616,877
Rent receivable 199,266
Advances to officers and employees 106,299
Claims against SSS and other government agencies 14,116
Others 583,000
5. Inventories
Inventories decreased due to well-enforced management actions to improve the inventory
movement with the current business level.
6. Property, Plant and Equipment
As of December 31, 2016, the Group has no equipment that is still under installation as discussed
in Note 12 to the Audited Consolidated Financial Statements.

25
7. General and Administrative Expenses - Please see schedule in page 46.

26
Item 8. Changes in and Disagreements with Accountants on Accounting and Financial
Disclosure
1. External Audit Fees and Services
(a) Audit and Audit - Related Fees
The Auditing firm of Sycip Gorres Velayo & Co. (SGV) has been the external
auditor of the Company since 1992. The Auditing partner in charge of the
accounts of the Company for the financial year ended December 31, 2016 is Ms.
Dhonabee B. Señeres who took office after her appointment at the May 20, 2016
stockholders’ meeting of the Company. Audit fee for Ionics, Inc. in 2016 is forty
eight thousand six hundred twenty three dollars (US$48,623) and forty seven
thousand four hundred sixty five dollars (US$47,465) in 2015.The fees are
generally based on the complexity of the issues involved, the work to be
performed, the special skills required to complete the work, the experience level
of the team members and most importantly the ability to provide the auditors’
report expressing an opinion on the financial statements of the Company.
(b) There are no assurance and related services by the external auditor that are
reasonably related to the performance of the audit or review of the Company’s
financial statements.
(c) All Other Fees
(d) Any additional services that the Company may request will be the subject of a
separate written arrangement.
(e) The Audit Committee’s approval policies and procedures for the above services
The Audit Committee heard the reports of the External Auditor and validated the
financial reports prepared by Management.
2. Changes in and Disagreements with Accountants on Accounting and Financial
Disclosure
There are no changes in, and no disagreements with, the registrant’s accountants on
any accounting and financial disclosure during the two most recent fiscal years or any
subsequent interim period.
27
PART III - CONTROL AND COMPENSATION INFORMATION
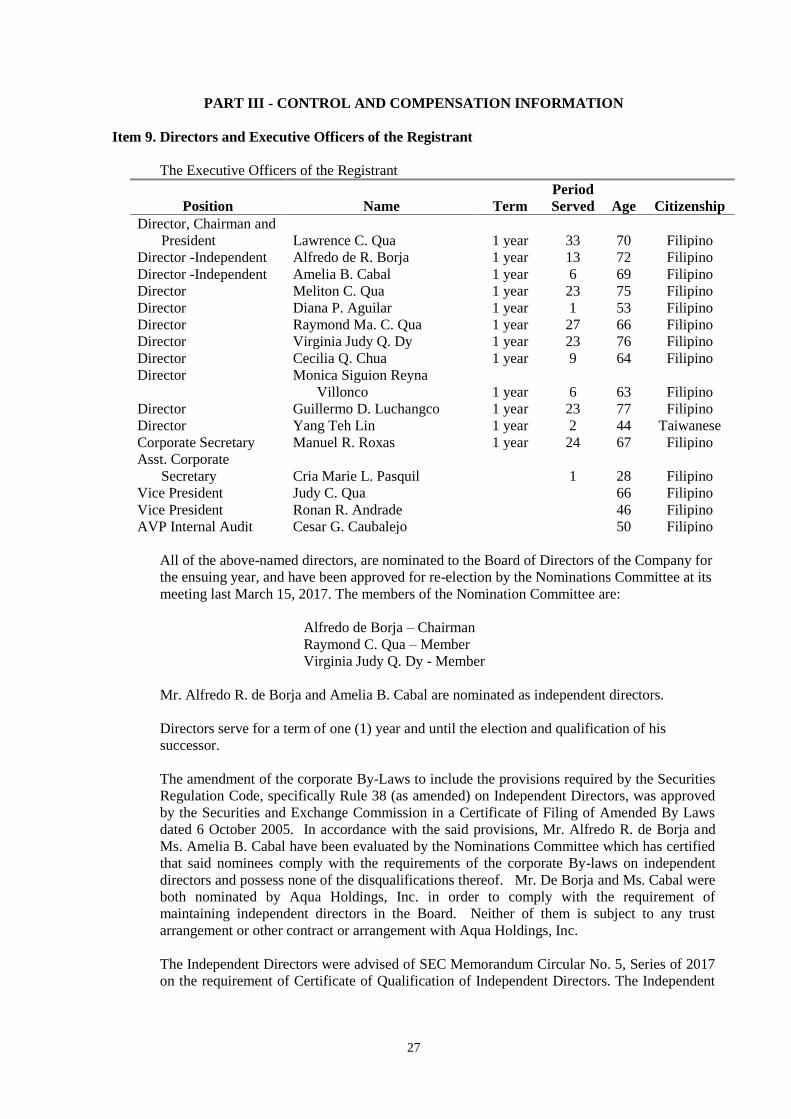
Item 9. Directors and Executive Officers of the Registrant
The Executive Officers of the Registrant
Position
Name
Term
Period
Served
Age
Citizenship
Director, Chairman and
President
Lawrence C. Qua
1 year
33
70
Filipino
Director -Independent Alfredo de R. Borja 1 year 13 72 Filipino
Director -Independent Amelia B. Cabal 1 year 6 69 Filipino
Director Meliton C. Qua 1 year 23 75 Filipino
Director Diana P. Aguilar 1 year 1 53 Filipino
Director Raymond Ma. C. Qua 1 year 27 66 Filipino
Director Virginia Judy Q. Dy 1 year 23 76 Filipino
Director Cecilia Q. Chua 1 year 9 64 Filipino
Director Monica Siguion Reyna
Villonco
1 year 6 63 Filipino
Director Guillermo D. Luchangco 1 year 23 77 Filipino
Director Yang Teh Lin 1 year 2 44 Taiwanese
Corporate Secretary Manuel R. Roxas 1 year 24 67 Filipino
Asst. Corporate
Secretary
Cria Marie L. Pasquil
1 28 Filipino
Vice President Judy C. Qua 66 Filipino
Vice President Ronan R. Andrade 46 Filipino
AVP Internal Audit Cesar G. Caubalejo 50 Filipino
All of the above-named directors, are nominated to the Board of Directors of the Company for
the ensuing year, and have been approved for re-election by the Nominations Committee at its
meeting last March 15, 2017. The members of the Nomination Committee are:
Alfredo de Borja – Chairman
Raymond C. Qua – Member
Virginia Judy Q. Dy - Member
Mr. Alfredo R. de Borja and Amelia B. Cabal are nominated as independent directors.
Directors serve for a term of one (1) year and until the election and qualification of his
successor.
The amendment of the corporate By-Laws to include the provisions required by the Securities
Regulation Code, specifically Rule 38 (as amended) on Independent Directors, was approved
by the Securities and Exchange Commission in a Certificate of Filing of Amended By Laws
dated 6 October 2005. In accordance with the said provisions, Mr. Alfredo R. de Borja and
Ms. Amelia B. Cabal have been evaluated by the Nominations Committee which has certified
that said nominees comply with the requirements of the corporate By-laws on independent
directors and possess none of the disqualifications thereof. Mr. De Borja and Ms. Cabal were
both nominated by Aqua Holdings, Inc. in order to comply with the requirement of
maintaining independent directors in the Board. Neither of them is subject to any trust
arrangement or other contract or arrangement with Aqua Holdings, Inc.
The Independent Directors were advised of SEC Memorandum Circular No. 5, Series of 2017
on the requirement of Certificate of Qualification of Independent Directors. The Independent

28
Directors were likewise advised of SEC Memorandum Circular No. 15, Series of 2017 on the
term limits for Independent Directors.
Lawrence C. Qua, 70, is the founding Chairman and Chief Executive Officer (CEO) of Ionics
EMS, Inc., the Chairman, President & CEO of the Philippines’ leading electronics
manufacturing services group, Ionics, Inc., and its executive director since 1985. He is also
the Chairman and CEO of Iomni Precision, Inc. and the Chairman and Director of Aqua
Holdings, Inc. He is, further, a director and member of the investment committee of ICCP
Venture Partners, Inc. and a director of various companies engaged in retailing and property
development. He has been a trustee of the Semiconductor & Electronics Industry of the
Philippines Inc. since its organization. He served as a board trustee of the Graduate Business
School of De La Salle University for three years. Mr. Qua graduated from De La Salle
University with a Bachelor of Science degree in Mechanical Engineering.
Alfredo De Borja, 72, has been an independent director of Ionics, Inc. since 2004 and an
independent director of Ionics EMS, Inc. since 2007. He is the incumbent President and
Director of Makiling Ventures, Inc., a real estate development company, and President and
Director of E. Murio, Inc., a furniture manufacturer and exporter. He is also a director of
Investment Capital Corp. of the Phil. (ICCP), ICCP Venture Partners, Inc. (where he is
Chairman of the Investment Com), ICCP Management Corp, Pueblo de Oro Development
Corp., Regatta Properties, Inc., Science Park of the Phil (SPPI), Cebu Light Industrial Park,
Inc., Ionics, Inc., Ionics EMS, Inc., and Araneta Properties, Inc., both listed companies with
the Philippine Stock Exchange; and Philippine Coastal Storage & Pipeline Corp. He has also
served as board Director of a number of companies including First Metro Investment Corp.,
SPI, Alsons Power, Alsons Cement, Iligan Cement, Manila Memorial Park, Philcom,
Shopwise, and Republic Glass. He was the President of Gervel, Inc. from 1973 to 1986;
Director and Chairman of the Executive Committee of First Metro Investment Co. from 1978
to 1983; Director and Vice President of Iligan Cement Corp. from 1973 to 1977; Professional
Lecturer of the University of the Philippines-Graduate School of Business Administration
from 1971 to 1974; Executive Assistant to the Vice President of Philippine Long
Distance Telephone Co. from 1970 to 1973; and Executive Assistant to the Vice President of
Investment Manager, Inc. from 1966 to 1968. He holds a Master of Business Administration
degree from Harvard University and a Bachelor of Science in Economics from the Ateneo de
Manila University.
Amelia B. Cabal, 69, is an independent director of Ionics, Inc. and Ionics EMS, Inc. She is
likewise an independent director of Deutsche Regis Partners, Inc. Ms. Cabal served as a
member of the External Audit Committee of the International Monetary Fund, and of the
board of directors of Metropolitan Bank and Trust Company from 2009 to 2011. She was
previously a part of SGV as Vice Chairman and Head of Financial Markets Practice up to
2006 and as a Senior Adviser on Regulatory Matters and Financial Markets from 2006 to
2009. Presently, Ms. Cabal is the Chairman of the External Audit Committee of the
International Monetary Fund; a member of the board of directors of Philippine Savings Bank;
and the Bank Supervisor for Metrobank China (Ltd.)
Meliton C. Qua, 75, held key positions in several companies which included the Philippine
Bank of Communications as Senior Vice President; Citibank N.A., as Vice President; Bancnet
as Director and Aqua Holdings, Inc. as Director. Mr. Qua has been a director of Ionics, Inc.
since 1985. He received his Bachelor of Science degree in Business Administration from De
La Salle University, Philippines.
Diana P. Aguilar, 53, Filipino, was appointed as Commissioner of the state-owned Social
Security System in August 2010 and was reappointed in the current administration on
November 2016. She is one the nine members of the Social Security Commission and the

29
Chairperson of the Information Technology Committee; member of Investment Oversight,
Risk Management and Coverage and Collection Committees. She was appointed as Senior
Advisor to the Board of Security Bank Corporation on July 26, 2016 and has been a
Chairperson of SB Capital Investment Corporation since August 2016. On January 2017, she
was elected as one of the members of the Board of Governors of the Employers Confederation
of the Phils. She has served as a Director or Officer to a number of other corporations,
including Phil. Seven Corporation, Capital Markets Development Board, Electronic
Commerce Payment Networks, Inc., De la Salle Santiago Zobel School and Wenphil
Corporation. Ms. Pardo Aguilar holds a Masters degree in Business Administration major in
International Business and Finance from Pepperdine University, California (1988) and a
Bachelor of Science in Computer Studies from De La Salle University (1985).
Raymond Ma. C. Qua, 66, has been a member of the Board of Directors of Ionics, Inc. since
1985 and holds the position of Treasurer and Senior Vice President. He is also a director of
Ionics EMS, Inc. Previously he was the Senior Vice President and General Manager of
Synertronix, Inc. and the Vice President for Administration of Ionics, Inc. Mr. Qua is
presently affiliated with various organizations and 14 associations serving as head, ranking
officer or member. Mr. Qua received his Bachelor of Science degree in Commerce from De
La Salle University, Philippines.
Virginia Judy Q. Dy, 76, has been a member of the Board of Directors of Ionics, Inc. since
1991. In the last seven years, she is connected with Aqua Holdings, Inc. as director. She is
also the Finance Director of DVPRO Solutions, Inc. from 2001 to the present. Previous
corporate affiliations include Philippine Commercial and International Bank as Branch
Manager, Insular Bank of Asia & America as Branch Manager, Ladtek Corporation/Interphase
Development System as Accounting Manager and the International Corporate Bank as Branch
Manager. Ms. Dy received her Bachelor of Science in Commerce degree from the
Assumption Convent and is a Certified Public Accountant, having passed the government
board exams in 1963.
Cecilia Q. Chua, 64, was a director of Ionics, Inc. from 1997 to 2000 and from 2007 up to the
present. She is the Treasurer of B-Pack Corporation, Vice President of CQ B-Pack
Corporation and has been the Purchasing Manager of Ionics Circuits, Inc. since 1985.
Previous corporate affiliations include Complex Electronics Corporation, Interphase
Development Corporation, Ladtek Corporation and Pimeco.
Monica Siguion-Reyna Villonco, 63, is the Chairman of Lowe Philippines, where she has
served as a director since 2002. She also served as the editor-in-chief of Town & Country
Philippines from 2007-2010. Ms. Villonco is the incumbent President of Whitespace, Inc. and
Datascope Communications (Phils.), Inc. Ms. Villonco is a member of the Board of Governors
of the Philippine National Red Cross. She is also a member of the board of directors of
Provident Plans International Corp. and Sa Aklat Sisikat Foundation; She was a member of
the Film Rating Board from 1998 to 2002; and a board member of CCP Tanghalang Pilipino
from 1988-1990.
Guillermo D. Luchangco, 77, has been a member of the Board of Directors of Ionics, Inc.
since 1991. He is the Chairman and Chief Executive Officer of the ICCP Group, whose
members include, among others, Investment & Capital Corporation of the Philippines, whose
principal activities are in investment banking; ICCP Venture Partners Inc., which is in venture
capital; Science Park of the Philippines, Inc., a developer of industrial parks; and Pueblo de
Oro Development Corporation, a developer of residential and township projects; and Manila
Exposition Complex, Inc., the owner of the World Trade Center Metro Manila. Before
founding ICCP in 1988, he served as Vice Chairman and President of Republic Glass
Corporation, a publicly-listed company. Between 1969 and 1980, Mr. Luchangco worked

30
with the SGV, the Philippines’ leading auditing and consulting firm. He rose to the position of
Managing Director and Regional Coordinator for management services. Mr. Luchangco serves
on a number of Boards, including the following publicly-listed companies in the Philippine
Stock Exchange: Phinma Corporation, Globe Telecom, Inc., Ionics, Inc, and Roxas & Co.,
Inc. He holds a Master of Business Administration degree from the Harvard Business School
and a Bachelor of Science degree in Chemical Engineering (magna cum laude) from De La
Salle University, Philippines.
Yang Teh Lin, 44, Taiwanese, was a director of Ionics, Inc. from 2001 to 2003. She earned
Bachelor of Arts in Communication from Santa Clara University in Santa Clara, California.
Ms. Yang currently owns TLY Designs, a Hong Kong company which engages in jewelry
making lectures and events. Her previous corporate affiliations include Ionics EMS, Inc. and
Diversified Financial Network.
Manuel R. Roxas, 67, Filipino, has been the Company’s Corporate Secretary for the past
seventeen (17) years. His professional experience covers general corporate law practice as
counsel to various companies engaged in banking, investments, pharmaceuticals, shipping,
and manufacturing. Atty. Roxas received his Bachelor of Science degree in Economics from
the University of Pennsylvania in 1970 and Bachelor of Laws degree from the University of
the Philippines in 1975. His other professional affiliations include: Roxas de los Reyes Laurel
Rosario & Leagogo as Partner, Tax Management Association of the Philippines as past
President, President Manuel A. Roxas Foundation, Inc., Mother Rosa Memorial Foundation,
Inc. as Secretary, the Integrated Bar of the Philippines, Philippine Bar Association, and the
Wharton Club of the Philippines as member.
Cria Marie L. Pasquil, 28, Filipino, is the Company’s Assistant Corporate Secretary. Ms.
Pasquil is an associate lawyer in Roxas de los Reyes Laurel Rosario & Leagogo Law Offices.
Her professional experience covers general corporate practice as counsel to various companies
engaged in the retail, manufacturing, and trading sector. She received her Bachelor of Arts
degree in Interdisciplinary Studies in the Ateneo de Manila University in 2009, and her Juris
Doctor degree from the Ateneo Law School in 2013. She is a member of the Philippine Bar
Association and the Integrated Bar of the Philippines.
Judy C. Qua, 66, is the Company’s Vice President for Business Development and Corporate
Affairs. She is concurrently the President and COO of Iomni Precision, Inc. She is further the
Executive Assistant to the Chairman and CEO on special assignments. She was the Executive
Director for Finance of IONOTE Ltd., the joint venture facility of Ionics EMS, Inc. and NOTE
AB of Sweden in China. Prior to joining Ionics, she was in college teaching, advertising and
marketing practice, data management, and was a consulting resource for Ionics in people
management and corporate communications. Ms. Qua is a transformational psychologist, a
professional lecturer, a certified faculty for the American Management Association and the
Swedish-based CELEMI management simulation learning systems, and an author of four (4)
books on life essays. She is the lecturer-facilitator of The Second Wind Mind Works
neurotraining course. She holds a Master of Arts degree in Social and Industrial Psychology
from the Ateneo de Manila University and a Master of Business Administration degree from
Kellogg-HKUST Business School of Northwestern University.
Ronan Andrade, 46, is the Vice President for Finance. He graduated from San Beda College
in 1991 and passed the Certified Public Accountant Board Examination in the same year. He
worked with SGV in audit division from 1992 to 1998, starting as an audit staff member until
he became audit supervisor. He joined Ionics in 1999 as Senior Manager for Finance and became Assistant Vice President and Acting Finance Head of the Company, prior to his
transfer to Internal Audit as Vice President. In 2007, Mr. Andrade was appointed as Vice
President for Finance.

31
Cesar G. Caubalejo, 50, is the Assistant Vice President for Internal Audit. He graduated from
the University of the Philippines at Tacloban City, Leyte in 1988 with a degree in Bachelor in
Business Administration Major in Accounting. He is a Certified Public Accountant and a
Certified Fraud Examiner. He worked and started his career with SGV in 1988 until his
resignation from the firm as a Senior Director under the Business Risk Services in December
2008. During his stint with SGV, he was assigned to work in other countries such as US,
France, Vietnam, Cambodia, Laos, Malaysia and Kingdom of Saudi Arabia. He also worked
for a year (1997) as a group controller in one of the diversified companies in the Philippines.
He is a member of Philippine Institute of Certified Public Accountants, and Philippine
Chapters of Association of Certified Fraud Examiners and Institute of Internal Auditors. He
joined Ionics EMS, Inc. on January 5, 2009.
The Directors of the Company are elected at the annual stockholders’ meeting to hold office
until the next succeeding annual meeting and until their respective successors have been
elected.
Messrs. Lawrence C. Qua, Meliton C. Qua, Raymond C. Qua, Virginia Judy Q. Dy and
Cecilia Q. Chua, all of whom are directors of the Company, are all related within the second
degree of consanguinity.
Mrs. Judy C. Qua, the Company’s Vice President for Business Development, is the spouse of
the President/Chairman/Chief Execuive Officer, Mr. Lawrence C. Qua.
No director has transacted with the Group in his/her personal capacity.
None of the directors were involved, during the past five years and up to the date hereof, in
any bankruptcy petition filed by or against any business of which a director was a general
partner or executive officer either at the time of the bankruptcy or within two years to that
time; nor was any director convicted by final judgment in a criminal proceeding, domestic or
foreign, or was subject to a criminal proceeding, domestic or foreign, excluding traffic
violations and other minor offenses; or was subject to any order, judgment, or decree, not
subsequently reversed, suspended or vacated, of any court of competent jurisdiction, domestic
or foreign, permanently or temporarily enjoining, barring, suspending or otherwise limiting his
involvement in any type of business, securities, commodities or banking services; or was
found by a domestic or foreign court of competent jurisdiction (in a civil action), the
commission or comparable foreign body, or a domestic or foreign exchange or electronic
marketplace or self-regulatory organization, to have violated a securities or commodities law.
None of the directors has informed the Group that he/she intends to oppose any action to be
taken by the Group at the meeting.
While all of the employees are valued, none are expected to contribute more significantly than
the others to the business of the Company.
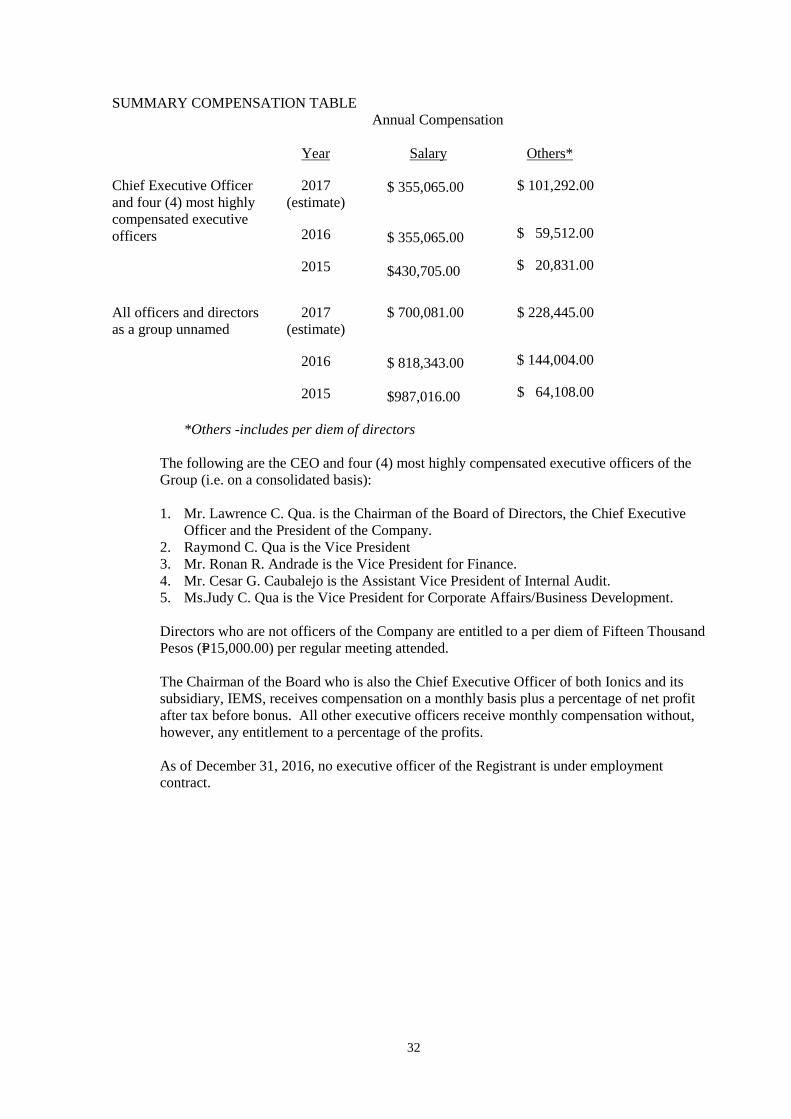
Item 10. Executive Compensation.
The following table summarizes the compensation of the five (5) highest paid executive
officers of the Group and the aggregate compensation of all officers and directors as a group
for the last two completed calendar years, and the estimated aggregate compensation of the
said officers and directors for the present calendar year.
32
SUMMARY COMPENSATION TABLE
Annual Compensation
Year Salary Others*
Chief Executive Officer
and four (4) most highly
compensated executive
officers
2017
(estimate)
2016
2015
$ 355,065.00
$ 355,065.00
$430,705.00
$ 101,292.00
$ 59,512.00
$ 20,831.00
All officers and directors
as a group unnamed
2017
(estimate)
2016
2015
$ 700,081.00
$ 818,343.00
$987,016.00
$ 228,445.00
$ 144,004.00
$ 64,108.00
*Others -includes per diem of directors
The following are the CEO and four (4) most highly compensated executive officers of the
Group (i.e. on a consolidated basis):
1. Mr. Lawrence C. Qua. is the Chairman of the Board of Directors, the Chief Executive
Officer and the President of the Company.
2. Raymond C. Qua is the Vice President
3. Mr. Ronan R. Andrade is the Vice President for Finance.
4. Mr. Cesar G. Caubalejo is the Assistant Vice President of Internal Audit.
5. Ms.Judy C. Qua is the Vice President for Corporate Affairs/Business Development.
Directors who are not officers of the Company are entitled to a per diem of Fifteen Thousand
Pesos (P=15,000.00) per regular meeting attended.
The Chairman of the Board who is also the Chief Executive Officer of both Ionics and its
subsidiary, IEMS, receives compensation on a monthly basis plus a percentage of net profit
after tax before bonus. All other executive officers receive monthly compensation without,
however, any entitlement to a percentage of the profits.
As of December 31, 2016, no executive officer of the Registrant is under employment
contract.

33
Item 11. Security Ownership of Certain Beneficial Owners and Management.
As of December31, 2016.
(a) Security Ownership of Certain Record and Beneficial Owner
Title of
class
Name and address
Of owner
Name of Beneficial
Owner and
Relationship with
Record Owner Citizenship
Number of
Shares Held
Percent
of class
Common Aqua Holdings, Inc.
c/o Ionics EMS, Inc.
Carmelray Industrial
Park II, Bgy.
Tulo,Calamba, Laguna
Shareholder
Lawrence C. Qua,
Meliton C. Qua,
Raymond C. Qua,
Virginia Judy Q. Dy
(stockholders of Aqua
Holdings, Inc.)
Filipino 335,153,100
(R)
39.74%
Common Social Security System
SSS Bldg., East
Ave.,Diliman, Quezon
CityShareholder
Republic of the
Philippines
(represented by
Mr.Ibarra A. Malonzo
Filipino 59,126,198
(R)
7.01%
Common Leonardo T. Siguion
Reyna*
7 Tanguile Road, North
Forbes Park
Makati City
Director
N/A Filipino 75,006,000
(R)
8.89%
*deceased
(b) Security Ownership of Management
Title of
Class
Name of Beneficial
Owner
Amount and Nature
of Beneficial
Ownership
Citizenship Percent of
Class
Commo
n
Lawrence C. Qua
Chairman/President/CE
O
27,454,760
Direct
1,950,000
Indirect
Filipino
3.26%
0.23%
Common
Teh Lin Yang
Director
2,000
Direct
Taiwanese
nil
Common
Meliton C. Qua
Director
6,497,362
Direct
Filipino
0.77%
Common
Guillermo D. Luchangco
Director
19,620,000
Indirect
Filipino
2.33%
Common
Alfredo R. de Borja
Director
14,000
Direct
Filipino
nil

34
Common
Diana P. Aguilar
Director
1
Direct
Filipino
nil
Common
Virginia Judy Q. Dy
Director
1,033,603
Direct
4,887,140
Indirect
Filipino
0.12%
0.58%
Common
Raymond C. Qua
Director/Treasurer
8,562,350
Direct
Filipino
1.00%
Common
Cecilia Q. Chua
Director
5,584,412
Direct
3,000
Indirect
Filipino
0.66%
nil
Common
Monica Siguion Reyna
Villonco
Director
24,000
Direct
127,000
Indirect
Filipino
nil
0.02%
Common
Amelia B. Cabal
Director
100
Direct
53,900
Indirect
Filipino
0.01%
Common
Judy C. Qua
VP- Business
Development &
Corporate Affairs
-0-
Filipino
-0-
Common
Manuel R. Roxas
Corporate Secretary
14,500
Direct
Filipino
nil
Common
Cria Marie L. Pasquil
Assistant Corporate
Secretary
-0-
Filipino
-0-
Common
Ronan R. Andrade
VP - Finance
-0-
Filipino
-0-
Common
Cesar G. Caubalejo
AVP- Internal Audit
-0-
Filipino
-0-
TOTAL 75,828,128
8.99%

35
(c) Voting Trust Holders of 5% or More
There are no voting trust holders of 5% or more
(d) Changes in control
The Group has not entered into any arrangement which may result in a change in control
of the Group.
Item 12. Certain Relationships and Related Transactions
The Group has no significant related party transactions with its stockholders, directors,
officers and affiliated companies except for the following:
(a) lease arrangements:
the Company leases two factory buildings to its subsidiary, Ionics EMS, Inc. as
production plant site V and VI for its manufacturing business. The rental rate was based
on the prevailing and current market rates within the area and assumed no risks on the
transactions.
Ionics EMS, Inc. also entered into a lease agreement with IOMNI Precision, Inc., a wholly
owned subsidiary of Ionics, Inc. for its corporate office with an area of 1,375 square
meters from January 16, 2017 to January 15, 2018.The rental rates was based on the
current market rates and the rate of another tenant within the building.
(b) legal services
The Company retains for legal services the law firms Siguion Reyna Montecillo&
Ongsiako Law Offices, where Monica Siguion Reyna Villonco’s husband is a partner and
Roxas de los Reyes Laurel Rosario & Leagogo Law Offices where the Corporate
Secretary, Manuel R. Roxas, and the Assistant Corporate Secretary, Cria Marie L. Pasquil,
are partner and associate lawyer, respectively. The Company believes that legal fees are
reasonable for the services rendered.
financial advisors
Investment and Capital Corporation of the Philippines (“ICCP”) is retained by the
Company as its Financial Advisor. Guillermo D. Luchangco, who has been a director of
the Company since 1991, is Chairman and Chief Executive Officer of ICCP. The
Company believes that the retainer fees are reasonable for the services rendered.
(c) acquisition of assets
Ionics Properties, Inc. entered into a tripartite agreement with Science Park of the
Philippines, Inc. and Kyocera Circuit Solutions Philippines, Inc. (Kyocera) on 13
November 2015 to purchase the leasehold rights of Kyocera with option to buy a certain
parcel of land with an area of 15,366 sqm. situated in Barangay Real and Barangay
Calamba, Province of Laguna, covered by Transfer Certificate of Title (“TCT”) No.
376494, issued by the Register of Deeds of Laguna (the land). On March 9, 2017, the
Company received the Transfer Certificate of Title which is already under its name.
(d) acquisition of shares
There has been no acquisition of shares for the past three years

36
PART IV – CORPORATE GOVERNANCE REPORT
Item 13. Corporate Governance
a) Evaluation System The Compliance Officer is currently in charge of evaluating the level of compliance of the
Board of Directors and top-level management of the Corporation. The implementation of
the Corporate Governance Scorecard allows the Company to properly evaluate
compliance to the Manual.
b) Compliance Report Measures are slowly being undertaken by the Company to fully comply with the adopted
leading practices on good corporate governance and one of them is attending seminars by
our Corporate Directors.
c) Deviations The Company is taking steps towards full compliance of its Corporate Governance
Manual
d) Plan to improve The Company continues to improve its Corporate Governance when appropriate and
warranted, it its best judgment.

37
PART V - EXHIBITS AND SCHEDULES
Item 14. Exhibits and Reports on SEC Form 17-C
(a) Exhibits - See accompanying Index to Exhibits
(b) Reports to SEC via Form 17-C
1. March 17, 2016 – Announced the date and time of the annual shareholders’ meeting.
Announced that Atty. Adrianne Marie C. Alazas as the elected Assistant Corporate Secretary
of the Corporation. Lastly the nominees were approved for election as members of the Board
of Directors of EMS for 2016-2017.
2. March 17, 2016 – Submission of copy of the Corporation’s Disclosure on Corporate
Governance Guidelines for Listed Companies.
3. April 07, 2016 – Ionics EMS, Inc. (“EMS”) a wholly owned subsidiary of Ionics, Inc.
announced the signing of a Memorandum of Understanding (MOU) with Concepcion
Industrial Corporation (CIC) to develop an “Internet of Things” technology for CIC’s
air-conditioning units.
4. May 13, 2016 – Announced the approval of the proposal of Management to increase the
authorized capital stock of its subsidiary, Ionics Properties, Inc., from PhP100, 000,000.00 to
PhP750, 000,000.00 common shares with a par value of Php1.00 per share and declared stock
dividends in the amount of PhP180,000,000.00.Annouced also the approval of the Board of
the amendment of Article VII of its Articles of Incorporation to reflect said increase.
5. May 23, 2016 – Announced the result of annual stockholders’ meeting and organizational
meeting and also the approval of share buyback program
6. June 08, 2016 – Advised that Ionics, Inc., pursuant to its buyback program bought back
250,000 common shares.
7. June 09, 2016 –- Advised that Ionics, Inc., pursuant to its buyback program bought back
31,000 common shares.
8. June 14, 2016– Advised that Ionics, Inc., pursuant to its buyback program bought back
449,000 common shares.
9. June 15, 2016– Advised that Ionics, Inc., pursuant to its buyback program bought back
297,000 common shares.
10. June 17, 2016– Advised that Ionics, Inc., pursuant to its buyback program bought back
205,000 common shares.
11. June 20, 2016– Advised that Ionics, Inc., pursuant to its buyback program bought back 12,000
common shares.
12. June 21, 2016 – Advised that Ionics, Inc., pursuant to its buyback program bought back
36,000 common shares.
13. June 22, 2016 – Advised that Ionics, Inc., pursuant to its buyback program bought back
284,000 common shares.

38
14. June 23, 2016 – Advised that Ionics, Inc., pursuant to its buyback program bought back
300,000 common shares.
15. June 24, 2016 – Advised that Ionics, Inc., pursuant to its buyback program bought back
650,000 common shares.
16. June 27, 2016 – Advised that Ionics, Inc., pursuant to its buyback program bought back
800,000 common shares.
17. June 29, 2016 – Advised that Ionics, Inc., pursuant to its buyback program bought back
495,000 common shares.
18. July 04, 2016 – Advised that Ionics, Inc., pursuant to its buyback program bought back
200,000 common shares.
19. July 05, 2016 – Advised that Ionics, Inc., pursuant to its buyback program bought back
295,000 common shares.
20. July 18, 2016 – Announced that Ionics EMS, Inc. (EMS), a wholly-owned subsidiary of
Ionics, Inc. elected Dr. Jay Sabido as member of its board and approved his appointment as its
president and chief operating officer.
21. August 26, 2016 – Advised that Ionics, Inc., pursuant to its buyback program bought back
500,000 common shares.
22. August 31, 2016 – Advised that Ionics, Inc., pursuant to its buyback program bought back
196,000 common shares.
23. September 01, 2016 – Advised that Ionics, Inc., pursuant to its buyback program bought back
295,000 common shares.
24. September 02, 2016 – Advised that Ionics, Inc., pursuant to its buyback program bought back
205,000 common shares.
25. September 07, 2016 – Advised that Ionics, Inc., pursuant to its buyback program bought back
22,000 common shares.
26. September 09, 2016 – Advised that Ionics, Inc., pursuant to its buyback program bought back
176,000 common shares.
27. September 15, 2016 – Advised that Ionics, Inc., pursuant to its buyback program bought back
40,000 common shares.
28. September 20, 2016 – Advised that Ionics, Inc., pursuant to its buyback program bought back
250,000 common shares.
29. September 21, 2016 – Advised that Ionics, Inc., pursuant to its buyback program bought back
250,000 common shares.
30. September 22, 2016 – Advised that Ionics, Inc., pursuant to its buyback program bought back
94,000 common shares.
31. September 23, 2016 – Advised that Ionics, Inc., pursuant to its buyback program bought back
25,000 common shares.

39
32. September 29, 2016 – Advised that Ionics, Inc., pursuant to its buyback program bought back
18,000 common shares.
33. September 30, 2016 – Advised that Ionics, Inc., pursuant to its buyback program bought back
113,000 common shares.
34. October 05, 2016 – Advised that Ionics, Inc., pursuant to its buyback program bought back
18,000 common shares.
35. October 07, 2016 – Advised that Ionics, Inc., pursuant to its buyback program bought back
26,000 common shares.
36. October 10, 2016 – Advised that Ionics, Inc., pursuant to its buyback program bought back
51,000 common shares.
37. October 11, 2016 – Advised that Ionics, Inc., pursuant to its buyback program bought back
336,000 common shares.
38. October 12, 2016 – Advised that Ionics, Inc., pursuant to its buyback program bought back
69,000 common shares.
39. October 13, 2016 – Advised that Ionics, Inc., pursuant to its buyback program bought back
334,000 common shares.
40. October 14, 2016 – Advised that Ionics, Inc., pursuant to its buyback program bought back
416,000 common shares.
41. October 24, 2016 – Advised that Ionics, Inc., pursuant to its buyback program bought back
150,000 common shares.
42. October 25, 2016 – Advised that Ionics, Inc., pursuant to its buyback program bought back
60,000 common shares.
43. October 26, 2016 – Advised that Ionics, Inc., pursuant to its buyback program bought back
40,000 common shares.
44. October 27, 2016 – Advised that Ionics, Inc., pursuant to its buyback program bought back
28,000 common shares.
45. November 02, 2016 – Advised that Ionics, Inc., pursuant to its buyback program bought back
222,000 common shares.
46. November 09, 2016 – Announced the construction of a new plant with expanded capacity on
the property purchased by its wholly owned subsidiary, Ionics Properties Inc.,
47. November 21, 2016 – Advised that Ionics, Inc., pursuant to its buyback program bought back
431,000 common shares.
48. November 22, 2016 – Advised that Ionics, Inc., pursuant to its buyback program bought back
20,000 common shares.
49. November 23, 2016 – Advised that Ionics, Inc., pursuant to its buyback program bought back
542,000 common shares.
50. November 24, 2016 – Advised that Ionics, Inc., pursuant to its buyback program bought back
245,000 common shares.

40
51. November 25, 2016 – Advised that Ionics, Inc., pursuant to its buyback program bought back
12,000 common shares.
52. November 28, 2016 – Advised that Ionics, Inc., pursuant to its buyback program bought back
250,000 common shares.
53. December 01, 2016 – Advised that Ionics, Inc., pursuant to its buyback program bought back
274,000 common shares.
54. December 02, 2016 – Advised that Ionics, Inc., pursuant to its buyback program bought back
50,000 common shares.
55. December 06, 2016 – Advised that Ionics, Inc., pursuant to its buyback program bought back
192,000 common shares.


,
Ionics, Inc. and Subsidiaries
Consolidated Financial StatementsDecember 31, 2016 and 2015and Years Ended December 31, 2016, 2015and 2014
and
Independent Auditor’s Report

*SGVFS024032*
INDEPENDENT AUDITOR’S REPORT
The Board of Directors and StockholdersIonics, Inc. and Subsidiaries
Opinion
We have audited the consolidated financial statements of Ionics, Inc. and its subsidiaries (the Group),which comprise the consolidated statements of financial position as at December 31, 2016 and 2015, andthe consolidated statements of comprehensive income, consolidated statements of changes in equity andconsolidated statements of cash flows for each of the three years in the period ended December 31, 2016,and notes to the consolidated financial statements, including a summary of significant accountingpolicies.
In our opinion, the accompanying consolidated financial statements present fairly, in all material respects,the consolidated financial position of the Group as at December 31, 2016 and 2015, and its consolidatedfinancial performance and its consolidated cash flows for each of the three years in the period endedDecember 31, 2016 in accordance with Philippine Financial Reporting Standards (PFRSs).
Basis for Opinion
We conducted our audits in accordance with Philippine Standards on Auditing (PSAs). Ourresponsibilities under those standards are further described in the Auditor’s Responsibilities for the Auditof the Consolidated Financial Statements section of our report. We are independent of the Group inaccordance with the Code of Ethics for Professional Accountants in the Philippines (Code of Ethics)together with the ethical requirements that are relevant to our audit of the consolidated financialstatements in the Philippines, and we have fulfilled our other ethical responsibilities in accordance withthese requirements and the Code of Ethics. We believe that the audit evidence we have obtained issufficient and appropriate to provide a basis for our opinion.
Key Audit Matters
Key audit matters are those matters that, in our professional judgment, were of most significance in ouraudit of the consolidated financial statements of the current period. These matters were addressed in thecontext of our audit of the consolidated financial statements as a whole, and in forming our opinionthereon, and we do not provide a separate opinion on these matters. For each matter below, ourdescription of how our audit addressed the matter is provided in that context.
SyCip Gorres Velayo & Co.6760 Ayala Avenue1226 Makati CityPhilippines
Tel: (632) 891 0307Fax: (632) 819 0872ey.com/ph
BOA/PRC Reg. No. 0001, December 14, 2015, valid until December 31, 2018SEC Accreditation No. 0012-FR-4 (Group A), November 10, 2015, valid until November 9, 2018
A member firm of Ernst & Young Global Limited

*SGVFS024032*
- 2 -
We have fulfilled the responsibilities described in the Auditor’s Responsibilities for the Audit of theConsolidated Financial Statements section of our report, including in relation to these matters.Accordingly, our audit included the performance of procedures designed to respond to our assessment ofthe risks of material misstatement of the consolidated financial statements. The results of our auditprocedures, including the procedures performed to address the matter below, provide the basis for ouraudit opinion on the accompanying consolidated financial statements.
Valuation of Raw Materials Inventories
The carrying value of Group’s raw materials inventories as of December 31, 2016 amounted to$7.0 million and accounts for 12% of its total consolidated assets as of the same date. As disclosed inNote 2 to the consolidated financial statements, the Group’s inventories are carried at lower of cost or netrealizable value (NRV). This is significant to our audit because the Group is operating in an industrycharacterized by rapid technological change, short-term customer commitments and constant changes indemand. These factors increase the risk of inventory obsolescence and decreases in value of the Group’sraw materials inventories. Other relevant disclosures related to this matter are provided in Notes 3 and 9to the consolidated financial statements.
Audit Response
We obtained an understanding, evaluated the design and tested the controls over the Group’s inventorymanagement (procurement and issuance to production) and inventory aging process. On a sampling basis,we tested the acquisition cost against the supporting documents such as purchase invoice. We agreed thecost used in the NRV listing against the inventory listing. We obtained and reviewed the aging of rawmaterials inventories and tested selected long-outstanding inventory items or those related to end-of-lifeproducts. In determining the NRV, we reviewed management’s plan to recover these inventories (e.g., tobe applied against outstanding customer advances, customer contracts with buy-back provisions andrelated forecasted demand). We compared cost to complete and cost to sell against historical data.
Other Information
Management is responsible for the other information. The other information comprises the informationincluded in the SEC Form 20-IS (Definitive Information Statement), SEC Form 17-A and Annual Reportfor the year ended December 31, 2016, but does not include the consolidated financial statements and ourauditor’s report thereon. The SEC Form 20-IS (Definitive Information Statement), SEC Form 17-A andAnnual Report for the year ended December 31, 2016 are expected to be made available to us after thedate of this auditor’s report.
Our opinion on the consolidated financial statements does not cover the other information and we will notexpress any form of assurance conclusion thereon.
In connection with our audits of the consolidated financial statements, our responsibility is to read theother information identified above when it becomes available and, in doing so, consider whether the otherinformation is materially inconsistent with the consolidated financial statements or our knowledgeobtained in the audits, or otherwise appears to be materially misstated.
A member firm of Ernst & Young Global Limited

*SGVFS024032*
- 3 -
Responsibilities of Management and Those Charged with Governance for the ConsolidatedFinancial Statements
Management is responsible for the preparation and fair presentation of the consolidated financialstatements in accordance with PFRSs, and for such internal control as management determines isnecessary to enable the preparation of consolidated financial statements that are free from materialmisstatement, whether due to fraud or error.
In preparing the consolidated financial statements, management is responsible for assessing the Group’sability to continue as a going concern, disclosing, as applicable, matters related to going concern andusing the going concern basis of accounting, unless management either intends to liquidate the Group orto cease operations, or has no realistic alternative but to do so.
Those charged with governance are responsible for overseeing the Group’s financial reporting process.
Auditor’s Responsibilities for the Audit of the Consolidated Financial Statements
Our objectives are to obtain reasonable assurance about whether the consolidated financial statements as awhole are free from material misstatement, whether due to fraud or error, and to issue an auditor’s reportthat includes our opinion. Reasonable assurance is a high level of assurance, but is not a guarantee that anaudit conducted in accordance with PSAs will always detect a material misstatement when it exists.Misstatements can arise from fraud or error and are considered material if, individually or in theaggregate, they could reasonably be expected to influence the economic decisions of users taken on thebasis of these consolidated financial statements.
As part of an audit in accordance with PSAs, we exercise professional judgment and maintainprofessional skepticism throughout the audit. We also:
∂ Identify and assess the risks of material misstatement of the consolidated financial statements,whether due to fraud or error, design and perform audit procedures responsive to those risks, andobtain audit evidence that is sufficient and appropriate to provide a basis for our opinion. The risk ofnot detecting a material misstatement resulting from fraud is higher than for one resulting from error,as fraud may involve collusion, forgery, intentional omissions, misrepresentations, or the override ofinternal control.
∂ Obtain an understanding of internal control relevant to the audit in order to design audit proceduresthat are appropriate in the circumstances, but not for the purpose of expressing an opinion on theeffectiveness of the Group’s internal control.
∂ Evaluate the appropriateness of accounting policies used and the reasonableness of accountingestimates and related disclosures made by management.
∂ Conclude on the appropriateness of management’s use of the going concern basis of accounting and,based on the audit evidence obtained, whether a material uncertainty exists related to events orconditions that may cast significant doubt on the Group’s ability to continue as a going concern. Ifwe conclude that a material uncertainty exists, we are required to draw attention in our auditor’sreport to the related disclosures in the consolidated financial statements or, if such disclosures areinadequate, to modify our opinion. Our conclusions are based on the audit evidence obtained up tothe date of our auditor’s report. However, future events or conditions may cause the Group to ceaseto continue as a going concern.
A member firm of Ernst & Young Global Limited

*SGVFS024032*
- 4 -
∂ Evaluate the overall presentation, structure and content of the consolidated financial statements,including the disclosures, and whether the consolidated financial statements represent the underlyingtransactions and events in a manner that achieves fair presentation.
∂ Obtain sufficient appropriate audit evidence regarding the financial information of the entities orbusiness activities within the Group to express an opinion on the consolidated financial statements.We are responsible for the direction, supervision and performance of the audit. We remain solelyresponsible for our audit opinion.
We communicate with those charged with governance regarding, among other matters, the planned scopeand timing of the audit and significant audit findings, including any significant deficiencies in internalcontrol that we identify during our audit.
We also provide those charged with governance with a statement that we have complied with relevantethical requirements regarding independence, and to communicate with them all relationships and othermatters that may reasonably be thought to bear on our independence, and where applicable, relatedsafeguards.
From the matters communicated with those charged with governance, we determine those matters thatwere of most significance in the audit of the consolidated financial statements of the current period andare therefore the key audit matters. We describe these matters in our auditor’s report unless law orregulation precludes public disclosure about the matter or when, in extremely rare circumstances, wedetermine that a matter should not be communicated in our report because the adverse consequences ofdoing so would reasonably be expected to outweigh the public interest benefits of such communication.
The engagement partner on the audit resulting in this independent auditor’s report is Dhonabee B.Señeres.
SYCIP GORRES VELAYO & CO.
Dhonabee B. SeñeresPartnerCPA Certificate No. 97133SEC Accreditation No. 1196-AR-1 (Group A), June 30, 2015, valid until June 29, 2018Tax Identification No. 201-959-816BIR Accreditation No. 08-001998-98-2015, January 5, 2015, valid until January 4, 2018PTR No. 5908762, January 3, 2017, Makati City
March 15, 2017
A member firm of Ernst & Young Global Limited

*SGVFS024032*
IONICS, INC. AND SUBSIDIARIESCONSOLIDATED STATEMENTS OF FINANCIAL POSITION(Amounts in Thousands)
December 312016 2015
ASSETS
Current AssetsCash (Notes 4, 5, 6 and 7) US$13,144 US$10,284Receivables (Notes 3, 4, 5 and 8) 11,382 14,110Inventories (Notes 3 and 9) 8,210 11,657Prepayments and other current assets 793 1,004
Total Current Assets 33,529 37,055
Noncurrent AssetsAvailable-for-sale investments (Notes 3, 4, 5 and 10) 2,733 2,879Investments in associates (Notes 3 and 11) 684 116Property, plant and equipment (Notes 3 and 12) 15,384 13,068Investment properties (Notes 3 and 13) 5,614 5,640Goodwill (Notes 3 and 21) − 217Deferred tax assets (Notes 3 and 26) 26 24Other noncurrent assets (Notes 4 and 5) 413 420
Total Noncurrent Assets 24,854 22,364US$58,383 US$59,419
LIABILITIES AND EQUITY
Current LiabilitiesAccounts payable and other liabilities (Notes 4, 5, 6 and 14) US$6,953 US$10,563Advances from customers (Note 15) 2,889 3,616Bank loans and finance lease liabilities - current portion
(Notes 4, 5, 6, 16 and 24) 1,106 548Income tax payable (Note 26) 93 108
Total Current Liabilities 11,041 14,835
Noncurrent LiabilitiesPension liability (Notes 3 and 28) 2,583 2,515Bank loans and finance lease liabilities - net of current portion
(Notes 4, 5, 6, 16 and 24) 1,057 1,024Other noncurrent liabilities (Notes 4 and 11) 1,090 1,127
Total Noncurrent Liabilities 4,730 4,666Total Liabilities 15,771 19,501
(Forward)

*SGVFS024032*
- 2 -
December 312016 2015
Equity Attributable to the Equity Holders of the ParentCompany (Note 6)
Capital stock (Note 17) US$17,633 US$17,633Additional paid-in capital (Notes 17 and 30) 9,072 9,072Retained earnings 17,975 15,173Other comprehensive income
Unrealized losses on available-for-sale investments (Note 10) (216) (233)Exchange differences (Notes 11, 13, 28 and 30) 927 546Other reserves (Note 23) (908) (805)
Adjustment to non-controlling interests (Note 30) (943) (1,000)Treasury shares (Note 17) (1,065) (602)
42,475 39,784Non-controlling interests 137 134
Total Equity 42,612 39,918US$58,383 US$59,419
See accompanying Notes to Consolidated Financial Statements.

*SGVFS024032*
IONICS, INC. AND SUBSIDIARIESCONSOLIDATED STATEMENTS OF COMPREHENSIVE INCOME(Amounts in Thousands, Except Earnings per Share)
Years Ended December 312016 2015 2014
REVENUE AND INCOMESales (Note 29) US$48,356 US$63,746 US$63,305Rental income (Notes 13, 24 and 29) 2,567 2,396 2,527Share in net earnings of associates
(Notes 11 and 29) 40 − −Other income (Notes 10, 11 and 18) 332 279 387
51,295 66,421 66,219COSTS AND EXPENSESCost of sales (Note 19) 43,791 59,414 60,264Cost of rental services (Notes 13 and 20) 347 356 425Operating expenses (Note 21) 3,749 3,024 3,913Share in net losses of associates (Note 29) − 174 188Finance costs (Note 22) 131 41 29Other expenses 94 73 70
48,112 63,082 64,889INCOME BEFORE INCOME TAX 3,183 3,339 1,330PROVISION FOR INCOME TAX
(Notes 25 and 26) 334 360 260NET INCOME 2,849 2,979 1,070OTHER COMPREHENSIVE INCOME (LOSS)Items that may be reclassified to profit or loss:
Exchange differences (Notes 11, 13, 28 and 30) 381 (225) 110Impairment loss on available-for-sale investments reclassified to profit or loss (Note 10) 56 − −Change in fair value of available-for-sale investments (Note 10) (39) (15) 186
Items that will not be reclassified to profit or loss:Remeasurement losses on retirement plan (Notes 3and 28) (90) (102) (376)
308 (342) (80)TOTAL COMPREHENSIVE INCOME US$3,157 US$2,637 US$990
NET INCOME ATTRIBUTABLE TO:Equity holders of the Parent Company (Note 27) US$2,802 US$2,925 US$1,049Non-controlling interests 47 54 21
US$ 2,849 US$2,979 US$1,070
TOTAL COMPREHENSIVE INCOMEATTRIBUTABLE TO:
Equity holders of the Parent Company US$3,113 US$2,588 US$982Non-controlling interests 44 49 8
US$ 3,157 US$2,637 US$990
BASIC/DILUTED EARNINGSPER SHARE (Note 27)
For net income for the year attributable to ordinaryequity holders of the Parent Company US$0.0034 US$0.0035 US$0.0012
See accompanying Notes to Consolidated Financial Statements.
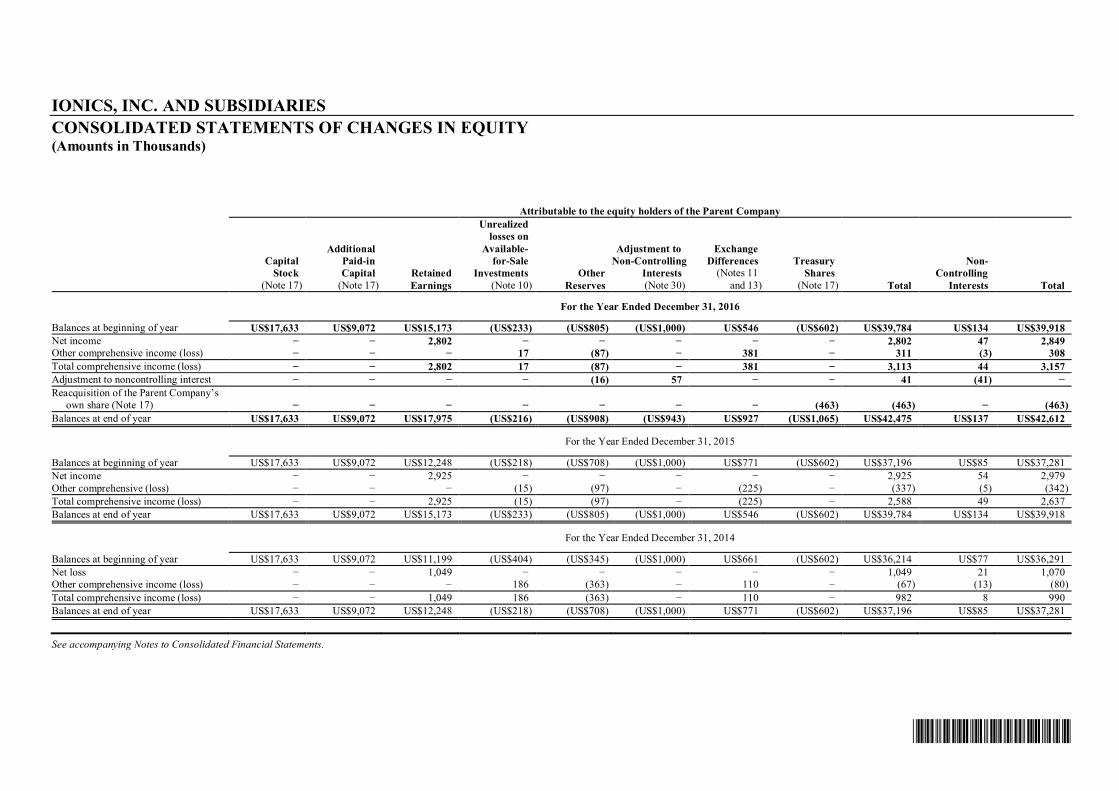
*SGVFS024032*
IONICS, INC. AND SUBSIDIARIESCONSOLIDATED STATEMENTS OF CHANGES IN EQUITY(Amounts in Thousands)
Attributable to the equity holders of the Parent Company
Additional
Unrealizedlosses on
Available- Adjustment to ExchangeCapital Paid-in for-Sale Non-Controlling Differences Treasury Non-
Stock Capital Retained Investments Other Interests (Notes 11 Shares Controlling(Note 17) (Note 17) Earnings (Note 10) Reserves (Note 30) and 13) (Note 17) Total Interests Total
For the Year Ended December 31, 2016
Balances at beginning of year US$17,633 US$9,072 US$15,173 (US$233) (US$805) (US$1,000) US$546 (US$602) US$39,784 US$134 US$39,918Net income − − 2,802 − − − − − 2,802 47 2,849Other comprehensive income (loss) − − − 17 (87) − 381 − 311 (3) 308Total comprehensive income (loss) − − 2,802 17 (87) − 381 − 3,113 44 3,157Adjustment to noncontrolling interest − − − − (16) 57 − − 41 (41) −Reacquisition of the Parent Company’s
own share (Note 17) − − − − − − − (463) (463) − (463)Balances at end of year US$17,633 US$9,072 US$17,975 (US$216) (US$908) (US$943) US$927 (US$1,065) US$42,475 US$137 US$42,612
For the Year Ended December 31, 2015
Balances at beginning of year US$17,633 US$9,072 US$12,248 (US$218) (US$708) (US$1,000) US$771 (US$602) US$37,196 US$85 US$37,281Net income − − 2,925 − − − − − 2,925 54 2,979Other comprehensive (loss) − − − (15) (97) − (225) − (337) (5) (342)Total comprehensive income (loss) − − 2,925 (15) (97) − (225) − 2,588 49 2,637Balances at end of year US$17,633 US$9,072 US$15,173 (US$233) (US$805) (US$1,000) US$546 (US$602) US$39,784 US$134 US$39,918
For the Year Ended December 31, 2014
Balances at beginning of year US$17,633 US$9,072 US$11,199 (US$404) (US$345) (US$1,000) US$661 (US$602) US$36,214 US$77 US$36,291Net loss − − 1,049 − − − − − 1,049 21 1,070Other comprehensive income (loss) − − − 186 (363) − 110 − (67) (13) (80)Total comprehensive income (loss) − − 1,049 186 (363) − 110 − 982 8 990Balances at end of year US$17,633 US$9,072 US$12,248 (US$218) (US$708) (US$1,000) US$771 (US$602) US$37,196 US$85 US$37,281
See accompanying Notes to Consolidated Financial Statements.

*SGVFS024032*
IONICS, INC. AND SUBSIDIARIESCONSOLIDATED STATEMENTS OF CASH FLOWS(Amounts in Thousands)
Years Ended December 312016 2015 2014
CASH FLOWS FROM OPERATINGACTIVITIES
Income before income tax US$3,183 US$3,339 US$1,330Adjustments for:
Depreciation (Notes 12, 13, 19, 20 and 21) 3,075 2,404 2,007Movement in pension liability (Note 28) 129 207 1Share in net losses (earnings) of associates(Note 11) (40) 174 188Finance costs (Note 22) 131 41 29Impairment loss on goodwill (Notes 3 and 21) 217 − −Dividend income (Notes 10 and 18) (4) (18) (58)Interest income (Note 18) (15) (18) (16)Loss (gain) on disposal of property and equipment and investment properties (Notes 12, 13 and 18) 66 (5) (163)Impairment of available-for-sale investment (Notes 10 and 21) 56 3 705Gain on dilution of interest in investment in associate (Note 11) (163) − −Impairment loss on investment properties (Notes 13 and 21) − − 67
Operating income before working capital changes 6,635 6,127 4,090Decrease (increase) in:
Receivables (Notes 8 and 21) 2,728 704 (1,453)Inventories (Notes 9 and 19) 3,447 1,587 5,503Prepayments and other current assets 214 451 (249)Refundable deposits 7 17 (9)
Increase (decrease) in:Accounts payable and accrued expenses (3,742) (1,669) (2,015)Advances from customers (727) 1,330 (475)Security deposits (5) 48 (160)
Net cash generated from operations 8,557 8,595 5,232Income taxes paid (351) (298) (272)Interest paid (91) (117) (76)Interest received 12 77 13Net cash provided by operating activities 8,127 8,257 4,897
(Forward)

*SGVFS024032*
- 2 -
Years Ended December 312016 2015 2014
CASH FLOWS FROM INVESTINGACTIVITIES
Proceeds received from sale of:Property and equipment US$– US$47 US$117Investment properties (Note13) – − 1,627
Dividends received from available-for-saleinvestments (Notes 10 and 18) 4 18 58
Redemption of available-for-sale investments(Note 10) 217 − −
Acquisitions of:Property and equipment (Note 12) (3,914) (3,754) (3,454)Investment properties (Note 13) (372) (311) (316)Available-for-sale investments (Note 10) (110) − (300)
Additional investments in associates (Note 11) – (290) −Net cash used in investing activities (4,175) (4,290) (2,268)
CASH FLOWS FROM FINANCINGACTIVITIES
Finance lease payments (645) (468) −Payments of bank loans (111) (264) (1,060)Proceeds from bank loans (Note 16) 127 − 750Reacquisition of Parent Company’s owner shares
(Note 17) (463) – −Net cash used in financing activities (1,092) (732) (310)
NET INCREASE IN CASH 2,860 3,235 2,319
CASH AT BEGINNING OF YEAR 10,284 7,049 4,730
CASH AT END OF YEAR (Note 7) US$13,144 US$10,284 US$7,049
See accompanying Notes to Consolidated Financial Statements.

*SGVFS024032*
IONICS, INC. AND SUBSIDIARIESNOTES TO CONSOLIDATED FINANCIAL STATEMENTS(Amounts in Thousands, Except Par Value per Share and Earnings per Share)
1. Corporate Information and Status of Operations
Ionics, Inc. (the Parent Company) is a domestic corporation incorporated under the laws of thePhilippines and registered with the Securities and Exchange Commission (SEC) inSeptember 1982. The Parent Company started commercial operations in July 1987 to engage inelectronic manufacturing services business. In September 1999, the Parent Company transferredits primary manufacturing business to a majority owned subsidiary, Ionics EMS, Inc. (EMS),which was subsequently listed in the Singapore Exchange Securities Trading Limited (SingaporeExchange). Consequently, the Parent Company’s primary purpose was amended from amanufacturing company to a holding company.
On February 25, 2000, EMS offered its shares of stock to the public and became publicly listed inthe Singapore Exchange. On September 25, 2009, Philippine SEC approved EMS’ equityrestructuring, which ultimately offset its remaining deficit and improved its debt to equity ratio.Low daily turnover and low daily market capitalization prompted EMS to reconsider its continuedlisting in the Singapore Exchange. Consequently, on March 2, 2010, the Parent Company andEMS jointly announced the proposed voluntary delisting of EMS from the Singapore Exchange.The Parent Company offered to purchase common shares issued to the non-controllingstockholders in compliance with the delisting proposal. Subsequently in 2010, the ParentCompany acquired an additional 104,801,455 shares or 6.72% ownership on EMS(see Note 30).
The principal activities of the Parent Company and its subsidiaries (collectively, the Group) aredescribed in Notes 2 and 29. The Group’s customers are original equipment manufacturers in thecomputer peripherals, telecommunications, automotive, consumer electronics, industrialequipment and medical equipment industries. The top five customers collectively account for68.64%, 74.87% and 70.87% of the Group’s sales in 2016, 2015 and 2014, respectively. TheGroup anticipates that concentration of business in major customers will continue in theforeseeable future although the Group’s management is starting to build new relationships withother customers.
The Parent Company is listed in the Philippine Stock Exchange.
The Parent Company’s principal place of business is at Circuit Street, Light Industry and SciencePark of the Philippines I, Bo. Diezmo, Cabuyao City, Laguna, Philippines.
The consolidated financial statements were approved and authorized for issue by the Board ofDirectors (BOD) on March 15, 2017.
2. Summary of Significant Accounting Policies
Basis of PreparationThe consolidated financial statements have been prepared on the historical cost basis except foravailable-for-sale (AFS) investments that have been measured at fair value.

- 2 -
*SGVFS024032*
The consolidated financial statements are presented in United States (US) Dollar ($), which is alsothe functional and presentation currency of the Parent Company. All amounts are rounded to thenearest thousand (US$000) except when otherwise indicated.
The following table shows the functional currency of the Parent Company and its subsidiaries:
Entity Functional CurrencyIonics, Inc. (the Parent Company) US DollarIonics EMS, Inc. (EMS) US DollarIonics Circuits, Limited (ICL) US DollarIonics Properties, Inc. (IPI) US DollarIomni Precision, Inc. (Iomni) US DollarIonics EMS (USA), Inc. (USA) US DollarSynertronix, Inc. (SI) Philippine Peso
For consolidation purposes, the financial statements of SI were translated to US Dollars using theprevailing closing rate as of the reporting date for the consolidated statement of financial positionaccounts and the weighted average rate for the reporting period for profit or loss accounts. Theforeign currency exchange differences arising from translation are taken to the line item“Exchange differences” in other comprehensive income.
Statement of ComplianceThe consolidated financial statements of the Group have been prepared in accordance withPhilippine Financial Reporting Standards (PFRS).
Basis of ConsolidationThe consolidated financial statements comprise the financial statements of the Parent Companyand the following wholly and majority owned subsidiaries as at December 31:
SubsidiariesCountry
of Incorporation Principal Activity
Effective Percentageof Ownership2016 2015
ICL Cayman Islands Investing 100% 100%IPI Philippines Leasing 100 100Iomni Philippines Manufacturing 100 100SI Philippines Manufacturing 100 100EMS Philippines Manufacturing 97 97
USA United States of America Manufacturing 100 100
Control is achieved when the Group is exposed, or has rights to variable returns from itsinvolvement with the investee and has the ability to affect those returns through its power over theinvestees. Specifically, the Group controls an investee if and only if the Group has:
∂ Power over the investee (i.e., existing rights that give it the current ability to direct therelevant activities of the investee);
∂ Exposure, or rights, to variable returns from its involvement with the investee; and∂ The ability to use its power over the investee to affect its returns.

- 3 -
*SGVFS024032*
When the Group has less than a majority of the voting or similar rights of an investee, the Groupconsiders all relevant facts and circumstances in assessing whether it has power over an investee,including:
∂ The contractual arrangement with the other holders of the investee;∂ Rights arising from other contractual arrangements; or∂ The Group’s voting rights and potential voting rights.
The Group re-assesses whether or not it controls an investee if facts and circumstances indicatethat there are changes to one or more of the three elements of control. Consolidation of asubsidiary begins when the Group obtains control over the subsidiary and ceases when the Grouploses control of the subsidiary. Assets, liabilities, income and expenses of a subsidiary acquiredor disposed of during the year are included in the consolidated financial statements from the datethe Group gains control until the date the Group ceases to control the subsidiary.
All intra-group balances, transactions, income and expenses and profits and losses resulting fromintra-group transactions are eliminated in full upon consolidation.
The financial statements of the subsidiaries are prepared in the same reporting year as the ParentCompany, using consistent accounting policies.
Non-Controlling InterestsNon-controlling interests represent the portion of profit or loss and net assets not held by theGroup and are presented separately in the consolidated statement of comprehensive income andwithin equity in the consolidated statement of financial position, separately from the ParentCompany’s equity (see accounting policy on Business Combinations).
Changes in Accounting Policies and DisclosuresThe accounting policies adopted in the preparation of the Group’s consolidated financialstatements are consistent with those of the previous financial year, except for the adoption of thefollowing new and amended PFRS which became effective January 1, 2016.
The nature and impact of each new standard and amendment is described below:
∂ PAS 1, Presentation of Financial Statements, Disclosure Initiative (Amendments)The amendments are intended to assist entities in applying judgment when meeting thepresentation and disclosure requirements in PFRSs. They clarify the following:
∂ That entities shall not reduce the understandability of their financial statements by eitherobscuring material information with immaterial information; or aggregating materialitems that have different natures or functions
∂ That specific line items in the statement of income and other comprehensive income andthe statement of financial position may be disaggregated
∂ That entities have flexibility as to the order in which they present the notes to financialstatements
∂ That the share of other comprehensive income of associates and joint ventures accountedfor using the equity method must be presented in aggregate as a single line item, andclassified between those items that will or will not be subsequently reclassified to profit orloss.
These amendments do not have significant impact to the Group.

- 4 -
*SGVFS024032*
∂ PAS 16, Property, Plant and Equipment and PAS 38, Intangible Assets, Clarification ofAcceptable Methods of Depreciation and Amortization (Amendment)The amendments clarify the principle in PAS 16 and PAS 38 that revenue reflects a pattern ofeconomic benefits that are generated from operating a business (of which the asset is part)rather than the economic benefits that are consumed through use of the asset. As a result, arevenue-based method cannot be used to depreciate property, plant and equipment and mayonly be used in very limited circumstances to amortize intangible assets.
These amendments are applied prospectively and do not have any impact to the Group, giventhat the Group has not used a revenue-based method to depreciate or amortize its property,plant and equipment and intangible assets.
∂ PAS 27, Separate Financial Statements, Equity Method in Separate Financial Statements(Amendment)The amendments allow entities to use the equity method to account for investments insubsidiaries, joint ventures and associates in their separate financial statements. Entitiesalready applying PFRS and electing to change to the equity method in its separate financialstatements will have to apply that change retrospectively. These amendments do not have anyimpact on the Group’s consolidated financial statements.
∂ PFRS 10, Consolidated Financial Statements, PFRS 12, Disclosure of Interests in OtherEntities, and PAS 28, Investments in Associates and Joint Ventures, Investment Entities:Applying the Consolidation Exception (Amendment)These amendments clarify that the exemption in PFRS 10 from presenting consolidatedfinancial statements applies to a parent entity that is a subsidiary of an investment entity thatmeasures all of its subsidiaries at fair value. They also clarify that only a subsidiary of aninvestment entity that is not an investment entity itself and that provides support services tothe investment entity parent is consolidated. The amendments also allow an investor (that isnot an investment entity and has an investment entity associate or joint venture) to retain thefair value measurement applied by the investment entity associate or joint venture to itsinterests in subsidiaries when applying the equity method.
These amendments are not applicable to the Group since none of the entities within the Groupis an investment entity nor does the Group have investment entity associates or joint ventures.
Annual Improvements to PFRSs (2012-2014 cycle)The Annual Improvements to PFRSs (2012-2014 cycle) are effective for annual periods beginningon or after January 1, 2016 and are not expected to have a material impact on the Group. Theyinclude:
∂ PFRS 5, Non-current Assets Held for Sale and Discontinued Operations - Changes inMethods of DisposalThe amendment is applied prospectively and clarifies that changing from a disposal throughsale to a disposal through distribution to owners and vice-versa should not be considered to bea new plan of disposal, rather it is a continuation of the original plan. There is, therefore, nointerruption of the application of the requirements in PFRS 5. The amendment also clarifiesthat changing the disposal method does not change the date of classification.

- 5 -
*SGVFS024032*
∂ PFRS 7, Financial Instruments: Disclosures, Servicing Contracts (Amendment)PFRS 7 requires an entity to provide disclosures for any continuing involvement in atransferred asset that is derecognized in its entirety. The amendment clarifies that a servicingcontract that includes a fee can constitute continuing involvement in a financial asset. Anentity must assess the nature of the fee and arrangement against the guidance for continuinginvolvement in PFRS 7 in order to assess whether the disclosures are required. Theamendment is to be applied such that the assessment of which servicing contracts constitutecontinuing involvement will need to be done retrospectively. However, comparativedisclosures are not required to be provided for any period beginning before the annual periodin which the entity first applies the amendments.
∂ PFRS 7, Applicability of the Amendments to PFRS 7 to Condensed Interim FinancialStatements (Amendment)This amendment is applied retrospectively and clarifies that the disclosures on offsetting offinancial assets and financial liabilities are not required in the condensed interim financialreport unless they provide a significant update to the information reported in the most recentannual report.
∂ PAS 19, Employee Benefits, Discount Rate: Regional Market Issue (Amendment)This amendment is applied prospectively and clarifies that market depth of high qualitycorporate bonds is assessed based on the currency in which the obligation is denominated,rather than the country where the obligation is located. When there is no deep market for highquality corporate bonds in that currency, government bond rates must be used.
∂ PAS 34, Interim Financial Reporting, Disclosure of Information ‘Elsewhere in the InterimFinancial Report’The amendment is applied retrospectively and clarifies that the required interim disclosuresmust either be in the interim financial statements or incorporated by cross-reference betweenthe interim financial statements and wherever they are included within the greater interimfinancial report (e.g., in the management commentary or risk report).
Standards and interpretations issued but not yet effectiveThe Group will adopt the following amended standards and interpretations when these becomeeffective. The Group does not expect the adoption of these new and amended PFRS andPhilippine Interpretations to have a significant impact on the consolidated financial statements.
Effective beginning on or after January 1, 2017
∂ PFRS 12, Clarification of the Scope of the Standard (Part of Annual Improvements to PFRSs2014 - 2016 Cycle) (Amendments)The amendments clarify that the disclosure requirements in PFRS 12, other than those relatingto summarized financial information, apply to an entity’s interest in a subsidiary, a jointventure or an associate (or a portion of its interest in a joint venture or an associate) that isclassified (or included in a disposal group that is classified) as held for sale. The amendmentsdo not have any impact on the Group’s financial position and results of operation.
∂ PAS 7, Statement of Cash Flows, Disclosure Initiative (Amendments)The amendments to PAS 7 require an entity to provide disclosures that enable users offinancial statements to evaluate changes in liabilities arising from financing activities,including both changes arising from cash flows and non-cash changes (such as foreignexchange gains or losses). On initial application of the amendments, entities are not required

- 6 -
*SGVFS024032*
to provide comparative information for preceding periods. Early application of theamendments is permitted. Application of amendments will result in additional disclosures inthe 2017 consolidated financial statements of the Group.
∂ PAS 12, Income Taxes, Recognition of Deferred Tax Assets for Unrealized Losses(Amendments)The amendments clarify that an entity needs to consider whether tax law restricts the sourcesof taxable profits against which it may make deductions on the reversal of that deductibletemporary difference. Furthermore, the amendments provide guidance on how an entityshould determine future taxable profits and explain the circumstances in which taxable profitmay include the recovery of some assets for more than their carrying amount.
Entities are required to apply the amendments retrospectively. However, on initial applicationof the amendments, the change in the opening equity of the earliest comparative period maybe recognized in opening retained earnings (or in another component of equity, asappropriate), without allocating the change between opening retained earnings and othercomponents of equity. Entities applying this relief must disclose that fact. Early applicationof the amendments is permitted. Management is currently assessing the impact of theseamendments.
Effective beginning on or after January 1, 2018
∂ PFRS 15, Revenue from Contracts with CustomersPFRS 15 establishes a new five-step model that will apply to revenue arising from contractswith customers. Under PFRS 15, revenue is recognized at an amount that reflects theconsideration to which an entity expects to be entitled in exchange for transferring goods orservices to a customer. The principles in PFRS 15 provide a more structured approach tomeasuring and recognizing revenue.
The new revenue standard is applicable to all entities and will supersede all current revenuerecognition requirements under PFRSs. Either a full or modified retrospective application isrequired for annual periods beginning on or after January 1, 2018. The Group is in theprocess of assessing the impact of PFRS 15 to its consolidated financial statements.
∂ PFRS 9, Financial InstrumentsPFRS 9 reflects all phases of the financial instruments project and replaces PAS 39, FinancialInstruments: Recognition and Measurement, and all previous versions of PFRS 9. Thestandard introduces new requirements for classification and measurement, impairment, andhedge accounting. PFRS 9 is effective for annual periods beginning on or after January 1,2018, with early application permitted. Retrospective application is required, but providingcomparative information is not compulsory. For hedge accounting, the requirements aregenerally applied prospectively, with some limited exceptions.
The adoption of PFRS 9 will have an effect on the classification and measurement of theGroup’s financial assets and impairment methodology for financial assets, but will have noimpact on the classification and measurement of the Group’s financial liabilities. Theadoption will also have an effect on the Group’s application of hedge accounting and on theamount of its credit losses. The Group is currently assessing the impact of adopting thisstandard.

- 7 -
*SGVFS024032*
∂ PAS 40, Investment Property, Transfers of Investment Property (Amendments)The amendments clarify when an entity should transfer property, including property underconstruction or development into, or out of investment property. The amendments state that achange in use occurs when the property meets, or ceases to meet, the definition of investmentproperty and there is evidence of the change in use. A mere change in management’sintentions for the use of a property does not provide evidence of a change in use. Theamendments should be applied prospectively to changes in use that occur on or after thebeginning of the annual reporting period in which the entity first applies the amendments.Retrospective application is only permitted if this is possible without the use of hindsight.These amendments are not expected to have any impact to the Group.
∂ Philippine Interpretation IFRIC-22, Foreign Currency Transactions and AdvanceConsiderationThe interpretation clarifies that in determining the spot exchange rate to use on initialrecognition of the related asset, expense or income (or part of it) on the derecognition of anon-monetary asset or non-monetary liability relating to advance consideration, the date of thetransaction is the date on which an entity initially recognizes the nonmonetary asset or non-monetary liability arising from the advance consideration. If there are multiple payments orreceipts in advance, then the entity must determine a date of the transactions for each paymentor receipt of advance consideration. The interpretation may be applied on a fully retrospectivebasis. Entities may apply the interpretation prospectively to all assets, expenses and incomein its scope that are initially recognized on or after the beginning of the reporting period inwhich the entity first applies the interpretation or the beginning of a prior reporting periodpresented as comparative information in the financial statements of the reporting period inwhich the entity first applies the interpretation. The Group is in the process of assessing theimpact this interpretation to its financial statements.
Effective beginning on or after January 1, 2019
∂ PFRS 16, LeasesUnder the new standard, lessees will no longer classify their leases as either operating orfinance leases in accordance with PAS 17, Leases. Rather, lessees will apply the single-assetmodel. Under this model, lessees will recognize the assets and related liabilities for mostleases on their balance sheets, and subsequently, will depreciate the lease assets and recognizeinterest on the lease liabilities in their profit or loss. Leases with a term of 12 months or lessor for which the underlying asset is of low value are exempted from these requirements.
The accounting by lessors is substantially unchanged as the new standard carries forward theprinciples of lessor accounting under PAS 17. Lessors, however, will be required to disclosemore information in their financial statements, particularly on the risk exposure to residualvalue.
Entities may early adopt PFRS 16 but only if they have also adopted PFRS 15. Whenadopting PFRS 16, an entity is permitted to use either a full retrospective or a modifiedretrospective approach, with options to use certain transition reliefs. The Group is currentlyassessing the impact of adopting PFRS 16.

- 8 -
*SGVFS024032*
Deferred effectivity
∂ Amendments to PFRS 10 and PAS 28, Sale or Contribution of Assets between an Investor andits Associate or Joint VentureThe amendments address the conflict between PFRS 10 and PAS 28 in dealing with the lossof control of a subsidiary that is sold or contributed to an associate or joint venture. Theamendments clarify that a full gain or loss is recognized when a transfer to an associate orjoint venture involves a business as defined in PFRS 3, Business Combinations. Any gain orloss resulting from the sale or contribution of assets that does not constitute a business,however, is recognized only to the extent of unrelated investors’ interests in the associate orjoint venture.
On January 13, 2016, the Financial Reporting Standards Council postponed the originaleffective date of January 1, 2016 of the said amendments until the International AccountingStandards Board has completed its broader review of the research project on equityaccounting that may result in the simplification of accounting for such transactions and ofother aspects of accounting for associates and joint ventures.
Fair Value MeasurementThe Group measures and discloses financial instruments, such as AFS investments and loans andreceivables, respectively, at fair value at each reporting date. Also, fair values of financialinstruments measured at amortized cost are disclosed in Note 5.
Fair value is the price that would be received to sell an asset or paid to transfer a liability in anorderly transaction between market participants at the measurement date. The fair valuemeasurement is based on the presumption that the transaction to sell the asset or transfer theliability takes place either:
∂ In the principal market for the asset or liability, or∂ In the absence of a principal market, in the most advantageous market for the asset or liability
The principal or the most advantageous market must be accessible to the Group.
The fair value of an asset or a liability is measured using the assumptions that market participantswould use when pricing the asset or liability, assuming that market participants act in theireconomic best interest.
A fair value measurement of a non-financial asset takes into account a market participant’s abilityto generate economic benefits by using the asset in its highest and best use or by selling it toanother market participant that would use the asset in its highest and best use.
The Group uses valuation techniques that are appropriate in the circumstances and for whichsufficient data are available to measure fair value, maximizing the use of relevant observablesinputs and minimizing the use of observables inputs.
All assets and liabilities for which fair value is measured or disclosed in the consolidated financialstatements are categorized within the fair value hierarchy, described as follows, based on thelowest level input that is significant to the fair value measurement as a whole:
∂ Level 1 - Quoted (unadjusted) market prices in active markets for identical assets or liabilities

- 9 -
*SGVFS024032*
∂ Level 2 - Valuation techniques for which the lowest level input that is significant to the fairvalue measurement is directly or indirectly observable
∂ Level 3 - Valuation techniques for which the lowest level input that is significant to the fairvalue measurement is unobservable
For assets and liabilities that are recognized in the consolidated financial statements on a recurringbasis, the Group determines whether transfers have occurred between Levels in the hierarchy byre-assessing categorization (based on the lowest level input that is significant to the fair valuemeasurement as a whole) at the end of each reporting period.
Financial InstrumentsDate of recognitionThe Group recognizes a financial asset or a financial liability in the consolidated statement offinancial position when it becomes a party to the contractual provisions of the instrument.Purchases or sales of financial assets that require delivery of assets within the time frameestablished by regulation or convention in the marketplace are recognized on the trade date,i.e., the date that the Group commits to purchase or sell the asset.
Initial recognitionAll financial instruments are initially measured at fair value. Except for financial instruments atFVPL, the initial measurement of financial instruments includes transaction costs. The Groupclassifies its financial assets in the following categories: financial assets at FVPL, held-to-maturity(HTM) investments, AFS investments, and loans and receivables. Financial liabilities areclassified into financial liabilities at FVPL and other financial liabilities.
The classification depends on the purpose for which the investments were acquired and whetherthey are quoted in an active market. Management determines the classification of its investmentsat initial recognition and, where allowed and appropriate, re-evaluates such designation at everyreporting date.
The Group has no designated financial asset and liability at FVPL and HTM investments as ofDecember 31, 2016 and 2015.
Subsequent measurementThe subsequent measurement of financial instruments depends on their classification as follows:
Loans and receivablesLoans and receivables are non-derivative financial assets with fixed or determinable payments andfixed maturities that are not quoted in an active market. After initial measurement, loans andreceivables are carried at amortized cost using the effective interest rate (EIR) method lessallowance for impairment losses. Amortized cost is calculated by taking into account anydiscount or premium on acquisitions and fees or costs that are an integral part of the EIR method.The EIR amortization is included in the interest income in profit or loss. Receivables, whichgenerally have 30-90 days’ terms, are recognized and carried at original invoice amount less anallowance for any uncollectible amounts.
The Group’s loans and receivables include cash, receivables, and refundable deposits (includedunder other noncurrent assets) as of December 31, 2016 and 2015.

- 10 -
*SGVFS024032*
AFS investmentsAFS investments are non-derivative financial assets that are designated as such or do not qualifyto be categorized as designated as FVPL, HTM or loans and receivables. They are purchased andheld indefinitely, and may be sold in response to liquidity requirements or changes in marketconditions. AFS investments also include investments in unquoted equity instruments, where theGroup’s ownership interest is less than 20% or where control is likely to be temporary. These areinitially recorded at cost being the fair value of the investment at the time of acquisition, inclusiveof direct acquisition charges associated with the investment.
After initial measurement, AFS investments are subsequently measured at fair value. The Groupis precluded from measuring the instrument at fair value if the range of reasonable fair valueestimates is significant and the probabilities of the various estimates cannot be reasonablyassessed.
The unrealized gains and losses arising from the fair valuation of AFS investments are recognizedunder other comprehensive income. Investments in unquoted equity instruments are subsequentlycarried at cost due to the unpredictable nature of future cash flows and the lack of other suitablemethod for arriving at a reliable fair value.
When an AFS investment is disposed of, the cumulative gain or loss previously under the othercomprehensive income is recognized in the current operations. The losses arising fromimpairment of such investments are recognized as ‘Provision for impairment losses’ in the profitor loss.
As of December 31, 2016 and 2015, the Group has quoted and unquoted equity securities.
Other financial liabilitiesOther financial liabilities pertain to financial liabilities that are not held for trading or notdesignated as FVPL upon inception of the liability. These include liabilities arising fromoperations.
After initial measurement, accounts payable and similar financial liabilities not qualified as andnot designated as FVPL, are subsequently measured at amortized cost using the EIR method.Amortized cost is calculated by taking into account any discount or premium on the issue and feesthat are an integral part of the EIR.
The other financial liabilities of the Group include accounts payable and other liabilities, bankloans and finance lease liabilities, and security deposits (included under other noncurrentliabilities) as of December 31, 2016 and 2015.
Derecognition of Financial InstrumentsFinancial assetA financial asset (or, where applicable a part of a financial asset or part of a group of similarfinancial assets) is derecognized when:
∂ the rights to receive cash flows from the asset have expired;∂ the Group has transferred its rights to receive cash flows from the asset or has assumed an
obligation to pay the received cash flows in full without material delay to a third party under a‘pass-through’ arrangement; and either (a) the Group has transferred substantially all the risksand rewards of the asset, or (b) the Group has neither transferred nor retained substantially allthe risks and rewards of the asset, but has transferred control of the asset.

- 11 -
*SGVFS024032*
When the Group has transferred its right to receive cash flows from an asset or has entered into apass-through arrangement, and has neither transferred nor retained substantially all the risks andrewards of the asset nor transferred control of the asset, the asset is recognized to the extent of theGroup’s continuing involvement in the asset.
Continuing involvement that takes the form of a guarantee over the transferred asset is measuredat the lower of original carrying amount of the asset and the maximum amount of considerationthat the Group could be required to repay.
Financial liabilityA financial liability is derecognized when the obligation under the liability is discharged orcancelled or has expired. When an existing financial liability is replaced by another from thesame lender on substantially different terms, or the terms of an existing liability are substantiallymodified, such an exchange or modification is treated as a derecognition of the original liabilityand the recognition of a new liability and the difference in the respective carrying amounts isrecognized in profit or loss.
Impairment of Financial AssetsThe Group assesses at each reporting date whether there is objective evidence that a financialasset or a group of financial assets is impaired. A financial asset or a group of similar financialassets is deemed to be impaired if, and only if, there is objective evidence of impairment as aresult of one or more events that has occurred after the initial recognition of the asset (an incurred‘loss event’) and that loss event (or events) has an impact on the estimated future cash flows of thefinancial asset or the group of similar financial assets that can be reliably estimated. Evidence ofimpairment may include indications that the customer or a group of customers is experiencingsignificant financial difficulty, default or delinquency in interest or principal payments, theprobability that they will enter bankruptcy or other financial reorganization and when observabledata indicate that there is measurable decrease in the estimated future cash flows, such as changesin arrears or economic conditions that correlate with defaults.
Loans and receivablesFor financial assets carried at amortized cost, which include cash, receivables and refundabledeposits, the Group first assesses whether objective evidence of impairment exists individually forfinancial assets that are individually significant, or collectively for financial assets that are notindividually significant.
If the Group determines that no objective evidence of impairment exists for an individuallyassessed financial asset, whether significant or not, it includes the asset in a group of financialassets with similar credit risk characteristics and collectively assesses them for impairment.Assets that are individually assessed for impairment and for which an impairment loss is, orcontinues to be, recognized are not included in a collective assessment of impairment.
If there is objective evidence that an impairment loss has been incurred, the amount of the loss ismeasured as the difference between the assets carrying amount and the present value of estimatedfuture cash flows (excluding future expected credit losses that have not yet been incurred). Thepresent value of the estimated future cash flows is discounted at the financial assets original EIR.If a loan has a variable interest rate, the discount rate for measuring any impairment loss is thecurrent EIR.
The carrying amount of the asset is reduced through the use of an allowance account and theamount of the loss is recognized in profit or loss. Interest income continues to be accrued on thereduced carrying amount and is accrued using the rate of interest used to discount the future cash

- 12 -
*SGVFS024032*
flows for the purpose of measuring the impairment loss. The interest income is recorded in profitor loss. Loans, together with the associated allowance, are written off when there is no realisticprospect of future recovery and all collateral has been realized or has been transferred to thegroup. If, in a subsequent year, the amount of the estimated impairment loss increases ordecreases because of an event occurring after the impairment was recognized, the previouslyrecognized impairment loss is increased or reduced by adjusting the allowance account andcrediting ‘Recovery of impairment losses’ or debiting ‘Provision for impairment losses’ in profitor loss.
AFS investmentsFor AFS investments, the Group assesses at each reporting date whether there is objectiveevidence that a financial asset or group of similar financial assets is impaired.
In case of equity investments classified as AFS, objective evidence would include a significant orprolonged decline in the fair value of the investments below its cost. Where there is evidence ofimpairment, the cumulative loss, measured as the difference between the acquisition cost and thecurrent fair value, less any impairment loss on that financial asset, is removed from othercomprehensive income and charged to operations.
Impairment losses on equity investments are not reversed through the current income. Increasesand decreases in fair value subsequent to impairment are recognized directly in othercomprehensive income.
Investments in equity instruments that do not have a quoted market price in an active market andwhose fair value cannot be reliably measured shall be measured at cost subject to impairment.Evidence of impairment may include indications that the probability that the other party will enterbankruptcy or other financial reorganization and when observable data indicate that there ismeasurable decrease in the estimated future cash flows, such as changes in arrears or economicconditions that correlated with defaults.
If there is an objective evidence that an impairment loss has occurred on an unquoted equityinstruments that is not carried at fair value because the fair value cannot be measured reliably, theamount of the loss is measured as the difference between the asset’s carrying amount and thepresent value of the estimated future cash flows discounted at the current market rate of return fora similar financial asset.
Offsetting of Financial InstrumentsFinancial assets and financial liabilities are offset and the net amount reported in the consolidatedstatement of financial position if, and only if, there is a currently enforceable legal right to offsetthe recognized amounts and there is an intention to settle on a net basis, or to realize the asset andsettle the liability simultaneously. The Group assesses that it has a currently enforceable right ofoffset if the right is not contingent on a future event, and is legally enforceable in the normalcourse of business, event of default, and event of insolvency or bankruptcy of the Group and all ofthe counterparties.
InventoriesInventories are valued at the lower of cost and net realizable value (NRV). Cost of finished goodsand work-in-process inventories include direct materials, labor costs and a proportion ofmanufacturing overhead costs based on normal capacity, and is determined using the first-in,

- 13 -
*SGVFS024032*
first-out (FIFO) method. Costs of purchased raw materials, spare parts and supplies are stated atinvoice value determined using the FIFO method. NRV is the estimated selling price in theordinary course of business, less estimated costs of completion and marketing costs.
In determining the NRV, the Group considers factors such as the aging and future demand of theinventory, contractual arrangements with customers and the Group’s ability to redistributeinventory to other products or return inventory to suppliers.
Investment in AssociatesThe Group’s investment in associates is accounted for under the equity method of accounting. Anassociate is an entity in which the Group has significant influence. Significant influence is thepower to participate in the financial and operational policy decisions of the investee, but is notcontrol or joint control over those polices.
Under the equity method, the investment in associates is carried in the consolidated statement offinancial position at cost plus post-acquisition changes in the Group’s share in the net assets of theassociate.
The Group’s share of the results of operations of the associate is reflected in profit or loss. Wherethere has been a change recognized directly in the equity of the associate, the Group recognizes itsshare of any changes and discloses this, when applicable, in other comprehensive income.
The Group recognizes its share of the losses of the associate until its share of losses equals itsinterest in the associate. Once the Group’s investment is reduced to zero, additional losses areprovided for, and a liability is recognized to the extent the Group has incurred legal orconstructive obligations or made payments on behalf of the associate.
The reporting dates of the associate and the Group are identical and the associates’ accountingpolicies conform to those used by the Group for like transactions and events in similarcircumstances.
Property, Plant and EquipmentProperty, plant and equipment, except for land and construction in progress, are carried at costless accumulated depreciation and amortization and any impairment in value. The initial cost ofproperty and equipment comprises its purchase price, including import duties, taxes and anydirectly attributable costs of bringing the asset to its working condition and location for itsintended use. Subsequent replacement costs of parts of the property and equipment are capitalizedwhen the recognition criteria are met. Significant refurbishments and improvements arecapitalized when it can be clearly demonstrated that the expenditures have resulted in an increasein future economic benefits expected to be obtained from the use of an item of property andequipment beyond the originally assessed standard of performance. Costs of repairs andmaintenance are charged as expense when incurred.
Land is measured at cost less accumulated impairment losses recognized. Valuations areperformed frequently to ensure that the fair value of the asset does not differ materially from itscarrying amount.

- 14 -
*SGVFS024032*
Depreciation is computed using the straight-line method over the following estimated useful life(EUL) of each type of asset:
YearsMachineries and equipment 5-7Building and building improvements 5-30Tools and other equipment 5Plant water and airconditioning systems 5-15Furniture, fixtures and equipment 5Transportation equipment 5
The cost of the leasehold improvements is amortized over the lease term or EUL of theimprovements of seven (7) years, whichever is lower.
The EUL and the depreciation methods are reviewed at each financial year-end to ensure that theperiod and the methods of depreciation are consistent with the expected pattern of economicbenefits from items of property, plant and equipment.
The carrying values of property, plant and equipment are reviewed for impairment when events orchanges in circumstances indicate the carrying values may not be recoverable. If any suchindication exists and where the carrying values exceed the estimated recoverable amounts, theassets or cash generating units are written down to their recoverable amounts (see AccountingPolicy on Impairment of Non-Financial Assets).
Project under construction are stated at cost and shall be depreciated using the straight-linemethod when the development is completed or the assets are ready for their intended use.
The useful life and the depreciation method are reviewed and adjusted if appropriate, at eachfinancial year end, to ensure that the period and method of depreciation are consistent with theexpected pattern of economic benefits from items of property and equipment.
An item of property, plant and equipment is derecognized upon disposal or when no futureeconomic benefits are expected from its use or disposal. Any gain or loss arising on derecognitionof the asset (calculated as the difference between the net disposal proceeds and the carryingamount of the asset) is included in profit or loss in the year the asset is derecognized and the costand the related accumulated depreciation and any impairment in value, are removed from theaccounts.
Investment PropertiesInvestment properties are measured initially at cost, including transaction costs. The carryingamount includes the cost of replacing part of an existing investment property at the time that costis incurred if the recognition criteria are met; and excludes the costs of day-to-day servicing of aninvestment property.
Subsequent to initial recognition, investment properties, except for land, are carried at cost lessaccumulated depreciation and amortization and any impairment in value. Land is carried at costless impairment in value, if any.
Expenditures incurred after the investment properties have been put into operation, such as repairsand maintenance costs, are normally charged to operations in the period in which the costs areincurred.

- 15 -
*SGVFS024032*
Depreciation is calculated on a straight-line basis using the remaining useful lives from the time ofacquisition of the investment properties as follows:
YearsBuilding 30Building improvements 7
Investment properties are derecognized when either they have been disposed of, or when theinvestment property is permanently withdrawn from use and no future economic benefit isexpected from its disposal. Any gains or losses on the retirement or disposal of an investmentproperty are recognized in profit or loss in the year of retirement or disposal.
Transfers are made to or from investment properties when, and only when, there is a change in useevidenced by ending of owner-occupation, commencement of an operating lease to another partyor ending of construction or development. Transfers are made from investment properties toinventories when, and only when, there is a change in use evidenced by commencement of owner-occupation or commencement of development with a view of sale. For a transfer from investmentproperty to owner-occupied property, the deemed cost for subsequent accounting is the fair valueat the date of change in use. If owner-occupied property becomes an investment property, theGroup accounts for such property in accordance with the policy stated under property, plant andequipment up to the date of change in use.
Business CombinationsBusiness combinations are accounted for using the acquisition method. The cost of an acquisitionis measured as the aggregate of the consideration transferred, measured at fair value as at theacquisition date and the amount of any non-controlling interest in the acquiree. For each businesscombination, the acquirer measures the non-controlling interest in the acquiree either at fair valueor at the proportionate share of the acquiree’s identifiable net assets. Acquisition costs incurredare expensed and included in administrative expenses.
Changes in the Parent Company's ownership interest in a subsidiary that do not result in a loss ofcontrol are accounted for as equity transactions, i.e., transactions with owners in their capacity asowners.
In such circumstances, the carrying amounts of the controlling and non-controlling interests shallbe adjusted to reflect the changes in their relative interests in the subsidiary. Any differencebetween the amount by which the non-controlling interests are adjusted and the fair value of theconsideration paid or received shall be recognized directly in equity and attributed to the ownersof the Parent Company.
GoodwillGoodwill is initially measured at cost being the excess of the cost of the business combinationover the Group’s share in the net fair value of the acquiree’s identifiable assets, liabilities andcontingent liabilities.
After initial recognition, goodwill is measured at cost less any accumulated impairment losses.For the purpose of impairment testing, goodwill acquired in a business combination is, from theacquisition date, allocated to each of the Group’s cash generating units that are expected to benefitfrom the synergies of the combination, irrespective of whether other assets or liabilities of theacquiree are assigned to those units.
- 16 -
*SGVFS024032*
Where goodwill forms part of a cash-generating unit and part of the operation within that unit isdisposed of, the goodwill associated with the operation disposed of is included in the carryingamount of the operation when determining the gain or loss on disposal of the operation. Goodwilldisposed of in this circumstance is measured based on the relative values of the operation disposedof and the portion of the cash-generating unit retained.
The goodwill of the Group came from its acquisition of the remaining 30% share in Iomni.
Impairment of Non-Financial AssetsProperty, plant and equipment and investment propertiesThe Group assesses at each reporting date whether there is an indication that an asset may beimpaired. If any such indication exists, the Group makes an estimate of the asset’s recoverableamount. An asset’s recoverable amount is the higher of an asset’s or cash-generating unit’s fairvalue less costs to sell and its value in use and is determined for an individual asset, unless theasset does not generate cash inflows that are largely independent of those from other assets orgroups of assets. Where the carrying amount of an asset exceeds its recoverable amount, the assetis considered impaired and is written down to its recoverable amount. In assessing value in use,the estimated future cash flows are discounted to their present value using a pre-tax discount ratethat reflects current market assessments of the time value of money and the risks specific to theasset. Impairment losses of continuing operations are recognized in profit or loss in those expensecategories consistent with the function of the impaired asset.
An impairment loss is charged to operations in the year in which it arises, unless the asset iscarried at a revalued amount, in which case the impairment loss is charged to the revaluationincrement of the said asset.
An assessment is made at each reporting date as to whether there is any indication that previouslyrecognized impairment losses may no longer exist or may have decreased. If such indicationexists, the recoverable amount is estimated. A previously recognized impairment loss is reversedonly if there has been a change in the estimates used to determine the asset’s recoverable amountsince the last impairment loss was recognized. If that is the case, the carrying amount of the assetis increased to its recoverable amount. That increased amount cannot exceed the carrying amountthat would have been determined, net of depreciation, had no impairment loss been recognized forthe asset in prior years. Such reversal is recognized in profit or loss unless the asset is carried atrevalued amount, in which case, the reversal is treated as a revaluation increase. After suchreversal the depreciation charge is adjusted in future periods to allocate the asset’s revisedcarrying amount, less any residual value, on a systematic basis over its remaining useful life.
GoodwillThe Group assesses whether there are any indicators that goodwill is impaired at each reportingdate. Goodwill is tested for impairment annually as at December 31 and when circumstancesindicate that the carrying value may be impaired.
Impairment is determined for goodwill by assessing the recoverable amount of the cash-generating units, to which the goodwill relates. An impairment loss is recognized when therecoverable amount of the cash-generating units is less than their carrying amount. Impairmentlosses relating to goodwill cannot be reversed in subsequent periods.

- 17 -
*SGVFS024032*
Investments in associatesAfter application of the equity method, the Group determines whether it is necessary to recognizean additional impairment loss of the Group’s investments in its associates. The Group determinesat each reporting date whether there is any objective evidence that investment in associate isimpaired. If this is the case, the Group calculates the amount of impairment being the differencebetween the fair value of the investment in associate and the acquisition cost and recognizes theamount in profit or loss.
Advances from customersThis account pertains to advances received from the customers to be used by the Group topurchase raw materials and cover aging inventories. Advances from customers are recognizedwhen cash is received and is measured at cost.
Foreign Currency-denominated Transactions and TranslationTransactions in foreign currencies are recorded using the exchange rate at the date of transactions.Foreign exchange gains or losses arising from foreign currency transactions and revaluationadjustments of foreign currency assets and liabilities are credited to or charged against currentoperations. Monetary assets and liabilities denominated in foreign currencies are translated usingthe foreign exchange rate prevailing at reporting date. All differences are taken to profit or loss.Non-monetary items that are measured in terms of historical cost in a foreign currency aretranslated using the exchange rates on the dates of the initial transactions. Non-monetary itemsmeasured at fair value in a foreign currency are translated using the exchange rate at the date whenthe fair value was determined.
EquityCapital stock is measured at par value for all shares issued and outstanding. When the Groupissues more than one class of stock, a separate account is maintained for each class of stock andthe number of shares issued. When the shares are sold at premium, the difference between theproceeds and the par value is credited to “Additional paid-in capital” account.
Direct costs incurred related to equity issuance, such as underwriting, accounting and legal fees,printing costs and taxes are chargeable to “Additional paid-in capital” account. If additional paid-in capital is not sufficient, the excess is charged against retained earnings.
Retained earnings represent accumulated earnings of the Group and any adjustments arising fromapplication of new accounting standards, policies or correction of errors applied retrospectively,less dividends declared. The individual accumulated earnings of the subsidiaries and accumulatedequity earnings from associates included in the consolidated retained earnings are available fordividend declaration when these are likewise declared as dividends by the subsidiaries andassociates as approved by their respective BOD.
Retained earnings are further restricted for the payment of dividends to the extent of the cost ofcommon shares held in treasury.
Treasury SharesOwn equity instruments which are reacquired (treasury shares) are recognized at cost anddeducted from equity. No gain or loss is recognized in profit or loss on the purchase, sale, issueor cancellation of the Group’s own equity instruments.

- 18 -
*SGVFS024032*
Earnings Per ShareBasic earnings per share (EPS) is computed by dividing net income for the year attributable toordinary equity holders of the Parent Company by the weighted average number of commonshares issued and outstanding during the year, after giving retrospectively adjustment to any stockdividend declared or stock split made during the year.
Diluted earnings per share is calculated by dividing the net income attributable to commonshareholders by the weighted average number of common shares outstanding during the yearadjusted for the effects of any dilutive potential common shares.
Revenue RecognitionRevenue is recognized to the extent that it is probable that the economic benefits will flow to theGroup and the revenue can be reliably measured. Regardless of when the payment is being made,revenue is measured at fair value of the consideration received or receivable, taking into accountcontractually defined terms of payment and excluding taxes or duty. The Group assesses itsrevenue recognition arrangements against specific criteria in order to determine if it is acting asprincipal or agent. The Group has concluded that it is acting as a principal in all arrangements.
The following specific recognition criteria must also be met before revenue is recognized:
SalesRevenue from sales is recognized upon shipment of packaged electronic products or when thepackaged electronic products are accepted by the customer, depending on the specific agreementwith each customer, title and risk of ownership have been transferred to the customer, the price tobe paid by the customer is fixed or determinable and the recoverability is reasonably assured.
Generally, there are no formal customer acceptance requirements or future obligations related tomanufacturing services. If such requirements exist, revenue is recognized at the time suchprovisions or requirements are completed and obligations are already fulfilled.
Rental incomeRental income arising from operating leases on investment properties is accounted for on astraight-line basis over the lease terms of ongoing leases.
Dividend incomeDividend income is recognized when the Group’s right to receive the dividends is established.Dividend income is included in the “Other income” account in profit or loss.
Interest incomeInterest income is recognized as interest accrues taking into account the effective yield on theasset. Interest income is included in the “Other income” account in profit or loss.
Costs and ExpensesCosts and expenses encompass losses as well as those expenses that arise in the course of theordinary activities and incidental of the Group. Cost and expenses are generally measured at theamount paid or payable.

- 19 -
*SGVFS024032*
The following specific recognition criteria must also be met before costs and expenses arerecognized:
Cost of salesCost of sales includes all expenses associated with the sale of goods. This includes all materialsand supplies used, direct labor and overhead costs related to production. Such costs arerecognized when the related sales have been recognized.
Cost of rental servicesCost of rental services includes all direct expenses associated with operating leases. This includesdepreciation, real property taxes, repairs and maintenance and salaries and wages related to themaintenance of investment properties. Such costs are recognized when incurred.
Operating expensesOperating expenses constitute costs which are directly related to selling, advertising and deliveryof goods to customers and costs of administering the business. These are recognized whenincurred.
LeasesThe determination of whether an arrangement is, or contains a lease is based on the substance ofthe arrangement and requires an assessment of whether the fulfillment of the arrangement isdependent on the use of a specific asset or assets and the arrangement conveys a right to use theasset, even if that right is not explicitly specified in an arrangement.
Operating lease - Group as a LesseeLeases where the lessor retains substantially all the risks and benefits of ownership of the asset areclassified as operating leases. Operating lease payments are recognized as an expense in profit orloss on a straight-line basis over the lease term.
Operating lease - Group as a LessorLeases where the Group does not transfer substantially all the risk and benefits of ownership ofthe assets are classified as operating leases. Collections of operating lease payments arerecognized as an income in profit or loss on a straight-line basis over the lease term.
Initial direct costs incurred in negotiating operating leases are added to the carrying amount of theleased asset and recognized over the lease term on the same basis as the rental income.Contingent rents are recognized as revenue in the period in which they are earned.
Finance lease - Group as a LesseeLeases where the lessor transfer substantially all the risk and benefits of ownership of the leaseditem, are capitalized at the inception of the lease at fair value of the leased property or, if lower, atthe present value of the minimum leased payments. Lease payments are apportioned between thefinance charges and reduction of the lease liability so as to achieve a constant rate of interest onthe remaining balance of the liability. Finance charges are charged directly against income.Capitalized leased assets are depreciated over the shorter of the estimated useful lives of the assetsor the respective lease terms.
A leased asset is depreciated over the useful life of the asset. However, if there is no reasonablecertainty that the Group will obtain ownership by the end of the leased term, the asset isdepreciated over the shorter of the estimated useful life of the asset and the lease term.

- 20 -
*SGVFS024032*
Pension ExpenseThe net defined benefit liability or asset is the aggregate of the present value of the defined benefitobligation at the end of the reporting period reduced by the fair value of plan assets (if any),adjusted for any effect of limiting a net defined benefit asset to the asset ceiling. The asset ceilingis the present value of any economic benefits available in the form of refunds from the plan orreductions in future contributions to the plan.
The cost of providing benefits under the defined benefit plans is actuarially determined using theprojected unit credit method.
Defined benefit costs comprise the following:
∂ Service costs∂ Net interest on the net defined benefit liability or asset∂ Remeasurements of net defined benefit liability or asset
Service costs which include current service costs, past service costs and gains or losses on non-routine settlements are recognized as expense in profit or loss. Past service costs are recognizedwhen plan amendment or curtailment occurs.
These amounts are calculated periodically by independent qualified actuary.
Net interest on the net defined benefit liability or asset is the change during the period in the netdefined benefit liability or asset that arises from the passage of time which is determined byapplying the discount rate based on government bonds to the net defined benefit liability or asset.Net interest on the net defined benefit liability or asset is recognized as expense or income inprofit or loss.
Remeasurements comprising actuarial gains and losses, return on plan assets and any change inthe effect of the asset ceiling (excluding net interest on defined benefit liability) are recognizedimmediately in OCI in the period in which they arise. Remeasurements are not reclassified toprofit or loss in subsequent periods. All remeasurements recognized in OCI account“Remeasurement gains (losses) on retirement plans” are not reclassified to another equity accountin subsequent periods.
Plan assets are assets that are held by a long-term employee benefit fund or qualifying insurancepolicies. Plan assets are not available to the creditors of the Group, nor can they be paid directlyto the Group. Fair value of plan assets is based on market price information. When no marketprice is available, the fair value of plan assets is estimated by discounting expected future cashflows using a discount rate that reflects both the risk associated with the plan assets and thematurity or expected disposal date of those assets (or, if they have no maturity, the expectedperiod until the settlement of the related obligations). If the fair value of the plan assets is higherthan the present value of the defined benefit obligation, the measurement of the resulting definedbenefit asset is limited to the present value of economic benefits available in the form of refundsfrom the plan or reductions in future contributions to the plan.
The Group’s right to be reimbursed of some or all of the expenditure required to settle a definedbenefit obligation is recognized as a separate asset at fair value when and only whenreimbursement is virtually certain.

- 21 -
*SGVFS024032*
Termination benefitTermination benefits are employee benefits provided in exchange for the termination of anemployee’s employment as a result of either an entity’s decision to terminate an employee’semployment before the normal retirement date or an employee’s decision to accept an offer ofbenefits in exchange for the termination of employment.
A liability and expense for a termination benefit is recognized at the earlier of when the entity canno longer withdraw the offer of those benefits and when the entity recognizes related restructuringcosts. Initial recognition and subsequent changes to termination benefits are measured inaccordance with the nature of the employee benefit, as either post-employment benefits, short-term employee benefits, or other long-term employee benefits.
Employee leave entitlementEmployee entitlements to annual leave are recognized as a liability when they are accrued to theemployees. The undiscounted liability for leave expected to be settled wholly within twelvemonths after the end of the annual reporting period is recognized for services rendered byemployees up to the end of the reporting period.
Borrowing CostsBorrowing costs are capitalized if these are directly attributable to the acquisition, construction orproduction of a qualifying asset. Capitalization of borrowing costs commences when theactivities for the asset’s intended use are in progress and expenditures and borrowing costs arebeing incurred. Borrowing costs are capitalized until the assets are ready for their intendeduse. These include interest charges and other related financing charges incurred in connectionwith the borrowing of funds. Other borrowing costs are expensed as incurred.
Income TaxesCurrent income taxCurrent income tax assets and liabilities for the current and prior periods are measured at theamount expected to be recovered from or paid to taxation authorities. Tax rates and tax laws usedto compute the amount are those that are enacted or substantially enacted at the reporting date.
Deferred income taxDeferred income tax is determined, using the balance sheet liability method, on all temporarydifferences at the reporting date between the tax bases of assets and liabilities and their carryingamounts for financial reporting purposes.
Deferred income tax liabilities are recognized for all taxable temporary differences, with certainexceptions. Deferred income tax assets are recognized for all deductible temporary differences,carryforward of unused tax credits from the excess of minimum corporate income tax (MCIT)over the regular corporate income tax (RCIT), and unused net operating loss carryover (NOLCO),to the extent that it is probable that sufficient taxable income will be available against which thedeductible temporary differences and carryforward of unused tax credits from MCIT and unusedNOLCO can be utilized. Deferred income tax, however, is not recognized on temporarydifferences that arise from the initial recognition of an asset or liability in a transaction that is nota business combination and, at the time of the transaction, affects neither the accounting incomenor taxable income.

- 22 -
*SGVFS024032*
Deferred income tax liabilities are not provided on non-taxable temporary differences associatedwith investments in domestic subsidiaries and associates. With respect to investments in foreignsubsidiaries and associates, deferred income tax liabilities are recognized, except where the timingof the reversal of the temporary difference can be controlled and it is probable that the temporarydifference will not reverse in the foreseeable future.
The carrying amount of deferred tax assets is reviewed at each reporting date and reduced to theextent that it is no longer probable that sufficient taxable income will be available to allow all orpart of the deferred tax assets to be utilized. Deferred income tax assets and liabilities aremeasured at the tax rates that are applicable to the period when the asset is realized or the liabilityis settled, based on tax rates (and tax laws) that have been enacted or substantively enacted at thereporting date.
Deferred tax relating to items recognized in OCI or directly in equity is recognized in thestatement of comprehensive income and statement of changes in equity and not in profit orloss. Deferred tax assets and deferred tax liabilities are offset if a legally enforceable right existsto offset current tax assets against current tax liabilities and the deferred taxes relate to the sametaxable entity and the same taxation authority.
Deferred income tax assets and deferred income tax liabilities are offset if a legally enforceableright exists to offset current tax assets against current tax liabilities and deferred income taxesrelate to the same taxable entity and the same taxation authority.
ProvisionsProvisions are recognized when the Group has a present obligation (legal or constructive) as aresult of a past event and it is probable that an outflow of resources embodying economic benefitswill be required to settle the obligation and a reliable estimate can be made of the amount of theobligation.
ContingenciesContingent liabilities are not recognized in the consolidated financial statements but are disclosedunless the possibility of an outflow of resources embodying economic benefits is remote.Contingent assets are not recognized but are disclosed in the consolidated financial statementswhen an inflow of economic benefits is probable.
SegmentA segment is a distinguishable component of the Group that is engaged in providing products orservices (business segment) and is subject to risks and rewards that are different from othersegments. Segment assets and liabilities reported are those assets and liabilities included in measuresthat are used by the chief operating decision maker.
Events after the Reporting PeriodPost-year-end events that provide additional information about the Group’s position at thereporting date (adjusting events) are reflected in the consolidated financial statements. Post-year-end events that are not adjusting events are disclosed in the notes when material to theconsolidated financial statements.

- 23 -
*SGVFS024032*
3. Significant Accounting Judgments, Estimates and Assumptions
The preparation of the accompanying consolidated financial statements in compliance with PFRSrequires management to make judgments, estimates and assumptions that affect the reportedamounts of assets, liabilities, income and expenses and disclosure of contingent assets andcontingent liabilities, at the reporting date. The judgments, estimates and assumptions used in theconsolidated financial statements are based on management’s evaluation of relevant facts andcircumstances as of the date of the Group’s consolidated financial statements. Actual resultscould differ from such estimates.
Judgments, estimates and assumptions are continually evaluated and are based on historicalexperience and other factors, including expectations of future events that are believed to bereasonable under the circumstances.
JudgmentsIn the process of applying the Group’s accounting policies, management has made the followingjudgments, apart from those involving estimations, which have the most significant effect on theamounts recognized in the consolidated financial statements:
Determination of functional currencyThe Group has revenue and costs and expenses denominated in various currencies, mainly in U.S.Dollar, Philippine Peso and Japanese Yen. The Group determines the functional currency basedon economic substance of underlying circumstances relevant to the Group. The functionalcurrency has been determined to be the U.S. dollar since its revenues and expenses aresubstantially denominated in U.S. dollar.
Operating lease commitments - Group as a LessorThe Group has entered into commercial property leases on its investment property portfolio. Alease is classified as a finance lease if it transfers substantially all the risks and rewards incidentalto ownership.
The following indicators, individually or in combination, would normally lead to a lease beingclassified as a finance lease:
∂ the lease does transfer ownership of the asset to the lessees by the end of the lease term;∂ the lessee has the option to purchase the asset at a price that is expected to be sufficiently
lower than the fair value at the date the option becomes exercisable for it to be reasonablycertain, at the inception of the lease, that the option will be exercised;
∂ the lease term is for the major part of the economic life of the asset even if title is nottransferred;
∂ at the inception of the lease the present value of the minimum lease payments amounts to atleast substantially all of the fair value of the leased asset; and
∂ the leased assets are of such a specialized nature that only the lessee can use them withoutmajor modifications.
For all lease agreements, the Group determined that no indicators exist to consider the leasecommitments as a finance lease. The Group retains all the significant risks and rewards ofownership of these properties and therefore, all leases are accounted for as operating leases(see Note 24).

- 24 -
*SGVFS024032*
Operating lease commitments - Group as a LesseeThe Group has entered into commercial property leases. The Group has determined, based on theterms and conditions of the lease agreements and finance lease indicators previously set forth, thatit has not acquired all the significant risks and rewards of ownership of the leased properties andso accounts for the contracts as operating leases (see Note 24).
Finance lease commitments - Group as a LesseeThe Group leases certain machineries and equipment and has determined, based on an evaluationof the terms and conditions of the agreements, that the lessor transfers substantially all the risk andbenefits incidental to ownership of the leased properties to the Group, thus, the Group recognizesthese leases as finance leases (see Note 24).
Impairment of property, plant and equipment and investment propertiesThe Group reviews its property and equipment for impairment and investment properties. Thisincludes considering certain indicators of impairment such as the following:
∂ Significant or prolonged decline in the fair value of the asset;∂ Increase in market interest rates or other market rates of return on investments have increased
during the period, and those increases are likely to affect the discount rate used in calculatingthe asset’s value in use and decrease the asset’s recoverable amount materially;
∂ Significant underperformance relative to expected historical or projected future operatingresults;
∂ Significant changes in the manner of use of the acquired assets or the strategy for overallbusiness; or
∂ Significant negative industry or economic trends.
In 2014, the Group recognized impairment loss on its investment properties amounting toUS$0.06 million. As of December 31, 2016 and 2015, management assessed that these indicatorsno longer exist.
The carrying value of the Group’s property, plant and equipment amounted to US$15.38 millionand US$13.07 million as of December 31, 2016 and 2015, respectively (see Note 12). Thecarrying value of the Group’s investment properties amounted to US$5.61 million and US$5.64million as of December 31, 2016 and 2015, respectively (see Note 13).
Significant influence over ICCP SBI Venture Partners (Hong Kong) Limited (ISVP-HK)The Group assessed that it has significant influence over ISVP-HK despite having ownershipinterest of below 20%. Management assessed that it has the power to participate in the financialand operating policy decisions of ISVP-HK through its representation in ISVP-HK’s BOD.Accordingly, ISVP-HK is accounted for as an associate (see Note 11).
Estimates and AssumptionsThe key assumptions concerning the future and other key sources of estimation uncertainty at thereporting date, that have a significant risk of causing material adjustment to the carrying amountsof assets and liabilities within the next financial year are discussed below.
Impairment of AFS investmentsThe Group treats AFS investments as impaired when there has been a significant or prolongeddecline in the fair value below its cost or where other objective evidence of impairment exists.The determination of what is ‘significant’ or ‘prolonged’ requires judgment. The Group treats

- 25 -
*SGVFS024032*
‘significant’ generally as 20% or more and ‘prolonged’ as greater than six months for quotedsecurities. In addition, the Group evaluates other factors, including the future cash flows and thediscount factors of these securities.
The Group has recognized impairment loss on its AFS investment amounting to US$0.06 million,US$0.003 million and US$0.71 million in 2016, 2015 and 2014, respectively (see Note 21). Thecarrying value of the Group’s AFS investments as at December 31, 2016 and 2015 amounted toUS$2.73 million and US$2.88 million, respectively (see Note 10).
Impairment of receivablesThe Group reviews its receivable portfolio to assess impairment annually based on the factors thataffect the collectability of the account. The Group reviews the age and status of receivables andidentifies accounts that are to be provided with allowance on a continuous basis. Judgment bymanagement is required in the estimation of the amount and timing of future cash flows whendetermining the level of allowance required. Such estimates are based on assumptions about anumber of factors and actual results may differ, resulting in future changes to the allowance.
In addition to specific allowance against individually significant receivables, the Group alsomakes a collective impairment allowance against exposures which, although not specificallyidentified as requiring a specific allowance, have a greater risk of default than when originallygranted. The amount and timing of recorded expenses and reversal for any period would differ ifthe Group made different judgments or utilized different estimates.
An increase in the allowance account for impairment would increase recorded operating expensesand decrease current assets and otherwise for reversals.
The Group recognized provision for impairment loss and direct write-off of receivablesamounting to US$0.16 million, US$0.07 million and US$0.15 million in 2016, 2015 and 2014,respectively (see Note 21). As of December 31, 2016 and 2015, the carrying amount ofreceivables of the Group amounted to US$11.38 million and US$14.11 million, respectively (seeNote 8).
Provision for inventory obsolescenceThe Group reviews its inventory levels to assess impairment at least on a quarterly basis. Thesemiconductor industry is characterized by rapid technological change, short-term customercommitments and rapid changes in demand. Impairment losses are provided on excess andobsolete inventory based on regular reviews of inventories on hand, and the latest forecasts ofproduct demand and product requirements from customers. If actual market conditions orcustomer’s product demands are less favorable than those forecasted, additional impairment lossis recognized. An increase in allowance for inventory obsolescence would increase recordedoperating expenses and decrease current assets.
The Group’s allowance for inventory obsolescence amounted to US$0.29 million andUS$0.16 million as of December 31, 2016 and 2015, respectively. The carrying value ofinventories of the Group amounted to US$8.21 million and US$11.66 million as of December 31,2016 and 2015, respectively (see Note 9).
Estimation of pension liabilityThe cost of defined benefit pension plans and other post-employment medical benefits as well asthe present value of the pension obligation are determined using actuarial valuations.

- 26 -
*SGVFS024032*
The actuarial valuation involves making various assumptions. These include the determination ofthe discount rates, future salary increases and mortality rates. Due to the complexity of thevaluation, the underlying assumptions and its long-term nature, defined benefit obligations arehighly sensitive to changes in discount rate and future salary increase rate assumptions. Allassumptions are reviewed at each reporting date. While the Group believes that the assumptionsare reasonable and appropriate, significant differences between actual experiences andassumptions may materially affect the cost of employee benefits and related obligations.
The net pension liability as at December 31, 2016 and 2015 amounted to US$2.59 million andUS$2.52 million, respectively (see Note 28).
Impairment of investments in associatesThe Group reviews its investments in associates. This includes considering certain indicators ofimpairment such as the following:
∂ Significant or prolonged decline in the fair value of the asset;∂ Significant changes with an adverse effect that have taken place in the technological, market,
economic or legal environment where the associate operates;∂ Significant changes in the manner of use of the acquired assets or the strategy for overall
business.
No impairment loss was recognized for investments in associates in 2016, 2015 and 2014. Thecarrying value of investments in associates of the Group amounted to US$0.68 million andUS$0.12 million as of December 31, 2016 and 2015 (see Note 11).
Impairment testing of goodwillGoodwill is tested for impairment annually and when circumstances indicate that the carryingvalue may be impaired. In 2015, the recoverable amount of goodwill has been determined basedon the value in use calculations using cash flow projections from financial budgets approved bythe BOD covering a five year period and assumptions for the terminal value. Financial budgetsare based on actual customer orders and those anticipated orders that are close to finalization. Thepretax discount rate applied to cash flow projection is 9.02% and growth rate of 0%.
In 2016, due to decline in sales and increasing production costs of various products of the cashgenerating unit to which the goodwill relates to, the cash generating unit reported a net loss andgenerated negative operating cash flows. Accordingly, the related goodwill amounting to US$0.22million was impaired in full in 2016 (see Note 21).
Recognition of deferred income tax assetsThe Group reviews the carrying amounts of deferred income tax assets at each reporting date andreduces the deferred income tax assets to the extent that it is no longer probable that sufficienttaxable income will be available to allow all or part of the deferred income tax assets to beutilized. Significant management judgment is required to determine the amount of deferredincome tax assets that can be recognized, based upon the likely timing and level of future taxableincome together with future tax planning strategies.
The Group did not recognize deferred tax assets on temporary differences and carry forwardbenefits of NOLCO and MCIT as of December 31, 2016 and 2015 since management believesthat it is reasonably probable that sufficient taxable profit and provision for normal tax will not beavailable against which the deductible temporary differences can be utilized (see Note 26).

- 27 -
*SGVFS024032*
4. Financial Risk Management Objectives and Policies
Risk Management StructureAll policy directions, business strategies and management initiatives emanate from the BODwhich strives to provide the most effective leadership for the Group. The BOD endeavors toremain steadfast in its commitment to provide leadership, direction and strategy by regularlyreviewing the Group’s performance. For this purpose, the BOD convenes in quarterly meetingsand in addition, is available to meet in the interim should the need arise.
The Group has adopted internal guidelines setting forth matters that require BOD approval.Under the guidelines, all new investments, any increase in investment in business and subsidiaryand any divestments require BOD approval.
The normal course of the Group’s business exposes it to a variety of financial risks such as creditrisk, liquidity risk and market risks which include interest rate risk, equity price risk and foreigncurrency risk exposures.
The Group has various financial assets such as cash, receivables, AFS investments and refundabledeposits. The Group’s principal financial liabilities consist of accounts payable and otherliabilities, bank loans, and security deposits. The main purpose of these financial liabilities is toraise funds for the Group’s operations.
Credit RiskCredit risk is the risk of loss resulting from the failure of a borrower or counterparty to perform itsobligations during the life of the transaction. This includes the risk of non-payment by banks andcustomers, failed settlement of transactions and default on contracts. Management has a creditpolicy in place and the exposures to these credit risks are monitored on an ongoing basis.
The Group’s credit risk management involves entering into arrangements only with counterpartieswith acceptable credit standing and that are duly approved by the BOD. The Group’s receivablesare monitored on a regular basis resulting to insignificant exposure to bad debts.
The Group does not hold any collateral from its customers thus, the carrying amounts of cash,receivables, AFS investments and refundable deposits approximate the Group’s maximumexposure to credit risk. No other financial assets carry a significant exposure to credit risk.
The Group performs ongoing credit evaluation of its customers’ financial condition and providesfor impairment losses based on the outcome of its credit evaluations.
Concentration of credit riskThe Group has concentration of credit risk due to sales to significant customers. One customeraccounted for approximately 19.33% and 43.21% of net sales in 2016 and 2015, respectively. In2016, the financial assets of the Group are more concentrated to the telecom, banks and financialintermediaries and computer peripherals which accounted for 85.58% of the total financial assets.In 2015, it is more concentrated to the telecom, banks and financial intermediaries and consumerelectronics which accounted for 89.23% of the total financial assets.
The Group’s financial instruments are broadly diversified along industry, product and geographiclines, and transactions are entered into with a range of counterparties, thereby mitigating anysignificant concentration of credit risk.

- 28 -
*SGVFS024032*
An industry sector analysis of the Group’s exposure to credit risk is as follows:
2016 2015Banks and financial intermediaries US$13,129 US$10,374Telecommunications (Telecom) 5,896 12,410Computer peripherals 2,239 816Consumer electronics 1,390 1,835Automotive 856 986Real estate 607 196Others 679 972Total US$24,796 US$27,589
The following tables below summarize the credit quality of the Group’s financial assets (gross ofallowance for credit and impairment losses) as at December 31, 2016 and 2015:
2016
Neither Past Due nor Individually ImpairedPast Due
but not IndividuallyMinimal Risk Average Risk High Risk Impaired Impaired Total
Cash in bank US$13,129 US$− US$− US$− US$− US$13,129Receivables Trade receivables 7,724 − − 1,198 151 9,073 Other receivables from customers 1,380 − − 182 55 1,617 Rent receivables 199 − − − − 199 SSS claims receivables 15 − − − − 15 Advances to managers and employees* 51 − − − − 51 Others** 320 − − 194 5 519Refundable deposits 404 − − − − 404
US$23,222 US$− US$− US$1,574 US$211 US$25,007*Excludes non-financial assets amounting to US$0.06 million.** Excludes non-financial assets amounting to US$0.06 million.
2015
Neither Past Due nor Individually ImpairedPast Due
but not IndividuallyMinimal Risk Average Risk High Risk Impaired Impaired Total
Cash in bank US$10,180 US$− US$− US$− US$− US$10,180Receivables Trade receivables 9,794 − − 2,019 50 11,863 Other receivables from customers 548 − − 790 − 1,338 Rent receivables 189 − − − − 189 SSS claims receivables 22 − − − − 22 Advances to managers and employees* 29 − − − − 29 Others 552 − − 107 2 661 Refundable deposit 420 − − − − 420
US$21,734 US$− US$− US$2,916 US$52 US$24,702*Excludes non-financial assets amounting to US$0.06 million.
The Group classifies credit quality risk as follows:
Minimal risk - accounts with a high degree of certainty in collection, where counterparties haveconsistently displayed prompt settlement practices, and have little to no instance of defaults ordiscrepancies in payment.
Average risk - active accounts with minimal to regular instances of payment default, due toordinary/common collection issues, but where the likelihood of collection is still moderate to highas the counterparties are generally responsive to credit actions initiated by the Group.

- 29 -
*SGVFS024032*
High risk - accounts with low probability of collection and can be considered impaired based onhistorical experience, where counterparties exhibit a recurring tendency to default despite constantreminder and communication, or even extended payment terms.
The Group maintains cash with various financial institutions that management believes to be ofhigh credit quality. The Group’s policy is to invest with financial institution from which it hasoutstanding loans and loan facilities.
The tables below show the analysis of receivables that are past due but not impaired as atDecember 31, 2016 and 2015, respectively:
2016<30
days30-60days
61-90days
91-120days
>120days Total
Trade receivables US$640 US$359 US$140 US$8 US$51 US$1,198Other receivables from customers 33 44 61 7 37 182Others 10 3 1 12 168 194
US$683 US$406 US$202 US$27 US$256 US$1,574
2015<30
days30-60days
61-90days
91-120days
>120days Total
Trade receivables US$1,763 US$89 US$30 US$28 US$109 US$2,019Other receivables from customers 337 217 104 60 72 790Others − − − − 107 107
US$2,100 US$306 US$134 US$88 US$288 US$2,916
Liquidity RiskLiquidity risk is the risk of not being able to meet funding obligations such as the repayment ofliabilities or payment of asset purchases. Short-term funding is obtained to finance cashrequirements for capital expenditures and operations. Amount of credit lines are obtained fromdesignated banks duly approved by the BOD. Surplus funds are placed with reputable banks towhich the Group has outstanding loans and loan facilities. The Group’s policy is to regularlymonitor its liquidity requirements and its compliance with lending covenants, to ensure that itmaintains sufficient reserves of cash and highly liquid marketable securities and adequatecommitted lines of funding from major financial institutions to meet the short and longer termliquidity requirements of the Group.
The tables below show the maturity profile of the financial assets and financial liabilities, based onits internal methodology that manages liquidity based on remaining contractual maturities:
2016
On demandLess than3 months
3 to 12months
1 to 5years Total
Financial assetsCash US$13,144 US$− US$− US$− US$13,144Receivables 1,778 9,345 139 − 11,262
14,922 9,345 139 − 24,406
(Forward)

- 30 -
*SGVFS024032*
2016
On demandLess than3 months
3 to 12months
1 to 5years Total
Financial liabilitiesAccounts payable and other
liabilities * US$1,931 US$4,669 US$236 US$− US$6,836Bank loans and finance lease
liabilities ** − 250 750 1,218 2,218Security deposits − − − 438 438
1,931 4,919 986 1,656 9,492Liquidity gap US$12,991 US$4,426 (US$847) (US$1,656) US$14,914
*Excluding cash advances from an investee for future dividend income amounting to US$0.06 million.**Including future interest payable amounting to US$0.06 million
2015
On demandLess than3 months
3 to 12months
1 to 5years Total
Financial assetsCash US$10,284 US$− US$− US$− US$10,284Receivables 3,234 10,710 114 − 14,058
13,518 10,710 114 − 24,342Financial liabilitiesAccounts payable and other
liabilities* 585 9,775 111 33 10,504Bank loans and finance lease
liabilities ** 63 52 475 1,058 1,648Security deposits − − − 1,127 1,127
648 9,827 586 2,218 13,279Liquidity gap US$12,870 US$883 (US$472) (US$2,218) US$11,063
*Excluding cash advances from an investee for future dividend declaration amounting to US$0.06 million.**Including future interest payable amounting to US$0.08 million
Market RiskMarket risk is the risk of loss to future earnings, to fair value or future cash flows of a financialinstrument as a result of changes in its price, caused by changes in interest rates, equity prices andforeign currency exchange rates and other market factors.
Interest rate riskInterest rate risk is the risk that the value of a financial instrument will fluctuate because ofchanges in interest rates. The Group follows a prudent policy in managing its assets and liabilitiesso as to ensure that exposure to fluctuation in interest rates are kept within acceptable limits.
Sensitivity analysisThe Group does not perform sensitivity analysis on its cash and bank loans since the Groupexpects that the effect of the change in interest rates will have insignificant effect on the Group’soperations.
Equity price riskThe Group’s equity price risk exposure at year-end relates to financial assets whose values willfluctuate as a result of changes in market prices, principally, quoted equity securities classified asAFS investments.
Quoted AFS investments are subject to price risk due to changes in market values of instrumentsarising either from factors specific to individual instruments or their issuers or factors affecting allinstruments traded in the market.

- 31 -
*SGVFS024032*
The analysis below is performed for reasonably possible movements in the market index with allother variables held constant, showing the impact on equity both in 2016 and 2015.
2016 2015
% reasonablypossible change
Effect onother
comprehensiveincome
% reasonablypossible change
Effect onother
comprehensiveincome
US NASDAQ +28% US$16 +26% US$3-28% (16) -26% (3)
The Group assessed that investments in Philippines Stock Exchange is exposed to insignificantchanges in market values.
Foreign currency riskForeign currency risk is the risk that the fair value or future cash flows of a financial instrumentwill fluctuate because of changes in foreign exchange rates. The Group is exposed to currencyrisk primarily through purchases that are denominated in a currency other than the functionalcurrency of the Group. The currency giving rise to this risk is primarily Philippine Peso (P=) andJapanese Yen (¥). It is the Group’s policy not to trade in derivative contracts. In addition, theGroup believes that its profile of foreign currency exposure on its assets and liabilities is withinconservative limits in the type of business in which the Group is engaged.
The table below details the Group’s exposure at the reporting date to currency risk arising fromforecasted transactions or recognized assets or liabilities denominated in a currency other than thefunctional currency of the Group.
Philippine Peso
2016 2015
In US DollarIn Philippine
Peso In US DollarIn Philippine
PesoCash US$927 P=46,105 US$868 P=40,856Receivables 1,262 62,732 935 43,985AFS investments 771 38,324 981 46,174Refundable deposits 446 22,154 469 22,053
3,406 169,315 3,253 153,068Less: Accounts payable and other liabilities 1,798 89,411 1,889 88,899Net exposure arising from recognized
assets and liabilities US$1,608 P=79,904 US$1,364 P=64,169
Japanese yen
2016 2015
In US DollarIn Japanese
Yen In US DollarIn Japanese
YenGross exposure arising from
recognized liabilities (US$225) (¥26,473) (US$758) (¥91,300)

- 32 -
*SGVFS024032*
The exchange rates used to restate the Group’s foreign currency-denominated assets and liabilitiesfollow:
Currency Source 2016 2015Philippine Peso Philippine Dealing & Exchange Corp.
closing rate US$0.020113 US$0.021249Japanese Yen Bangko Sentral ng Pilipinas (BSP)
closing rate ¥0.008533 ¥0.008311
Sensitivity analysisThe following table indicates the approximate change in the Group’s income (loss) before incometax in response to reasonably possible changes in the foreign exchange rates to which the Grouphas significant exposure at the reporting date:
2016 2015Changes in foreign currency exchange
ratesPhilippine Peso 5.35% (5.35%) 4.97% (4.97%)Japanese Yen 2.41% (2.41%) 0.06% (0.06%)
Effect on income before taxPhilippine Peso US$65 (US$65) US$68 (US$68)Japanese Yen US$5 (US$5) US$− (US$−)
The Group based the percentage of increase and decrease in foreign exchange rate on percentagechange of the foreign exchange rates as of the reporting date and year-end forecasted closing ratefor 2016 from third party forecast.
Other than the potential impact on income (loss) before income tax, there is no other effect onequity.
The sensitivity analysis has been determined assuming that the change in foreign currencyexchange rates has occurred at the reporting date and has been applied to each of the Groupentities’ exposure to currency risk for financial instruments in existence at that date, and that allother variables, interest rates in particular, remain constant. The Group does not expect the impactof the volatility on other currencies to be material.
The stated changes represent management’s assessment of reasonably possible changes in foreigncurrency exchange rates over the period until the next annual reporting date. Results of theanalysis as presented in the above table represent an aggregation of the effects on each of theentities’ income (loss) before income tax measured in the respective functional currencies,translated into US dollars at the exchange rate ruling at the reporting date for presentationpurposes.
5. Fair Value Measurement
The Group’s financial instruments consist of cash, receivables, refundable deposits, AFSinvestments, accounts payable and other liabilities, bank loans and finance lease liabilities andsecurity deposits.
The carrying values of cash, receivables, accounts payable and other liabilities approximate theirrespective fair values due to the short term maturities of these instruments.

- 33 -
*SGVFS024032*
The carrying value of bank loans approximates fair value because these bank loans are subject toannual interest repricing.
The estimated fair values of refundable deposits and security deposits represents the present valueof the amount of estimated future cash flows expected to be collected or paid derived using theincremental borrowing rate of the Group for a similar loan. The fair value of the Group’s securitydeposit amounted to US$0.44 million and US$1.15 million as of December 31, 2016 and 2015.The fair value of the Group’s refundable deposits amounted to US$0.06 million as ofDecember 31, 2016.
The fair value of AFS investments is determined using the market prices of the listed shares andthe price of the most recent transaction for non-listed shares. Where the fair value of unquotedequity securities could not be reliably determined, the AFS investment is carried at cost, subject toimpairment.
AFS investments measured at fair value based on the quoted market bid prices are included withinthe Level 1 of the fair value hierarchy.
In 2016 and 2015, there were no transfer between Level 1 and Level 2 of the fair value hierarchy,and no transfer into and out of the Level 2 category.
6. Capital Management
The Group’s primary objective in managing capital is to provide returns for shareholders andbenefits for other stakeholders, by pricing products and services commensurately with the level ofrisk and by securing access to finance at a reasonable cost.
The Group monitors capital using a leverage ratio, which is net debt divided by the sum of totalequity and net debt. Net debt includes bank loans, security deposits and accounts payable andaccrued expenses less cash. The Group’s policy is for its leverage ratio not to exceed 75%.
The leverage ratio as at December 31, 2016 and 2015 follows:
2016 2015Current liabilitiesAccounts payable and other liabilities* US$6,736 US$10,394Bank loans and finance lease liabilities 1,106 548
7,842 10,942Noncurrent liabilitiesSecurity deposits 438 1,127Bank loans and finance lease liabilities 1,057 1,024
1,495 2,151Total debt 9,337 13,093Less cash 13,144 10,284Net debt (3,807) 2,809Equity 42,612 39,918Total equity and net debt US$38,805 US$42,727Leverage ratio (9.80%) 6.57%*Excluding cash advances from an investee amounting to US$0.06 million as of December 31, 2016 and 2015.
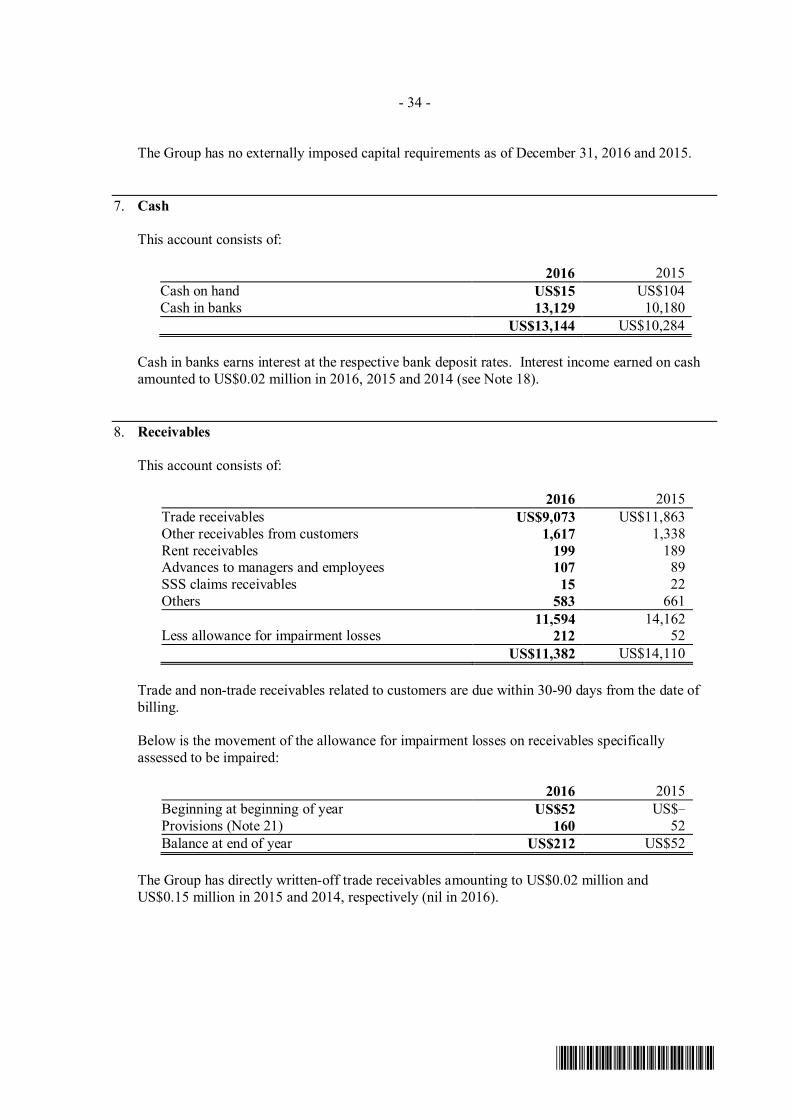
- 34 -
*SGVFS024032*
The Group has no externally imposed capital requirements as of December 31, 2016 and 2015.
7. Cash
This account consists of:
2016 2015Cash on hand US$15 US$104Cash in banks 13,129 10,180
US$13,144 US$10,284
Cash in banks earns interest at the respective bank deposit rates. Interest income earned on cashamounted to US$0.02 million in 2016, 2015 and 2014 (see Note 18).
8. Receivables
This account consists of:
2016 2015Trade receivables US$9,073 US$11,863Other receivables from customers 1,617 1,338Rent receivables 199 189Advances to managers and employees 107 89SSS claims receivables 15 22Others 583 661
11,594 14,162Less allowance for impairment losses 212 52
US$11,382 US$14,110
Trade and non-trade receivables related to customers are due within 30-90 days from the date ofbilling.
Below is the movement of the allowance for impairment losses on receivables specificallyassessed to be impaired:
2016 2015Beginning at beginning of year US$52 US$−Provisions (Note 21) 160 52Balance at end of year US$212 US$52
The Group has directly written-off trade receivables amounting to US$0.02 million andUS$0.15 million in 2015 and 2014, respectively (nil in 2016).

- 35 -
*SGVFS024032*
9. Inventories
This account consists of:
2016 2015At NRV:
Raw materials US$− US$39Finished goods (Note 19) 127 159Work-in-process (Note 19) 296 254
423 452At cost:
Raw materials 7,041 10,431Spare parts and supplies 746 774
7,787 11,205US$8,210 US$11,657
The related cost of inventories at NRV follows:
2016 2015Raw materials US$289 US$195Finished goods 137 174Work in process 406 344
US$832 US$713
The Group recognizes a write-down whenever the NRV of existing inventories is lower than itscost. Inventory write-down for finished goods amounted to US$0.01 million in 2016 andUS$0.02 million in 2015 and 2014, while the write-down recognized for work-in-processamounted to US$0.11 million, US$0.09 million and US$0.05 million in 2016, 2015 and 2014,respectively. All inventory write-downs of work-in-process are reported under cost of sales(see Note 19).
As of December 31, 2016 and 2015, allowance for inventory obsolescence amounted toUS$0.29 million and US$0.16 million, respectively.
10. Available-for-Sale Investments
This account consists of:
2016 2015Quoted US$83 US$50Unquoted 2,650 2,829
US$2,733 US$2,879
The Parent Company’s quoted AFS investments include investment listed in US NASDAQstock market.

- 36 -
*SGVFS024032*
The movements in net unrealized losses on AFS investments follow:
2016 2015Balance at beginning of year (US$233) (US$218)Impairment loss on AFS investments (Note 21) 56 −Change in fair value of AFS investments (39) (15)Balance at end of year (US$216) (US$233)
In 2016, the Group made an investments in TuneIn, Inc. and The Palms Country Club amountingUS$0.09 million and US$0.01 million, respectively, and recognized impairment loss on itsinvestments in Rovi Corp. amounting US$0.06 million due to prolonged decline in its marketvalue (see Note 21). In 2016, the Group also redeemed portion of its investment in BeaconProperty Ventures, Inc. amounting to US$0.22 million.
The Group recognized dividends from Tech Venture II, Ltd. amounting to US$0.004 million in2016 and US$0.02 million in 2015 (see Note 18).
In 2015, the Group has impaired its investments in Eagle Ridge Golf and Country Club amountingto US$0.003 million due to management’s assessment that it is not probable to recover all the costof investment (see Note 21).
In 2014, the Group made additional investments in Pacific Synergies IV (PS IV) amounting toUS$0.30 million. The Group has also recognized impairment loss on its investments in PS IV andAstute Networks amounting to US$0.20 million and US$0.50 million, respectively due toprolonged decline in the investment’s value and management’s assessment that it is not probableto recover all the cost of investment. In the same year, the Group reversed a portion of theimpairment loss in PS IV amounting to US$0.17 million due to significant improvement in thefinancial performance of the latter. Such reversal was recorded under “Unrealized losses onavailable-for-sale investments” account in the consolidated statement of comprehensive income.
11. Investments in Associates
This account consists of:
2016 2015Acquisition cost:Balances at beginning of year US$406 US$116Additions − 290Balances at end of year 406 406Accumulated equity in net earningsBalances at beginning of year 53 227Share in net earnings (losses) 40 (174)Gain on dilution (Note 18) 163 −Balances at end of year 256 53Accrual of capital commitment (Note 14) 94 110Equity in cumulative translation adjustment (72) (453)Net book values US$684 US$116

- 37 -
*SGVFS024032*
The investments in associate relate to the following associates:
Country of Incorporationand Business
Effective Percentage Ownership2016 2015
ICCP Ventures, Inc. (IVI) Philippines 24% 24%ICCP Ventures Partners, Inc. (IVPI) Philippines 30% 30%Tech Ventures Partners, Ltd. (TVPL) Cayman Islands 30% 30%ICCP SBI Venture Partners (Hong Kong) Limited (ISVP-HK) Hong Kong 19% 29%
In 2016, ICL’s equity interest in ISVP-HK (formerly ICCP Ventures Partners, Inc. (Hong Kong),Ltd.) was reduced from 29% to 18.83% since ICL has not participated in the right issuance ofISVP-HK in April 2016. As a result of this dilution, the Group recognized gain on dilutionamounting to USD$0.16 million (see Note 18). In 2015, the Group invested in IVP-HKamounting to US$0.29 million representing 29% ownership.
Share in ISVP-HK’s equity in net losses is higher than the original cost of investment byUS$0.09 million and US$0.11 million due to an outstanding capital commitment. This wasreclassified to liabilities in the consolidated statement of financial position.
Share in net earnings of the investee in 2016 amounted to US$0.04 million and share in net lossesin 2015 and 2014, amounted to US$0.17 million and US$0.19 million, respectively.
Below are the summarized financial information relating to the Group’s investment in associates:
2016IVI IVPI TVPL ISVP-HK Total
Current assets US$403 US$1,487 US$1,375 (US$620) US$2,645Noncurrent assets − 361 786 − 1,147 Total assets US$403 US$1,848 US$2,161 (US$620) US$3,792Current liabilities US$63 US$676 US$371 US$57 US$1,167Noncurrent liabilities − 992 − − 992 Total liabilities US$63 US$1,668 US$371 US$57 US$2,159
2016IVI IVPI TVPL ISVP-HK Total
Revenues US$29 US$884 US$1,145 (US$749) US$1,309Costs 8 869 466 77 1,420Gross profit (loss) US$21 US$15 US$679 (US$826) (US$111)Other expense on continuing operations - net − − − − −Net income (loss) US$21 US$ 15 US$679 (US$826) (US$111)Other comprehensive loss − 6 (456) − (450)Total comprehensive income (loss) US$21 US$21 US$223 (US$826) (US$561)

- 38 -
*SGVFS024032*
2015IVI IVPI TVPL IVP-HK Total
Current assets US$49 US$1,469 US$14 US$284 US$1,816Noncurrent assets 388 423 1,266 (647) 1,430 Total assets US$437 US$1,892 US$1,280 (US$363) US$3,246Current liabilities US$66 US$190 US$597 US$17 US$870Noncurrent liabilities − 1,953 − − 1,953 Total liabilities US$66 US$2,143 US$597 US$17 US$2,823Revenues US$15 US$873 US$955 (US$1,093) US$750Costs 71 771 205 103 1,150Gross profit (loss) (US$56) US$102 US$750 (US$1,196) (US$400)Other expense on continuing operations - net − 73 − − 73Net income (loss) (US$56) US$29 US$750 (US$1,196) (US$473)Other comprehensive loss 5 − − − 5Total comprehensive income (loss) (US$51) US$29 US$750 (US$1,196) (US$468)
12. Property, Plant and Equipment
The rollforward analyses of this account follows:
2016
Land
Machineriesand
Equipment
Building,Building
Improvementsand LeaseholdImprovements
Toolsand Other
Equipment
PlantWater andAircondi-
tioningSystems
Furniture,Fixtures
andEquipment
Transpor-tation
EquipmentConstruction
in Progress TotalCostBalances at beginning of year US$1,919 US$28,217 US$7,768 US$5,002 US$1,359 US$254 US$145 US$− US$44,664Additions − 3,841 24 882 29 8 46 304 5,134Disposals − (1,332) (133) (149) − (3) − − (1,617)Balances at end of year 1,919 30,726 7,659 5,735 1,388 259 191 304 48,181Accumulated depreciationBalances at beginning of year − 20,829 6,284 3,396 805 242 40 − 31,596Depreciation (Notes 19
and 21) − 1,618 303 573 221 3 34 − 2,752Disposals − (1,294) (152) (105) − − − − (1,551)Balances at end of year − 21,153 6,435 3,864 1,026 245 74 − 32,797Net book values US$1,919 US$9,573 US$1,224 US$1,871 US$362 US$14 US$117 US$304 US$15,384
2015
Land
Machineriesand
Equipment
Building,Building
Improvementsand LeaseholdImprovements
Toolsand Other
Equipment
PlantWater andAircondi-
tioningSystems
Furniture,Fixtures and
Equipment
Transpor-tation
EquipmentConstruction
in Progress TotalCost
Balances at beginning of year US$489 US$25,759 US$7,758 US$4,383 US$1,064 US$256 US$50 US$− US$39,759Additions 1,430 3,171 115 721 150 7 94 − 5,688Disposals − (592) (38) (65) (17) (7) − − (719)Transfers/Reclassifications − (121) (67) (37) 162 (2) 1 − (64)Balances at end of year 1,919 28,217 7,768 5,002 1,359 254 145 − 44,664Accumulated depreciationBalances at beginning of year − 20,352 5,990 3,012 545 247 29 − 30,175Depreciation (Notes 19
and 21) − 1,108 334 423 219 4 10 − 2,098Disposals − (581) (38) (34) (17) (7) − − (677)Transfers/Reclassifications − (50) (2) (5) 58 (2) 1 − −Balances at end of year − 20,829 6,284 3,396 805 242 40 − 31,596Net book values US$1,919 US$7,388 US$1,484 US$1,606 US$554 US$12 US$105 US$− US$13,068
The Group entered into a financing agreement to acquire machinery and equipment amounting toUS$1.64 million and US$1.86 million in 2016 and 2015 respectively. Carrying amount of leasedasset amounted to US$2.00 million and US$1.75 million as of December 31, 2016 and 2016,respectively (see Notes 16 and 24).

- 39 -
*SGVFS024032*
In September 2015, the Group purchased a land in Light Industry and Science Park II (LISP II),Calamba, Laguna amounting to US$1.43 million. The land is intended for future office and plantsite.
The cost of fully depreciated machinery and equipment still in use amounted to US$24.9 millionand US$25.4 million as of December 31, 2016 and 2015, respectively.
Depreciation of property, plant and equipment included in the cost of sales and operating expensesamounted to US$2.60 million and US$0.13 million, respectively in 2016, US$1.98 million andUS$0.10 million, respectively in 2015, and US$1.46 million and US$0.19 million, respectively in2014 (see Notes 19, 20 and 21).
13. Investment Properties
The rollforward analyses of this account follows:
2016
Land BuildingBuilding
Improvements TotalCostBalances at beginning of year US$2,353 US$5,295 US$3,570 US$11,218Additions 37 − 335 372Balances at end of year 2,390 5,295 3,905 11,590Accumulated DepreciationBalances at beginning of year − 2,440 3,209 5,649Depreciation (Notes 20 and 21) − 179 144 323Balances at end of year − 2,619 3,353 5,972Exchange Reserves (4) − − (4)Net Book Values US$2,386 US$2,676 US$552 US$5,614
2015
Land BuildingBuilding
Improvements TotalCostBalances at beginning of year US$2,358 US$5,211 US$3,522 US$11,091Additions − 187 48 235Reclass/ transfers (5) (103) − (108)Balances at end of year 2,353 5,295 3,570 11,218Accumulated DepreciationBalances at beginning of year 5 2,372 3,078 5,455Depreciation (Notes 20 and 21) − 171 131 302Disposals (5) (103) − (108)Balances at end of year − 2,440 3,209 5,649Exchange Reserves (2) 73 − 71Net Book Values US$2,351 US$2,928 US$361 US$5,640
On July 18, 2014, the Group decided to dispose its land and building situated in Calamba City,Laguna. The sale resulted to a gain of US$0.16 million.
The Group obtained an appraisal report from Royal Asia Corporation, a third party appraiser, as ofFebruary 20, 2014. Based on the appraisal report, the fair values of land and depreciableinvestment properties, excluding the properties sold in July 2014, amounted to US$1.92 millionand US$3.62 million, respectively. The fair value of the land and depreciable assets transferredfrom property, plant and equipment to investment properties in 2015 amounted to US$0.96

- 40 -
*SGVFS024032*
million and US$0.98 million, respectively, based on the same appraisal report. Managementbelieves that the fair values as of December 31, 2016 and 2015 are not materially different fromthat of February 20, 2014.
The fair values of the land and depreciable investment properties were arrived at using the SalesComparison approach and Cost approach, respectively, which are included under the Level 3 ofthe fair value hierarchy. In the Sales Comparison approach, fair value is based on sales andlistings of comparable properties registered within the vicinity. In the Cost approach, an estimateis made of the cost of construction of the replaceable properties at current prices in accordancewith the prevailing market prices for materials, labor, overhead and all other attendant costsassociated with its acquisition, installation and construction in place. Adjustments, which includeconsideration of cost to cure improvements to become marketable, as well as market resistancefactors, are then made to reflect depreciation resulting from physical deterioration plus anyfunctional and economic obsolescence that may exist to arrive at a reasonable valuation.
Rent income earned from the investment properties amounted to US$2.57 million,US$2.40 million and US$2.53 million in 2016, 2015 and 2014, respectively.
Cost of rental services from investment property amounted to US$0.35 million, US$0.36 millionand US$0.43 million in 2016, 2015 and 2014, respectively.
Depreciation of investment properties included under cost of rental services amounted toUS$0.3 million in 2016, US$0.30 million in 2015 and US$0.35 million in 2014 (see Note 20).
14. Accounts Payable and Other Liabilities
This account consists of:
2016 2015Trade payables US$4,299 US$7,408Accrued expenses 1,721 2,334Non-trade payables 132 198Unearned rent income 695 −Security deposit 438 1,127Others 758 623
8,043 11,690Less noncurrent portion of unearned rent and security deposits 1,090 1,127
US$6,953 US$10,563

- 41 -
*SGVFS024032*
Accrued expenses consist of:
2016 2015Accrued rent US$51 US$107Accrued salaries, wages and other benefits 428 1,118Accrued utilities 355 404Accrued sales commission 110 231Accrued professional fees 95 152Accrued handling charges 95 82Accrued capital commitment (Note 11) 94 110Accrued direct materials 10 44Others 483 86
US$1,721 US$2,334
Trade payables are amounts primarily due to suppliers which are noninterest-bearing and arenormally settled on 15- to 90-day terms. These are all payable within one year. The foregoingaccrued expenses and other financial liabilities are non-interest bearing and are normally settledon a 30-day term.
15. Advances from Customers
The account represents advanced payments for raw material purchases, amounting toUS$2.89 million and US$3.62 million as of December 31, 2016 and 2015, respectively. This willbe applied against future invoices and covers the cost of aging inventories of the Group.
16. Bank Loans and Finance Lease Liabilities
This account consists of:
2016 2015Term loans - current US$− US$63Car loans
Current 63 36Noncurrent 109 84
Finance lease liabilitiesCurrent 1,043 449Noncurrent 948 940
US$2,163 US$1,572
Current US$1,106 US$548Noncurrent 1,057 1,024
US$2,163 US$1,572
The Group entered into short-term and long-term loan arrangements with foreign and domesticfinancial institutions for its various working capital requirements.

- 42 -
*SGVFS024032*
Car loans:∂ In 2016 and 2015, the Parent Company entered into credit loan agreements with local banks
for the car loan fleet financing of certain employees. As of December 31, 2016 and 2015, theoutstanding balance of car loans amounted to US$0.17 million and US$0.12, respectively.These loans are subject to monthly interest rates ranging from 0.63% to 0.81% in 2016 and0.76% to 0.81% in 2015.
Finance lease (see Note 24):∂ On July 22, 2015, EMS entered into a three (3)-year financing agreement to acquire
machinery and equipment with a supplier amounting to US$1.39 million. This is subject to1.49% semi-annual interest and will mature on July 14, 2018.
∂ On June 15, 2016, EMS entered into another three (3)-year financing agreement with thesame supplier amounting to US$1.64 million. This is subject to 0.70% quarterly interest andwill mature on June 20, 2019.
17. Equity
Capital StockThe Parent Company’s capital stock consists of 1,000,000,000 authorized common stock atP=1.00 par value per share, with 857,974,992 issued shares amounting to P=857.97 million(US$17.63 million) as of December 31, 2016 and 2015.
As of December 31, 2016 and 2015 , the Parent Company has 25,713,000 treasury sharesamounting to P=46.36 million (US$1.06 million) and 15,459,000 treasury shares amounting toP=38.03 million (US$0.60 million), respectively. 14,059,000 treasury shares of which wereacquired by IPI in 2012.
On February 7, 1995, the SEC approved the registration of 429,687,496 common shares withissue price of P=17.00.
Below is the summary of the outstanding number of shares and holders of security as atDecember 31, 2016:
YearNumber
of Shares
Number ofHolders ofSecurities
at year endJanuary 1, 2014 842,515,992 1051Add/(Deduct) Movement − (159)December 31, 2014 842,515,992 892Add/(Deduct) Movement − (10)December 31, 2015 842,515,992 882Add/(Deduct) Movement (10,254,000) (8)December 31, 2016 832,261,992 874
Retained EarningsThe Parent Company's retained earnings available for dividend declaration amounted toUS$11.67 million, US$15.86 million and US$15.46 million as of December 31, 2016, 2015 and2014, respectively.

- 43 -
*SGVFS024032*
18. Other Income
This account consists of:
2016 2015 2014Foreign currency exchange
gains - net US$82 US$219 US$124Gain on dilution of interest in
investment in associate(Note 11) 163 − −
Dividend income from AFS(Note 10) 4 18 58
Interest income (Note 4) 24 18 16Gain on sale of property and
equipment and investmentproperties (Notes 12 and 13) − 5 163
Miscellaneous 59 19 26US$332 US$279 US$387
19. Cost of Sales
This account consists of:
2016 2015 2014Raw materials and supplies used US$28,811 US$45,098 US$45,628Salaries, wages and benefits
(Notes 23 and 28) 7,877 7,471 7,429Occupancy cost and utilities 2,930 3,129 3,450Depreciation (Note 12) 2,599 1,978 1,461Handling and freight charges 545 647 962Other expenses 1,039 922 858Total manufacturing cost 43,801 59,245 59,788Work-in-process (Note 9)
Beginning 254 258 314Ending (296) (254) (258)
Cost of goods manufactured 43,759 59,249 59,844Finished goods (Note 9)
Beginning 159 324 744Ending (127) (159) (324)
US$43,791 US$59,414 US$60,264
Pension expense included in the salaries, wages and benefits account amounted toUS$0.30 million in 2016, US$0.27 million in 2015 and US$0.26 million in 2014 (see Note 28).

- 44 -
*SGVFS024032*
20. Cost of Rental Services
This account consists of:
2016 2015 2014Depreciation (Note 13) US$334 US$323 US$354Taxes and licenses 8 2 13Repairs and maintenance − − 12Other expenses 5 31 46
US$347 US$356 US$425
21. Operating Expenses
This account consists of:
2016 2015 2014General and administrative expenses US$2,679 US$1,902 US$2,991Selling expenses 1,070 1,122 922
US$3,749 US$3,024 US$3,913
General and administrative expenses consist of the following:
2016 2015 2014Salaries and benefits US$1,336 US$1,246 US$1,258Occupancy cost and utilities (Note 24) 234 35 16Professional fees 228 293 290Impairment loss on goodwill (Note 3) 217 − −Receivables written-off (Note 9) 160 71 146Depreciation (Note 12) 127 100 192Insurance 60 53 51Impairment loss on AFS investment
(Note 10) 56 3 705Taxes and licenses 4 25 117Impairment loss on investment properties
(Note 13) − − 67Other expenses 257 76 149
US$2,679 US$1,902 US$2,991
Selling expenses consist of the following:
2016 2015 2014Sales commission and agent’s
professional fee US$688 US$1,029 US$922Salaries and benefits 272 85 −Depreciation and amortization (Note 12) 14 3 −Other expenses 96 5 −
US$1,070 US$1,122 US$922

- 45 -
*SGVFS024032*
Selling expenses represent sales commissions paid to foreign agents, which is based on 10% and 1-3% of conversion and material costs and agent’s professional fees.
Agent’s professional fee includes legal, audit, actuarial valuation fee and others.
Pension expense included in the salaries, wages and benefits account amounted US$0.01 million in2016 and US$0.03 million in 2015 and US$0.01 million 2014 (see Note 28).
Other expenses account includes supplies, taxes and licenses, membership dues, insuranceexpense and others.
22. Finance Costs
This account consists of:
2016 2015 2014Interest on long-term bank loans US$67 US$ 24 US$29Other finance costs 64 17 −
US$131 US$41 US$29
23. Related Party Transactions
Parties are considered to be related if one party has the ability, directly or indirectly, to control theother party or exercise significant influence over the other party in making financial and operatingdecisions. Parties are also considered to be related if they are subject to common control orcommon significant influence. Related parties may be individuals or corporate entities.
Disclosed below are the transactions and the related balances among related parties as of and forthe year ended December 31, 2016 and 2015:
CategoryAmount/Volume
Due from(Due to) Terms Conditions
Entity under common control Advances US$250 US$250 Due and demandable;
Noninterest-bearingUnsecured;
No impairment
In 2015, the Parent Company advanced US$0.25 million to Ionics Products Solutions, Inc. (IPSI),entity under common control, which is intended for the subscription of the capital stock of IPSI.The advances remains outstanding as of December 31, 2016 and 2015.
The key management personnel of the Group include executives and directors. The summary ofcompensation of the key management personnel follows:
2016 2015 2014Short-term employee benefits US$743 US$719 US$727Executive officers’ compensation 355 445 373Directors’ remuneration 339 324 320Post-employment benefits 58 68 56
US$1,495 US$1,556 US$1,476

- 46 -
*SGVFS024032*
24. Leases
The following are the lease agreements with third parties:
Iomni Precision, Inc. (Iomni) - as a LesseeIomni leases a parcel of land and a factory building from a third party lessor. The lease is for aperiod of 10 years starting January 15, 2001. On September 6, 2011, the parties enteredinto an agreement to renew the lease contract for a period of five (5) years commencing onJanuary 16, 2011. The lease covers the same property with a 5% annual escalation clausebeginning January 16, 2013.
On February 23, 2016, the parties entered into an agreement to renew the lease contract for aperiod of five (5) years and 15 days commencing on January 16, 2016. The lease covers the sameproperty with a monthly rental in Philippine Peso at P=203 per square meter and a 5% annualescalation beginning February 1, 2018.
As of December 31, 2016 and 2015, Iomni’s future minimum rental payments on non-cancellableleases are as follow:
2016 2015Within one year US$352 US$14After one year but not more than five years 1,085 −
US$1,468 US$14
Iomni Precision, Inc. - as a LessorIomni leased out the available office space with a total floor area of 999.40 square meters (sq. m.)to a third party. The lease agreement began on June 12, 2013 and shall continue for a period oftwo years until July 11, 2015, subject to one year extension. In 2015, the third party lessee waivedthe renewal of lease contract at the end of lease term.
In 2016, Iomni leased out this office space to another third party with contract period ofFebruary 16, 2016 to February 15, 2019. The lease may be renewed for an additional term of twoyears at the option of the lessee.
Iomni recognized related cost of rental services arising from the leased properties’ rent expenseamounting to US$0.11 million and US$0.12 million in 2016 and 2015, respectively, anddepreciation amounting to US$0.02 million in 2016 and 2015 (see Note 10).
Iomni’s future minimum lease receivables under non-cancellable operating leases as ofDecember 31, 2016 and 2015 are as follows:
2016 2015Within one year US$162 US$−After one year but not more than five years 67 −
US$229 US$−
Ionics Properties, Inc. (IPI) - as a LessorIPI leased its two-storey building with a total floor area of 4,639.50 sq.m. to a third party. Thelease agreement covered dates from December 2009 to December 2013 and is subject to 5%escalation. On December 13, 2013, the contract was renewed for a three-year lease term tocommence on December 18, 2013 with an increase in monthly rental rate from US$3.50 to

- 47 -
*SGVFS024032*
US$3.65 per sq.m. without an escalation clause. IPI recognized rent income pertaining to thislease amounting to US$0.20 million in 2016, 2015 and 2014.
In October 2004, IPI entered into a 10-year non-cancellable lease with a third party for the rent ofits three-storey factory. The lease agreement provides for a 3.50% annual escalation. In 2014, thecontract was renewed upon the end of its lease term for another 10 years to commence onOctober 1, 2014 to September 30, 2024. The monthly rate, however, was decreased fromUS$10.73 to US$8.90 per sq.m. without escalation. IPI recognized rent income pertaining to thislease amounting to US$1.55 million in 2016 and 2015 andUS$1.62 million in 2014.
In 2006, IPI completed the construction of a warehouse building with a total floor area of 3,140.00sq.m. which was subsequently leased out to a third party. The original term of the leaseagreement, which commenced on April 18, 2006, is five (5) years. By the end of the original termin April 2011, the lease agreement was subjected to a yearly renewal. The lease agreement wasno longer renewed upon expiration in April 17, 2015. IPI recognized rent income pertaining tothis lease amounting to US$0.06 million in 2015 and US$0.12 million in 2014.
In November 2015, IPI leased out the warehouse building to a third party for a period of threeyears. The lease agreement covered dates from November 2015 to October 2018 and is subject to5% escalation with a total floor area of 4,639.50 square meters. IPI recognized rental incomepertaining to this lease amounting to US$0.19 million and US$0.03 million in 2016 and 2015,respectively.
In 2013, the IPI entered into a five-year lease contract with a third party, for the rent of itsbuilding with an area of 7,432 sq.m. and of that certain parcel of land with an area of 12,918 sq.m.The lease shall begin on September 15, 2013 and shall continue for a period of five years, untilSeptember 14, 2018. IPI recognized rental income pertaining to this lease amounting to US$0.51million in 2016, 2015 and 2014.
IPI’s future minimum lease receivables under non-cancellable operating leases as ofDecember 31, 2016 and 2015 follow:
2016 2015Within one year US$2,458 US$2,450After one year but not more than five years 8,745 9,013
US$11,203 US$11,463
Ionics EMS, Inc. (EMS) - Finance lease - as a LesseeIn 2016 and 2015, EMS entered into a three (3)-year lease agreements to finance its acquisition ofequipment as discussed in Note 16. Total interest expense recognized on these lease amounted toUS$0.06 million and US$0.02 million in 2016 and 2015, respectively. The future minimum rentalpayments pertaining to this finance lease are as follows:
2016 2015Within one year US$938 US$487After one year but not more than five years 1,131 975
US$2,069 US$1,462

- 48 -
*SGVFS024032*
25. Registrations with the Philippine Economic Zone Authority (PEZA)
EMS, Iomni and IPI are all PEZA-registered. Their registrations entitle them to certain incentivesand privileges including a lower corporate income tax rate subject to certain provisions andlimitations of Republic Act (RA) 7916 and each subsidiary’s registration agreement with PEZA.
Ionics EMS, Inc.
Product Line Date of Registration Type of RegistrationIncome Tax Holiday (ITH)/Gross Income Tax Incentive
1. Manufacture of Afimilk Tag June 16, 2016 New Project Three-year ITH starting August2016
2. Manufacture of Nano NozzleReader
June 16, 2016 New Project Three-year ITH starting August2016
3. Manufacture of PCBA forPrinter
February 15, 2016 New Project Gross income tax incentivestarting February 2016
4. Manufacture of Quantum February 15, 2016 New Project Gross income tax incentivestarting February 2016
5. LCD Projector w/ PowerSupply
May 13, 2015 New project Four year ITH starting April2015
6. WI butler May 13, 2015 New project Gross income tax incentivestarting May 2015
7. Electronic Door Lock System May 13, 2015 New project Gross income tax incentivestarting May 2015
8. Manufacture of tracking device Oct. 07, 2014 New Project Three-year ITH starting July2014(based on incrementalsales)
9. Manufacturing of light curedevice
May 08, 2014 New Project Gross Income tax incentivestarting March 2014
10. Portable/mobile two-way radiocommunication equipment
July 23, 2013 New project Three-year ITH starting July2013
11. XR3 Universal VSATTransceiver
September 27, 2012 New project Four-year ITH startingJune 2012
12. Mobile Display Device* June 22, 2012 New project Four-year ITH startingDec 2009
13. Dual Port Gigabit EthernetBypass Adapter*
May 31, 2011 New project Three-year ITH startingJune 2011
14. Pole Cabinets* March 31, 2011 New project Four-year ITH startingJune 2011
15. Video Conference System* March 1, 2011 New project Three-year ITH startingMarch 2011
16. Optical Network Terminal* February 15, 2010 New project Four-year ITH startingMarch 2010
17. Manufacturing of PlugComputer*
October 28, 2009 New project Four-year ITH startingDecember 2009
18. Electronic Communicator andController Module (ECCM)*
May 13, 2009 New project Four-year ITH startingMarch 2009
19. Digipass Security Software forMicrosoft pocket PC*
April 27, 2009 New project Four-year ITH startingMarch 2009
20. Internet Protocol Modem April 16, 2008 New project Gross income tax incentivestarting April 2008

- 49 -
*SGVFS024032*
Product Line Date of Registration Type of RegistrationIncome Tax Holiday (ITH)/Gross Income Tax Incentive
21. Re-manufacture of MobilePhones*
November 28, 2008 New project Four-year ITH startingDecember 2008
22. PV-Max Master* March 13, 2008 New project Four-year ITH startingMay 2008
23. T2 Wi-Fi Tag* March 16, 2009 New project Four-year ITH startingOctober 2008
24. Optics Telecommunication* November 28, 2005 New project Four-year ITH startingJanuary 2006
25. ROHS Flex Cable Assembly* October 13, 2005 New project Four-year ITH startingOctober 2005
26. RF Tuners and Amplifiers* May 23, 2005 New project Four-year ITH startingJune 2005
27. Power Controller of BeardTrimmer with Saft NiCD andSanyo NiMH Re-chargeableBattery*
December 09, 2004 New project Four-year ITH startingDecember 2004
28. Wireless Broadband AccessUnit*
May 11, 2004 New project Four-year ITH startingMay 2004
29. Power Over LAN Assembly* September 30, 2003 New project Three-year ITH startingOctober 2003
30. Electronic Car DashboardAssembly*
June 12, 2003 New project Four-year ITH startingJune 2003
31. Design and Development* July 28, 2003 New project Four-year ITH startingJuly 2003
32. Hi-Focus Asymmetrical DigitalSubscriber Line (ADSL)Broadband Access System*
September 21, 2000 New project Four-year ITH startingOctober 2000
* ITH incentives for these product lines have already expired as of December 31, 2016.
Gross income from product lines with expired registration are subjected to the 5% gross incometax from the date ITH incentive has expired. The above registrations also entitle the Group toother incentives which include, among others, the duty-free importation of raw materials andcapital equipment. The Group is negotiating with PEZA for additional bonus years for certainproduct lines with expired ITH.
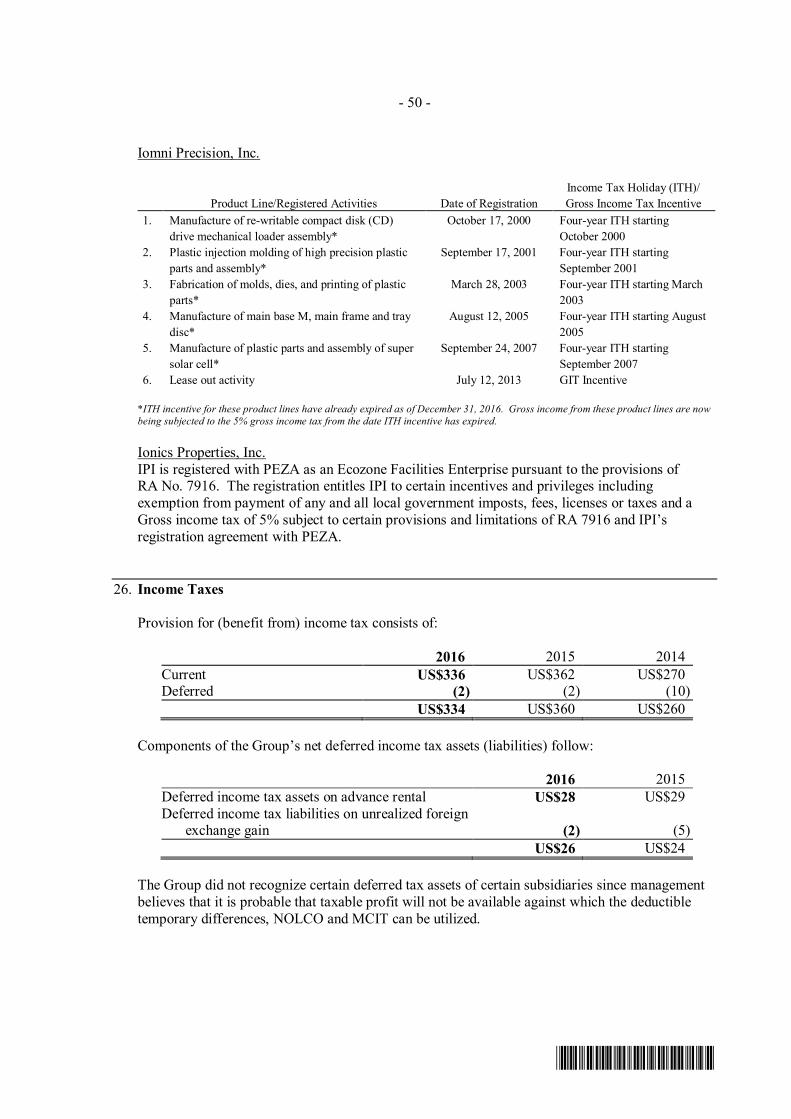
- 50 -
*SGVFS024032*
Iomni Precision, Inc.
Product Line/Registered Activities Date of RegistrationIncome Tax Holiday (ITH)/Gross Income Tax Incentive
1. Manufacture of re-writable compact disk (CD)drive mechanical loader assembly*
October 17, 2000 Four-year ITH startingOctober 2000
2. Plastic injection molding of high precision plasticparts and assembly*
September 17, 2001 Four-year ITH startingSeptember 2001
3. Fabrication of molds, dies, and printing of plasticparts*
March 28, 2003 Four-year ITH starting March2003
4. Manufacture of main base M, main frame and traydisc*
August 12, 2005 Four-year ITH starting August2005
5. Manufacture of plastic parts and assembly of supersolar cell*
September 24, 2007 Four-year ITH startingSeptember 2007
6. Lease out activity July 12, 2013 GIT Incentive
*ITH incentive for these product lines have already expired as of December 31, 2016. Gross income from these product lines are nowbeing subjected to the 5% gross income tax from the date ITH incentive has expired.
Ionics Properties, Inc.IPI is registered with PEZA as an Ecozone Facilities Enterprise pursuant to the provisions ofRA No. 7916. The registration entitles IPI to certain incentives and privileges includingexemption from payment of any and all local government imposts, fees, licenses or taxes and aGross income tax of 5% subject to certain provisions and limitations of RA 7916 and IPI’sregistration agreement with PEZA.
26. Income Taxes
Provision for (benefit from) income tax consists of:
2016 2015 2014Current US$336 US$362 US$270Deferred (2) (2) (10)
US$334 US$360 US$260
Components of the Group’s net deferred income tax assets (liabilities) follow:
2016 2015Deferred income tax assets on advance rental US$28 US$29Deferred income tax liabilities on unrealized foreign
exchange gain (2) (5)US$26 US$24
The Group did not recognize certain deferred tax assets of certain subsidiaries since managementbelieves that it is probable that taxable profit will not be available against which the deductibletemporary differences, NOLCO and MCIT can be utilized.

- 51 -
*SGVFS024032*
The components of the temporary differences where deferred tax assets were not recognized bythe Group follow:
2016 2015Pension liability US$2,583 US$2,332Unamortized excess of contribution over the
normal cost 421 246Allowance for inventory obsolescence 289 225Allowance for impairment loss 211 52Straight-line recognition of rent expense 346 30NOLCO 139 330MCIT 25 23Others 72 40
The NOLCO can be carried forward as a deduction against taxable income as follows:
Year Incurred Amount Used/Expired Balance Expiry Date2013 US$197 (US$197) US$− December 31, 20162014 126 − 126 December 31, 20172015 7 − 7 December 31, 20182016 6 − 6 December 31, 2019
US$336 (US$197) US$139
The Group has the following excess MCIT over regular corporate income tax:
Year Incurred Amount Used/Expired Balance Expiry Date2013 US$7 (US$7) US$− December 31, 20162014 7 − 7 December 31, 20172015 9 − 9 December 31, 20182016 9 − 9 December 31, 2019
US$32 (US$7) US$25
Reconciliation of the statutory income tax rate to the effective income tax rate follows:
2016 2015 2014Statutory income tax rate 30.00% 30.00% 30.00%Tax effect of:
Movement in unrecognized deferred tax assets (4.46%) (0.62%) 2.98%Loss (income) from operations subject to lower preferential rate without NOLCO (53.57%) (35.92%) (21.19%)Income from operations under ITH - net 6.38% (8.27%) (7.06%)Others 23.22% 25.59% 14.82%
Effective income tax rate 10.49% 10.78% 19.55%

- 52 -
*SGVFS024032*
Under RA No. 7916 on Special Zones and PEZA, a PEZA-registered enterprise is exempt fromnational and local taxes. In lieu of the said national and local taxes, 5% of the gross incomeearned by all businesses and enterprises within the ecozone shall be remitted to the local andnational government.
27. Earnings Per Share
Earnings per share amounts attributed to ordinary equity holders of the Parent Company werecomputed as follows:
2016 2015 2014Net income attributable to
ordinary equity holders of theParent Company US$2,802 US$2,925 US$1,049
Weighted average number ofissued common shares 857,975 857,975 857,975
Less treasury shares (Note 17) 25,713 15,459 15,459Weighted average number of
outstanding common shares 832,262 842,516 842,516Basic/diluted earnings per share US$0.0034 US$0.0035 US$0.0012
There were no potential dilutive shares in 2016, 2015 and 2014.
28. Pension Liability
The Group provides a noncontributory defined benefit pension plan for all regular employees.Benefits are based on the employee’s years of service and final plan salary. The trust fund, tocover the pension obligation, is administered by a trustee bank under the supervision of the Boardof Trustees of the plan. The Board of Trustees (BOT) is responsible for investment strategy of theplan. The Retirement Plan meets the minimum retirement benefit specified under RA No. 7641.
Under the existing regulatory framework, RA No. 7641 requires a provision for retirement pay toqualified private sector employees in the absence of any retirement plan in the entity, providedhowever that the employee’s retirement benefits under any collective bargaining andother agreements shall not be less than those provided under the law.
The law does not require minimum funding of the plan.
The components of retirement costs included in “Salaries, wages and benefits” account under costof sales and operating expenses in the consolidated statements of income are as follows:
2016 2015 2014Current service cost US$204 US$205 US$175Net interest cost 115 90 94
US$319 US$295 US$269

- 53 -
*SGVFS024032*
The amount of remeasurement losses on retirement plan recognized under comprehensive incomeare as follow:
2016 2015 2014Defined benefit obligation US$87 US$105 US$356Plan assets 3 (3) 20
US$90 US$102 US$376
In 2016 and 2015 the Group recognized directly in other comprehensive income actuarial lossarising from the effects of changes in foreign exchange rates of the net pension obligationamounting to US$0.16 and US$0.14 million, respectively.
The amount included in the consolidated statements of financial position arising from the Group’sobligation in respect of its defined benefit plan is as follows:
2016 2015Present value of defined benefit obligation US$2,949 US$2,856Fair value of plan assets (366) (341)
US$2,583 US$2,515
Changes in the present value of the defined benefit obligation are as follows:
2016 2015Balance at beginning of year US$2,856 US$2,679Current service cost 204 205Interest cost 127 106Benefits paid (162) (93)Remeasurement (gains) losses arising from:
Experience adjustments 180 439Changes in financial assumptions (90) (114)Changes in demographic assumptions (3) (220)
Effect of changes in foreign exchange rates (163) (146)US$2,949 US$2,856
Changes in the fair value of plan assets are as follows:
2016 2015Balance at beginning of year US$341 US$347Interest income 12 16Return on assets excluding amount included in net
interest cost (3) 3Contributions 190 88Benefits paid (162) (93)Effect of changes in foreign exchange rates (12) (20)
US$366 US$341

- 54 -
*SGVFS024032*
The movements in the net pension liability recognized in the consolidated statements of financialposition follow:
2016 2015Balance at beginning of year US$2,515 US$2,332Retirement cost 319 295Remeasurement losses 90 102Contributions (190) (88)Effect of changes in foreign exchange rates (151) (126)
US$2,583 US$2,515
The Group’s plan assets are comprised of cash, investment in equity instruments, debt instrument- government and other bonds and other assets. The Retirement Trust Fund assets are valued bythe fund manager at fair value using the mark-to-market valuation.
The fair value of plan assets by each class is as follows (in actual amounts):
2016 2015Cash in banks US$119,765 US$14,345Investment in common shares - Quoted 6,951 7,906Investment in Government Securities
Fixed rate treasury notes 168,667 146,520Retail treasury bonds 65,942 110,690
234,609 257,210Investment in other securities and debt instruments
Not rated debt securities 2,962 2,9782,962 2,978
Other receivablesDue from BSP-SDA Direct − 55,595Interest receivable 2,264 2,735
US$366,551 US$340,769
The composition of the fair value of the trust fund follows:
Investment in government securities - includes investment in Philippine Retail Treasury Bonds(RTBs) and Fixed Rate Treasury Notes (FXTNs);
Cash in bank - includes savings and time deposits with Bangko Sentral ng Pilipinas (BSP);
Investments in other securities and debt instruments - includes investments in Long-TermNegotiable Certificate of Deposits (LTNCD) and retail bonds;
Investments in equity securities - includes investment in common shares traded in the PhilippineStock Exchange (PSE);
Others - includes accrued interest on fixed income securities and special deposit account in BSP.
As at December 31, 2016 and 2015, the Fund has no investments in the securities (debt or equity)of any related party.

- 55 -
*SGVFS024032*
The plan assets do not include any of the Group’s own equity instruments nor any propertyoccupied by, or other assets used by the Group.
The costs of defined benefit pension plan, as well as the present value of the pension obligationare determined using actuarial valuation. The actuarial valuation involves making variousassumptions.
The principal assumptions used in determining pension obligation for the defined benefit plan areas follows:
2016 2015 2014Retirement age 60 - 65 60 - 65 60 - 65Average remaining working life 11 - 18 11 - 18 11 - 18Discount rate
Beginning of year 6% 5% 8%End of year 5% 5% 5%
Salary increase rateBeginning of year 1% - 5% 3.5% - 5% 4% - 5%End of year 3.5% - 5% 3.5% - 5% 3.5% - 5%
The sensitivity analysis that follows has been determined based on reasonably possible changes ofthe assumption occurring as of the end of the reporting period, assuming if all other assumptionswere held constant.
2016 2015
Assumptions Changes
Increase (decrease) on presentvalue of defined benefit
obligation Changes
Increase (decrease) on presentvalue of defined benefit
obligationDiscount rate +1.0% (US$241) +1.0% (US$256)
-1.0% US$292 -1.0% US$313
Future salaryincrease +1.0% US$312 +1.0% US$331
-1.0% (US$260) -1.0% (US$275)
The BOT of the Plan ensures that its plan assets are readily available to service the pensionobligation due. This is done by ensuring that its assets are easily disposable and can easily beconverted to cash.
The table below shows the maturity profile of the undiscounted pension payments as ofDecember 31, 2016 and 2015:
2016Less than
1 year1 to 5
years5 to 10years
10 to 15years
15 to 20years
More than20 years
Normal retirement US$805 US$161 US$215 US$381 US$1,782 US$5,477Other than normal retirement 160 573 707 729 628 794
US$965 US$734 US$922 US$1,110 US$2,410 US$6,271
2015Less than
1 year1 to 5
years5 to 10years
10 to 15years
15 to 20years
More than20 years
Normal retirement US$505 US$191 US$207 US$178 US$1,709 US$5,782Other than normal retirement 164 614 728 740 637 800
US$669 US$805 US$935 US$918 US$2,346 US$6,582

- 56 -
*SGVFS024032*
The Group does not expect to contribute to the pension plan in 2017.
29. Segment Information
The primary segment reporting format of the Group is by business segments as the Group’s risksand rates of return are affected predominantly by differences in the goods produced. Secondarysegment reporting information is reported geographically.
The operating businesses are organized and managed separately according to the nature of theproducts and services provided, with each segment representing a strategic business unit thatoffers different products and serves different markets.
The computer peripherals segment provides world-class design, build, ship, and logistics servicesto top computer equipment companies. The Group has been providing a broad range of serviceofferings to customers in the desktop personal computer (PC), peripheral, server, notebook PC,and storage devices industries.
The telecom segment specializes in the manufacture and delivery of carrier and enterprise-classcommunications equipment, as well as wireless, optical networking, wire line transmission, andenterprise networking equipment.
The Group works with the world’s leading telecommunications equipment companies, along withits TL9000 certification, to face the demand and manufacturing challenges of a fluctuating andtime-critical market segment.
The automotive segment understands and delivers to satisfy customers’ unique manufacturingrequirements. The automotive industry demands advanced technologies, high-end materials, andadvanced manufacturing processes and quality systems. The Group has experience in ProductPart Approval Processes (PPAPs), Process Failure Mode & Effects Analysis (PFMEA) andDesign Failure Mode & Effects Analysis (DFMEA), and is ISO/TS 16949 certified.
The consumer electronics segment also provides design, build, ship and logistics services for itscustomers in the digital media devices, digital television capture and audio products industries.The consumer electronics segment builds the capability to serve these customers with everyelement that is required to deliver real products to the marketplace.
The real estate segment generates income from rentals of the Group’s building, includingwarehouse and factory area, and building improvements to third party lessees within the PEZAeconomic zone.
The revenues from major customers under the telecom industry amounted to US$20.90 million,US$35.80 million and US$31.13 million in 2016, 2015 and 2014, respectively. Total revenuesfrom these customers exceed 10% of the total revenues of the Group.

- 57 -
*SGVFS024032*
The Group’s segment information as of and for the year ended December 31, 2016, 2015 and2014, which present income and losses, revenues and certain assets and liabilities attributed toeach business segment, are summarized in the following tables:
2016
ComputerPeripherals Telecom Automotive
ConsumerElectronics Real Estate Others
Adjustmentsand
Eliminations TotalSales US$15,466 US$24,954 US$2,600 US$4,649 US$− US$708 (US$21) US$48,356Rental income − 96 − − 2,521 508 (558) 2,567Income (loss) from operations 1,915 (52) (266) (221) 2,000 (4,105) 3,928 3,199Foreign exchange gain (loss) - net 70 7 (7) 7 − 5 − 82Dividend income − − − − − 4 − 4Non-controlling interests − − − − − − (47) (47)Income tax (141) (81) (6) (3) (103) (0) − (334)Equity in net losses − − − − − 59 (19) 40Interest - net (52) (11) 1 1 (47) 1 − (107)Miscellaneous - net 37 (62) (3) (8) 1 (35)Net income (loss) US$1,829 (US$199) (US$281) (US$224) US$1,850 (US$4,035) US$3,862 US$2,802Identifiable assets US$11,296 US$15,078 US$1,992 US$3,174 US$9,002 US$46,664 (US$39,288) US$47,918Unallocated assets − − − 9,441 − 1,024 − 10,465Total assets US$11,296 US$15,078 US$1,992 US$12,615 US$9,002 US$47,688 (US$39,288) US$58,383Identifiable liabilities US$40 US$3,401 US$249 US$365 US$1,892 US$30,776 (US$46,846) (US$10,123)Unallocated liabilities − − − − − 25,894 − 25,894Total liabilities US$40 US$3,401 US$249 US$365 US$1,892 US$56,670 (US$46,846) US$15,771Capital expenditures US$3,956 US$498 US$15 US$112 US$- US$925 US$− US$5,506Depreciation US$1,903 US$425 US$22 US$96 US$15 US$614 US$− US$3,075
2015
ComputerPeripherals Telecom Automotive
ConsumerElectronics Real Estate Others
Adjustmentsand
Eliminations TotalSales US$8,783 US$40,660 US$7,724 US$5,937 US$− US$696 (US$54) US$63,746Rental income − 97 − − 2,357 416 (474) 2,396Income (loss) from operations (215) 1,439 243 207 1,963 (629) − 3,008Foreign exchange gain (loss) - net 131 64 10 14 1 (1) − 219Dividend income − − − − − 1,118 (1,100) 18Non-controlling interests − − − − − − (54) (54)Income tax (48) (152) (30) (19) (102) (9) − (360)Gain on sale on property, plant and equipment − 3 − 2 − − − 5Equity in net losses − − − − − 177 (3) 174Interest – net (21) (1) (1) − 8 (8) − (23)Miscellaneous – net (3) (46) (4) (10) − 1 − (62)Net income (loss) (US$156) US$1,307 US$218 US$194 US$1,870 US$649 (US$1,157) US$2,925Identifiable assets US$7,775 US$21,198 US$1,993 US$4,393 US$8,241 US$51,119 (US$43,692) US$51,027Unallocated assets − − − 7,877 − 515 − 8,392Total assets US$7,775 US$21,198 US$1,993 US$12,270 US$8,241 US$51,634 (US$43,692) US$59,419Identifiable liabilities US$278 US$4,083 US$334 US$612 US$2,787 US$30,663 (US$47,319) (US$8,562)Unallocated liabilities − − − − − 28,063 − 28,063Total liabilities US$278 US$4,083 US$334 US$612 US$2,787 US$58,726 (US$47,319) US$19,501Capital expenditures US$356 US$3,126 US$246 US$253 US$1,741 US$200 US$− US$5,922Depreciation US$1,238 US$360 US$216 US$82 US$319 US$189 US$− US$2,404

- 58 -
*SGVFS024032*
2014
ComputerPeripherals Telecom Automotive
ConsumerElectronics Real Estate Others
Adjustmentsand
Eliminations TotalSales US$8,897 US$38,296 US$9,594 US$5,838 US$− US$790 (US$110) US$63,305Rental income − 97 − − 2,457 449 (476) 2,527Income (loss) from operations (81) (42) 275 288 1,926 (1,498) − 868Foreign exchange gain (loss) - net 65 36 17 6 − − − 124Dividend income − − − − − 2,058 (2,000) 58Non-controlling interests − − − − − − 21 21Income tax (42) (48) (30) (39) (101) − − (260)Gain on sale of investment properties − − − − 163 − − 163Equity in net losses − − − − − (122) (66) (188)Interest – net − (7) (1) (3) (2) − − (13)Miscellaneous – net (8) (30) (8) − − 322 − 276Net income (loss) (US$66) (US$91) US$253 US$252 US$1,986 US$760 (US$2,045) US$1,049Identifiable assets US$4,872 US$23,287 US$3,379 US$3,771 US$6,318 US$50,082 (US$42,027) US$49,682Unallocated assets − − − 3,889 − 1,960 − 5,849Total assets US$4,872 US$23,287 US$3,379 US$7,660 US$6,318 US$52,042 (US$42,027) US$55,531Identifiable liabilities US$313 US$2,939 US$220 US$92 US$2,173 US$30,404 (US$46,416) (US$10,275)Unallocated liabilities − − − − − 28,525 28,525Total liabilities US$313 US$2,939 US$220 US$92 US$2,173 US$58,929 (US$46,416) US$18,250Capital expenditures US$741 US$947 US$1,304 US$171 US$259 US$348 US$− US$3,770Depreciation US$896 US$357 US$248 US$64 US$282 US$160 US$− US$2,007
The Group’s geographical markets refer only to the initial destination of the products. TheGroup’s products are intermediate products which are shipped to the customers’ plants forincorporation or further assembly into the final finished products. All assets of the Group, exceptfor equity investments in ICL, and assets attributed to Ionics-EMS (USA) are located in thePhilippines.
The Group’s geographical segments are based on the location of the Group’s assets. Sales toexternal customers disclosed in the geographical segments are based on the geographical locationof its customers.
The following tables represent the Group’s total revenue and certain assets based on the Group’sgeographical segment:
Segment Revenue
2016 2015 2014Asia US$30,407 US$43,669 US$42,419Europe 10,874 14,750 12,428North America 7,075 5,327 8,458
US$48,356 US$63,746 US$63,305
Segment Assets
2016 2015 2014Asia US$55,839 US$57,883 US$53,729North America 2,544 1,536 1,802
US$58,383 US$59,419 US$55,531

- 59 -
*SGVFS024032*
30. Acquisition of Additional Shares of a Subsidiary
On September 25, 2009, Philippine SEC approved EMS’ equity restructuring. The equityrestructuring resulted to issuance of common and preferred shares to the Parent Company, whichconsequently increased the ownership of EMS by 15%. The non-controlling interests wereadjusted to reflect the increase in ownership in the amount of US$0.13 million.
On March 2, 2010, the Parent Company and EMS jointly announced the proposed voluntarydelisting of EMS from the Singapore Exchange. In compliance with the delisting proposal, theParent Company offered to purchase the common shares issued to the non-controllingshareholders of EMS. In 2010, the Parent Company acquired an additional 104,801,455 shares or6.72% ownership of EMS for a total consideration of US$1.17 million.
The difference between the amount by which the non-controlling interests were adjusted and theconsideration paid to the non-controlling shareholders amounted to US$0.64 million. Thetransaction costs of US$0.23 million incurred in relation to the equity transaction was recognizeddirectly in equity.

ANNEX A
CERTIFICATE ON THE COMPILATION SER\TCBS FOR THE PRIPARATION OF THEFINANCIAL STATEMENTS AND NOTES TO THE FINANCIAL STATEMENTS
I hereby certifu that I am the Certified Public Accountant (CPA) who performed the compilationservices related to the preparation and presentation offurancial information ofan entity in accordance
with an applicable financial reporting framework and reports as required by accounting and auditingstandards for IONICS, INC. AND STIBSIDIARIES for the period ending December 31,2016.
In discharging this responsibility, I hereby declare that:
I, am the Senior Manager for Accounting and Budget of IONICS, INC. ANDSTIBSIDIARIES.
Furthermore, in my compilation services for the preparation of the Financial Statements and Notes to theFinancial Statements, I was not assisted by or did not avail of the services of SyCip Gorres Velayo & Co.
which is the external auditor who rendered the audit opinion for the said Financial Statements and Notesto the Financial Statements.
I hereby declare, under penalties of perjury and violation of the Revised Accountancy Law, that mystatements are true and correct.
o. 0038115
BOA ACCREDITATION NO.: 001975
VALID UNTIL: December 31, 2019