investor presentation 1q/13 analyst...
TRANSCRIPT

1Q/13 Analyst Meeting INTERCONTINENTAL HOTEL BANGKOK MAY 14, 2013 – 14.45-16.00 hrs
Investor Presentation Roadshow : SCB Securities & Goldman Sachs
Hong Kong May 23rd-24th
Disclaimer
This presentation includes forward-looking statements that are subject to risks and uncertainties, including those pertaining to the anticipated benefits to be realized from the proposals described herein. This presentation contains a number of forward-looking statements including, in particular, statements about future events, future financial performance, plans, strategies, expectations, prospects, competitive environment, regulation and supply and demand.
PTTGC has based these forward-looking statements on its views with respect to future events and financial performance. Actual financial performance of the entities described herein could differ materially from that projected in the forward-looking statements due to the inherent uncertainty of estimates, forecasts and projections, and financial performance may be better or worse than anticipated. Given these uncertainties, readers should not put undue reliance on any forward-looking statements.
Forward-looking statements represent estimates and assumptions only as of the date that they were made. The information contained in this presentation is subject to change without notice and PTTGC does not undertake any duty to update the forward-looking statements, and the estimates and assumptions associated with them, except to the extent required by applicable laws and regulations.
2
Agenda
PTTGC Business Profile Strategy and Execution Market Outlook 1Q/13 Performance Recap
3

A Chemical Flagship of PTT Group with Compelling Strengths
4
• Largest gas-based petrochemical producer in Thailand and the fifth in Asia
• Highly competitive cost structure with pricing arrangement for gas feedstock based upon equitable return on investment for both PTT and PTTGC
• Fully integrated petrochemical and refinery operations with diversified product portfolio covering full hydrocarbon chain
• Strong footprint in fast growing regions with 5 operating countries worldwide
• Committed to operational excellence targeting best in class/ first quartile business efficiency
$18.8bn SALES
$1.9bn EBITDA
$1.1bn NET PROFIT
3,509 EMPLOYEES
$812mn FREE CASH
FLOW*
>= 30% DIVIDEND
POLICY
2012 Figures, FX THB 30
8.45 MTPA CAPACITY
*Free cash flow for investment after excluding debt service and dividend

Flexible Feedstock and Highly Competitive Cost Structure
5
Flexible Feedstock and By-Product Enhancement
PTTGC's refinery (145 KBD) is one of the most complex refineries in Thailand, with Nelson Index of 10.17 and refining capacity accounting for 13% of country’s total capacity
Value enhancement from by-product exchange among Olefins, Aromatics and Refinery units highlights operational integration and efficiency:
- CR from Aromatics units sent to Refinery to produce middle distillate
- Pygas from Olefins unit sent to Aromatics for BTX - Offgas from Refinery sent to Cracker for olefins
products
Feedstock Supply Product Marketing
Refinery
Aromatics
Olefins / Polymers
Others
Condensate
Crude Oil
Others
Ethane, Propane, LPG
C5-C9
C10-C25
C2-C4
Olefins
100% Polymers (1)
46% (2)
54% (2)
Feedstock Supply Commercial Agreements Product Marketing Commercial Agreements
Customers
Others
70% (2)
30% (2)
103
318
799 824 830 883
951 967 1,006
-
200
400
600
800
1,000
1,200
MDEEthane
NAMEthane
NEA LPG NAMNaphtha
MDE LPG MDENaphtha
NEANaphtha
SEANaphtha
WEPNaphtha
Global Ethylene Cash Cost by Region
USD/Ton
2012E (3)
1. PTT owns 50%, PTTGC and IRPC each owns 25% in PTTPM. 2. FY12
(5)
Source: IHS (formerly CMAI) as of July 2012. Note: MDE = Middle East, NAM = North America, NEA = Northeast Asia, SEA = Southeast Asia, WEP = Western Europe.
3. PTTGC ethylene cash cost is based on Company estimate and ethane cracker only. 2012 PTTGC cash cost takes into account the effect of the renewal of gas price agreement. 4. MDE cash costs are average values of Iran and Saudi Arabia.
(5) (4)

35% 65%
85%
15%
72%
28%
93%
7% 69%
31%
Aromatics
77%
23%
1Q/13 Sales Portion by Business Unit
6
Refinery
Aromatics
Export
Domestic
Export Domestic
Export
Domestic
Olefins
Export
Domestic
Polymers
Export
Domestic
EO-Based
Export Domestic
Green (ME, FA)
Total Sales THB 141 billion
40% 21% PTTGC
Others 39%
34%
35%
31% PTTGC
39% 28% PTTGC
Others
Others 33%
By Thailand’s Market Share
HDPE
LDPE
LLDPE
Import
Import
Import
Sales portion in quantity (bbl/ton)

Natural Gas
Crude Palm Oil
Crude
Condensate
Cracker
Aromatics Plants
Refinery
Ethylene
HDPE
LLDPE
LDPE
MEG
Propylene
Oleochemicals
Paraxylene
Benzene
PTAPET Fiber/Resin
EO
Ethanolamine
Ethoxylate
Cyclohexane
CumenePhenol
Acetone
EB/SM
PS
BPA
Methyl Ester(B-100)
PC
Caprolactam Nylon 6
Fatty Alcohol
MMA PMMA
Epoxy Resins
ABS
SBR
PP
PTT Phenol
Petroleum Products- LPG- Reformate- Light Naptha- Jet Fuel- Diesel- Fuel Oil
Reformate, Heavy
Naphtha
Pygas
Condensate Residue,
Hydrogen
Light Naphtha
C3,C4
OffGas Mixed C4 Butadiene
PO
PUTDI/HDI
Toluene
Polyols
Orthoxylene
Cracker Bottom,
Hydrogen
PA Plasticizer
1. PTTGC does not currently produce these products.
REFINERY & SHARED FACILITIES AROMATICS OLEFINS POLYMERS EO-BASED
PERFORMANCE GREEN CHEMICALS HIGH VOLUME SPECIALTIES
Feedstock Upstream Intermediates Downstream Proximity to Suppliers and Customers
Exchange Stream Products By-Products
Potential Product Opportunities (1)
Petroleum Products - LPG - Reformate - Light Naphtha - Jet Fuel - Diesel - Fuel Oil
Fully Integrated Petrochemical and Refinery Operations with Diversified Product Portfolio
7

Organization Chart and Business Units
8

Agenda
PTTGC Business Profile Strategy and Execution Market Outlook 1Q/13 Performance Recap
9

PTTGC’s Strategies Overview
10
“To be a Leading Chemical Company for Better Living”

11
Execution Led by a Well Defined Strategy Core Uplift 1-Step Adjacencies Emerging Business Models
Methodical approach to achieving business excellence
Operational Excellence
Marketing Excellence
Synergy Project Excellence
Debottleneck CAPEX
Excellence
Reliability improvement
Energy efficiency improvement
Cost reduction
12 projects completed out of 105
Product development
Customer / Portfolio mgmt
Strategic pricing
Product upgrade
Cost saving from share tank and facility
Steam Cost reduction
PX expansion
BV Project
Quench oil tower modification
Capital Project Management
Engineering
Procurement
Construction
Project Mgmt.
1 2 3 4 5
1Q/13 EBITDA uplift USD 0.16 mn USD 45.9 mn USD 4.7 mn
“In 1Q/13, we achieved EBITDA uplift of USD 50.76 mn from Operational Excellence, Marketing Excellence, and Synergy Project Excellence”
FY13 Target EBITDA uplift for all Excellence programs USD 177 mn
Operational Excellence
------- LAGGARDS-------- -------- LEADERS ------
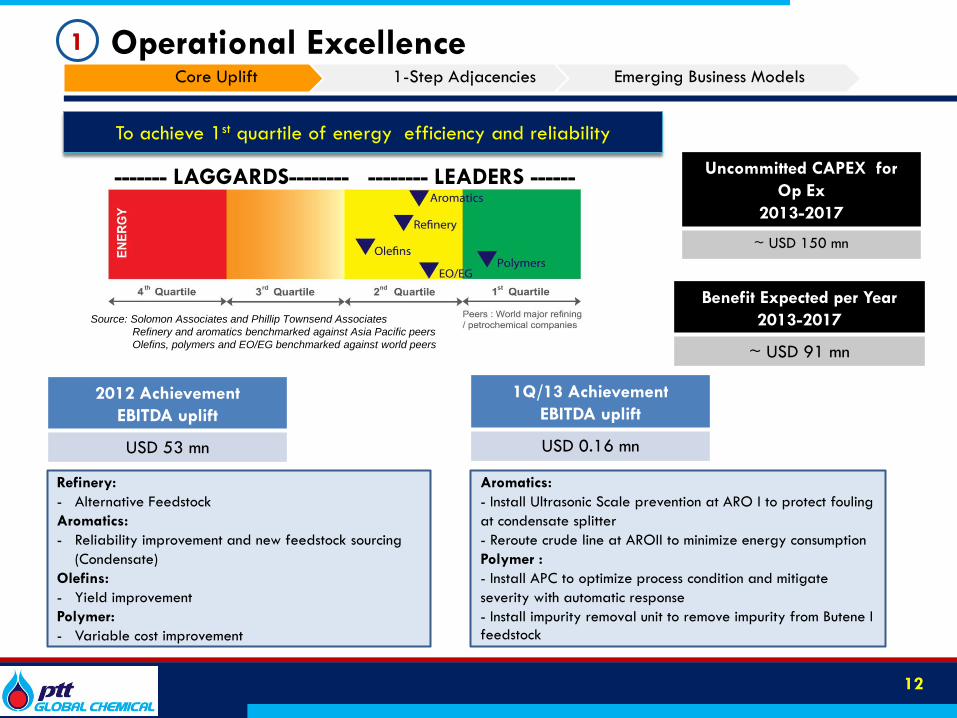
To achieve 1st quartile of energy efficiency and reliability
Benefit Expected per Year 2013-2017
~ USD 91 mn
2012 Achievement EBITDA uplift
USD 53 mn
Uncommitted CAPEX for Op Ex
2013-2017
~ USD 150 mn
12
Core Uplift 1-Step Adjacencies Emerging Business Models
Source: Solomon Associates and Phillip Townsend Associates Refinery and aromatics benchmarked against Asia Pacific peers Olefins, polymers and EO/EG benchmarked against world peers
1
1Q/13 Achievement EBITDA uplift
USD 0.16 mn
Refinery: - Alternative Feedstock Aromatics: - Reliability improvement and new feedstock sourcing
(Condensate) Olefins: - Yield improvement Polymer: - Variable cost improvement
Aromatics: - Install Ultrasonic Scale prevention at ARO I to protect fouling at condensate splitter - Reroute crude line at AROII to minimize energy consumption Polymer : - Install APC to optimize process condition and mitigate severity with automatic response - Install impurity removal unit to remove impurity from Butene I feedstock
Benefit Expected per Year 2013-2017
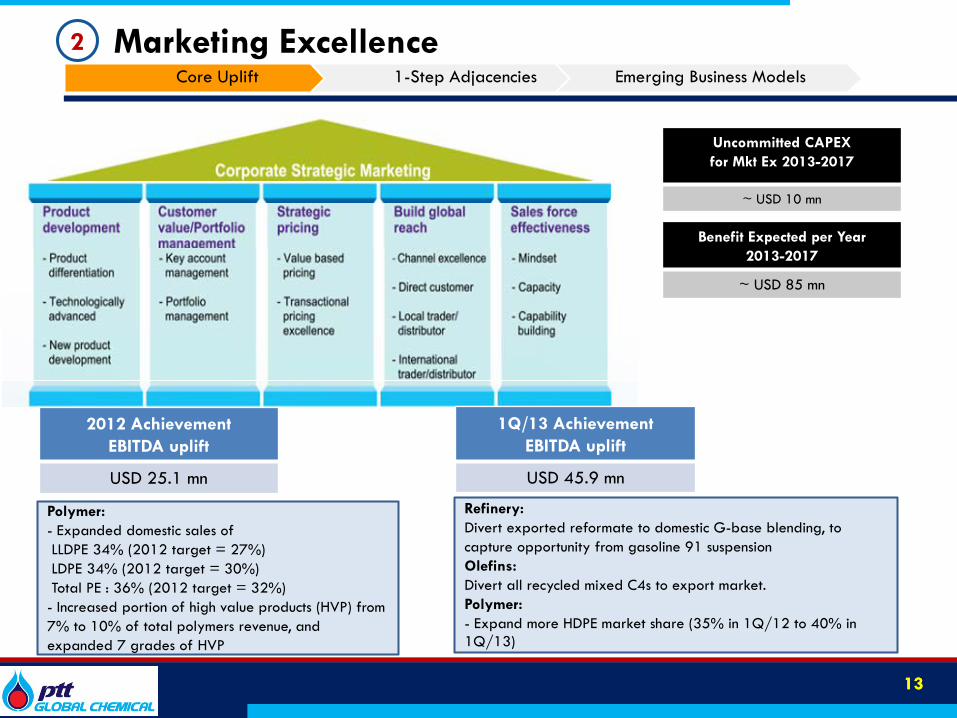
~ USD 85 mn
2012 Achievement EBITDA uplift
USD 25.1 mn
Uncommitted CAPEX for Mkt Ex 2013-2017
~ USD 10 mn
Marketing Excellence Core Uplift 1-Step Adjacencies Emerging Business Models
Polymer: - Expanded domestic sales of LLDPE 34% (2012 target = 27%) LDPE 34% (2012 target = 30%) Total PE : 36% (2012 target = 32%) - Increased portion of high value products (HVP) from 7% to 10% of total polymers revenue, and expanded 7 grades of HVP
13 13
2
1Q/13 Achievement EBITDA uplift
USD 45.9 mn
Refinery: Divert exported reformate to domestic G-base blending, to capture opportunity from gasoline 91 suspension Olefins: Divert all recycled mixed C4s to export market. Polymer: - Expand more HDPE market share (35% in 1Q/12 to 40% in 1Q/13)
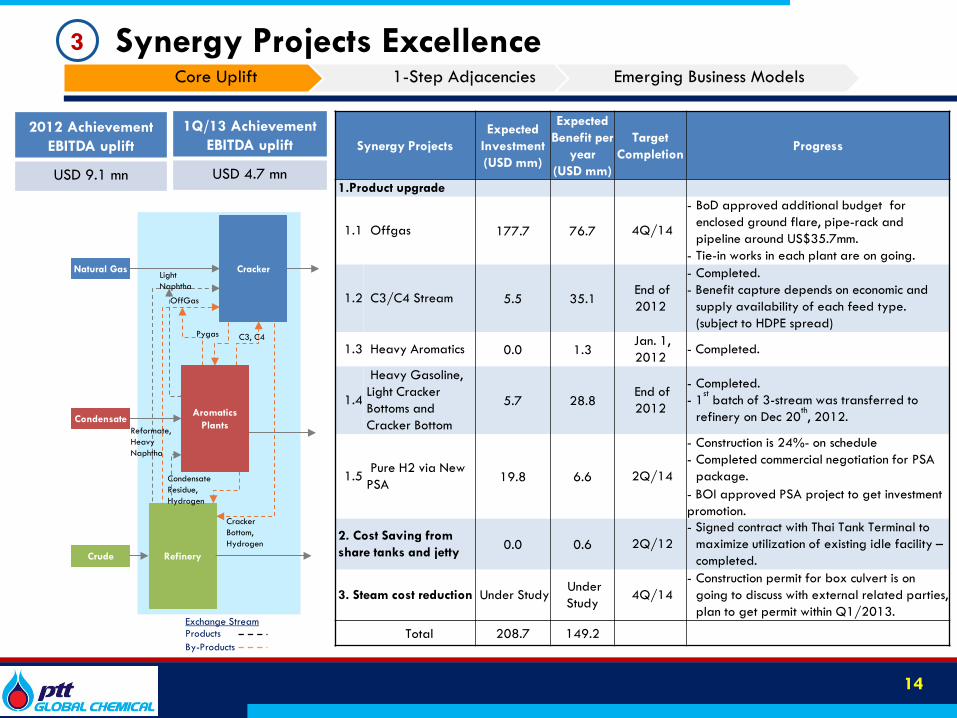
Synergy Projects Excellence
Exchange Stream Products By-Products
Synergy Projects Expected
Investment (USD mm)
Expected Benefit per
year (USD mm)
Target Completion
Progress
1.Product upgrade
1.1 Offgas 177.7 76.7 4Q/14
- BoD approved additional budget for enclosed ground flare, pipe-rack and pipeline around US$35.7mm.
- Tie-in works in each plant are on going.
1.2 C3/C4 Stream 5.5 35.1 End of 2012
- Completed. - Benefit capture depends on economic and
supply availability of each feed type. (subject to HDPE spread)
1.3 Heavy Aromatics 0.0 1.3 Jan. 1, 2012 - Completed.
1.4
Heavy Gasoline, Light Cracker Bottoms and Cracker Bottom
5.7 28.8 End of 2012
- Completed. - 1st batch of 3-stream was transferred to
refinery on Dec 20th, 2012.
1.5 Pure H2 via New PSA 19.8 6.6 2Q/14
- Construction is 24%- on schedule - Completed commercial negotiation for PSA
package. - BOI approved PSA project to get investment promotion.
2. Cost Saving from share tanks and jetty 0.0 0.6 2Q/12
- Signed contract with Thai Tank Terminal to maximize utilization of existing idle facility – completed.
3. Steam cost reduction Under Study Under Study 4Q/14
- Construction permit for box culvert is on going to discuss with external related parties, plan to get permit within Q1/2013.
Total 208.7 149.2
3
Cracker
Refinery
Natural Gas
Condensate
Crude
Light Naphtha
OffGas
Pygas C3, C4
Condensate Residue, Hydrogen
Cracker Bottom, Hydrogen
Reformate, Heavy Naphtha
Aromatics Plants
14
Core Uplift 1-Step Adjacencies Emerging Business Models
2012 Achievement EBITDA uplift
USD 9.1 mn
1Q/13 Achievement EBITDA uplift
USD 4.7 mn
15
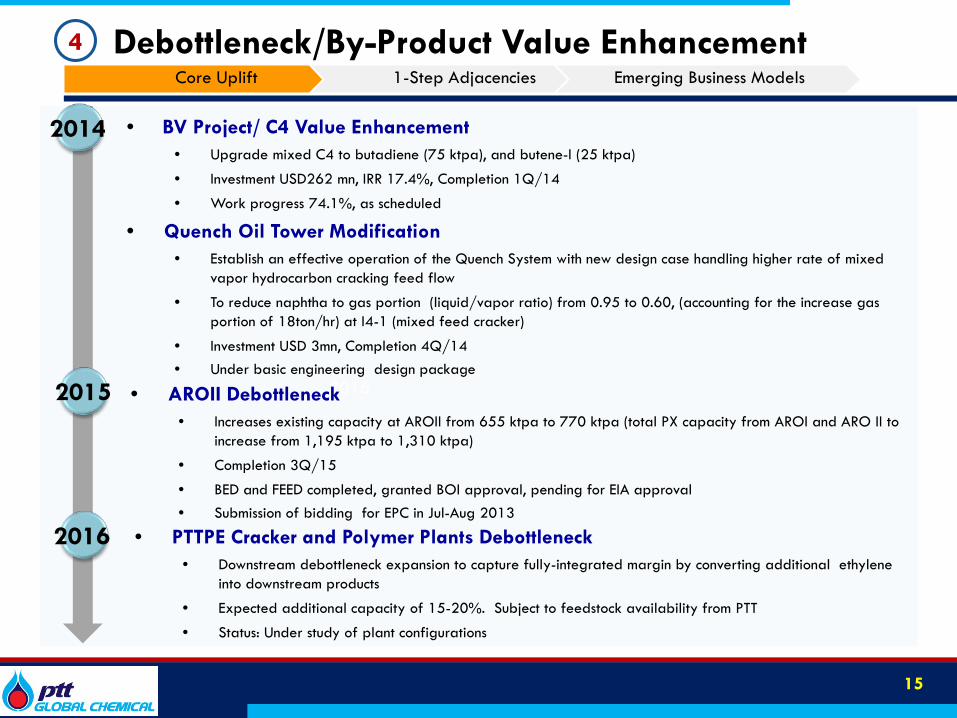
Debottleneck/By-Product Value Enhancement 4 Core Uplift 1-Step Adjacencies Emerging Business Models
• BV Project/ C4 Value Enhancement • Upgrade mixed C4 to butadiene (75 ktpa), and butene-I (25 ktpa)
• Investment USD262 mn, IRR 17.4%, Completion 1Q/14
• Work progress 74.1%, as scheduled
• Quench Oil Tower Modification • Establish an effective operation of the Quench System with new design case handling higher rate of mixed
vapor hydrocarbon cracking feed flow
• To reduce naphtha to gas portion (liquid/vapor ratio) from 0.95 to 0.60, (accounting for the increase gas portion of 18ton/hr) at I4-1 (mixed feed cracker)
• Investment USD 3mn, Completion 4Q/14 • Under basic engineering design package
2014
2016 2015
2016
• AROII Debottleneck • Increases existing capacity at AROII from 655 ktpa to 770 ktpa (total PX capacity from AROI and ARO II to
increase from 1,195 ktpa to 1,310 ktpa)
• Completion 3Q/15
• BED and FEED completed, granted BOI approval, pending for EIA approval • Submission of bidding for EPC in Jul-Aug 2013
• PTTPE Cracker and Polymer Plants Debottleneck • Downstream debottleneck expansion to capture fully-integrated margin by converting additional ethylene
into downstream products
• Expected additional capacity of 15-20%. Subject to feedstock availability from PTT
• Status: Under study of plant configurations

16
CAPEX Excellence
Capital Project management Engineering Procurement Construction Project management
Important value levers for capex optimization
Visi
on Be a world-class center of excellence for
capital projects and maintenance service
Capital Project Management
Management System (organization, roles, processes, systems)
People system (capabilities, mindsets and behaviors)
Conceptual design
FEED
Detailed design
Quality gate approach
Eng. Process mgmt.
Minor plant modification, small proj.
Lean engineering
Cost effective sourcing
Global sourcing
Life cycle cost assessment.
Vendor management
Demand management
Procurement process mgmt.
Construction process mgmt.
Subcontractor management
Site management
Site safely
Testing commissioning
Master scheduling/
schedule mgmt.
People and resource mgmt.
Proj. cost control
Risk identification and mitigation
Perf. mgmt. (Incl KPls)
Interface mgmt.
Contract and claim mgmt.
Document control
1.1
1.2
1.3
1.4
1.5
1.6
1.7
2.1
2.2
2.3
2.4
2.5
2.6
31
3.2
3.3
3.4
3.5
4.1
4.2
4.3
4.4
4.5
4.6
4.7
4.8
Syst
ems,
Cap
abili
ties,
Proc
esse
s, To
ols
(1) Engineering (2) Procurement (3) Construction (4) Project mgmt.
Core Uplift 1-Step Adjacencies Emerging Business Models
5
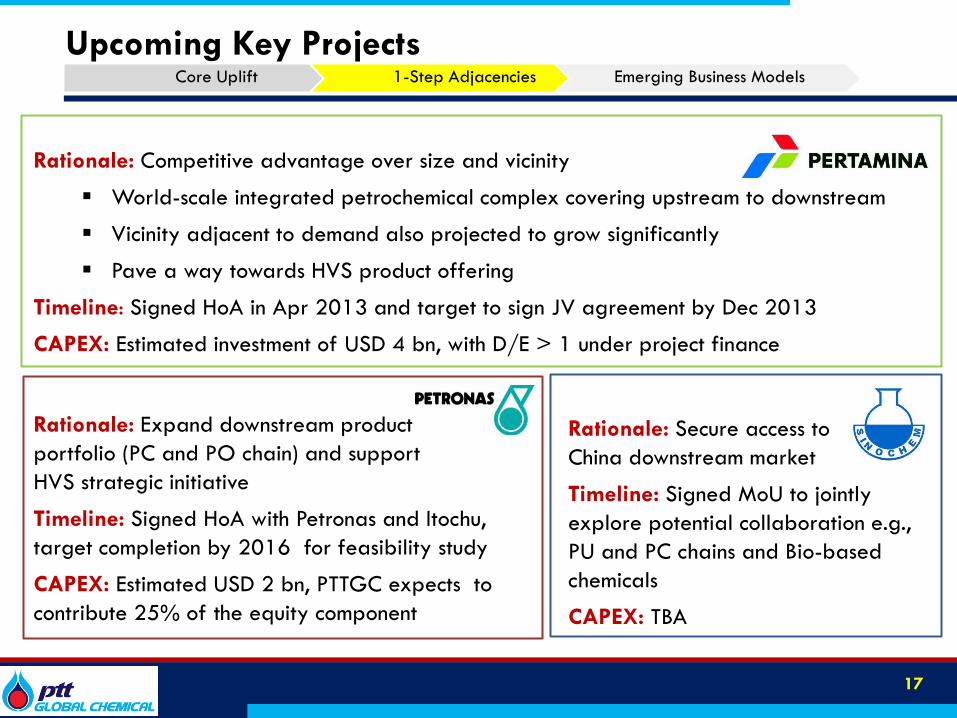
Upcoming Key Projects Core Uplift 1-Step Adjacencies Emerging Business Models
Rationale: Expand downstream product portfolio (PC and PO chain) and support HVS strategic initiative
Timeline: Signed HoA with Petronas and Itochu, target completion by 2016 for feasibility study
CAPEX: Estimated USD 2 bn, PTTGC expects to contribute 25% of the equity component
Rationale: Competitive advantage over size and vicinity
World-scale integrated petrochemical complex covering upstream to downstream
Vicinity adjacent to demand also projected to grow significantly
Pave a way towards HVS product offering
Timeline: Signed HoA in Apr 2013 and target to sign JV agreement by Dec 2013
CAPEX: Estimated investment of USD 4 bn, with D/E > 1 under project finance
17
Rationale: Secure access to China downstream market
Timeline: Signed MoU to jointly explore potential collaboration e.g., PU and PC chains and Bio-based chemicals
CAPEX: TBA
18
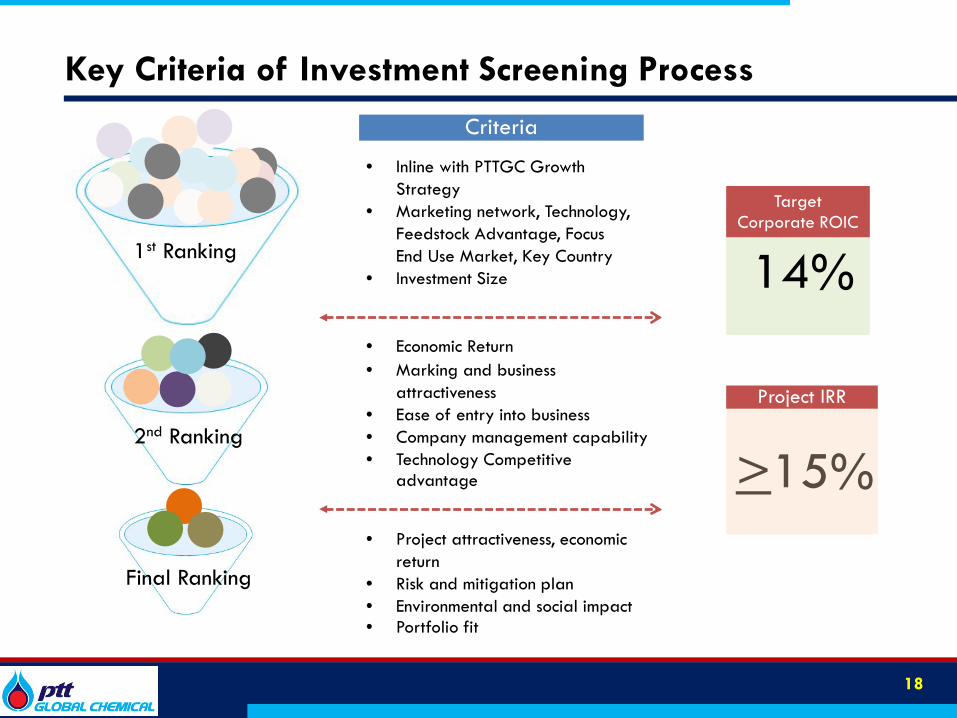
1st Ranking
2nd Ranking
Final Ranking
• Inline with PTTGC Growth Strategy
• Marketing network, Technology, Feedstock Advantage, Focus End Use Market, Key Country
• Investment Size
Criteria
• Economic Return
• Marking and business attractiveness
• Ease of entry into business • Company management capability • Technology Competitive
advantage
• Project attractiveness, economic return
• Risk and mitigation plan • Environmental and social impact • Portfolio fit
Target Corporate ROIC
14%
Project IRR
>15%
Key Criteria of Investment Screening Process

2011 Target2017
Target2022
Operational Excellence, Marketing Excellence, Capital Expenditure Excellence
Continues to Strive for Strong Profitable Growth
19
Synergy Project Excellence
Debottleneck
563
HVS
Green
Sales in THB Bn
Phase 1: Foundation for Growth Phase 2: The Growth Mode
We aim to grow ~5 percent p.a. in the next ten years
HVS
Green
New Global Hub
Expected EBITDA Benefit Uplift 15-30%
~ 620 - 650
Actual 2012
Based on constant Dubai crude year 2012 at USD 109 per bbl
~ 800 - 900
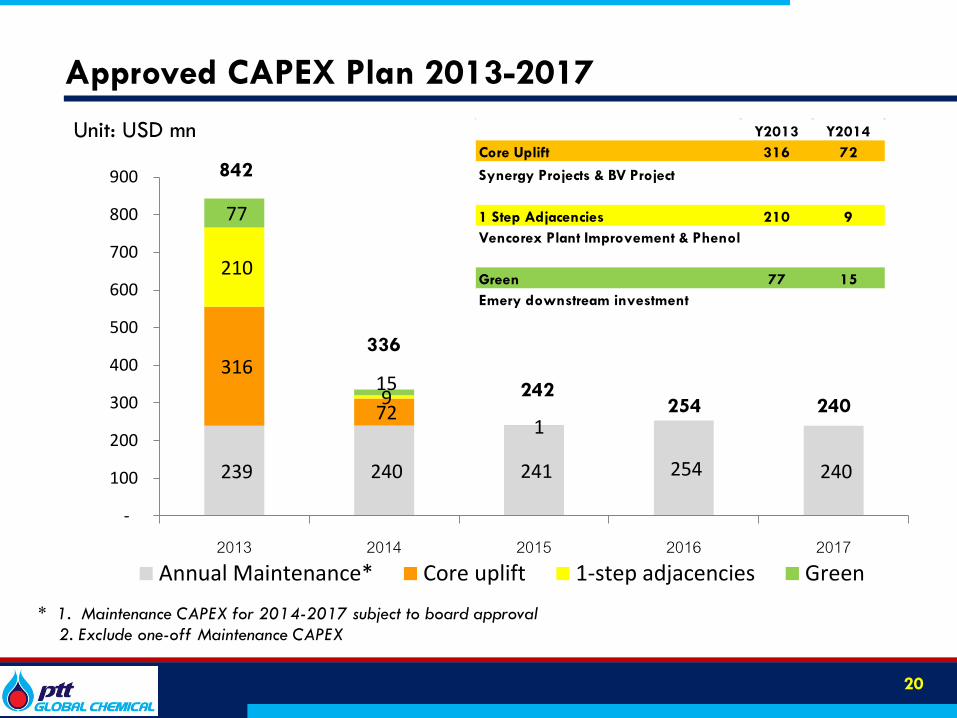
Approved CAPEX Plan 2013-2017
239 240 241 254 240
316
72
210
9
77
15
1
-
100
200
300
400
500
600
700
800
900
2013 2014 2015 2016 2017 Annual Maintenance* Core uplift 1-step adjacencies Green
Million USD 842
336
242 254 240
20
Unit: USD mn
* 1. Maintenance CAPEX for 2014-2017 subject to board approval 2. Exclude one-off Maintenance CAPEX
Y2013 Y2014Core Uplift 316 72
Synergy Projects & BV Project
1 Step Adjacencies 210 9Vencorex Plant Improvement & Phenol
Green 77 15Emery downstream investment

21
Uncommitted CAPEX Plan USD 4.5 bn 2013-2017
31%
64%*
5%
*64% excluding the purchase of PPCL as already included in approved CAPEX
Core Uplift
1 Step Adjacencies
Green

Agenda
PTTGC Business Profile Strategy and Execution Market Outlook 1Q/13 Performance Recap
22
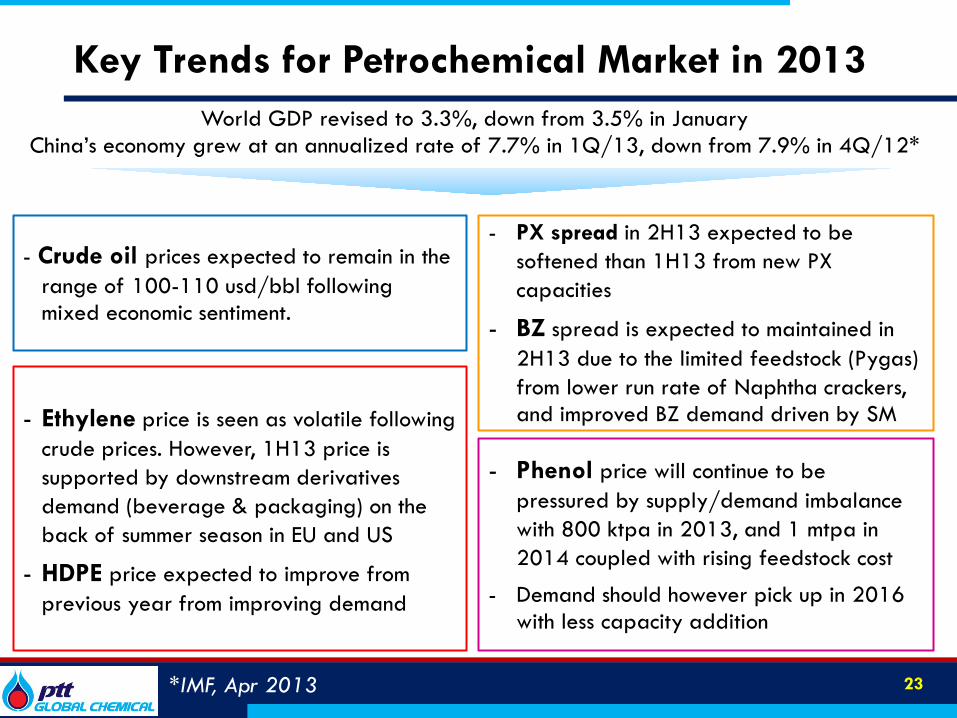
- PX spread in 2H13 expected to be softened than 1H13 from new PX capacities
- BZ spread is expected to maintained in 2H13 due to the limited feedstock (Pygas) from lower run rate of Naphtha crackers, and improved BZ demand driven by SM - Ethylene price is seen as volatile following
crude prices. However, 1H13 price is supported by downstream derivatives demand (beverage & packaging) on the back of summer season in EU and US
- HDPE price expected to improve from previous year from improving demand
Key Trends for Petrochemical Market in 2013
23
World GDP revised to 3.3%, down from 3.5% in January China’s economy grew at an annualized rate of 7.7% in 1Q/13, down from 7.9% in 4Q/12*
- Crude oil prices expected to remain in the range of 100-110 usd/bbl following mixed economic sentiment.
*IMF, Apr 2013
- Phenol price will continue to be pressured by supply/demand imbalance with 800 ktpa in 2013, and 1 mtpa in 2014 coupled with rising feedstock cost
- Demand should however pick up in 2016 with less capacity addition
Agenda
PTTGC Business Profile Strategy and Execution Market Outlook 1Q/13 Performance Recap
24

1Q/13 Key Achievement and Milestone
• Completed amalgamation between PTTUT and IPT. PTTGC holds 30.31% in mergedco GPSC to strengthen business operation of utilities
• Combined BPE and PTTPE into PTTGC to streamline business integration
• Acquired remaining 40% shareholding of PPCL from PTT to pursue its downstream investment and capture the fully integrated value of Phenol chain. PTTGC currently holds 100% since May 2, 2013.
Streamline and
strengthen business structure
• Plant availability with flat out utilization rates • Excellence programs achieved as planned- contributed USD 50.6 mn
• Strengthening USD exposure contributed to FX gain of THB 1,986 mn
• Paid 3.40 THB/share of dividend, 45% payout ratio
Develop a Solid
Business
• HoA with Indonesia’s PT Pertamina for future investment in new petrochemical complex (world scale naphtha cracker and downstream derivatives)
• MoU with IRPC for feasibility study on downstream products including polyol and styrenic
• Mechanical completion at Myriant’s Succinid Acid plant in Louisiana (14 ktpa) • Commissioning at Natureworks’ PLA expansion unit to expand PLA capacity
from 140 ktpa to 150 ktpa
Pursue Three-Pillar
Strategy
25

Key Financial Highlights
Revenue increased 6% YoY primarily from sales increase in Aromatics and Olefins AROII turnaround 30 days in 1Q/12, I4-2 turnaround 33 days in 1Q/12
Net Income increased 23% YoY and 16% QoQ due mainly to higher utilization rates and higher product prices
Unit in THB million
*Changes in the classification of catalyst, from operating expenses to be in the depreciation and amortization, according to the accounting policy effective since 1Q/2013 onward. **Adjusted EBITDA refers to EBITDA excluding impact of inventory value (excludes Inventory and NRV) and excluding impact of commodity hedging
Revenue 133,666 144,595 141,309 6% -2%EBITDA 14,988 16,553 16,419 10% -1%EBITDA Margin (%) 11% 11% 12% 1% 1%Net Income 9,852 10,388 12,075 23% 16%EPS (THB/share) 2.2 2.3 2.7 23% 17%
Adjusted EBITDA** 11,483 16,584 16,914 47% 2%Adjusted EBITDA Margin (%) 9% 11% 12% 3% 1%
QoQ1Q/20131Q/2012* 4Q/2012* YoY
26

27
70
24 27
8 4 1
66
31 30
7 9 1
64
30 32
7 8
0.1
Refinery Aromatics Olefins andDerivatives
Green HVS Others
1Q/12 4Q/12 1Q/13
1.6 1.2
7.3
0.5 0.2 0.7
2.0
4.3
8.5
0.2 0.8 0.8
1.9
4.2
9.6
0.6 0.3 0.3
Refinery Aromatics Olefins andDerivative
Green HVS Others
1Q/12 4Q/12 1Q/13
45%
21%
23%
5% 6%
0.1%
11%
26%
58%
3% 2% 2%
Unit in THB bn Revenue Breakdown Unit in THB bn Adjusted EBITDA Breakdown
1Q/13 Revenue Breakdown (%) 1Q/13 EBITDA Breakdown (%) Adjusted EBITDA Margin by Core BU
Segmental Results – 1Q/13 Olefins and Olefins Derivatives Business contributed greatly to EBITDA
1Q/12 4Q12 1Q/13Refinery 2% 3% 3%Aromatics 5% 14% 14%Olefins and Derivatives 27% 28% 30%HVS (Phenol+Vencorex) 5% 9% 4%
Refinery
Aromatics
Green HVS Others
Refinery
Aromatics
Olefins and Olefins Derivatives
Phenol Green
Others
THB 141 Bn
THB 16 Bn
Olefins and Olefins Derivatives

34,673
240,497
238,045
100,830 150,392
60,062 47,625
39,240
221,185
245,451
104,235 129,598
55,982 45,592
Strong Financial Position
28
• Free Cash Flow for Investment
• Key Financial Ratios As of Dec 31, 2012 As of Mar 31, 2013
THB 421 bn THB 436 bn
Cash + ST Investment
CA
PPE
Non CA
Share holders’ Equity
IBD
Liab.
• Balance Sheet
Dec 31, 12 Mar 31, 13
ROA 10.43% 11.13%
ROE 16.16% 16.39%
Net IBD / Equity 0.45 0.38
Net IBD / EBITDA 1.97 1.63
THB bn
7.4 9.9 6.0
24.3
7.2 2.0
8.1 26.8
30.5
2.3 9.4
18.1
32.8
54.9
1Q/12 2Q/12 3Q/12 4Q/12 1Q/13
FCF for InvestmentDebt Service and DividendCash from Operation
9.5
Agency Credit Rating
Moody’s Baa2
S&P BBB

9.7 11.6
7.1 9.5
19.2
11.6
7.8
11.7
0.5
29.4
-
5.0
10.0
15.0
20.0
25.0
30.0
35.0
40.0
45.0
50.0
2013 2014 2015 2016 2017 2018 2019 2020 2021 2022
PTTGC PPCL Others
59%
41%
2%
37%
61%
Diversified Debt Exposure and Repayment Schedule
29
Cost of long term debts ~ 5.0% (Include W/H Tax)
Average loan life after refinancing - 5.4 Years
Debt Profile as at Mar 31, 2013
Maturity of Financial Debt as at Mar 31, 2013
Debenture
ST Loan
LT Loan
THB
USD & Foreign
THB Billion
Treasury policy Net IBD to Equity ratio of ≤ 0.7x Net IBD to EBITDA ratio of ≤ 2.4x
69%
31%
Floated
Fixed

PTTGC’s Way Forward
FY13- another year to achieve high performance as targeted, with EBITDA uplift up to 30% towards 2017 following Operational Excellence, Marketing Excellence, Synergy Projects, and Debottlenecking
Continue to pursue the target for strong profitable
growth CAGR ~2-3% towards 2017 with expected revenue increase to THB 620-650 bn
CAGR ~5-7% towards 2022 with expected revenue increase to THB 800-900 bn
30
For further information & enquiries, please contact our Investor Relations Team at [email protected]
Thank You
1. Thitipong Jurapornsiridee VP - Corporate Finance & IR [email protected] +662-265-8574 2. Panugorn Puengpradit IR Analyst [email protected] +662-140-8714 3. Prang Chudasring IR Analyst [email protected] +662-265-8327 4. Sinida Petchveerakul IR Analyst [email protected] +662-140-8713
31
Appendix
Shutdown Schedule 1Q/13 Segmental Result Product Additional Demand/Supply
32
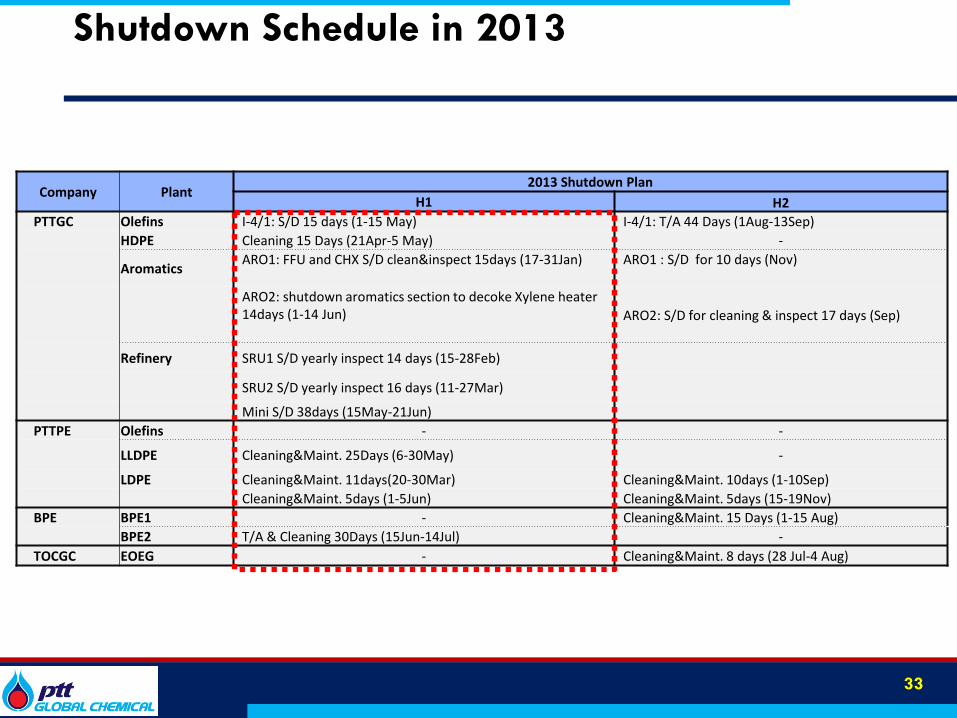
Shutdown Schedule in 2013
33
Company Plant
2013 Shutdown Plan
H1 H2
PTTGC Olefins I-4/1: S/D 15 days (1-15 May) I-4/1: T/A 44 Days (1Aug-13Sep)
HDPE Cleaning 15 Days (21Apr-5 May) -
Aromatics ARO1: FFU and CHX S/D clean&inspect 15days (17-31Jan) ARO1 : S/D for 10 days (Nov)
ARO2: shutdown aromatics section to decoke Xylene heater 14days (1-14 Jun) ARO2: S/D for cleaning & inspect 17 days (Sep)
Refinery SRU1 S/D yearly inspect 14 days (15-28Feb)
SRU2 S/D yearly inspect 16 days (11-27Mar)
Mini S/D 38days (15May-21Jun)
PTTPE Olefins - -
LLDPE Cleaning&Maint. 25Days (6-30May) -
LDPE Cleaning&Maint. 11days(20-30Mar) Cleaning&Maint. 10days (1-10Sep)
Cleaning&Maint. 5days (1-5Jun) Cleaning&Maint. 5days (15-19Nov)
BPE BPE1 - Cleaning&Maint. 15 Days (1-15 Aug)
BPE2 T/A & Cleaning 30Days (15Jun-14Jul) -
TOCGC EOEG - Cleaning&Maint. 8 days (28 Jul-4 Aug)

Appendix
Shutdown Schedule 1Q/13 Segmental Result Product Additional Demand/Supply
34

13% 14% 13%
47% 50% 47%
11% 8% 13%
22% 22% 19% 7% 7% 7%
0
5
10
15
20
1Q/12 4Q/12 1Q/13
Mill
ions
1Q/12 4Q/12 1Q/13 YoY QoQMarket GRM 3.80 4.66 4.37 15% -6% Hedging Gain/(Loss) 0.16 0.63 0.27 63% -58% Stock Gain/(Loss) Net NRV 4.9 -0.63 -0.91 -119% 44%
Accounting GRM 8.86 4.66 3.73 -58% -20%
Quarter +/-
Refinery BU Performance Market GRM softened QoQ upon slightly higher feed price
35
147 146 146
35 55 58
101% 101% 101%
0%
20%
40%
60%
80%
100%
120%
0
50
100
150
200
250
1Q/12 4Q/12 1Q/13
Crude CR+Other feed CDU rate
4.0
1.6 1.4 1.5
2.0 1.9
0.0
0.5
1.0
1.5
2.0
2.5
3.0
3.5
4.0
4.5
1Q/12 4Q/12 1Q/13
EBITDA Adjusted EBITDA
Total Production Volume (mbbl)
Others Ref+LN
Jet
Diesel
Fuel Oil
16.0 mbbl 17.8 mbbl 18.4 mbbl
Unit in THB bn
Total Intake in KBD CDU U-Rate
1Q/12 4Q/12 1Q/13 YoY QoQDubai crude 116 107 108 -7% 1%ULG95-Dubai 14 14 19 36% 36%Jet-Dubai 16 19 20 25% 5%Diesel-Dubai 18 20 20 9% 0%FO-Dubai -3 -9 -7 133% -22%
Quarter +/-
usd/bbl
182 201 204

1,006
1,359 1,233
200
255 244
73%
91% 92%
0%
10%
20%
30%
40%
50%
60%
70%
80%
90%
100%
0
200
400
600
800
1,000
1,200
1,400
1,600
1,800
1Q/12 4Q/12 1Q/13
Condensate Reformate + Other feed BTX rate
23% 22% 24%
16% 14% 15%
23%
24% 23%
28%
30% 27% 10%
11% 11%
-
200
400
600
800
1,000
1,200
1,400
1,600
1Q/12 4Q/12 1Q/13
1Q/12 4Q/12 1Q/13 YoY QoQP2F 196 387 394 101% 2% Hedging Gain/(Loss) 1 -5 0 -100% -100% Stock Gain/(Loss) Net NRV 66 -2 -1 -102% -50%
Accounting P2F 263 380 393 49% 3%
Quarter +/-
36
Aromatics BU Performance P2F higher YoY and QoQ upon improved
Others
Ref+LN
CR
BZ+CX
PX group
1.9
4.1 4.2
1.0
4.2 4.2
0.00.51.01.52.02.53.03.54.04.5
1Q/12 4Q/12 1Q/13
EBITDA Adjusted EBITDA
Total Production Volume in Kton
Unit in THB bn
Total intake in kton
1,110
1,488 1,357
1,206
1,614 1,477
1Q/12 4Q/12 1Q/13 YoY QoQCondensate 1,006 925 944 -6% 2%PX FECP-Condensate 556 610 681 22% 12%BZ SPOT KR-Condensate 175 437 435 149% 0%Naphtha-Condensate 15 19 17 13% -11%
Quarter +/-
usd/ton
17%
83%
16%
84%
16%
84%

37
Olefins and Olefins Derivatives BU Performance
Sales Volume in Kton and Utilization Rates
*Olefins’ external sales
Price and Spread in USD/ton
84% 89% 88%
16% 11% 12%
1Q/12 4Q/12 1Q/13
Gas Naphtha
1Q/12 4Q/12 1Q/13% + / -
YoY
% + / -
QoQ
Naphtha 1,021 944 961 -6% 2%HDPE 1,395 1,393 1,482 6% 6% HDPE-Naphtha 374 449 521 39% 16%LLDPE 1,318 1,399 1,477 12% 6% LLDEP-Naphtha 297 455 516 74% 13%LDPE 1,391 1,369 1,459 5% 7% LDPE-Naphtha 370 425 498 35% 17%MEG 1,237 1,247 1,282 4% 3%MEG-0.65 Ethylene 424 411 375 -12% -9%
7.2 8.4
9.6
1Q/12 4Q/12 1Q/13
Total intake
883 kton 879 kton 1,012 kton
Olefins and Olefins Derivatives Adjusted EBITDA Margin in THB bn
Sales Volume Utilization Rate Sales Volume Utilization RateSales Volume Utilization Rate YoY QoQOlefins* 175 85% 169 88% 200 97% 14% 19%HDPE 182 105% 203 100% 216 109% 19% 7%LLDPE 99 100% 117 111% 102 113% 3% -13%LDPE 60 71% 63 71% 75 101% 26% 19% Total Polyethylene 340 93% 383 100% 393 109% 15% 3%MEG 69 79% 101 96% 83 97% 20% -18%
1Q/12 4Q/12 1Q/13 % +/ -

38
Phenol Performance
Sales Volume in Kton and Utilization Rates
75%
25%
Sales Portion of all Products in Quantity (%)
Export
Domestic
Contract 93% Spot 7%
Contract 53% Spot 47%
0.17 0.23
0.15
0.000.050.100.150.200.25
1Q/12 4Q/12 1Q/13
Phenol Adjusted EBITDA in THB bn
Phenol and BPA P2F in USD/ton*
Phenol and BPA Market Spread in USD/ton*
P2F = PH + 0.62 AC – 0.872 BZ – 0.468 PY P2F = BPA - 0.853 PH – 0.275 AC
1Q/12 4Q/12 1Q/13 YoY QoQPhenol 1,473 1,484 1,523 3% 3%Phenol-BZ 293 111 143 -51% 29%BPA-Phenol 217 242 356 64% 47%
Quarter +/-
* Source: PPCL
45 41 38
13 35
25
97%
129% 126%
27%
83%
60%
0%
20%
40%
60%
80%
100%
120%
140%
-
10
20
30
40
50
60
70
80
1Q/12 4Q/12 1Q/13
Phenol BPA Phenol U-rate BPA U-rate
1Q/12 4Q/12 1Q/13 YoY QoQPhenol Margin 489 362 405 -17% 12%BPA Margin 146 166 282 93% 70%
Quarter +/-
39
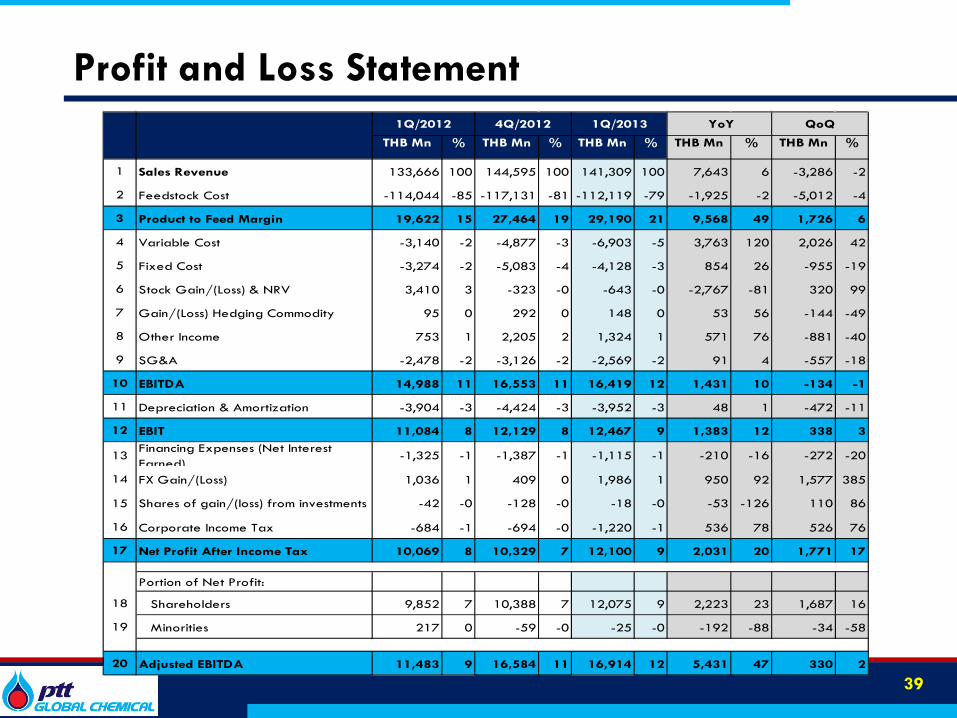
THB Mn % THB Mn % THB Mn % THB Mn % THB Mn %
1 Sales Revenue 133,666 100 144,595 100 141,309 100 7,643 6 -3,286 -2
2 Feedstock Cost -114,044 -85 -117,131 -81 -112,119 -79 -1,925 -2 -5,012 -4
3 Product to Feed Margin 19,622 15 27,464 19 29,190 21 9,568 49 1,726 6
4 Variable Cost -3,140 -2 -4,877 -3 -6,903 -5 3,763 120 2,026 42
5 Fixed Cost -3,274 -2 -5,083 -4 -4,128 -3 854 26 -955 -19
6 Stock Gain/(Loss) & NRV 3,410 3 -323 -0 -643 -0 -2,767 -81 320 99
7 Gain/(Loss) Hedging Commodity 95 0 292 0 148 0 53 56 -144 -49
8 Other Income 753 1 2,205 2 1,324 1 571 76 -881 -40
9 SG&A -2,478 -2 -3,126 -2 -2,569 -2 91 4 -557 -18
10 EBITDA 14,988 11 16,553 11 16,419 12 1,431 10 -134 -1
11 Depreciation & Amortization -3,904 -3 -4,424 -3 -3,952 -3 48 1 -472 -11
12 EBIT 11,084 8 12,129 8 12,467 9 1,383 12 338 3
13Financing Expenses (Net Interest Earned)
-1,325 -1 -1,387 -1 -1,115 -1 -210 -16 -272 -20
14 FX Gain/(Loss) 1,036 1 409 0 1,986 1 950 92 1,577 385
15 Shares of gain/(loss) from investments -42 -0 -128 -0 -18 -0 -53 -126 110 86
16 Corporate Income Tax -684 -1 -694 -0 -1,220 -1 536 78 526 76
17 Net Profit After Income Tax 10,069 8 10,329 7 12,100 9 2,031 20 1,771 17
Portion of Net Profit:
18 Shareholders 9,852 7 10,388 7 12,075 9 2,223 23 1,687 16
19 Minorities 217 0 -59 -0 -25 -0 -192 -88 -34 -58
20 Adjusted EBITDA 11,483 9 16,584 11 16,914 12 5,431 47 330 2
1Q/20134Q/2012 YoY QoQ1Q/2012
Profit and Loss Statement

Appendix
Shutdown Schedule 1Q/13 Segmental Result Product Additional Demand/Supply
40

434 427 394 378 345 439 431 411
961 894 872 854
1,395 1,321
1,267 1,232 1,306 1,333
1,303 1,265
0
200
400
600
800
1,000
1,200
1,400
1,600
1Q/13F 2Q/13F 3Q/13F 4Q/13F
Olefins Improved derivatives demand will support to Olefins market
USD/Ton Short-term Price Forecast Short-Term • Olefins prices were expected to remain high in
1H-13 due to improve demand in derivatives markets in line with new PE plants in Asia will come on-stream
• However the market will be pressured from
1) Additional new supply in Middle East and Asia (especially in China and Singapore) in the second half of the year
2) Lighter turnaround plan at Asia cracker in 2013
Long-term Supply/Demand
41
Additional (2012-2017) (Unit : MMT)
Supply Demand 36.26 30.92
America16%
Middle East20%
Europe2%
China42%
Other Asia20%
Source: CMAI April 2013
-2,0000
2,0004,0006,0008,000
10,00012,000
2012 2013 2014 2015 2016 2017 America Europe Middle East China Other Asia Additional demand
Unit : KMT
Saudi Polymers Saudi 1,200 KMT Q3-11 to Q3-12
Reliance India 1,350 KMT Q1-16 to Q3-16
SINOPEC Wuhan CH 800 KMT Q1-11 to Q3-13
ExxonMobil SG 1,000 KMT Q3-11 to Q2-13
Chandra Asri Indonesia 400 KMT Q1-14 to Q3-15
Daqing PC China 600 KMT Q1-11 to Q3-12
Fushun PC China 800 KMT Q1-10 to Q3-12
Sichuan PC China 1,000 KMT Q3-11 to Q4-13
Ilam Iran 458 KMT Q1-15 to Q1-16
BPCL India 220 KMT Q3-11 to Q4-15
CNOOC & Shell China 1,000 KMT Q1-16 to Q1-17

521 506 458 494 516 449 453 474 498 489 446 479
961 894 872 854
1,482 1,400 1,330 1,348 1,477
1,365
1,325
1,328 1,459
1,383
1,319
1,333
0
200
400
600
800
1,000
1,200
1,400
1,600
1Q/13F 2Q/13F 3Q/13F 4Q/13F
Short-term Price Forecast USD/Ton Short-Term • More new PE supplies in Asia (Mainly
from China) and strong buying resistance from end-use producers due to squeezed margin will weigh on PE markets especially in the second half of the year
• However, PE prices will show the sign of recovery according to the global economic
Polyethylene: HDPE The market will be pressured from new supply in the short term
HDPE Long-term Supply/Demand
Additional (2012-2017) (Unit : MMT)
Supply Demand 11.97 10.36
America20%
Middle East24%
Europe1%
China44%
Other Asia11%
Source: CMAI April 2013
-5000
5001,0001,5002,0002,5003,000
2012 2013 2014 2015 2016 2017 America Europe Middle East China Other Asia Additional demand
Saudi Polymers Saudi 550 KMT Q3-11 to Q3-12
Ilam Iran 300 KMT Q1-14 to Q1-15
SINOPEC Wuhan CH 300 KMT Q1-11 to Q3-13
Saudi Polymers Saudi 550 KMT Q3-11 to Q1-13
BPCL India 110 KMT Q3-13 to Q4-14
Daqing PC China 400 KMT Q1-11 to Q3-12
OPAL India 350 KMT Q1-13 to Q3-14
Fushun PC China 575 KMT Q1-10 to Q3-12
Sichuan PC China 300 KMT Q1-12 to Q4-13
Shaanxi Yanchang China 250 KMT Q3-14 to Q1-16
Unit : KMT
42

Polyethylene : LLDPE & LDPE New Capacities and Closures
43 Source: CMAI April 2013
LDPE Long-term Supply/Demand
LLDPE Long-term Supply/Demand
Additional (2012-2017) (Unit : MMT)
Supply Demand 11.49 7.91
Additional (2012-2017) (Unit : MMT)
Supply Demand 5.35 3.44
America24%
Middle East7%
Europe0%
China40%
Other Asia29%
America22%
Middle East30%
Europe12%
China28%
Other Asia8%
-5000
5001,0001,5002,0002,5003,0003,500
2012 2013 2014 2015 2016 2017
America Europe Middle East China Other Asia Additional demand
Unit : KMT
SINOPEC Wuhan China 300 KMT Q1-11 to Q3-13
ExxonMobil Sing. 1,300 KMT Q1-11 to Q4-12
Fushun PC China 225 KMT Q2-10 to Q3-12
Sichuan PC China 300 KMT Q3-12 to Q4-13
OPAL India 350 KMT Q1-13 to Q3-14
Yulin Energy China 300 KMT Q2-13 to Q2-14
CNOOC & Shell China 300 KMT Q1-16 to Q1-17
-500
0
500
1,000
1,500
2,000
2012 2013 2014 2015 2016 2017
America Europe Middle East China Other Asia Additional demand
Unit : KMT
QAPCO Qatar 300 KTA Q1-12 to Q3-12
Borouge UAE. 350 KTA Q1-14 to Q3-14
Reliance India 400 KTA Q1-15 to Q3-16

Short-term Price Forecast USD/Ton Short-Term • Buying sentiment is expected to be driven up
from stronger demand in the downstream textiles and fabrics sectors in China due to more new Polyester supply will start up in the second half of the year 2013
• However, new MEG supplies will come on-stream during the year will affect the market 375 399
523 533
961 894 872 854
1,395 1,321
1,267 1,232 1,282 1,258
1,347 1,333
0
200
400
600
800
1,000
1,200
1,400
1,600
1Q/13F 2Q/13F 3Q/13F 4Q/12F
MEG the market will be robust due to strong derivative demand
MEG Long-term Supply/Demand
Additional (2012-2017) (Unit : MMT)
Supply Demand 13.86 9.34
America12%
Europe7%
Middle East19%India
5%
China49%
Other Asia8%
44 Source: PCI February 2013
01,0002,0003,0004,0005,0006,0007,000
2012 2013 2014 2015 2016 2017
America Europe India Middle East
China Other Asia Additional demand
Petrochina Sichuan China 380 KTA Q3-13 to Q4-13
Henan Coal Chemical China 400 KTA Q1-13 to Q3-12
Qianxi Coal Chem China 400 KTA Q3-13 to Q1-14
Ningbo Heyuan China 500 KTA Q4-12 to Q2-13
Unit : KMT
Henan Coal Chemical China 400 KTA Q1-13 to Q4-12
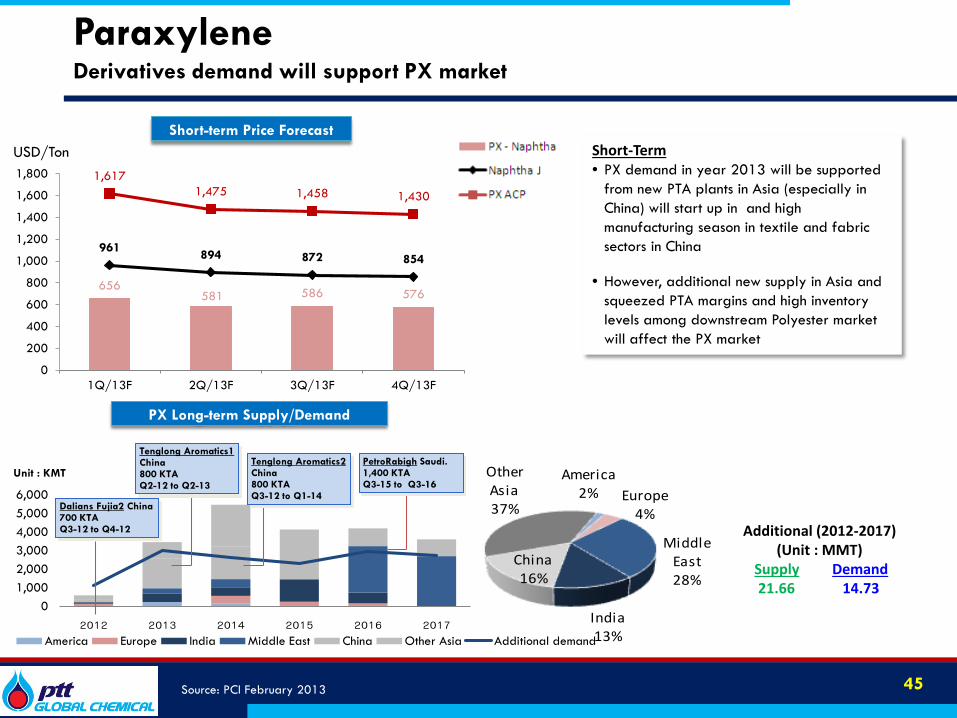
Short-term Price Forecast Short-Term • PX demand in year 2013 will be supported
from new PTA plants in Asia (especially in China) will start up in and high manufacturing season in textile and fabric sectors in China
• However, additional new supply in Asia and squeezed PTA margins and high inventory levels among downstream Polyester market will affect the PX market
USD/Ton
656 581 586 576
961 894 872 854
1,617 1,475 1,458 1,430
0
200
400
600
800
1,000
1,200
1,400
1,600
1,800
1Q/13F 2Q/13F 3Q/13F 4Q/13F
Paraxylene Derivatives demand will support PX market
PX Long-term Supply/Demand
45
Additional (2012-2017) (Unit : MMT)
Supply Demand 21.66 14.73
Source: PCI February 2013
America2% Europe
4%
Middle East28%
India13%
China16%
Other Asia37%
01,0002,0003,0004,0005,0006,000
2012 2013 2014 2015 2016 2017 America Europe India Middle East China Other Asia Additional demand
PetroRabigh Saudi. 1,400 KTA Q3-15 to Q3-16
Tenglong Aromatics2 China 800 KTA Q3-12 to Q1-14
Unit : KMT
Dalians Fujia2 China 700 KTA Q3-12 to Q4-12
Tenglong Aromatics1 China 800 KTA Q2-12 to Q2-13

Short-term Price Forecast USD/Ton Short-Term • Supply continue to be short due to many
refineries and Aromatics plants in Asia will shutdown for maintenance and due to weak demand in derivatives market
• In addition, Benzene market will be depend on volatile crude and feedstock prices and derivatives demand 427 410
472 424
961 894 872 854
1,388 1,304 1,344
1,278
0
200
400
600
800
1,000
1,200
1,400
1,600
1Q/13F 2Q/13F 3Q/13F 4Q/13F
Benzene the market will still be driven by the main products
Additional (2012-2017) (Unit : MMT)
Supply Demand 8.13 8.20
BZ Long-term Supply/Demand
America1%
Middle East6% Europe
3%
China37%
Other Asia55%
46 Source: CMAI April 2013
-500
0
500
1,000
1,500
2,000
2,500
2012 2013 2014 2015 2016 2017
America Europe Middle East China Other Asia Additional demand
Daqing PC China 150 KTA Q1-13 to Q3-12
Anqing PC China 54 KTA Q3-12 to Q1-13
Samsung Total PC S. Korea 422 KTA Q4-14 to Q1-15
Nghi Son Vietnam 246 KTA Q1-15 to Q1-16
ExxonMobil Sing. 340 KTA Q1-13 to Q2-13 Unit : KMT
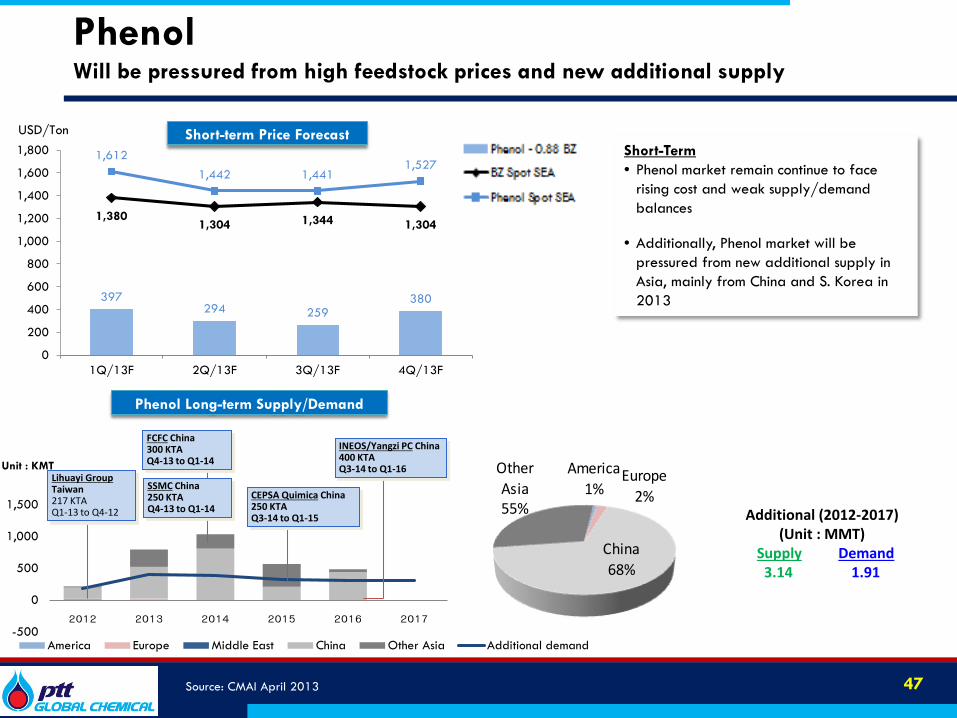
Short-term Price Forecast USD/Ton
Short-Term • Phenol market remain continue to face
rising cost and weak supply/demand balances
• Additionally, Phenol market will be pressured from new additional supply in Asia, mainly from China and S. Korea in 2013 397
294 259 380
1,380 1,304 1,344 1,304
1,612 1,442 1,441
1,527
0
200
400
600
800
1,000
1,200
1,400
1,600
1,800
1Q/13F 2Q/13F 3Q/13F 4Q/13F
Phenol Will be pressured from high feedstock prices and new additional supply
Additional (2012-2017) (Unit : MMT)
Supply Demand 3.14 1.91
Phenol Long-term Supply/Demand
America1%
Europe2%
China68%
Other Asia55%
47 Source: CMAI April 2013
-500
0
500
1,000
1,500
2012 2013 2014 2015 2016 2017
America Europe Middle East China Other Asia Additional demand
Unit : KMT Lihuayi Group Taiwan 217 KTA Q1-13 to Q4-12
INEOS/Yangzi PC China 400 KTA Q3-14 to Q1-16
FCFC China 300 KTA Q4-13 to Q1-14
SSMC China 250 KTA Q4-13 to Q1-14
CEPSA Quimica China 250 KTA Q3-14 to Q1-15