intraweek and intraday trade anomalies: evidence from forex market
TRANSCRIPT

Intraweek and intraday trade
anomalies: evidence from FOREX
market
Saša Popovića,* and Andrija Đurovićb
aSchool of Economics, University of Montenegro, 81000 Podgorica, MontenegrobHypo Alpe Adria International AG, 9020 Klagenfurt, Austria
In this article, we search for the evidence of intraweek and intraday anomalies onthe spot foreign exchange (FOREX) market. Having in mind the internationalscope of this market, empirical evidence against market efficiency (i.e. marketanomalies) will have important consequences for the substantial number ofFOREX investors all around the globe. We explore intraweek, intraday andinteraction between days and hour trade anomalies on the FOREX market overthe period of 10 years using hourly time-series data of Euro and US Dollar (EUR/USD) exchange rate on Swiss FOREXmarket from 1 January 2004 to 11 January2014. We compare by analysis of variance test all pairs of mean returns on a daily,hourly and daily/hourly basis. t-Test is used to test whether intraday returns aresignificantly different from zero. We employ Tukey’s honestly significant differ-ence test to explore which intraday pairs of hourly mean returns are significantlygreater than zero. We find that intraday and interaction between day and houranomalies are present in trading EUR/USD on the spot FOREX market over theperiod of 10 years. The best arbitrage opportunity is evidenced on Fridays, whenselling USD and buying EUR at 00:00 and selling EUR and buying USD at 03:00the same day.
Keywords: market efficiency; market anomalies; calendar anomalies; intra-week; FOREX
JEL Classification: C14; G14; G15
I. Introduction
Market efficiency is a theoretical explanation of the influ-ence of information on the asset prices. This concept is offundamental relevance for the financial markets becauseefficient market entails that all price-sensitive information,whether public or private, is instantly and accurately con-tained in market prices. In the case of efficient market,investors cannot make any abnormal return because theinformation he or she wants to utilize is already reflectedin current market prices. Dimson and Mussavian (2000)
note that ‘sometimes, however, economists use wordsmarket efficiency to refer to operational efficiency, empha-sizing the way resources are employed to facilitate theoperation of the market’. As financial markets becamehighly sophisticated due to technological progress, allmarket participants focus their attention on the informa-tional efficiency of financial markets.
In order to draw consistent conclusions about marketefficiency, researchers have employed different empiricaltests and have found several market anomalies, that is,evidences of inconsistency with EMH. These phenomena
*Corresponding author. E-mail: [email protected]
Applied Economics, 2014Vol. 46, No. 32, 3968–3979, http://dx.doi.org/10.1080/00036846.2014.948676
3968 © 2014 Taylor & Francis
are called anomalies because they cannot be explained bytraditional asset pricing models. If asset prices are predict-able based on some calendar framework, which provestheir nonrandom character and contradicts the weak formof EMH, then investors can develop trading strategies thatgive them opportunity to exploit those anomalies and earnreturns at extraordinary rates. This means that investorscan design appropriate trading strategies based on season-ality of the market, which can clearly indicate favourabletrading timing.
Some of the market anomalies are well known as sea-sonal anomalies, where asset returns become higher orlower depending on the time frame taken into account.From that perspective, the most investigated seasonal (i.e.calendar) anomalies are January effect, the day-of-the-week effect and the week-of-the-month effects. In thisarticle, we explore the existence of intraweek and intradayanomalies, which have not been sufficiently researched, inthe Euro and US Dollar (EUR/USD) exchange rate as themost liquid pair on the spot FOREX market. Proving theexistence of such anomalies in this currency pair wouldresult in devising particular trading strategies by FOREXinvestors. A highly liquid market is expected to be effi-cient at the level of the week form of EMH. However, weanticipate that even such markets exhibit anomalies thatcan be detected and as such can be exploited for futuregain at a maximized rate.
Informational efficiency of financial markets has beenthoroughly studied, and an extensive number of empiricalresearches have been done on equity markets.Subsequently, researches have focused on other segmentsof financial markets, such as nonequity and FOREX mar-kets. Vieira and Vieira (2007) argue for the importance ofthe FOREX markets analysis for two reasons. First,FOREX markets are generally less regulated and con-trolled and, as such, become integrated faster and, thus,become more efficient. Second, majority of previousresearch concentrates on stock markets without takinginto consideration FOREX markets, the biggest segmentof financial markets in terms of daily traded values. Thescholars suggest that further research is needed to improveour understanding of the seasonal anomalies phenomena.
Following this recommendation, we trace the develop-ments in the FOREX anomalies testing and develop ourresearch hypothesis from the basis of Froot and Thaler’sclaim (1990) that ‘since FOREXmarket is much greater involume than is trade in real goods and services, FOREXmarket would seem to be highly liquid and efficient’. Westart from refining this conditional claim at the level ofweak form of EMH in order to test our hypothesis thatthere are intraweek and intraday anomalies on FOREXmarket, based on EUR/USD exchange rate as benchmark,which can show that the market can be liquid and ineffi-cient. The choice of currency pair has been determined bythe fact that they are the most liquid pair and that they
exhibit strong correlations with all other EUR and USDdenominated pairs. If proven, this hypothesis can demon-strate that the markets can be highly liquid and yet ineffi-cient from the calendar anomalies standpoint. Theconsequence of such demonstration is that we can developand utilize appropriate trading strategies for gainingabnormal profits.
This article is organized as follows. Section II brieflyreviews the literature on calendar anomalies, specificallyintraweek and intraday ones. Section III presents datadescription and their required adjustment so that theycan be used as inputs for the tests employed. Section IVdiscusses the methodology used. In Section V, we presentthe empirical results of the research. Section VI offersconcluding remarks.
II. Literature Review
In order to review various calendar anomalies that havebeen observed over time in different stock markets aroundthe globe, Nawaz and Mirza (2012) offer brief but valu-able literature survey. According to their survey, there areseveral studies whose authors found a clear evidence thatasset returns are not constant across the days of the weekor across the trading time during a trading day. The firstwho found evidence of the day-of-the-week effect wasOsborne (1959). With his pioneer work, he initiatedfurther research in the field of equity market anomalies.Cross (1973) has found nonrandom movements in stockprice changes in the Standard and Poor’s (S&P) compositestock index. The relationship between price changes onMonday and price changes on Friday was significantlydifferent from the relationship between price changes onother successive business days.
Tracing back the early evidence of the intraweek effect,we refer to the studies of French (1980), Gibbons and Hess(1981), Lakonishok and Levi (1982) and Berument andKiymaz (2001). In their studies, these authors find evi-dence of calendar anomalies in close-to-close returns inbroad market indices. Several widely recognized studieshave analysed the size of the firm effect on this kind ofmarket anomalies; among them are Keim and Stambaugh(1984), Rogalski (1984) and Harris (1986). All studiesprove that asset returns gained on Mondays are signifi-cantly lower than the returns gained on other trading daysof the week. Fama (1965) documented that equity returnswere more volatile during exchange trading hours thanduring nontrading hours. Even though all these studieswere focused on the US stock market, there are otherstudies oriented towards different type of assets, such asGibbons and Hess (1981), a study in which they find aMonday effect on returns on US T-bills. In some othermarkets, such as Japanese and Australian stock market,Jaffe and Westerfield (1985) documented a different
Intraweek and intraday trade anomalies 3969
calendar anomaly pattern: lower Tuesday returns on thosemarket stocks. Also, Ho (1990) documented the existenceof strong day-of-the-week effects for most of the AsiaPacific markets. There are also more day-of-the-weekvariations in the non-January months than in January,and there is also a ‘Rogalski’ effect for returns onMonday, Tuesday, Friday and Saturday. Ho’s study alsofinds it hard to reject the hypothesis that day-of-the-weekvariations of Asia Pacific markets are similar to those ofthe US market after adjustments for time zone differences,especially for smaller markets.
Lian and Chen (2004) study the existence of the day-of-the-week effect on the stock exchanges for five Asiancountries (Malaysia, Singapore, Indonesia, Thailand andPhilippines) over 10 years, from 1992 to 2002. Althoughthis research is designed to trace the day-of-the-weekeffect over three different periods, evidence of this typeof market anomaly is found in all five countries, but ondifferent days and over different periods. A study con-ducted by Zhang et al. (2008) explores the role of govern-ment in causing financial anomalies in the context ofemerging markets. Showing the evidence from China,they highlight the political dimension of the financialanomalies in the emerging world, by which governmentalinterventions can cause stock prices to deviate from thepredictable return rates of an efficient market. Amongother studies that are focused on emerging markets, wefind Ajayi et al. (2004) compelling. Their results shownegative Monday stock returns in 6 of the 11 EasternEuropean emerging markets (Croatia, Czech Republic,Estonia, Hungary, Latvia, Lithuania, Poland, Romania,Russia, Slovakia and Slovenia) from the mid-1990sthrough 2002, but these negative returns are significantin only two of the markets (Estonia and Lithuania).
From the nonequity market side, Flannery andProtopapadakis (1988) register the presence of the day-of-the-week effect on the US stock and bond markets.They examine the extent of the intraweek seasonalityand whether its presence was uniform across three stockindices and Treasury bonds with seven different maturi-ties. They use daily S&P 500 closing prices and Treasurysecurity yields data from mid-1977 through mid-1984.According to their findings, intraweek seasonality con-tinues to be significant; its pattern is not uniform betweenthe stock indices and the Treasury bonds as well as amongthe bonds alone. Both stocks and bonds have increasinglynegative Monday returns correlated with increasing bondmaturity. Gay and Kim (1987) investigate seasonality inthe futures market and find results similar to those found inequity markets. By analysing the 29-year-long history ofthe Commodity Research Bureau (CRB) futures priceindex (geometric average of 27 commodities prices),they confirm the day-of-the-week effect in the US com-modity future market: high Friday and negative Mondayreturns. Additionally, they find high returns onWednesday
as well as low returns on Tuesday. As reported by Nippaniand Arize (2008), the day-of-the-week effect was alsofound in corporate bond returns.
Compared to those from equity and nonequity markets,there are fewer studies of the day-of-the-week effect inFOREX markets. McFarland et al. (1982) conducted anearly study of distributional characteristics and the day-of-the-week effects on a sample of seven spot and four for-ward series of FOREX price changes. They find seasonalpatterns of returns for 11 foreign exchange (FOREX)markets, with high price changes on Mondays andWednesdays and low price changes on Thursdays andFridays. So (1987) has re-evaluated and confirmed theseresults. Hsieh (1988) has shown that the mean and var-iance of daily rates of change of five foreign currenciesdiffer across days of the week. Investigating exchange riskin six foreign currencies, Tang (1997) registered interac-tion between its diversification and the day-of-the-weekeffects. Different days in a week have significant impacton the diversification of foreign currency risk, especiallyon skewness and kurtosis. His results have shown thatboth the skewness and kurtosis do not have uniform pat-terns, which means that they vary in both value and signover different days in the week. Bessembinder (1994)explores day-of-the-week effects in the FOREX throughinventory-carrying costs, and he finds that bid–ask spreadsin the spot and forward market are higher on Fridays andprior to holidays. This result is supported by Glassman(1987) and Breuer (1999).
Both Aydoğan and Booth (2003) and Berument et al.(2007) register the presence of the day-of-the-week effectin the daily depreciation of Turkish lira against US dollarover the period from 1986 to 1994. Their findings werelater confirmed by Berument et al. (2007). Yamori andMourdoukow (2003) investigate JPY/USD exchangerate register presence of the day-of-the-week effect inthis exchange rate over the period from 1973 to 1989.The two authors find disappearance of the day-of-the-week effect in the 1990s, which they attribute to thefinancial deregulation in Japan that increased the effi-ciency of the Japanese financial markets. This phenom-enon was later confirmed by Yamori and Kurihara(2004), who also evidenced day-of-the-week effect dis-appearance in the 1990s for almost all 29 FOREX mar-kets they explored. Ito and Hashimoto (2006) detectednegative intraday correlation between the bid–askspreads and market activity of JPY/USD and USD/EURspot exchange rates in the electronic broking systemmarket from 1 January 1999 to 31 December 2001.Similar results are found at Taiwan FOREX market byKe et al. (2007), who indicate that higher returns appearon the first 3 days of the week across different trading-day regimes. Serbinenko and Rachev (2010) developed anew hybrid model based on market microstructure, but italso involves one macroeconomic fundamental as an
3970 S. Popovic and A. Ðurovic
explanatory variable to explain short-term exchangerates on FOREX.
III. Data Description
Here, we analyse hourly closing EUR/USD exchange ratedata series from the Swiss Foreign Exchange Marketplace(data source: Dukascopy, http://www.ducascopy.com).The data are analysed over the period of 10 years, startingfrom 02:00 GMT 1 January 2004 to 23:00 GMT 11January 2014. In order to obtain time series of continu-ously compounded returns, we adjusted hourly data ofFOREX EUR/USD closing exchange rate according tothe formula
rt ¼ logðEUR=USDÞtðEUR=USDÞt�1
� �� 100 (1)
where (EUR/USD)t and (EUR/USD)t–1 represent EUR/USD exchange rate at time t and t−1, respectively.From the analysed period, we exclude all Saturday and
Sunday observations as well as days with zero tradingvolume. We examine daily and hourly EUR/USDexchange rate returns over the analysed period as well astheir interaction.
Tables A1, A2 and A3 (see Appendix) show a summaryof descriptive statistics of daily, hourly and daily/hourlyEUR/USD mean returns, respectively. Correspondingfigures for the three descriptive statistics are shown inFigs 1–3, respectively.
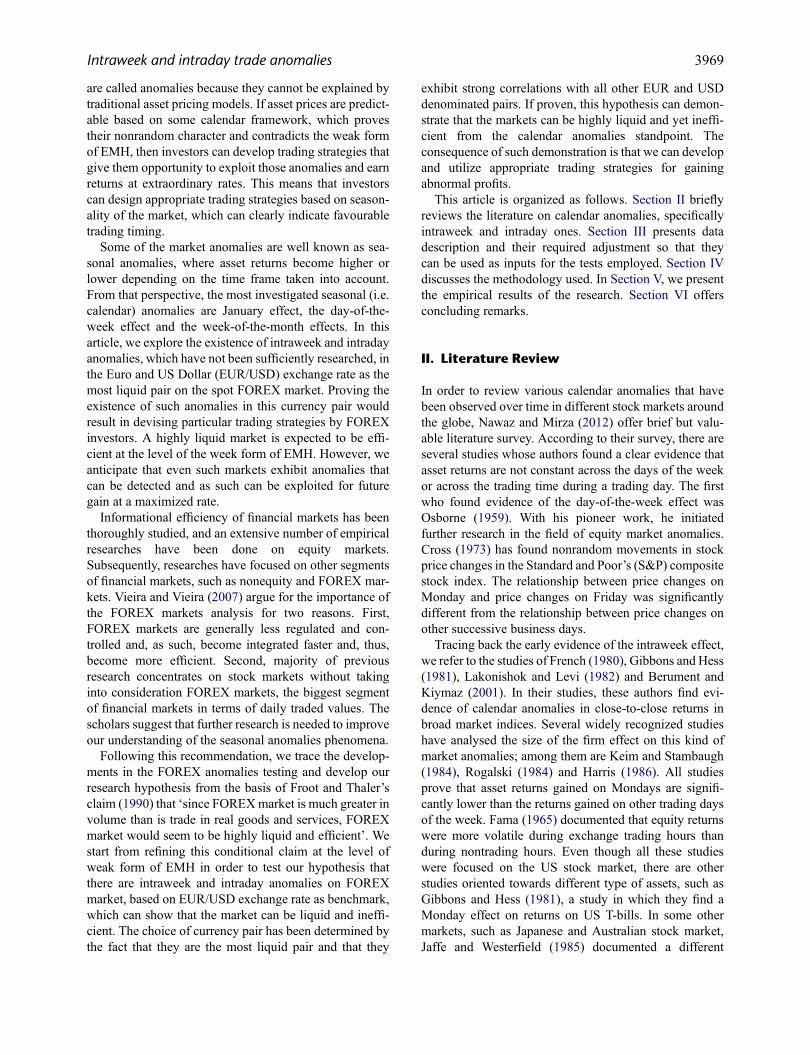
For the analysed period, descriptive statistics per dayregister the biggest mean return during Thursday (0.0006),while the smallest mean return appears on Monday(−0.001). As for variability, the biggest deviation isrecorded on Friday (0.0593), while the smallest onMonday (−0.0508). Values of skewness and kurtosis ofmean returns per day indicate deviation from normal dis-tribution to the distribution with heavy tails, which iscommon to almost all financial time series (Fig. 1).Fig. 1. Box plot of mean returns per day
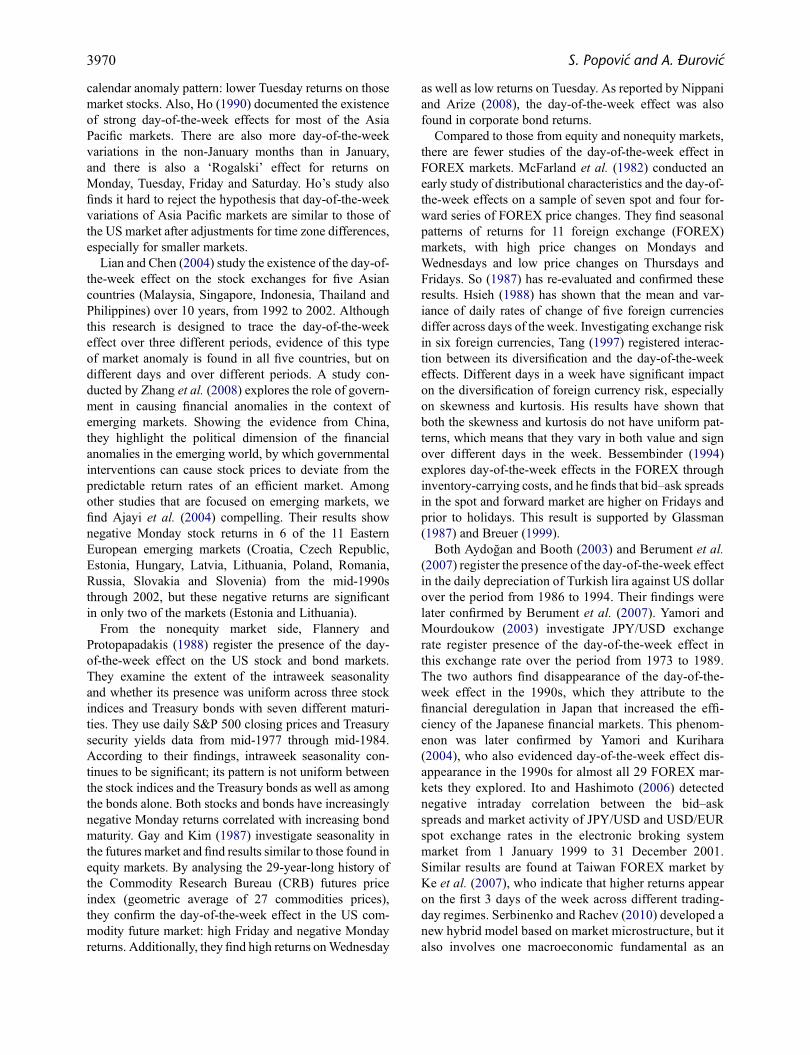
Fig. 2. Box plot of mean returns per hour
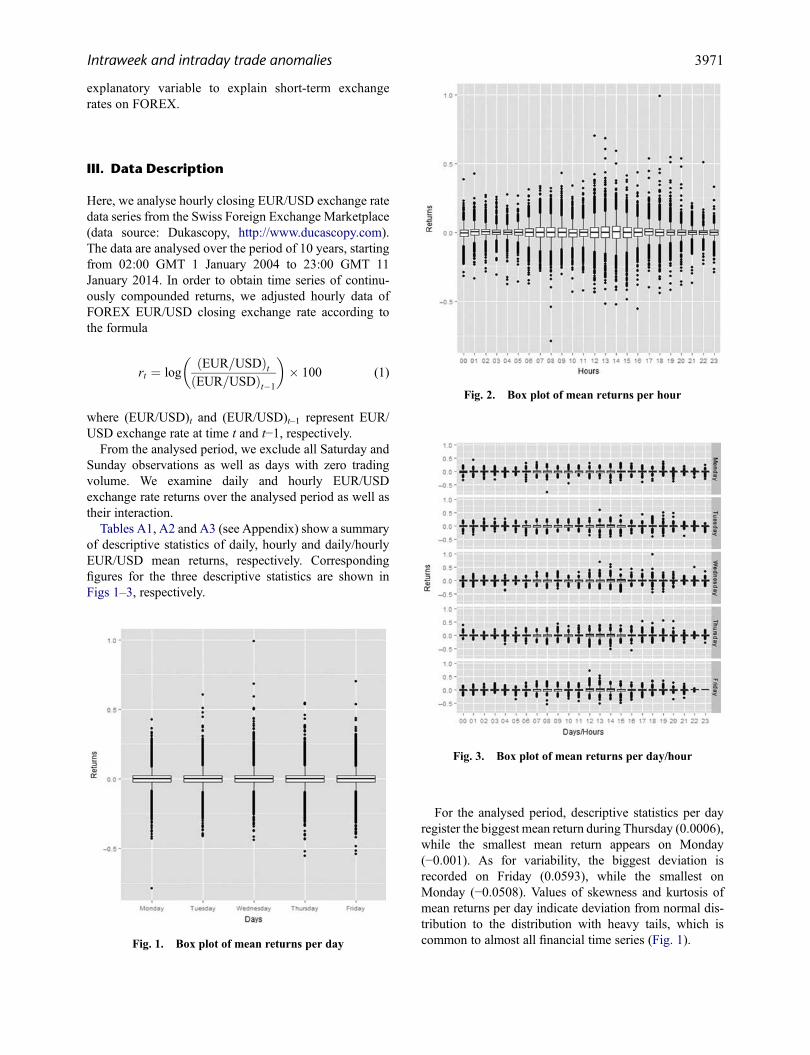
Fig. 3. Box plot of mean returns per day/hour
Intraweek and intraday trade anomalies 3971

With the increase in the number of levels for aggrega-tion from days (5) to hours (24), we get more homogenousreturns not only inside the levels but also between levels.Biggest and smallest mean returns are recorded between02:00 GMT (0.0032) and 00:00 GMT (−0.0066) hours,while biggest and smallest deviations of mean returns arerecorded between 14:00 GMT (0.0845) and 22:00 GMT(0.0310) hours, respectively. Values of skewness and kur-tosis still indicate deviation from normal distribution butless skewed and with less heavy tails than in daily aggre-gated data (Fig. 2).
With the further increase in aggregations levels (day/hour), homogeneity of mean returns inside levelsincreases. Additionally, difference of mean returnsbetween those levels should increase as well. The biggestand smallest mean returns are recorded on Friday 13:00GMT and Friday 00:00 GMT with values of 0.0072 and−0.0110, respectively. SD of mean returns inside levelsdecreases in comparison with other levels of aggregation(days and hours separately). The smallest value of SD ofmean returns is recorded on Friday 22:00 GMT with avalue of 0.0117, while the biggest is recorded on Friday13:00 GMTwith a value of 0.1013 (Fig. 3).
This increasing homogeneity of mean returns inside andheterogeneity of mean returns between levels of aggrega-tion will be statistically tested further in this article. Weexpect that statistically significant results will be found,and based on those results relevant trading strategy couldbe applied.
IV. Methodology
Our methodological approach employs different statis-tical tests: analysis of variance (ANOVA), t-test andTukey’s honestly significant difference (HSD) test.Since we want to compare all pairs of mean returnson a daily, hourly and daily/hourly basis, ANOVA testis applied. Results of the ANOVA test should answerthe question whether there is statistically significantdifference for at least one pair of mean returns for allthree analysed aggregation levels.
Total variability of an observed variable can be dividedinto factorial and residual sum of squares. ANOVAassumes comparison of factorial and residual sum ofsquares offering a general evaluation of group meandifferences.
Factorial variance is given by:
Vf ¼Pr
i¼1 ni Xi � �X� �2r � 1
(2)
where Vf stands for factorial variance, ni is number ofobservation in ith group, �X is the mean return in the ith
group, �X is the overall mean return and r is number ofgroups, while
Vr ¼Pr
i¼1
Pnj¼1 Xij � Xi
� �2Pri¼1 n� r
(3)
where Vr is the residual variance, Xij presents the jth valueof returns in the ith group, Xi is the mean return in ithgroup and n is number of observations in each groups.Ratio of those two variances follows F-distribution withr−1 i n*r−r degrees of freedom:
F ¼ Vf
Vr(4)
Despite the fact that increasing aggregation levels willincrease homogeneity of mean returns inside the levels,difference from zero of mean return should be tasted inorder to determine the appropriate trading strategy statis-tically. For that purpose, we applied one-sample t-test.Although descriptive statistics have shown deviationfrom normal distribution (see Tables A1, A2 and A3 inAppendix), Winter and Dodou’s (2012) results showedthat differences between t-test and Mann–Whitney–Wilcoxon t-test are minor in large samples.
One-sample t-test formula is as follows:
t ¼�X � μ
s=ffiffiffin
p (5)
where �X presents the mean return, µ is the tested mean (inour case equal 0), s is the SD of returns and n is the numberof observations. If the calculated t-statistics is greater orless than ±q α
2 ; n� 1� �
, then we consider it statisticallysignificant.
If ANOVA shows statistically significant results, thenwe employed Tukey’s HSD test for comparing groupmeans. Appling only independent t-test, we increase thestatistical error and do not take into account adjustmentsfor multiple testing. Therefore, Tukey’s HSD test isapplied as additional tool for confirmation of t-test results.According to Mason et al. (2003), Tukey’s procedurecontrols the experiment-wise error rate for multiple com-parisons when all averages are based on the same numberof observations. The stated experiment-wise error rate isvery close to the correct value even when the sample sizesare not equal. The technique is similar to Fisher’s LSDprocedure. It differs in that the critical value used in theTSD formula is the upper 100α% point for the differencebetween the largest and smallest of k averages. This dif-ference is the range of the k averages, and the critical pointis obtained from the distribution of the range statistic,not from the t-distribution. Two averages �yi and �yj based
3972 S. Popovic and A. Ðurovic

on ni and nj observations, respectively, are significantlydifferent if
�yi � �yj > TSD (6)
where
TSD ¼ q α; k; vð Þ MSEn�1i þ n�1
j
2
!1=2
(7)
in which q(α; k, ν) is the studentized range statistic, k is thenumber of averages being compared, MSE is the meansquared error from an ANOVA fit for the data based on νdegrees of freedom and α is the experiment-wise error rate.
V. Empirical Results
Based on ANOVA, we find nonsignificant differences inmean returns over week (Table 1). However, significantdifferences of at least one pair of mean returns in intraday(Table 2) and interaction between day and hour (Table 3)are found. Tables 1–3 present detailed result of theANOVA test.
Results of ANOVA tests confirm our observation thatwith the increase in the aggregation levels, homogeneityof mean return inside the levels increases and is accom-panied by the increase in the heterogeneity of mean returnsbetween the levels. In order to find the best arbitrarytrading strategy, we continue our analysis applying t-testand Tukey’s HSD test, focusing our research on intradayanomalies on a specific day (Table 3). Using t-test, weexamine whether intraday returns on this specific day aresignificantly different from zero. The following figureshows 95% significant difference from zero of intradayhourly mean returns.
Based on the t-test results and its visualization shown inFig. 4, one possible (buy/sell) trading strategy would be tosell USD and buy EUR at 00:00 Friday and then sell EURat 03:00 and gain in USD the same day. In Fig. 4, wenotice that similar intraday patterns exist on Tuesday andWednesday but with lower mean return difference, whichmeans less arbitrage opportunities. The proposed strategyrefers to the overall analysing period starting from 02:00GMT 1 January 2004 to 23:00 GMT 11 January 2014.
Knowing that independent t-test does not take intoaccount multiple mean testing, proposed strategies shouldbe confirmed by employing Tukey’s HSD test. The sameconclusion can be drawn about the above-mentionedFriday trading strategy from Tukey’s HSD test. Afterapplying multiple test adjustments by using Tukey’s
Table 1. ANOVA results, days
DifferenceSumsquare
Meansquare F-value Pr(>F)
Days 4 0 0.0056 1.75 0.13Residuals 61 836 197 0.00319
Table 2. ANOVA results, hours
DifferenceSumsquare
Meansquare
F-value Pr(>F)
Hours 23 0.3 0.01454 4.56 0.0000002 ***Residuals 61 817 197 0.00319
Note: *** denote significance at 1% level.
Table 3. ANOVA results, days/hours
DifferenceSumsquare
Meansquare
F-value Pr(>F)
Monday/hours
23 0.1 0.00513 1.99 0.0033***
Residuals 12 525 32.3 0.00258Tuesday/
hours23 0.1 0.00476 1.52 0.053*
Residuals 12 501 39.1 0.00313Wednesday/
hours23 0.1 0.00625 1.87 0.0072***
Residuals 12 488 41.8 0.00335Thursday/
hours23 0.1 0.00548 1.62 0.031**
Residuals 12 549 42.5 0.00339Friday/
hours23 0.2 0.00994 2.84 0.0000067***
Residuals 11 658 40.8 0.0035
Note: ***, ** and * denote significance at 1%, 5% and 10%level, respectively.
Fig. 4. Box plot of t-test of intraday hourly mean returns
Intraweek and intraday trade anomalies 3973
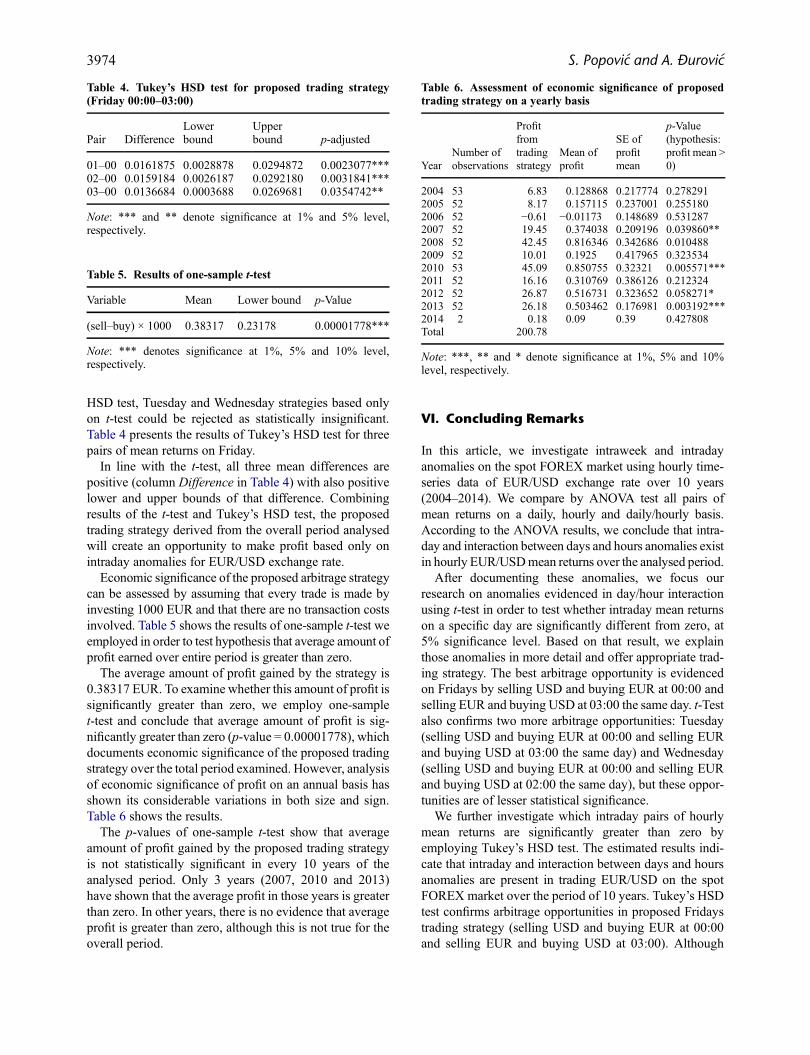
HSD test, Tuesday and Wednesday strategies based onlyon t-test could be rejected as statistically insignificant.Table 4 presents the results of Tukey’s HSD test for threepairs of mean returns on Friday.
In line with the t-test, all three mean differences arepositive (column Difference in Table 4) with also positivelower and upper bounds of that difference. Combiningresults of the t-test and Tukey’s HSD test, the proposedtrading strategy derived from the overall period analysedwill create an opportunity to make profit based only onintraday anomalies for EUR/USD exchange rate.
Economic significance of the proposed arbitrage strategycan be assessed by assuming that every trade is made byinvesting 1000 EUR and that there are no transaction costsinvolved. Table 5 shows the results of one-sample t-test weemployed in order to test hypothesis that average amount ofprofit earned over entire period is greater than zero.
The average amount of profit gained by the strategy is0.38317 EUR. To examine whether this amount of profit issignificantly greater than zero, we employ one-samplet-test and conclude that average amount of profit is sig-nificantly greater than zero (p-value = 0.00001778), whichdocuments economic significance of the proposed tradingstrategy over the total period examined. However, analysisof economic significance of profit on an annual basis hasshown its considerable variations in both size and sign.Table 6 shows the results.
The p-values of one-sample t-test show that averageamount of profit gained by the proposed trading strategyis not statistically significant in every 10 years of theanalysed period. Only 3 years (2007, 2010 and 2013)have shown that the average profit in those years is greaterthan zero. In other years, there is no evidence that averageprofit is greater than zero, although this is not true for theoverall period.
VI. Concluding Remarks
In this article, we investigate intraweek and intradayanomalies on the spot FOREX market using hourly time-series data of EUR/USD exchange rate over 10 years(2004–2014). We compare by ANOVA test all pairs ofmean returns on a daily, hourly and daily/hourly basis.According to the ANOVA results, we conclude that intra-day and interaction between days and hours anomalies existin hourly EUR/USDmean returns over the analysed period.
After documenting these anomalies, we focus ourresearch on anomalies evidenced in day/hour interactionusing t-test in order to test whether intraday mean returnson a specific day are significantly different from zero, at5% significance level. Based on that result, we explainthose anomalies in more detail and offer appropriate trad-ing strategy. The best arbitrage opportunity is evidencedon Fridays by selling USD and buying EUR at 00:00 andselling EUR and buying USD at 03:00 the same day. t-Testalso confirms two more arbitrage opportunities: Tuesday(selling USD and buying EUR at 00:00 and selling EURand buying USD at 03:00 the same day) and Wednesday(selling USD and buying EUR at 00:00 and selling EURand buying USD at 02:00 the same day), but these oppor-tunities are of lesser statistical significance.
We further investigate which intraday pairs of hourlymean returns are significantly greater than zero byemploying Tukey’s HSD test. The estimated results indi-cate that intraday and interaction between days and hoursanomalies are present in trading EUR/USD on the spotFOREX market over the period of 10 years. Tukey’s HSDtest confirms arbitrage opportunities in proposed Fridaystrading strategy (selling USD and buying EUR at 00:00and selling EUR and buying USD at 03:00). Although
Table 5. Results of one-sample t-test
Variable Mean Lower bound p-Value
(sell–buy) × 1000 0.38317 0.23178 0.00001778***
Note: *** denotes significance at 1%, 5% and 10% level,respectively.
Table 6. Assessment of economic significance of proposedtrading strategy on a yearly basis
YearNumber ofobservations
Profitfromtradingstrategy
Mean ofprofit
SE ofprofitmean
p-Value(hypothesis:profit mean >0)
2004 53 6.83 0.128868 0.217774 0.2782912005 52 8.17 0.157115 0.237001 0.2551802006 52 −0.61 −0.01173 0.148689 0.5312872007 52 19.45 0.374038 0.209196 0.039860**2008 52 42.45 0.816346 0.342686 0.0104882009 52 10.01 0.1925 0.417965 0.3235342010 53 45.09 0.850755 0.32321 0.005571***2011 52 16.16 0.310769 0.386126 0.2123242012 52 26.87 0.516731 0.323652 0.058271*2013 52 26.18 0.503462 0.176981 0.003192***2014 2 0.18 0.09 0.39 0.427808Total 200.78
Note: ***, ** and * denote significance at 1%, 5% and 10%level, respectively.
Table 4. Tukey’s HSD test for proposed trading strategy(Friday 00:00–03:00)
Pair DifferenceLowerbound
Upperbound p-adjusted
01–00 0.0161875 0.0028878 0.0294872 0.0023077***02–00 0.0159184 0.0026187 0.0292180 0.0031841***03–00 0.0136684 0.0003688 0.0269681 0.0354742**
Note: *** and ** denote significance at 1% and 5% level,respectively.
3974 S. Popovic and A. Ðurovic

t-test confirms two more arbitrage opportunities (Tuesdayand Wednesday), Tukey’s HSD test does not confirmstatistically significant differences of pair of mean returnsin these strategies, so the only one arbitrage opportunityover the entire analysed period confirmed by both testemployed is Fridays trading strategy.
Although calendar anomalies are widely studied acrossdifferent markets and their segments, empirical results offinancial market efficiency cannot be generalized. Ourresults are similar to those found in equity markets,where day-of-the-week effect is documented in a waythat shows that price changes were significantly differentamong different business days: Cross (1973), French(1980), Gibbons and Hess (1981), Lakonishok and Levi(1982), Berument and Kiymaz (2001) and Lian and Chen(2004). Although our results confirm day-of the-weekeffect on FOREX market on EUR/USD spot exchangerate, such as those of McFarland et al. (1982) who regis-tered seven spot rates, our results are not consistent withtheirs in terms of specific trading day. Unlike McFarlandet al.’s findings, where they find low Fridays pricechanges, we find the best trading opportunity exactly onFridays.
In addition, we find economic significance of theproposed trading strategy. However, this result must bere-examined by including adequate transaction costswhich could cause the economic significance of thestrategy to become insufficient. Finally, althoughFOREX is highly liquid market, using its most liquidcurrency pair, EUR/USD spot exchange rate, as abenchmark for calendar anomalies testing, we proveour research hypothesis that FOREX market is ineffi-cient and that intraday and intraweek anomalies existover the period from 2004 to 2014.
References
Ajayi, R. A., Mehdian, S. and Perry, M. J. (2004) The day-of-the-week effect in stock returns, Emerging Markets Financeand Trade, 40, 53–62.
Aydoğan, K. and Booth, G. (2003) Calendar anomalies in theTurkish foreign exchange markets, Applied FinancialEconomics, 13, 353–60. doi:10.1080/09603100210129457
Berument, H., Coskun, M. N. and Sahin, A. (2007) Day of theweek effect on foreign exchange market volatility: evidencefrom Turkey, Research in International Business andFinance, 21, 87–97. doi:10.1016/j.ribaf.2006.03.003
Berument, H. and Kiymaz, H. (2001) The day of the week effecton stock market volatility, Journal of Economics andFinance, 25, 181–93. doi:10.1007/BF02744521
Bessembinder, H. (1994) Bid-ask spreads in the interbank for-eign exchange markets, Journal of Financial Economics,35, 317–48. doi:10.1016/0304-405X(94)90036-1
Breuer, J. B. (1999) Day-of-week effects in tests of forwardforeign exchange rate unbiasedness, International Journalof Finance and Economics, 4, 193–204. doi:10.1002/(SICI)1099-1158(199907)4:3<193::AID-IJFE101>3.0.CO;2-A
Cross, F. (1973) The behavior of stock prices on Fridays andMondays, Financial Analysts Journal, 29, 67–9.doi:10.2469/faj.v29.n6.67
Dimson, E. and Mussavian, M. (2000) Market efficiency, TheCurrent State of Business Disciplines, 3, 959–70.
Dukascopy. Swiss Forex bank and marketplace. Available athttp://www.ducaskopy.com/swiss/english/marketwatch/historical/ (accessed 13 January 2014).
Fama, E. (1965) The behaviour of stockmarket prices, Journal ofBusiness, 38, 34–105.
Flannery, M. J. and Protopapadakis, A. (1988) From T-bills tocommon stocks: investigating the generality of intra-weekreturn seasonality, The Journal of Finance, 43, 431–50.doi:10.1111/j.1540-6261.1988.tb03948.x
French, K. (1980) Stock returns and the weekend effect, Journalof Financial Economics, 8, 55–69. doi:10.1016/0304-405X(80)90021-5
Froot, K. A. and Thaler, R. H. (1990) Anomalies: foreignexchange, Journal of Economic Perspectives, 4, 179–92.doi:10.1257/jep.4.3.179
Gay, G. D. and Kim, T. (1987) An investigation into seasonalityin the futures market, Journal of Futures Markets, 7, 169–81. doi:10.1002/fut.3990070207
Gibbons, M. and Hess, P. (1981) Day of the week effects andasset returns, The Journal of Business, 54, 579–96.doi:10.1086/296147
Glassman, D. (1987) Exchange rate risk and transactions costs:evidence from bid-ask spreads, Journal of InternationalMoney Finance, 6, 479–90. doi:10.1016/0261-5606(87)90024-6
Harris, L. (1986) A transaction data study of weekly and intra-daily patterns in stock returns, Journal of FinancialEconomics, 16, 101–16.
Ho, Y. K. (1990) Stock return seasonalities in Asia pacific mar-kets, Journal of International Financial Management andAccounting, 2, 47–77. doi:10.1111/j.1467-646X.1990.tb00017.x
Hsieh, D. A. (1988) The statistical properties of daily foreignexchange rates: 1974–1983, Journal of InternationalEconomics, 24, 129–45. doi:10.1016/0022-1996(88)90025-6
Ito, T. and Hashimoto, Y. (2006) Intraday seasonality in activitiesof the foreign exchange markets: evidence from the electro-nic broking system, Journal of the Japanese andInternational Economies, 20, 637–64. doi:10.1016/j.jjie.2006.06.005
Jaffe, J. and Westerfield, R. (1985) The week-end effect incommon stock returns: the international evidence, Journalof Finance, 40, 433–54. doi:10.1111/j.1540-6261.1985.tb04966.x
Ke,M., Chiang, Y. and Liao, T. L. (2007) Day-of-the-week effectin the Taiwan foreign exchange market, Journal of BankingFinance, 31, 2847–65. doi:10.1016/j.jbankfin.2007.03.005
Keim, D. and Stambaugh, R. (1984) A further investigation ofthe weekend effect in stock returns, The Journal of Finance,39, 819–35. doi:10.1111/j.1540-6261.1984.tb03675.x
Lakonishok, J. and Levi, M. (1982) Weekend effects on stockreturns: a note, Journal of Finance, 37, 883–89. doi:10.1111/j.1540-6261.1982.tb02231.x
Lian, K. K. and Chen, W. Y. (2004) Seasonal anomalies of stocksin Asian equity markets, Sunway College Journal, 1, 1–11.
Mason, R., Gunst, F. R. and Hess, J. L. (2003) Statistical Designand Analysis of Experiments with Application toEngineering and Science, John Wiley & Sons, Inc.,Hoboken, NJ.
Intraweek and intraday trade anomalies 3975

McFarland, J., Pettit, R. and Sung, S. (1982) The distribution offoreign exchange price changes: trading day effects and riskmeasurement, Journal of Finance, 37, 693–715.doi:10.1111/j.1540-6261.1982.tb02218.x
Nawaz, S. and Mirza, N. (2012) Calendar anomalies and stockreturns: a literature survey, Journal of Basic and AppliedScientific Research, 2, 12321–29.
Nippani, S. and Arize, A. C. (2008) U.S. corporate bond returns:a study of market anomalies based on broad industrygroups, Review of Financial Economics, 17, 157–71.doi:10.1016/j.rfe.2007.02.007
Osborne, M. F. M. (1959) Brownian motion in the stock market,Operations Research, 7, 145–73. doi:10.1287/opre.7.2.145
Rogalski, R. J. (1984) New findings regarding day of the weekreturns over trading and nontrading periods: a note, Journalof Finance, 39, 1603–14.
Serbinenko, A. and Rachev, S. T. (2010) A new hybrid model forintraday spot foreign exchange trading accounting forheavy tails and volatility clustering, Journal ofComputational Analysis and Applications, 12, 337–60.
So, J. C. (1987) The distribution of foreign exchange pricechanges: trading day effects and risk measurement – acomment, Journal of Finance, 42, 181–88.
Tang, G. Y. N. (1997) Impact of the day-of-the-week effect ondiversification of exchange rate risks, InternationalBusiness Review, 6, 35–51. doi:10.1016/S0969-5931(97)86723-6
Vieira, C. and Vieira, I. (2007) Seasonalities in eastern foreignexchange markets: a barrier to euro adoption?,Transition Studies Review, 14, 283–94. doi:10.1007/s11300-007-0145-0
Winter, J. C. F. and Dodou, D. (2012) Five-point Likert items: ttest versus Mann-Whitney-Wilcoxon, PracticalAssessment, Research & Evaluation, 15, 1–16.
Yamori, N. and Kurihara, Y. (2004) The day-of-the-week effectin foreign exchange markets: multi-currency evidence,Research in International Business Finance, 18, 51–7.doi:10.1016/j.ribaf.2004.02.004
Yamori, N. and Mourdoukow, P. (2003) Does the day-of the-week effect in foreign currency markets disappear?Evidence from the yen/dollar market, InternationalFinancial Review, 4, 447–63.
Zhang, Z., Sun, W. and Wang, H. (2008) A new perspective onfinancial anomalies in emerging markets: the case of china,Applied Financial Economics, 18, 1681–95. doi:10.1080/09603100701735946
Appendix
Table A1. Descriptive statistics of mean returns per day
Days Number of Obs. Mean SD Skewness Kurtosis
Monday 12 549 −0.0010075 0.0508380 −0.5433164 14.3448256Tuesday 12 525 0.0004452 0.0559671 −0.0141640 10.8777058Wednesday 12 512 0.0003991 0.0579144 0.7008479 18.9138298Thursday 12 573 0.0005986 0.0582570 0.0306173 12.1803170Friday 11 682 −0.0002578 0.0592784 −0.0269138 13.0192185
3976 S. Popovic and A. Ðurovic

Table A3. Descriptive statistics of mean returns per day/hour
Days Hours Number of obs. Mean SD Skewness Kurtosis
Monday 00 523 −0.0098802 0.0559963 −0.4337671 6.0287284Monday 01 523 0.0012526 0.0487841 1.1069016 14.9228448Monday 02 523 0.0008007 0.0424985 −1.2712910 12.6662924Monday 03 523 0.0004663 0.0335011 −0.9662735 20.2372721Monday 04 523 0.0021021 0.0298493 −0.8474156 11.6305713Monday 05 523 −0.0005955 0.0339492 −0.0882851 5.8243083Monday 06 523 0.0002831 0.0557241 −0.4447236 10.5855263Monday 07 523 0.0027348 0.0655755 0.4086220 5.6932271Monday 08 523 −0.0039774 0.0737147 −2.3665559 27.5493581Monday 09 523 −0.0008635 0.0500840 −0.0753911 5.4601839Monday 10 523 −0.0062755 0.0530338 −0.7628337 13.1995610Monday 11 523 −0.0034486 0.0470158 0.3453628 5.0907270Monday 12 523 0.0000250 0.0588900 0.0642912 6.2081666Monday 13 523 0.0004153 0.0605607 −0.1115270 4.8159671Monday 14 523 −0.0013204 0.0751236 −0.4754120 6.5064830Monday 15 523 0.0047455 0.0664437 −0.0893068 6.9761349Monday 16 523 0.0000479 0.0529160 0.1400494 6.7768668Monday 17 523 −0.0015318 0.0481054 −1.0663354 14.4406483Monday 18 522 −0.0011229 0.0461607 −2.0343336 16.3693557Monday 19 523 0.0024290 0.0427780 2.2506853 19.0753138Monday 20 523 −0.0050989 0.0390137 −3.1663040 27.2338707Monday 21 523 −0.0020210 0.0275963 0.9018795 12.9341835Monday 22 523 −0.0014624 0.0305558 −1.3397503 13.0473463Monday 23 521 −0.0018876 0.0395840 −0.7002955 10.9904969Tuesday 00 523 −0.0070998 0.0496866 −0.6053249 6.7290428Tuesday 01 522 0.0037495 0.0481834 −0.5500116 9.9039290Tuesday 02 522 0.0042835 0.0394391 1.0620939 10.9715008Tuesday 03 522 0.0033327 0.0337172 0.5267133 12.9589733Tuesday 04 522 0.0020390 0.0322889 0.8258521 15.0620716
(continued )
Table A2. Descriptive statistics of mean returns per hour
Hours Number of Obs. Mean SD Skewness Kurtosis
00 2614 −0.0066178 0.0488241 −0.1706898 7.675569401 2613 0.0035210 0.0450298 0.2241194 10.134052102 2614 0.0032457 0.0369923 −0.1175064 10.824946503 2615 0.0016541 0.0328919 0.2104065 13.984977604 2615 0.0014521 0.0337707 −1.2186033 22.181113005 2615 0.0012409 0.0381834 −0.5373794 10.165870706 2615 0.0008016 0.0547450 −0.4331055 7.606457307 2614 −0.0002388 0.0645799 0.1285635 5.323352108 2614 0.0000545 0.0697422 −0.7818995 12.615163909 2614 0.0001209 0.0610293 0.2548690 6.870985610 2614 −0.0043641 0.0561942 −0.0346334 7.448186111 2614 −0.0029191 0.0549518 −0.0486607 8.869437812 2614 −0.0005628 0.0784152 0.1785190 9.087977113 2614 0.0021677 0.0833804 0.4744657 9.368563214 2614 −0.0005872 0.0844890 −0.1095279 6.887673015 2613 −0.0012841 0.0771030 −0.4945805 7.219774116 2613 0.0016463 0.0615219 −0.2476723 9.969176217 2614 0.0035968 0.0550842 0.5831485 12.691757618 2613 0.0007911 0.0607862 1.7537690 37.941607019 2614 0.0001842 0.0504951 0.9119518 21.508130520 2614 −0.0001256 0.0418825 0.8846286 32.188036621 2595 −0.0014112 0.0317116 −1.2373023 22.739486722 2264 −0.0009752 0.0309542 1.5159031 40.316059423 2088 −0.0007489 0.0384448 −0.5273447 12.3398988
Intraweek and intraday trade anomalies 3977

Table A3. Continued
Days Hours Number of obs. Mean SD Skewness Kurtosis
Tuesday 05 522 0.0030609 0.0426440 −0.3940202 7.0480220Tuesday 06 522 −0.0064600 0.0586285 −0.9445350 6.9113067Tuesday 07 521 0.0050044 0.0695419 −0.0806605 5.0434976Tuesday 08 522 −0.0004497 0.0665714 −0.1606836 4.9919368Tuesday 09 522 0.0013221 0.0601186 0.1448729 5.0807689Tuesday 10 522 0.0019314 0.0581204 0.6970804 5.1453209Tuesday 11 522 0.0012329 0.0545187 0.3387473 5.9625113Tuesday 12 522 0.0002672 0.0683407 −0.1890563 4.9877162Tuesday 13 522 0.0027368 0.0767120 0.3763578 12.6545781Tuesday 14 522 −0.0002012 0.0796343 −0.3946083 5.9844414Tuesday 15 521 −0.0017915 0.0744916 −0.5735005 7.4205206Tuesday 16 521 0.0012438 0.0570658 −0.3257724 6.1547803Tuesday 17 522 0.0026213 0.0539369 0.5379438 13.6310826Tuesday 18 522 0.0006412 0.0674736 0.0165457 10.7937783Tuesday 19 522 −0.0024685 0.0584289 0.9842391 22.9945875Tuesday 20 522 −0.0000945 0.0455376 2.8536837 33.2744949Tuesday 21 522 −0.0020445 0.0328398 −2.5485333 33.2549127Tuesday 22 523 −0.0004718 0.0314638 0.2346783 9.4489239Tuesday 23 520 −0.0016857 0.0371084 −0.8535774 7.2865621Wednesday 00 521 −0.0054304 0.0441473 −0.7011334 7.0412160Wednesday 01 521 0.0037471 0.0436912 0.2437355 8.5750583Wednesday 02 521 0.0043371 0.0340447 0.2199931 7.6442094Wednesday 03 522 0.0016714 0.0336447 −0.7689110 9.5434282Wednesday 04 522 0.0016886 0.0397593 −2.6986249 31.2222804Wednesday 05 522 0.0002495 0.0376702 −0.0193556 5.1291824Wednesday 06 522 0.0053030 0.0529027 −0.4647789 5.6212066Wednesday 07 522 −0.0001085 0.0616309 0.4312838 5.2081942Wednesday 08 521 0.0023086 0.0637556 −0.0233051 5.0321792Wednesday 09 521 0.0042574 0.0624919 0.4266529 7.2498934Wednesday 10 521 −0.0075731 0.0577718 −0.2648441 4.4659284Wednesday 11 521 −0.0048693 0.0584573 0.0119961 8.3636110Wednesday 12 521 −0.0023630 0.0727940 0.3073154 6.1135256Wednesday 13 521 0.0037056 0.0843715 1.3765271 13.3156252Wednesday 14 521 −0.0010513 0.0909783 0.6866611 9.1460773Wednesday 15 521 −0.0015906 0.0818043 −0.6665146 6.8865249Wednesday 16 521 0.0022595 0.0618315 0.7418601 9.0656036Wednesday 17 521 0.0058271 0.0586186 0.9581165 8.5105924Wednesday 18 521 0.0018402 0.0781956 3.8599525 54.9673561Wednesday 19 521 −0.0029960 0.0561522 −0.7300847 13.0144375Wednesday 20 521 −0.0016143 0.0426821 −0.0862473 17.5113199Wednesday 21 522 0.0007819 0.0334708 0.3741733 7.7117637Wednesday 22 523 −0.0010582 0.0381380 4.1680889 64.4868821Wednesday 23 521 0.0002469 0.0401577 0.2164994 16.4787787Thursday 00 523 0.0004106 0.0507408 1.2023496 10.0131660Thursday 01 523 0.0037428 0.0426071 −0.0130268 6.2451559Thursday 02 524 0.0019706 0.0335986 −0.3583084 5.3226396Thursday 03 524 0.0002121 0.0303895 0.7031188 9.0140732Thursday 04 524 0.0007026 0.0342769 −1.7519950 22.8277653Thursday 05 524 0.0021987 0.0375085 0.0354741 11.2031153Thursday 06 524 0.0054287 0.0548416 −0.1927182 7.2753609Thursday 07 524 −0.0062480 0.0641709 −0.2778705 4.5386839Thursday 08 524 0.0023735 0.0732624 −0.2027895 5.5014354Thursday 09 524 −0.0000311 0.0692705 0.6082307 8.0292071Thursday 10 524 −0.0045005 0.0545213 0.3100198 7.2813821Thursday 11 524 −0.0022860 0.0577078 0.2926565 9.8551240Thursday 12 524 −0.0020944 0.0870532 −0.9528279 7.6597345Thursday 13 524 −0.0032156 0.0882835 0.2525855 5.7590688Thursday 14 524 0.0049333 0.0902721 −0.4420068 7.0006323Thursday 15 524 −0.0014529 0.0724331 0.0245816 5.5475485Thursday 16 524 0.0041646 0.0693876 −0.6833419 13.0762560
(continued )
3978 S. Popovic and A. Ðurovic
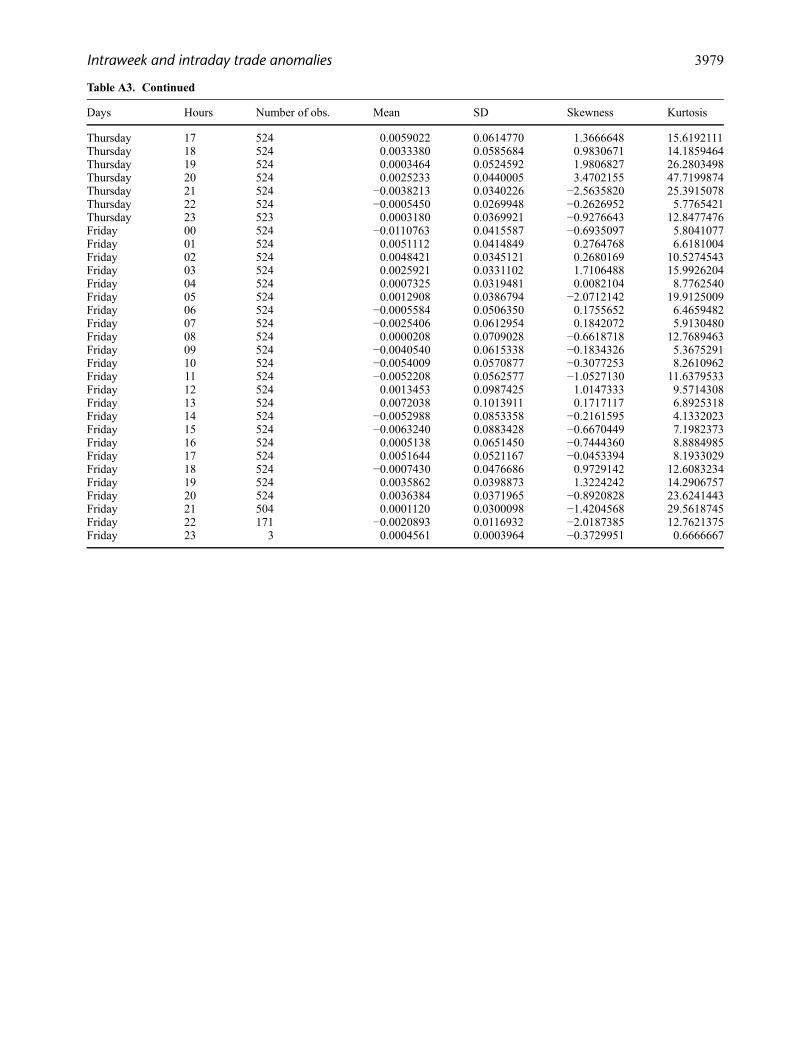
Table A3. Continued
Days Hours Number of obs. Mean SD Skewness Kurtosis
Thursday 17 524 0.0059022 0.0614770 1.3666648 15.6192111Thursday 18 524 0.0033380 0.0585684 0.9830671 14.1859464Thursday 19 524 0.0003464 0.0524592 1.9806827 26.2803498Thursday 20 524 0.0025233 0.0440005 3.4702155 47.7199874Thursday 21 524 −0.0038213 0.0340226 −2.5635820 25.3915078Thursday 22 524 −0.0005450 0.0269948 −0.2626952 5.7765421Thursday 23 523 0.0003180 0.0369921 −0.9276643 12.8477476Friday 00 524 −0.0110763 0.0415587 −0.6935097 5.8041077Friday 01 524 0.0051112 0.0414849 0.2764768 6.6181004Friday 02 524 0.0048421 0.0345121 0.2680169 10.5274543Friday 03 524 0.0025921 0.0331102 1.7106488 15.9926204Friday 04 524 0.0007325 0.0319481 0.0082104 8.7762540Friday 05 524 0.0012908 0.0386794 −2.0712142 19.9125009Friday 06 524 −0.0005584 0.0506350 0.1755652 6.4659482Friday 07 524 −0.0025406 0.0612954 0.1842072 5.9130480Friday 08 524 0.0000208 0.0709028 −0.6618718 12.7689463Friday 09 524 −0.0040540 0.0615338 −0.1834326 5.3675291Friday 10 524 −0.0054009 0.0570877 −0.3077253 8.2610962Friday 11 524 −0.0052208 0.0562577 −1.0527130 11.6379533Friday 12 524 0.0013453 0.0987425 1.0147333 9.5714308Friday 13 524 0.0072038 0.1013911 0.1717117 6.8925318Friday 14 524 −0.0052988 0.0853358 −0.2161595 4.1332023Friday 15 524 −0.0063240 0.0883428 −0.6670449 7.1982373Friday 16 524 0.0005138 0.0651450 −0.7444360 8.8884985Friday 17 524 0.0051644 0.0521167 −0.0453394 8.1933029Friday 18 524 −0.0007430 0.0476686 0.9729142 12.6083234Friday 19 524 0.0035862 0.0398873 1.3224242 14.2906757Friday 20 524 0.0036384 0.0371965 −0.8920828 23.6241443Friday 21 504 0.0001120 0.0300098 −1.4204568 29.5618745Friday 22 171 −0.0020893 0.0116932 −2.0187385 12.7621375Friday 23 3 0.0004561 0.0003964 −0.3729951 0.6666667
Intraweek and intraday trade anomalies 3979