intraday anomalies and market efficiency: a trading · pdf filecomput econ (2016)...
TRANSCRIPT

Comput Econ (2016) 47:275–295DOI 10.1007/s10614-015-9484-9
Intraday Anomalies and Market Efficiency:A Trading Robot Analysis
Guglielmo Maria Caporale · Luis Gil-Alana ·Alex Plastun · Inna Makarenko
Accepted: 5 January 2015 / Published online: 15 January 2015© The Author(s) 2015. This article is published with open access at Springerlink.com
Abstract One of the leading criticisms of the efficient market hypothesis is the pres-ence of so-called “anomalies”, i.e. empirical evidence of abnormal behaviour of assetprices which is inconsistent with market efficiency. However, most studies do not takeinto account transaction costs. Their existence implies that in fact traders might notbe able to make abnormal profits. This paper examines whether or not anomalies suchas intraday or time of the day effects give rise to exploitable profit opportunities byreplicating the actions of traders. Specifically, the analysis is based on a trading robotwhich simulates their behaviour, and incorporates variable transaction costs (spreads).The results suggest that trading strategies aimed at exploiting daily patterns do notgenerate extra profits. Further, there are no significant differences between sub-periods(2005–2006—“normal”; 2007–2009—“crisis”; 2010–2011—“post-crisis).
Keywords Efficient market hypothesis · Intraday patterns · Time of the dayanomaly · Trading strategy
JEL classification G12 · C63
G. M. Caporale (B)Department of Economics and Finance, Brunel University, London UB8 3PH, UKe-mail: [email protected]
G. M. CaporaleCESifo and DIW Berlin, Berlin, Germany
L. Gil-AlanaUniversity of Navarra, Pamplona, Spain
A. Plastun · I. MakarenkoUkrainian Academy of Banking, Sumy, Ukraine
123

276 G. M. Caporale et al.
1 Introduction
The efficient market hypothesis (EMH) has been highly criticised during the lasttwenty years, especially on the basis of empirical evidence suggesting the presenceof so-called “anomalies”, i.e. abnormal behaviour of asset prices which is seen asinconsistent with market efficiency. Since the seminal work of Mandelbrot (1963),several studies have shown that the Gaussian distribution provides a poor fit to thebehaviour of asset prices, not being compatible with the random walk model impliedby the EMH. As a result of this literature, fat tails, clustered volatility, long memoryetc. have become well-known “stylized facts” characterising the behaviour of assetprices. The aim of this paper is to show that apparent statistical “anomalies” do notnecessarily mean that the market is inefficient: if it is not possible to generate extraprofits by exploiting them, they should be seen simply as statistical phenomena ratherthan as evidence of market inefficiency.
In particular, we focus on one of the best known anomalies, which is the presenceof intraday patterns, i.e. more intensive trading at the beginning and the end of thetrading day combined with higher price volatility (Admati and Pfleiderer 1988). Forexample,Wood et al. (1985) reported that all positive returns are earned during the firstthirty minutes and at the market close. Harris (1986) showed that prices and last tradestend to be up during the first 45 min of trading sessions (all days except Monday).Such patterns were also mentioned by Thaler (1987) and Levy (2002). Strawinski andSlepaczuk (2008) found evidence of intraday patterns in the Warsaw Stock Exchangeas well.
The main limitation of the above mentioned studies is that they neglect transactioncosts: incorporating spreads, commissions and other fees and payments connectedwiththe trading process can change the picture dramatically. Specifically, it can becomeclear that some of these “anomalies” cannot in fact be exploited, i.e. profitable tradingis not possible, and this inability to obtain extra profits is fully consistent with theEMH.
The present study examines intraday patterns using a trading robot which simulatesthe actions of the trader and incorporates some transaction costs (spreads) into theanalysis. The aim is to show that, as mentioned above, the presence of anomalies byitself does not necessarily represent evidence of market inefficiency, since it mightnot be possible to exploit them in practice. Obviously, speculators searching for profitopportunities are not simply blind followers of the crowd; instead, they quickly reacton others’ behaviour, and as a result any arbitrage opportunities (based on deviationsfrom fundamentals-based asset prices) will quickly disappear; however, it might bepossible to exploit them in the very short run using an appropriate trading strategy.We analyse both a mature and an emerging stock market, namely 27 US companiesincluded in theDowJones index, aswell as 8Blue-chipRussian companies. Further,weexamine different sub-periods (2005–2006—“normal”; 2007–2009—“crisis”; 2010–2011—“post-crisis”) to establish whether there is evidence of changing behaviourdepending on the phase of the economic cycle.
The remainder of the paper is structured as follows: Sect. 2 briefly reviews theliterature on the efficient market hypothesis and market anomalies. Section 3 explains
123

Intraday Anomalies and Market Efficiency 277
the method used for the analysis. Section 4 presents the empirical results. Section 5offers some concluding remarks.
2 Literature Review
The EMH was initially formulated by Fama (1965), who argued that in an efficientmarket prices should fully reflect the available information and be unpredictable (seealso Samuelson 1965). Fama (1970) then defined three forms of market efficiency(weak, semi-strong and strong). This theory has been used for the valuation of financialassets in terms of risk and uncertainty, and for devising portfolio strategies (see, interalia, Sharpe 1965; Lintner 1965;Mossin 1966, and Treynor 1962). In the 1980’s, it washighly criticized as overlooking transaction costs, information asymmetry (Grossmanand Stiglitz 1980), irrational behaviour etc. As a result many alternative theories andapproaches were developed (behavioural finance, the adaptive market hypothesis, thefractal market hypothesis, etc.).
The main implication of the EMH is that traders should not be able to “beat” themarket and make abnormal profits. An extensive literature analyses whether insteadthere exist market anomalies that can be exploited through appropriate trading strate-gies. This term was first used by Kuhn (1970). Schwert (2003) is an example of astudy providing evidence of abnormalities which are inconsistent with asset pricingtheories. Shiller (2000) and Akerlof and Shiller (2009) take the view that there aredeep reasons for the presence of anomalies in financial markets, namely irrationalbehaviour of investors (animal spirits, the herd instinct, mass psychosis, mass panic),which is inconsistent with the EMH paradigm.
Jensen (1978) argued that anomalies can only be considered statistically significantwhen they generate excess returns. Raghubir and Das (1999) classify them as follows:
– Anomalies related to prices and returns (contrarian trading, value investing, thesize effect, momentum effect, the effect of closed-end funds);
– Anomalies associated with trading volume and volatility (panic, bubbles on themarkets);
– Anomalies associated with the time series (the M&A effect, the IPO effect);– Other anomalies.
Jacobsen et al. (2005) distinguished between calendar, pricing and size anom-alies. Examples of calendar (time) anomalies (the most frequently observed) are:End-of-Quarter Effect, Annual Worldwide Optimism Cycle Effect, Halloween Effect,12-Month Cycle for Stock Returns Effect, Mid-year Point Effect, Two-Year Effect,Sector Performance by Calendar Month, Worst and Best Days of the Year Effect, Jan-uary Effect, Monthly Effect, Turn-of-the-Month Effect, Labor Day Effect, Day of theDividend Payments Effect, Trading Around Option Expiration Days and others.
Particularly important are intraday anomalies, including Half-of-the-Day Effects(abnormally low returns in the middle of a trading session, accompanied by a sharpfall in trading volumes); Last Hour and First Hour Effects (with the last hour of tradingbeing the best, and the first hour the worst time in terms of returns); and the Time ofthe day anomaly (with securities tending to be up in the first 45 and last 15 min of thetrading day).
123

278 G. M. Caporale et al.
Table1
Intraday
anom
alies:researches
overview
Autho
rTy
peof
analysis
Objecto
fanalysis(tim
eperiod
,market)
Results
Harris(198
6)Statisticalanalysis
15-m
inintervals,fourteen
monthsbetween
Decem
ber1,
1981
,and
Janu
ary31
,198
3,NYSE
,USA
The
weekend
effectspillsover
into
thefirst45
min
oftradingon
Mon
day,with
prices
falling
during
thisperiod.O
nallo
ther
days,p
ricesrise
sharply
during
thefirst45
min
andwith
inthelast5min
oftrading
Harris(198
9)Ftest
Cam
ino(199
6)Descriptiv
estatistics
Twenty-three
monthsof
transactionrecordsof
the
IBEX-35,
at15
-min
intervals,Sp
ain
There
aresignificant
weekday
differencesin
intraday
tradingreturnsin
thefirstfour
hoursof
trading.
OnMon
day(and
Wednesday)returnsare
negativ
e,whileon
theotherweekdaysthey
are
positiv
e
Brook
setal.(20
03)
Testforsign
alautocoherence
Seto
f10
-min
returns,bid-askspreads,andvolume
forasampleof
30NYSE
stocks
from
4January
1999
—24
Decem
ber20
00,U
SA
Find
thesign
alcoherenceto
beatthemaxim
umat
thedaily
frequency,with
spreadsmostly
follo
wing
aninverseJ-shape
throug
hthedayandvolume
beinghigh
attheop
enandatthecloseandlowest
inthemiddleof
theday
Çankaya
etal.(20
12)
GARCH(p,q)mod
els
15min
intraday
values
ofISE-100
Indexperiod
ofAug
ust2
007to
February
201,Istanbul
Stock
Exchang
e,turkey
Find
thatstrong
openingpricejumps
arepresent
Chan(200
5)LOGIT
mod
elHangSeng
Indexconstituent
stocks
inHon
gKon
gStockExchang
efrom
1998
to20
04Find
thattheprobability
oftradeataskpriceover
thelast1min
oftradingtim
esignificantly
increases.Thissystem
aticpattern
canexplain
arou
ndon
e-thirdof
thepo
sitiv
ereturn
from
the
end-of-day
effect
123

Intraday Anomalies and Market Efficiency 279
Table1
continued
Autho
rTy
peof
analysis
Objecto
fanalysis(tim
eperiod
,market)
Results
Coron
eoandVeredas
(200
6)Quantile
regression
15min
sampled
quotes
midpo
intsdu
ring
3years,
from
Janu
ary20
01to
Decem
ber20
03,ofthe35
companies
listedin
theIB
EX-35,Sp
anishStock
Exchang
e,Sp
ain
Show
thatindeed
thecond
ition
alprob
ability
distributio
ndepend
son
thetim
eof
theday.Atthe
openingandclosingthedensity
flatte
nsandthe
tails
becomethicker,whilein
themiddleof
the
dayreturnsconcentratearou
ndthemedianandthe
tails
arethinner
Abhyankar
etal.(19
97)
Generalized
metho
dof
mom
ents(G
MM)
Intra-daybid-askqu
otes
covering
theperiod
1Janu
ary,19
91to
31March,1
991i.e.for
thefirst
quarterof
1991
,Lon
donStockExchang
e
Find
thattheaveragebid-askspread
follo
wsa
U-shapedpatte
rndu
ring
tradingho
urs
Tissaoui(20
12)
Tempo
ralanalysisand
spectrum
analysisby
using
theFo
urierTransform
fast
(FFT
)
38shares,9
mon
ths(O
ctob
er20
08to
theendof
June
2009
),Tun
isianStockExchang
e,Tun
isia
Con
firmsthattradingvolume,return
volatility
and
liquidity
profi
lefollo
waU-shapedcurve.All
thesevariablesareatthehighestlevelatthe
openingof
trading,declinerapidlyin
themiddle
ofthedayandthen
they
increase
againduring
the
finalminutes
oftrading
Strawinskiand
Slepaczuk
(200
8)Regressionwith
weights,i.e.
robustregression
5-min
returnsfortheperiod
:200
3–20
08)anddaily
data(for
10yearstim
espan:1
998–
2008
)for
WIG
20indexfutures,Po
land
Find
strong
jumps
atthebeginn
ingof
tradingforall
days
except
Wednesday
andapositiv
edayeffect
forMonday,as
wellaspositiv
e,persistent
and
significant
jumps
attheendof
session
123

280 G. M. Caporale et al.
Harris (1986) and Thaler (1987) examined 15-min intervals in asset prices move-ment to identify patterns in (the volatility of) returns (see also Levy 2002, and Dimson1988). Harris (1986) found a time of the day anomaly in the first 45 min of a trad-ing session of all days of the week except Monday and at the end of a trading day(approximately the last 5 min of the session). In his study of the Spanish stock market,Camino (1996) found positive returns in the first hour of the trading session in alltrading days except Monday and Wednesday, and a strong tendency for prices to risein the first and last 15-min periods of trading (see also Coroneo and Veredas 2006).Wood et al. (1985) reported jumps at the opening and closing of trading. Brooks etal. (2003) found higher trading volumes in the NYSE at the beginning and the end ofthe day. The possibility of using the U-shaped pattern by market participants to buildtrading strategies was emphasized by Abhyankar et al. (1997). The same pattern wasfound with respect to trading volume, return volatility and liquidity profile by Tissaoui(2012) in the Tunisian Stock Exchange. Table 1 gives details of additional relevantstudies.
3 Data and Methodology
Although most studies suggest the presence of anomalies in the first 45 min (or firsthour) of the trading session, their results differ in terms of the exact time when theend-of-the-day anomaly emerges: the last transaction, the last 5 min, the last 15 min,the last hour. Chan (2005) reported that the overall average returns per minute in theHong Kong stock market (over the last 30 min, over the last 10 min, over the last5 min, and over the last 1 min) are statistically positive. However, the majority ofstudies consider 15-min intervals. Since the empirical literature does not provide clearevidence on intraday effects on specific weekdays (see, e.g., Strawinski and Slepaczuk2008; Harris 1989), and since it is difficult to distinguish between time of the day andday of the week effects, we focus specifically on the last 15 min before the end of thetrading session (see Levy 2002).
We look at the intraday anomaly from the trader’s viewpoint: is it possible to makeprofits from trading on intraday patterns (which would indicate market inefficiency)?In particular, we test the following hypotheses:
Hypothesis 1: first 45 min up effect exists (H1):
– H1a—case of developed countries– H1b—case of developing countries
Hypothesis 2 last 15 min up effect exists (H2)
– H2a—case of developed countries– H2b—case of developing countries
Hypothesis 3 the results for different periods (pre-crisis, crisis, and post-crisis) arestatistically different (H3).
We use data at 15-min intervals for 27 US companies included in the Dow Jones indexand 8 Blue-chip Russian companies. For the US the sample period is 2005–2011, andthe following sub-periods are also considered:
123

Intraday Anomalies and Market Efficiency 281
– 2005–2006—normal;– 2007–2009—crises;– 2010–2011—post-crises.
For Russia, owing to lack of data, the analysis is carried out only for the period2011–2013.
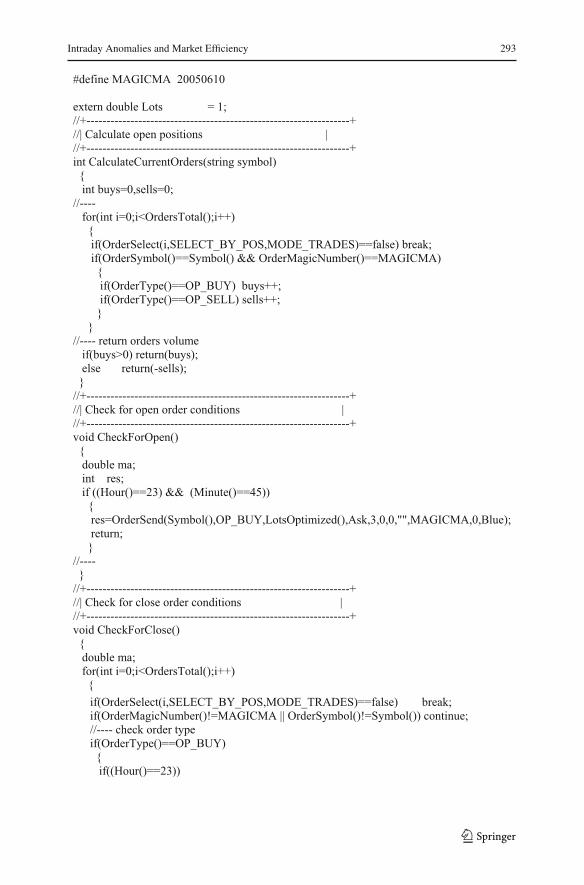
Most studies on intraday anomalies do not incorporate transaction costs, eventhough trading is inevitably connected with spreads, fees and commissions to bro-kers. These costs can be divided into fixed and variable ones. The latter are presentin each transaction. A typical example is the spread, which is incorporated into ouranalysis. Specifically, we programme a trading robot which automatically opens andcloses positions according to the time of the day effect. Positions (in our case only the“long” ones) will be opened on “ask” price and closed on “bid” price, though we willincorporate the variable part of transactional costs in our analysis. The algorithm isconstructed such that long positions are opened at the beginning of the trading sessionand are closed after 45 min (the first 45 min up effect mentioned by Harris (1986)and Levy (2002)), and are also opened at the end of the day. As we consider 15-minintervals, they are opened in the last 15 min of the trading session and are closed at theend of the session (the last 15 min of the day up effect mentioned by Levy 2002). Weuse a programme in the MetaTrader terminal that has been developed in MetaQuotesLanguage 4 (MQL4) and used for the automation of analytical and trading processes.Trading robots (called experts in MetaTrader) allow to analyse price data and managetrading activities on the basis of the signals received.
MetaQuotes Language 4 is the language for programming trade strategies built inthe client terminal. The syntax of MQL4 is quite similar to that of the C language.It allows to programme trading robots that automate trade processes and is ideallysuited for the implementation of trading strategies. The terminal allows not only toprogramme trading robots, but also to test them by checking their efficiency usinghistorical data. These are saved in the MetaTrader terminal as bars and representrecords appearing as TOHLCV (HST format). The trading terminal allows to testexperts by various methods. By selecting smaller periods it is possible to see pricefluctuations within bars, i.e., price changes will be reproduced more precisely. Forexample, when an expert is tested on one-hour data, price changes for a bar can bemodelled using 1-min data. The price history stored in the client terminal includes onlyBid prices. In order to model Ask prices, the strategy tester uses the current spreadat the beginning of testing. However, a user can set a custom spread for testing inthe “Spread”, thereby approximating better actual price movements. Positive profits> 50 % imply that H1 and H2 cannot be rejected. As for H3, we carry out t tests:H3 is rejected if t < tcri tical. The program codes for the trading robots used in thisstudy are presented in Appendix 4 and 5.
4 Empirical Results
The testing procedure comprises two steps, i.e. initially testing the first 45 min upeffect, and then the last 15 min up effect.
123

282 G. M. Caporale et al.
Table 2 Summary of testingresults for the “first 45 min upeffect”
Period Average profit trades(% of total)
Average totalnet profit
Average netprofit per deal
2005–2006 44 −174 −0.374
2007–2009 45 −336 −0.454
2010–2011 43 −142 −0.420
Table 3 t test for profit trades (% of total)
Mean Std.Dv. N Diff. Std.Dv. Diff. T df p
2005–2006 0.437129 0.047744
2007–2009 0.446955 0.030631 27 −0.009827 0.043375 −1.17720 26 0.249781
2005–2006 0.437129 0.047744
2010–2011 0.430666 0.047008 27 0.006463 0.051519 0.65187 26 0.520206
2007–2009 0.446955 0.030631
2010–2011 0.430666 0.047008 27 0.016290 0.051128 1.65555 26 0.109834
Table 4 t test for net profit per deal
Mean Std.Dv. N Diff. Std.Dv. Diff. T df p
2005–2006 −0.374775 0.334831
2007–2009 −0.454636 0.332846 27 0.079861 0.282592 1.46845 26 0.153979
2005–2006 −0.374775 0.334831
2010–2011 −0.419718 0.199970 27 0.044943 0.267637 0.87257 26 0.390885
2007–2009 −0.454636 0.332846
2010–2011 −0.419718 0.199970 27 −0.034918 0.319828 −0.56730 26 0.575377
Table 5 Summary of testingresults for the “last 15 min upeffect”
Period Average profit trades(% of total)
Average totalnet profit
Average netprofit per deal
2005–2006 26 −235 −0.538
2007–2009 35 −351 −0.512
2010–2011 31 −168 −0.544
The complete results for the former are presented in Appendix 1. A summary fordifferent time periods is shown in Table 2.
As can be seen, all periods were unprofitable, with the probability of a profitabletrade being less than 50 %. Hypothesis H1a is rejected, i.e. there is no evidence ofa first 45 min up effect in the US stock market. Table 3 reports the t test for H3 fordifferent sub-periods: here is rejected in all cases. Table 4 shows that H3 is not rejectedfor net profit per deal in any of the sub-periods.The complete results for the last 15 min up effect are presented in Appendix 2. Asummary for the different time periods is displayed in Table 5.
123

Intraday Anomalies and Market Efficiency 283
Table 6 t test for profit trades (% of total)
Mean Std.Dv. N Diff. Std.Dv. Diff. T df P
2005–2006 0.256040 0.078941
2007–2009 0.352451 0.058585 27 −0.096411 0.059926 −8.35981 26 0.000000
2005–2006 0.256040 0.078941
2010–2011 0.313853 0.069267 27 −0.057813 0.082721 −3.63156 26 0.001213
2007–2009 0.352451 0.058585
2010–2011 0.313853 0.069267 27 0.038598 0.043483 4.61237 26 0.000094
Table 7 t test for net profit per deal
Mean Std.Dv. N Diff. Std.Dv. Diff. T df P
2005–2006 −0.538260 0.477750
2007–2009 −0.511261 0.489490 27 −0.026999 0.093330 −1.50316 26 0.144847
2005–2006 −0.538260 0.477750
2010–2011 −0.544096 0.534294 27 0.005836 0.121219 0.25016 26 0.804429
2007–2009 −0.511261 0.489490
2010–2011 −0.544096 0.534294 27 0.032835 0.104634 1.63058 26 0.115035
Table 8 Summary for theRussian stock market
Hypothesis Average profit trades(% of total)
Average total netprofit per deal
First 45 min up effect 41 −2
Last 15 min up effect 37 −1
All periods were unprofitable, with the probability of a profitable trade being lessthan 40%. Hypothesis H2a is rejected: there is no last 15 min up effect in the US stockmarket.
The t tests for H3 for different sub periods are displayed in Table 6: this hypothesiscannot be rejected, and this applies to all sub-periods.
Table 7 shows that H3 is rejected for net profit per deal. There is no evidence ofdifferences between sub-periods.The complete results for Russia are presented in Appendix 3. A summary is providedin Table 8: H1b and H2b are rejected again, indicating the absence of the intradayanomaly being considered in a less developed market as well.
5 Conclusions
The empirical relevance of the EMH has been called into question by many studiesfinding evidence of so-called anomalies seemingly giving agents the opportunity tomake abnormal profits. This paper argues that the presence of anomalies does not
123

284 G. M. Caporale et al.
necessarily represent evidence of market inefficiency (risk-free profit opportunities):using a trading robot simulating the actions of a trader we show in the case of intradaypatterns that, if transaction costs are taken into account, there are no profitable tradingstrategies (i.e. opportunities tomake abnormal profits exploiting this type of anomaly),and therefore no evidence against the EMH.
Specifically, we consider a well-known “time of the day anomaly”: prices tend tobe up during the first 45 min and the last 15 min of the trading session.
We test 3 hypotheses:
– Hypothesis 1: first 45 min up effect exists (H1):– Hypothesis 2: last 15 min up effect exists (H2)– Hypothesis 3: results for different periods (pre-crisis, crisis, and post-crisis) arestatistically different (H3)
These hypotheses are rejected for both the US and Russia, a mature and less devel-oped stockmarket respectively. The only exception is H3: the results for the last 15minup effect vary depending on the sub-period considered.
On the whole, our analysis implies that it is not possible to exploit intraday pat-terns to make abnormal profits. This suggests that the results from previous studiespurporting to provide evidence of exploitable profit opportunities resulting from mar-ket anomalies (which would be inconsistent with the EMH) were in fact misleadingbecause they did not take into account transaction costs. The trading robot approachused in the present study can also be used to analyse other anomalies, but this is leftfor future work.
Acknowledgments We are grateful to a member of the editorial board for useful comments and sugges-tions.
Open Access This article is distributed under the terms of the Creative Commons Attribution Licensewhich permits any use, distribution, and reproduction in any medium, provided the original author(s) andthe source are credited.
Appendix 1
First 45 min up effect2005–2006
Company Total trades Profit trades Profit trades (% of total) Total net profit
Alcoa 465 195 41.94 −256.1Altria Group 464 213 45.91 −28.9American ExpressCompany
465 214 46.02 −46.6
ATT Inc 458 191 41.70 −84.3Boeing 465 212 45.59 −315.7Coca-Cola 465 163 35.05 −247.4
123

Intraday Anomalies and Market Efficiency 285
Company Total trades Profit trades Profit trades (% of total) Total net profit
DuPont 465 217 46.67 −126.3ExxonMobilCorporation
465 209 44.95 −185.9
General ElectricCorporation
465 208 44.73 −85.2
Hewlett-PackardCompany
485 278 57.32 138.2
Home Depot Corp 465 208 44.73 −158.8HoneywellInternational Inc
465 219 47.10 −90.7
IBM Corporation 465 168 36.13 −646.2Intel Corporation 465 200 43.01 −101International PaperCompany
465 182 39.14 −256.9
Johnson&Johnson 464 189 40.73 −159.8JP Morgan Chase 465 225 48.39 −26.1McDonaldsCorporation
465 180 38.71 −270.3
Merck Co Inc 465 229 49.25 −105.4Microsoft 465 220 47.31 −29MMM Company 465 197 42.37 −423.8Pfizer 465 185 39.78 −195Procter GambleCompany
465 211 45.38 −145.4
UnitedTechnologiesCorporation
465 173 37.20 −429.1
VerizonCommunicationsInc
485 185 38.14 −249.1
Wal-Mart Stores Inc 464 213 45.91 −129.1Walt Disney 465 219 47.10 −54
2007–2009
Company Total trades Profit trades Profit trades (% of total) Total net profit
Alcoa 740 322 43.51 −447.6Altria Group 740 322 43.51 −169.3American ExpressCompany
728 300 41.21 −629
ATT Inc 739 321 43.44 −272.7Boeing 739 330 44.65 −761.2Coca-Cola 740 340 45.95 −326.9DuPont 740 339 45.81 −299.6ExxonMobilCorporation
740 373 50.41 119.1
General ElectricCorporation
740 281 37.97 −559.6
Hewlett-PackardCompany
740 381 51.49 58.2
123

286 G. M. Caporale et al.
Company Total trades Profit trades Profit trades (% of total) Total net profit
Home Depot Corp 740 311 42.03 −274.8HoneywellInternational Inc
740 328 44.32 −546.7
IBM Corporation 740 331 44.73 −1005.4Intel Corporation 738 328 44.44 −226.7International PaperCompany
740 338 45.68 −254.4
Johnson&Johnson 740 332 44.86 −286.9JP Morgan Chase 740 322 43.51 −406.6McDonaldsCorporation
740 317 42.84 −365.4
Merck Co Inc 740 369 49.86 −112.2Microsoft 740 355 47.97 −102.5MMM Company 739 335 45.33 −478Pfizer 740 301 40.68 −200.6Procter GambleCompany
740 358 48.38 −122.4
UnitedTechnologiesCorporation
740 301 40.68 −658.7
VerizonCommunicationsInc
740 319 43.11 −307.7
Wal-Mart Stores Inc 740 330 44.59 −224.7Walt Disney 740 339 45.81 −208.3
2010–2011
Company Total trades Profit trades Profit trades (% of total) Total net profit
Alcoa 334 134 40.12 −112.1Altria Group 339 118 34.81 −129American ExpressCompany
339 164 48.38 −110
ATT Inc 339 111 32.74 −192.7Boeing 339 159 46.90 −153.6Coca-Cola 339 139 41.00 −213.8DuPont 338 168 49.70 −41.5ExxonMobilCorporation
339 137 40.41 −215.5
General ElectricCorporation
339 142 41.89 −113.3
Hewlett-PackardCompany
339 177 52.21 −23.1
Home Depot Corp 339 164 48.38 −44.2HoneywellInternational Inc
339 151 44.54 −125.1
IBM Corporation 339 149 43.95 −296.5Intel Corporation 339 135 39.82 −155.4International PaperCompany
339 166 48.97 −80.1
123

Intraday Anomalies and Market Efficiency 287
Company Total trades Profit trades Profit trades (% of total) Total net profit
Johnson&Johnson 339 141 41.59 −130.8JP Morgan Chase 339 160 47.20 −162.8McDonaldsCorporation
339 140 41.30 −205
Merck Co Inc 339 134 39.53 −162.2Microsoft 339 131 38.64 −186.5MMM Company 338 151 44.67 −144.5Pfizer 339 131 38.64 −109.9Procter GambleCompany
339 152 44.84 −141.2
UnitedTechnologiesCorporation
339 139 41.00 −252.7
VerizonCommunicationsInc
339 130 38.35 −218.4
Wal-Mart Stores Inc 338 157 46.45 −90.3Walt Disney 338 158 46.75 −28.9
Appendix 2
Last 15 min up effect2005–2006
Company Total trades Profit trades Profit trades (% of total) Total net profit
Alcoa 465 195 41.94 −256.1Altria Group 464 213 45.91 −28.9American ExpressCompany
465 214 46.02 −46.6
ATT Inc 458 191 41.70 −84.3Boeing 465 212 45.59 −315.7Coca-Cola 465 163 35.05 −247.4DuPont 465 217 46.67 −126.3ExxonMobilCorporation
465 209 44.95 −185.9
General ElectricCorporation
465 208 44.73 −85.2
Hewlett-PackardCompany
485 278 57.32 138.2
Home Depot Corp 465 208 44.73 −158.8HoneywellInternational Inc
465 219 47.10 −90.7
IBM Corporation 465 168 36.13 −646.2Intel Corporation 465 200 43.01 −101International PaperCompany
465 182 39.14 −256.9
Johnson&Johnson 464 189 40.73 −159.8JP Morgan Chase 465 225 48.39 −26.1
123

288 G. M. Caporale et al.
Company Total trades Profit trades Profit trades (% of total) Total net profit
McDonaldsCorporation
465 180 38.71 −270.3
Merck Co Inc 465 229 49.25 −105.4Microsoft 465 220 47.31 −29MMM Company 465 197 42.37 −423.8Pfizer 465 185 39.78 −195Procter GambleCompany
465 211 45.38 −145.4
UnitedTechnologiesCorporation
465 173 37.20 −429.1
VerizonCommunicationsInc
485 185 38.14 −249.1
Wal-Mart Stores Inc 464 213 45.91 −129.1Walt Disney 465 219 47.10 −54
2007–2009
Company Total trades Profit trades Profit trades (% of total) Total net profit
Alcoa 740 322 43.51 −447.6Altria Group 740 322 43.51 −169.3American ExpressCompany
728 300 41.21 −629
ATT Inc 739 321 43.44 −272.7Boeing 739 330 44.65 −761.2Coca-Cola 740 340 45.95 −326.9DuPont 740 339 45.81 −299.6ExxonMobilCorporation
740 373 50.41 119.1
General ElectricCorporation
740 281 37.97 −559.6
Hewlett-PackardCompany
740 381 51.49 58.2
Home Depot Corp 740 311 42.03 −274.8HoneywellInternational Inc
740 328 44.32 −546.7
IBM Corporation 740 331 44.73 −1005.4Intel Corporation 738 328 44.44 −226.7International PaperCompany
740 338 45.68 −254.4
Johnson&Johnson 740 332 44.86 −286.9JP Morgan Chase 740 322 43.51 −406.6McDonaldsCorporation
740 317 42.84 −365.4
Merck Co Inc 740 369 49.86 −112.2Microsoft 740 355 47.97 −102.5MMM Company 739 335 45.33 −478Pfizer 740 301 40.68 −200.6
123

Intraday Anomalies and Market Efficiency 289
Company Total trades Profit trades Profit trades (% of total) Total net profit
Procter GambleCompany
740 358 48.38 −122.4
UnitedTechnologiesCorporation
740 301 40.68 −658.7
VerizonCommunicationsInc
740 319 43.11 −307.7
Wal-Mart Stores Inc 740 330 44.59 −224.7Walt Disney 740 339 45.81 −208.3
2010–2011
Company Total trades Profit trades Profit trades (% of total) Total net profit
Alcoa 308 58 18.83 −95Altria Group 308 78 25.32 −101.4American ExpressCompany
308 127 41.23 −97.5
ATT Inc 308 112 36.36 −89.4Boeing 308 96 31.17 −210.9Coca-Cola 308 92 29.87 −198.1DuPont 308 124 40.26 −93.9ExxonMobilCorporation
308 106 34.42 −207
General ElectricCorporation
308 88 28.57 −94.6
Hewlett-PackardCompany
308 107 34.74 −136.9
Home Depot Corp 308 86 27.92 −124.9HoneywellInternational Inc
308 122 39.61 −100.2
IBM Corporation 308 34 11.04 −947.6Intel Corporation 308 91 29.55 −105.5International PaperCompany
308 115 37.34 −79.5
Johnson&Johnson 308 118 38.31 −115.4JP Morgan Chase 308 119 38.64 −101.1McDonaldsCorporation
308 79 25.65 −250.4
Merck Co Inc 308 94 30.52 −110.5Microsoft 308 99 32.14 −122.3MMM Company 308 109 35.39 −190.7Pfizer 308 76 24.68 −106.3Procter GambleCompany
308 78 25.32 −236.8
UnitedTechnologiesCorporation
308 101 32.79 −224.2
123

290 G. M. Caporale et al.
Company Total trades Profit trades Profit trades(% of total)
Total net profit
VerizonCommunicationsInc
308 116 37.66 −89.2
Wal-Mart Stores Inc 308 85 27.60 −182.6Walt Disney 308 100 32.47 −112.8
Appendix 3
Results for Russian stock marketsFirst 45 min up effect
Company Total trades Profit trades Profit trades(% of total)
Total netprofit
Profit per deal
GAZPROM 286 148 51.75 66.5 0.23252GAZPROM NEFT 264 95 35.98 −173 −0.6553LUKOIL 287 132 45.99 −557 −1.9408NORILSKY NICKEL 285 106 37.19 −434 −1.5228ROSNEFT 287 127 44.25 −123.6 −0.4307SBERBANK 286 136 47.55 −275 −0.9615SURGUTNEFTEGAZ 287 134 46.69 −335 −1.1672VTB BANK 242 50 20.66 −1757 −7.2603
Last 15 min up effect
Company Total trades Profit trades Profit trades(% of total)
Total netprofit
Profit per deal
GAZPROM 378 185 48.94 −2.4 −0.0063GAZPROM NEFT 347 45 12.97 −459 −1.3228LUKOIL 378 154 40.74 −94 −0.2487NORILSKY NICKEL 378 168 44.44 −236 −0.6243ROSNEFT 378 181 47.88 −9.9 −0.0262SBERBANK 378 171 45.24 −547 −1.4471SURGUTNEFTEGAZ 378 152 40.21 −179 −0.4735VTB BANK 320 38 11.88 −26.4 −0.0825
Appendix 4
Program code for the “first 45 min up effect”
123

Intraday Anomalies and Market Efficiency 291
123

292 G. M. Caporale et al.
Appendix 5
Program code for the “last 15 min up effect”
123
Intraday Anomalies and Market Efficiency 293
123

294 G. M. Caporale et al.
References
Abhyankar, A., Ghosh, D., Levin, E., &Limmack, R. (1997). Bid-ask spreads, trading volume and volatility:Intra-day evidence from the London stock exchange. Journal of Business Finance & Accounting, 24(3& 4), 343–362.
Admati, A., & Pfleiderer, P. (1988). A theory of intraday patterns: Volume and price variability. The Reviewof Financial Studies, 1(1), 3–40.
Akerlof, G. A., & Shiller, R. J. (2009). Animal spirits: How human psychology drives the economy, andwhy it matters for global capitalism. Princeton: Princeton University Press.
Brooks, C., Hinich, M., & Patterson, D. (2003). Intra-day patterns in the returns, bid-ask spreads, andtrading volume of stocks traded on the New York stock exchange. ICMA Centre Discussion Papers inFinance icma-dp2003-14, Henley Business School, Reading University.
Camino, D. (1996). The role of information and trading volume on intradaily and weekly returns patternin the Spanish stock market. Business economics series 01, working paper 96–10 Departamento deEconomía de la Empresa Universidad Carlos III de Madrid.
Çankaya, S., Eken, H., & Ulusoy, V. (2012). The impact of short selling on intraday volatility: Evidencefrom the Istanbul stock exchange. International Research Journal of Finance and Economics, 93,202–212.
Chan, A. (2005). Relationship between trading at ask price and the end-of-day effect in Hong Kong stockexchange investment management and financial. Innovations, 4, 124–136.
Coroneo, L., & Veredas, D. (2006). Intradaily seasonality of returns distributuion: A quantile regressionapproach and intradaily VaR estimation. CORE discussion paper: Center for operations research andeconometrics.
Dimson, E. (1988). Stock market anomalies. New York: Cambridge University Press. 295 p.Fama, E. F. (1965). The behavior of stock-market prices. The Journal of Business, 38(1), 34–105.
123

Intraday Anomalies and Market Efficiency 295
Fama, E. (1970). Efficient capital markets: A review of theory and empirical work. Journal of Finance, 25,383–417.
Grossman, S., & Stiglitz, J. (1980). On the impossibility of informationally efficient markets. AmericanEconomic Review, 70, 393–408.
Harris, L. (1986). A transaction data study of weekly and intradaily patterns in stock returns. Journal ofFinancial Economics, 16, 99–117.
Harris, L. (1989). A day-end transactions price anomaly. Journal of Financial and Quantitative Analysis,24, 29–45.
Jacobsen, B., Mamun, A., & Visaltanachoti, N (2005). Seasonal, size and value anomalies. Working Paper,Massey Univeristy, University of Saskatchewan.
Jensen, M. C. (1978). Some anomalous evidence regarding market efficiency. Journal of Financial Eco-nomics, 6, 95–102.
Kuhn, T. (1970). The structure of scientific revolutions (2nd ed.). Chicago: University of Chicago Press.Levy, H. (2002). Fundamentals of investments. London: Financial Times Prentice Hall Books.Lintner, J. (1965). The valuation of risk assets and the selection of risky investments in stock portfolio and
capital budgets. Review of Economics and Statistics, 47(1), 13–37.Mandelbrot, B. (1963). The variation of certain speculative prices. Journal of Business, 36(4), 394–419.Mossin, J. (1966). Equilibrium in a capital asset market. Econometrica, 34(4), 768–783.Raghubir, P., & Das, S. (1999). The psychology of financial decision making: A case for theory-driven
experimental inquiry. Financial Analysts Journal (Special Issue on Behavioral Finance), 55, 55–80.Samuelson, P. (1965). Proof that properly anticipated prices fluctuate randomly. Industrial Management
Review, 6(2), 41–49.Schwert, G. W. (2003). Handbook of the economics of finance, chapter 15. In G. M. Constantinides,
M. Harris, & R. M. Stulz (Eds.), Anomalies and market efficiency (1st ed., Vol. 1, pp. 939–974).Amsterdam: Elsevier.
Sharpe,W. (1965). Capital asset prices: A theory ofmarket equilibrium under conditions of risk.The Journalof Finance, 19(3), 425–442.
Shiller, R. J. (2000). Irrational exuberance. Princeton: Princeton University Press.Strawinski, P., & Slepaczuk, R. (2008). Analysis of high frequency data on the Warsaw stock exchange in
the context of efficient market hypothesis. Journal of Applied Economic Sciences, 3(5), 306–319.Thaler, R. (1987). Seasonal movements in security prices II: Weekend, holiday, turn of the month, and
intraday effects. Economic Perspectives, 1(1), 169–177.Tissaoui, K. (2012). The intraday pattern of trading activity, return volatility and liquidity: Evidence from the
emerging Tunisian stock exchange. International Journal of Economics and Finance, 4(5), 156–176.Treynor, J. (1962). Towards a theory of market value of risky assets. Unpublished paper. “Rough draft”
dated by Mr. Treynor to the fall on 1962. A final version was published in 1999, in Asset Pricing andPortfolio Perfomance. Robert A. Korajczyk (Ed.) (pp. 15–22). London: Risk Books.
Wood, R., McInish, T., &Ord, J. (1985). An investigation of transactions data for NYSE stocks. The Journalof Finance, 40(3), 723–739.
123