interpreting eels fine structure - cornell...
TRANSCRIPT
David Muller 2006 1
Interpreting EELS Fine Structure
Notes to accompany the lectures delivered by David A. Muller at the SummerSchool on Electron Microscopy: Fundamental Limits and New Science heldat Cornell University, July 13-15, 2006.
Reading and References:
Muller, Singh and Silcox, Phys Rev B57, 8181 (1998) Theory of EELS as a LDOS
Fingerprints of most materials
V. Keast et al,(review of EELS)
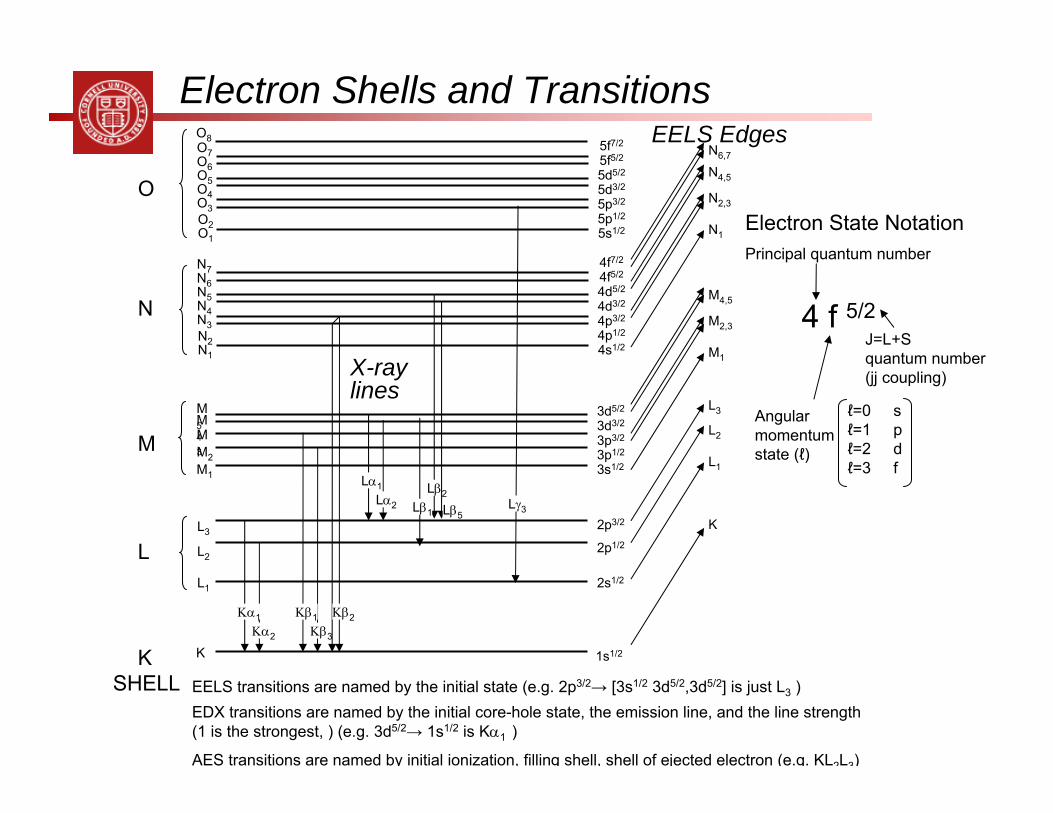
Electron Shells and Transitions
Electron State Notation
4 f 5/2
Principal quantum number
Angular momentum state (ℓ)
ℓ=0 sℓ=1 pℓ=2 dℓ=3 f
J=L+S quantum number (jj coupling)
EELS transitions are named by the initial state (e.g. 2p3/2→ [3s1/2 3d5/2,3d5/2] is just L3 )EDX transitions are named by the initial core-hole state, the emission line, and the line strength (1 is the strongest, ) (e.g. 3d5/2→ 1s1/2 is Kα1 )
AES transitions are named by initial ionization, filling shell, shell of ejected electron (e.g. KL2L3)
K K
SHELL
L1
L2
L3
L
M1
M2
M3M
1s1/2
2s1/2
2p1/2
2p3/2
3s1/23p1/23p3/23d3/23d5/2
M4
M5
N1
N2
N3
4s1/24p1/24p3/24d3/24d5/2
N4
N5N
N6
N7 4f5/24f7/2
O1
O2
O3
5s1/25p1/25p3/25d3/25d5/2
O4
O5OO6
O7 5f5/25f7/2
O8
Κα1Κα2
Κβ1Κβ3
Κβ2
Lα1Lα2 Lβ1
Lβ2
Lβ5Lγ3
K
L1
L2
L3
M1
M2,3
M4,5
N1
N2,3
N4,5
N6,7
EELS Edges
X-raylines
David Muller 2006 3
10 4
10 5
10 6
10 7
10 8
0 100 200 300 400 500 600 700
Inte
nsity
(arb
. uni
ts)
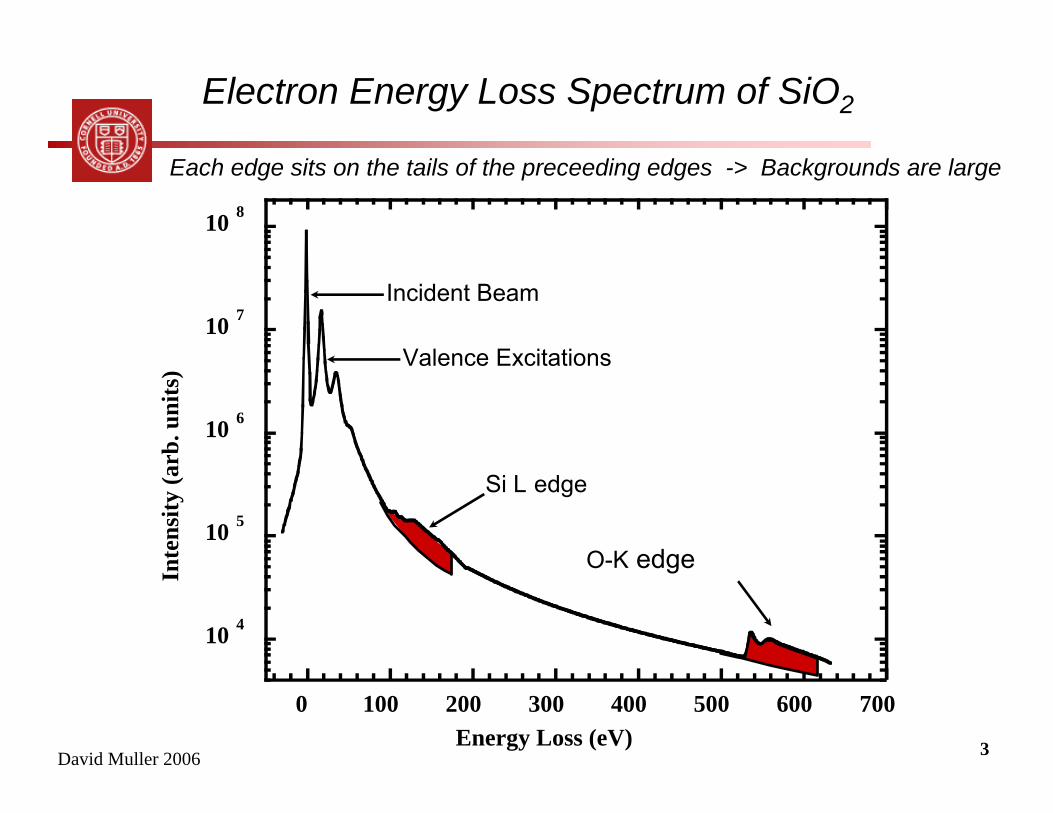
Energy Loss (eV)
O-K edge
Si L edge
Incident Beam
Valence Excitations
Electron Energy Loss Spectrum of SiO2
Each edge sits on the tails of the preceeding edges -> Backgrounds are large
David Muller 2006 4
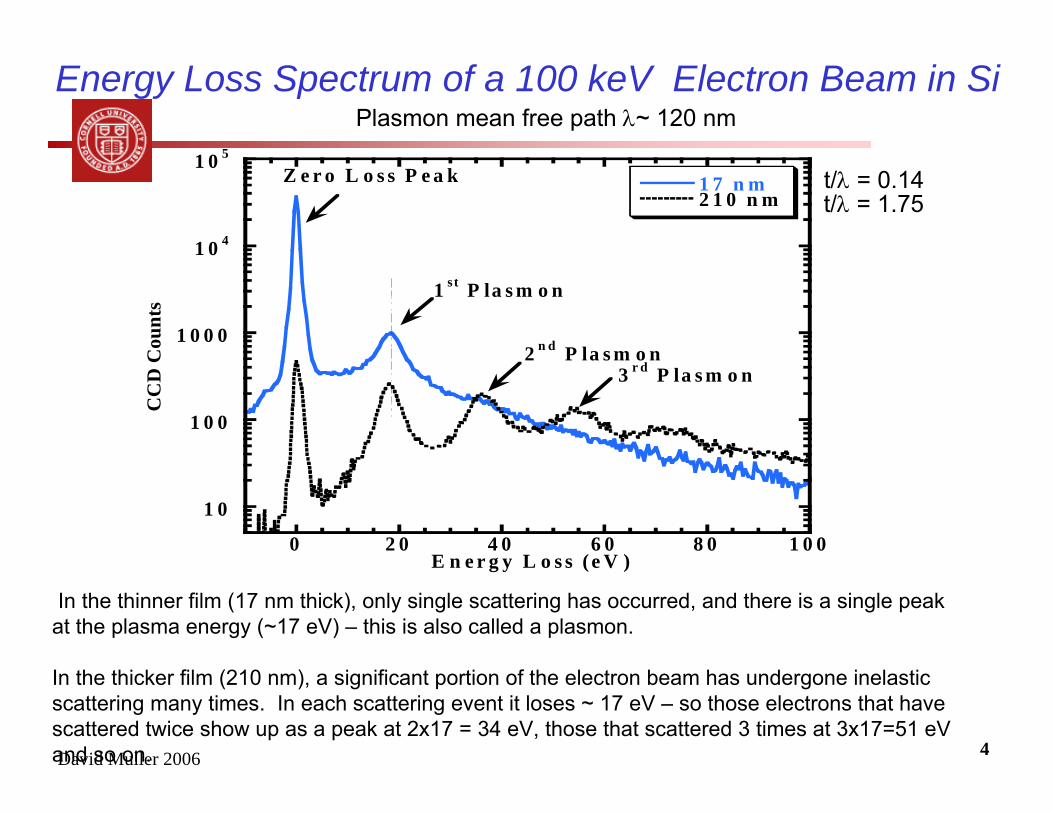
Energy Loss Spectrum of a 100 keV Electron Beam in Si
1 0
1 0 0
1 0 0 0
1 0 4
1 0 5
0 2 0 4 0 6 0 8 0 1 0 0
1 7 n m2 1 0 n m
CC
D C
ount
s
E n e r g y L o s s ( e V )
1 st P la s m o n
2 n d P la s m o n3 r d P la s m o n
Z e r o L o s s P e a k
In the thinner film (17 nm thick), only single scattering has occurred, and there is a single peak at the plasma energy (~17 eV) – this is also called a plasmon.
In the thicker film (210 nm), a significant portion of the electron beam has undergone inelastic scattering many times. In each scattering event it loses ~ 17 eV – so those electrons that have scattered twice show up as a peak at 2x17 = 34 eV, those that scattered 3 times at 3x17=51 eVand so on.
Plasmon mean free path λ~ 120 nm
t/λ = 0.14t/λ = 1.75
David Muller 2006 5
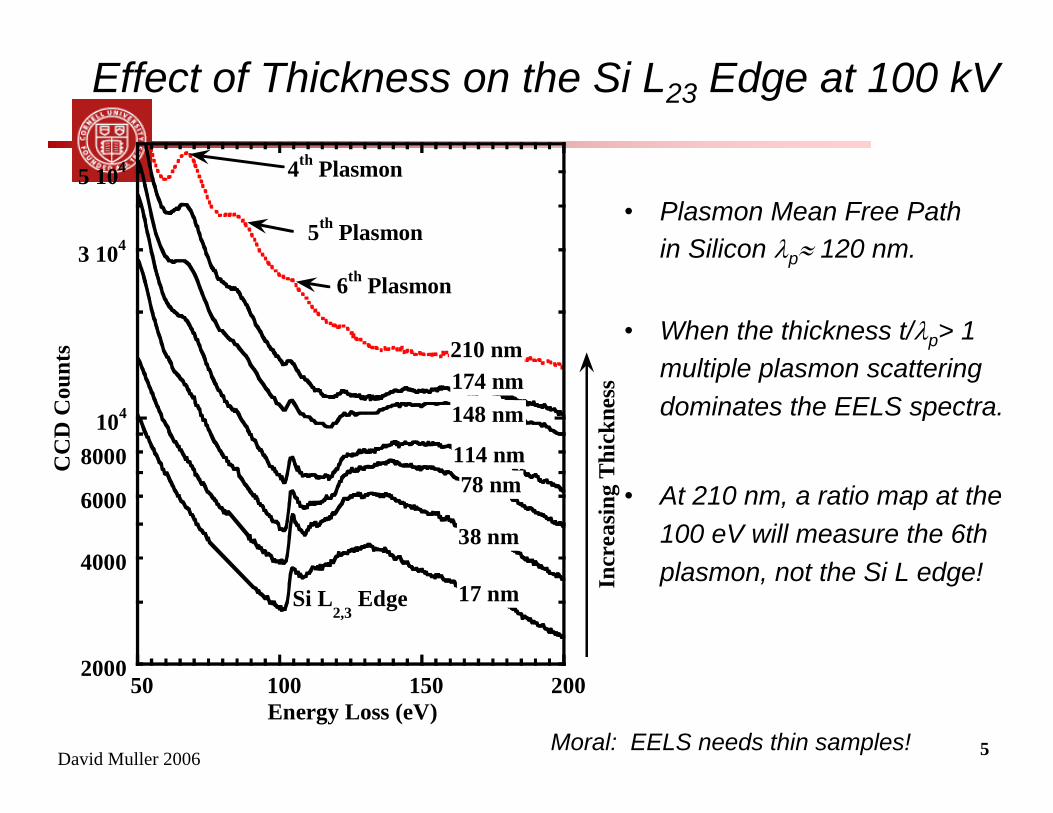
Effect of Thickness on the Si L23 Edge at 100 kV
• Plasmon Mean Free Pathin Silicon λp≈ 120 nm.
• When the thickness t/λp> 1 multiple plasmon scattering dominates the EELS spectra.
• At 210 nm, a ratio map at the 100 eV will measure the 6th plasmon, not the Si L edge!
2000
4000
6000
8000104
3 104
5 104
50 100 150 200
CC
D C
ount
s
Energy Loss (eV)
4th Plasmon
5th Plasmon
6th Plasmon
Si L2,3
Edge 17 nm
38 nm
78 nm114 nm
148 nm174 nm210 nm
Incr
easi
ng T
hick
ness
Moral: EELS needs thin samples!
David Muller 2006 6
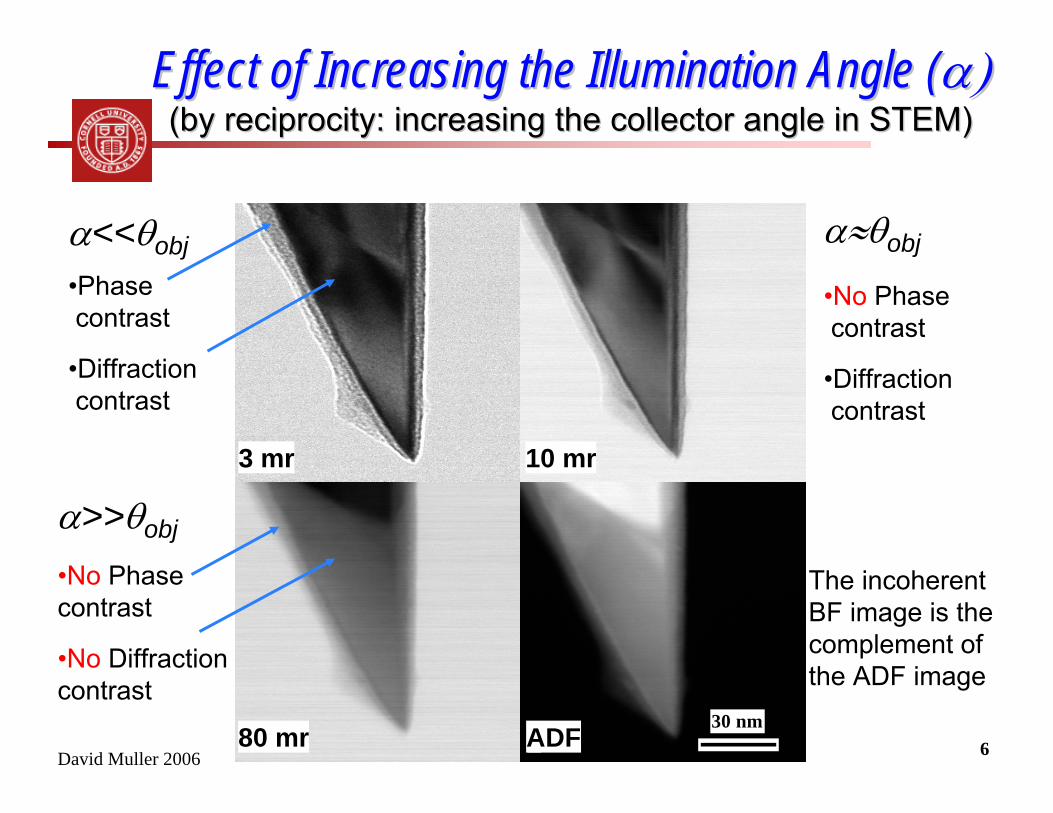
Effect of Increasing the Illumination Angle (Effect of Increasing the Illumination Angle (α)α)(by reciprocity: increasing the collector angle in STEM)(by reciprocity: increasing the collector angle in STEM)
1 2
3 430 nm
3 mr 10 mr
80 mr ADF
α>>θobj
•No Phasecontrast
•No Diffractioncontrast
α<<θobj•Phasecontrast
•Diffractioncontrast
α≈θobj
•No Phasecontrast
•Diffractioncontrast
The incoherent BF image is the complement of the ADF image
David Muller 2006 7
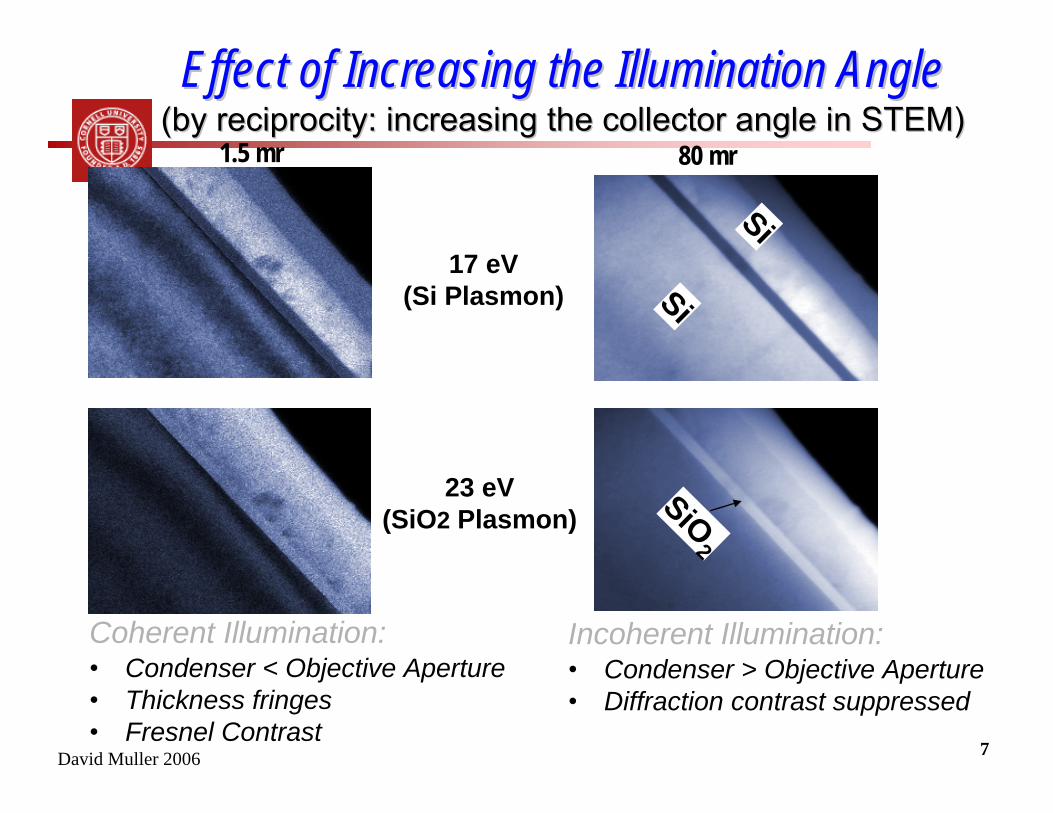
Effect of Increasing the Illumination AngleEffect of Increasing the Illumination Angle(by reciprocity: increasing the collector angle in STEM)(by reciprocity: increasing the collector angle in STEM)
Coherent Illumination:• Condenser < Objective Aperture• Thickness fringes• Fresnel Contrast
Incoherent Illumination:• Condenser > Objective Aperture• Diffraction contrast suppressed
1.5 mr 80 mr
17 eV(Si Plasmon)
23 eV(SiO2 Plasmon)
Si
Si
SiO2
David Muller 2006 8
-200
0
200
400
600
800
1000
1200
1400
530 540 550
Inte
nsity
(a.u
.)
Energy (eV)
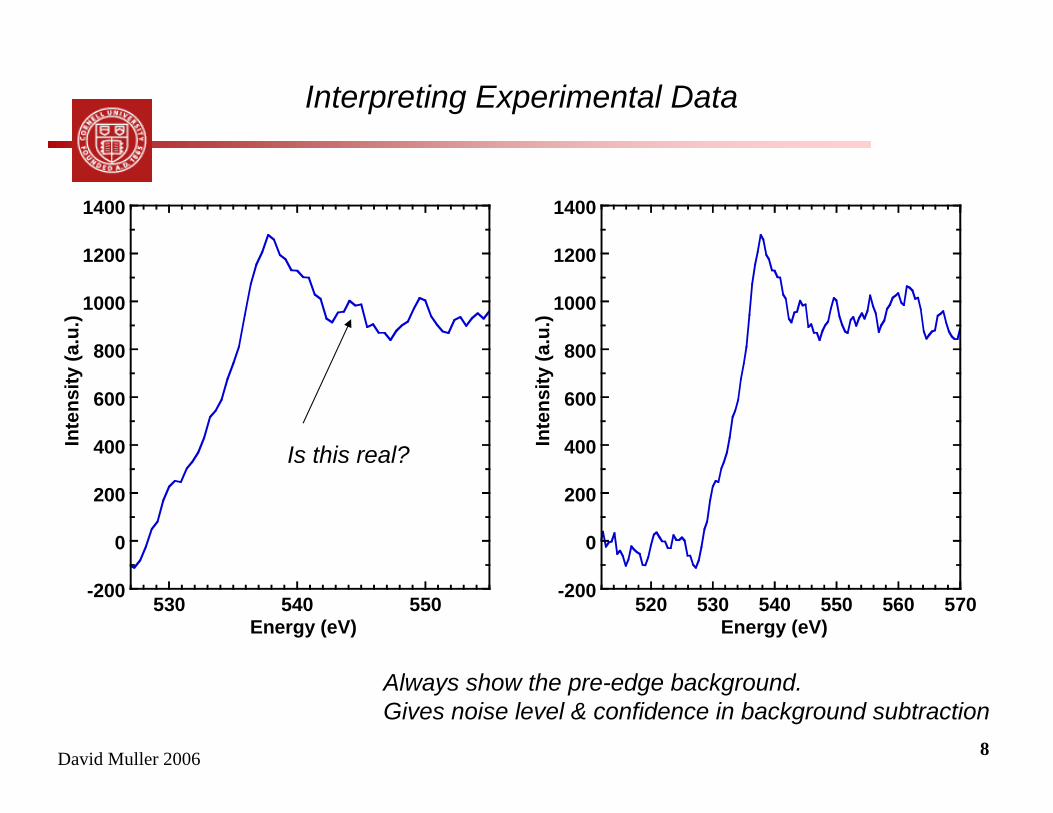
Is this real?
-200
0
200
400
600
800
1000
1200
1400
520 530 540 550 560 570
Inte
nsity
(a.u
.)
Energy (eV)
Always show the pre-edge background. Gives noise level & confidence in background subtraction
Interpreting Experimental Data
David Muller 2006 9
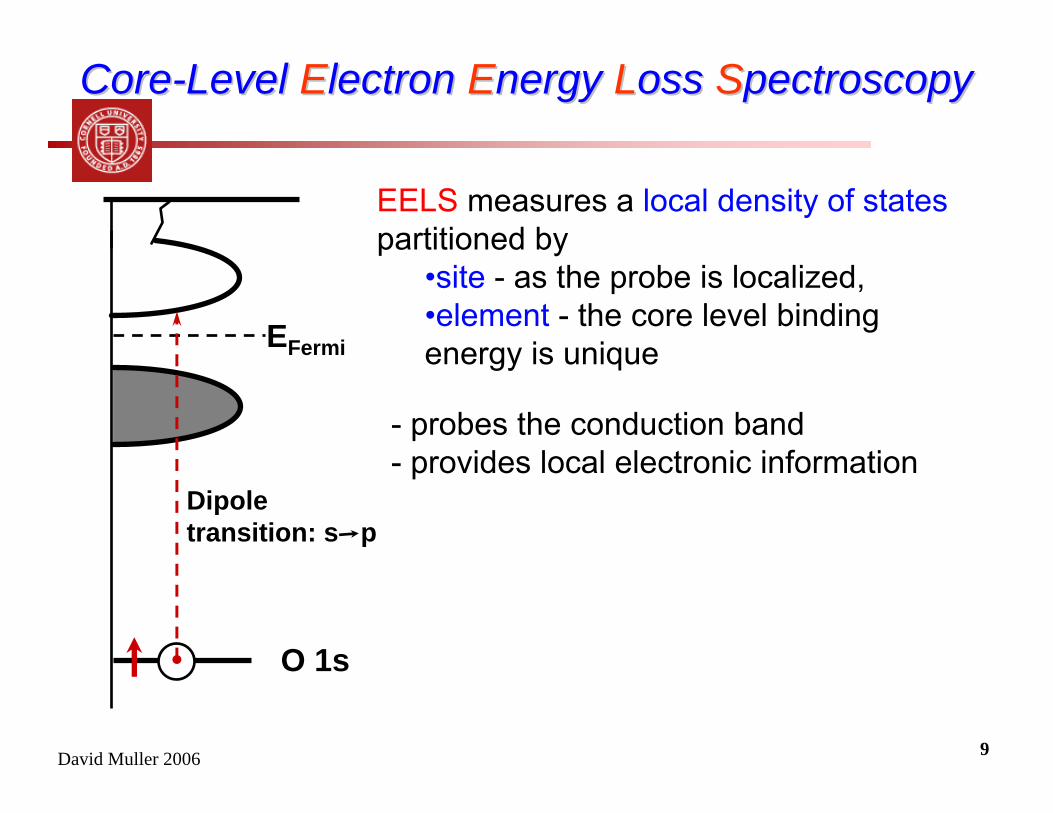
CoreCore--Level Level EElectron lectron EEnergy nergy LLoss oss SSpectroscopypectroscopy
EELS measures a local density of statespartitioned by
•site - as the probe is localized,•element - the core level bindingenergy is unique
- probes the conduction band- provides local electronic information
O 1s
EFermi
Dipole transition: s p
David Muller 2006 10
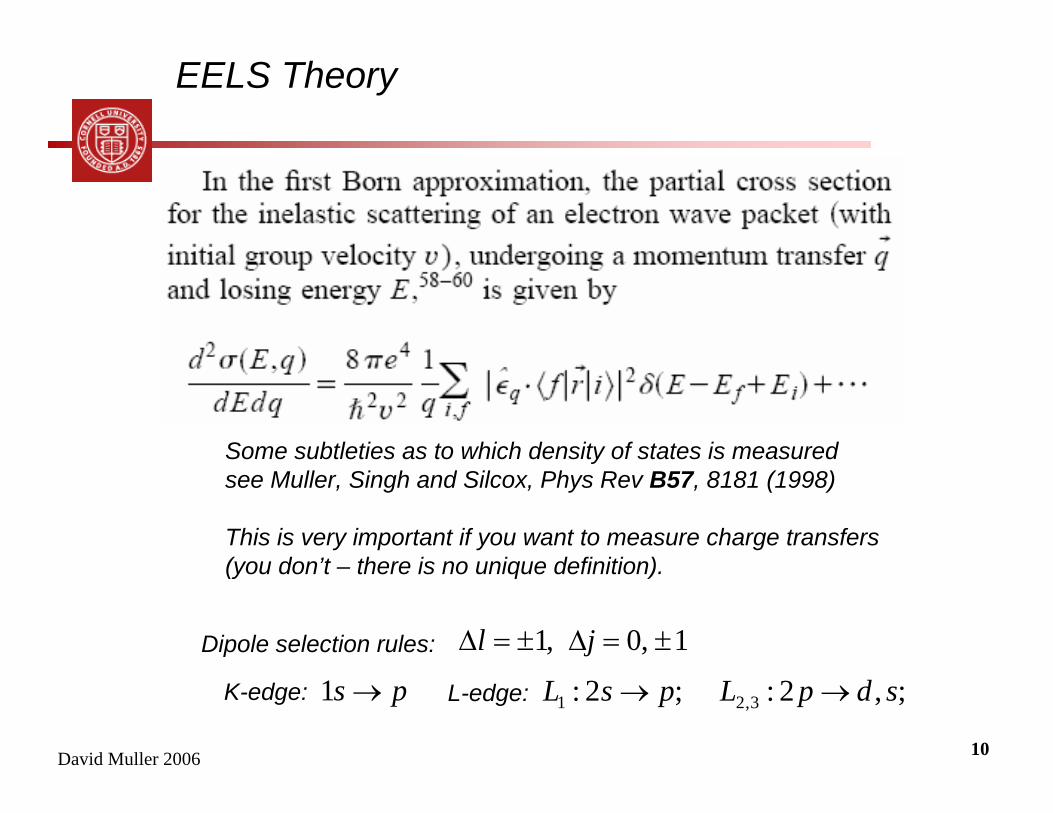
EELS Theory
Some subtleties as to which density of states is measured see Muller, Singh and Silcox, Phys Rev B57, 8181 (1998)
This is very important if you want to measure charge transfers (you don’t – there is no unique definition).
Dipole selection rules: 1,0,1 ±=∆±=∆ jl
ps →1K-edge: ;,2:;2: 3,21 sdpLpsL →→L-edge:
David Muller 2006 11Muller, Singh and Silcox, Phys Rev B57, 8181 (1998)
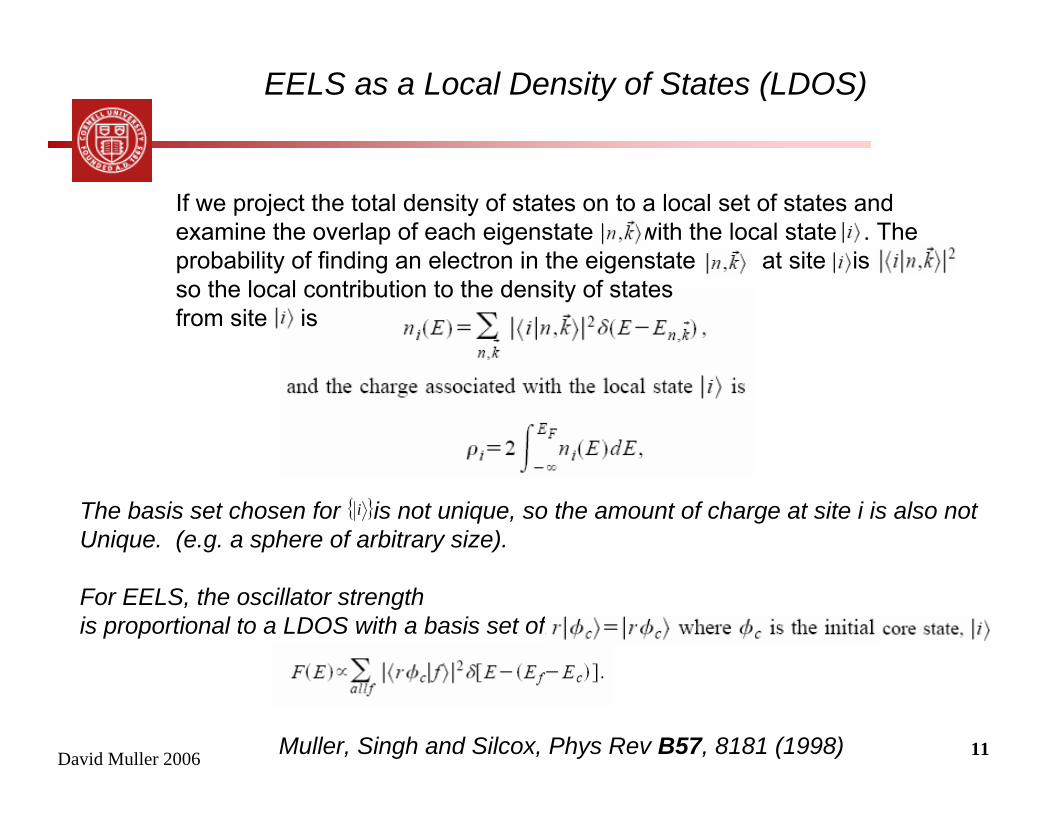
EELS as a Local Density of States (LDOS)
If we project the total density of states on to a local set of states and examine the overlap of each eigenstate with the local state . The probability of finding an electron in the eigenstate at site is , so the local contribution to the density of statesfrom site is
The basis set chosen for is not unique, so the amount of charge at site i is also not Unique. (e.g. a sphere of arbitrary size).
For EELS, the oscillator strength is proportional to a LDOS with a basis set of
{ }i
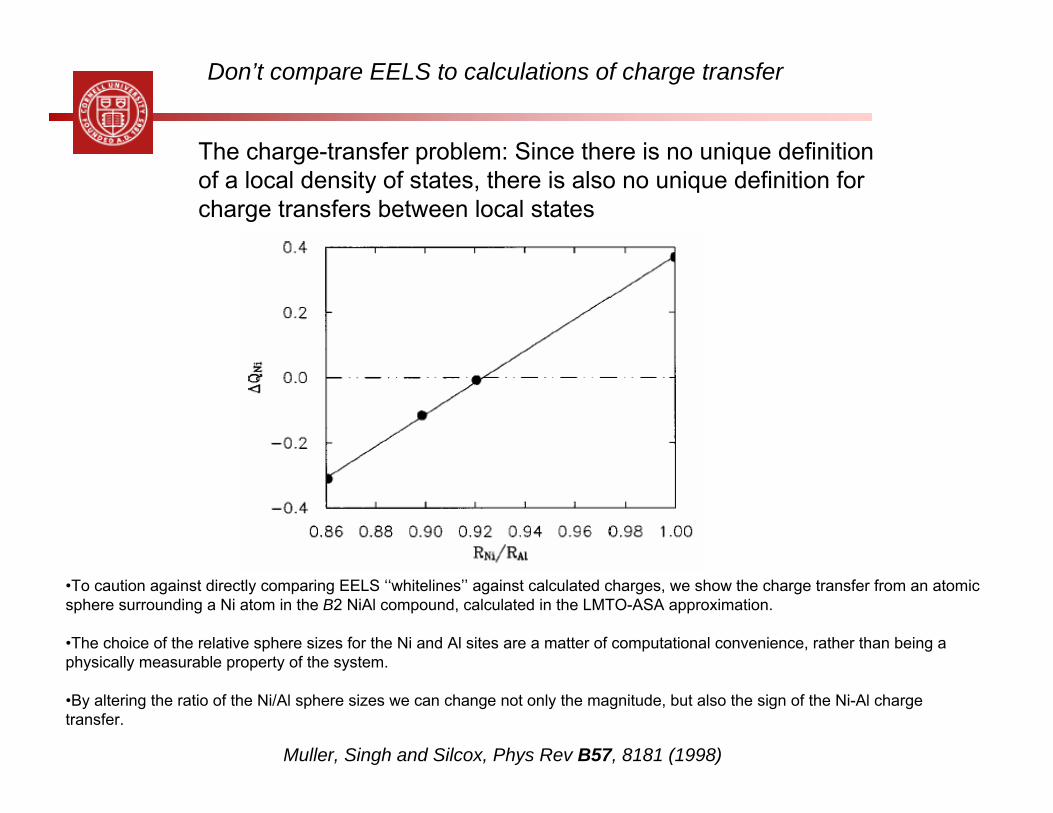
Don’t compare EELS to calculations of charge transfer
•To caution against directly comparing EELS ‘‘whitelines’’ against calculated charges, we show the charge transfer from an atomic sphere surrounding a Ni atom in the B2 NiAl compound, calculated in the LMTO-ASA approximation.
•The choice of the relative sphere sizes for the Ni and Al sites are a matter of computational convenience, rather than being a physically measurable property of the system.
•By altering the ratio of the Ni/Al sphere sizes we can change not only the magnitude, but also the sign of the Ni-Al charge transfer.
The charge-transfer problem: Since there is no unique definition of a local density of states, there is also no unique definition for charge transfers between local states
Muller, Singh and Silcox, Phys Rev B57, 8181 (1998)
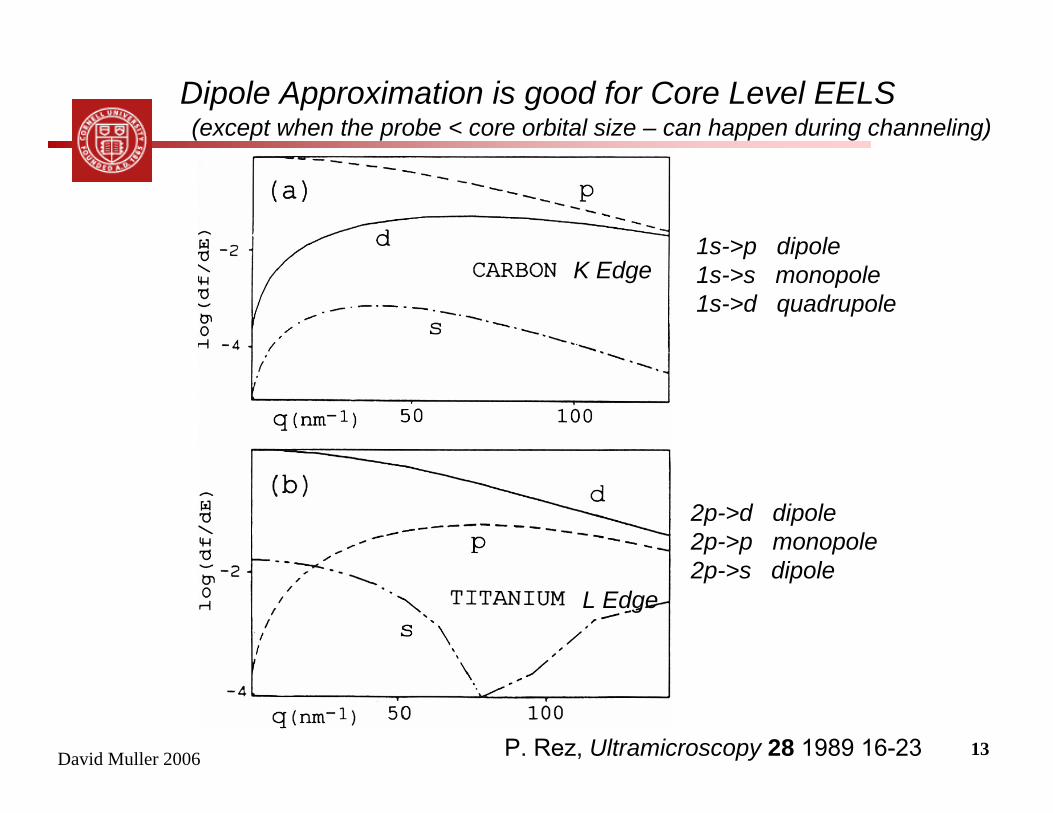
David Muller 2006 13P. Rez, Ultramicroscopy 28 1989 16-23
K Edge
L Edge
2p->d dipole2p->p monopole2p->s dipole
Dipole Approximation is good for Core Level EELS
1s->p dipole1s->s monopole1s->d quadrupole
(except when the probe < core orbital size – can happen during channeling)
David Muller 2006 14P. Rez, Ultramicroscopy 28 1989 16-23
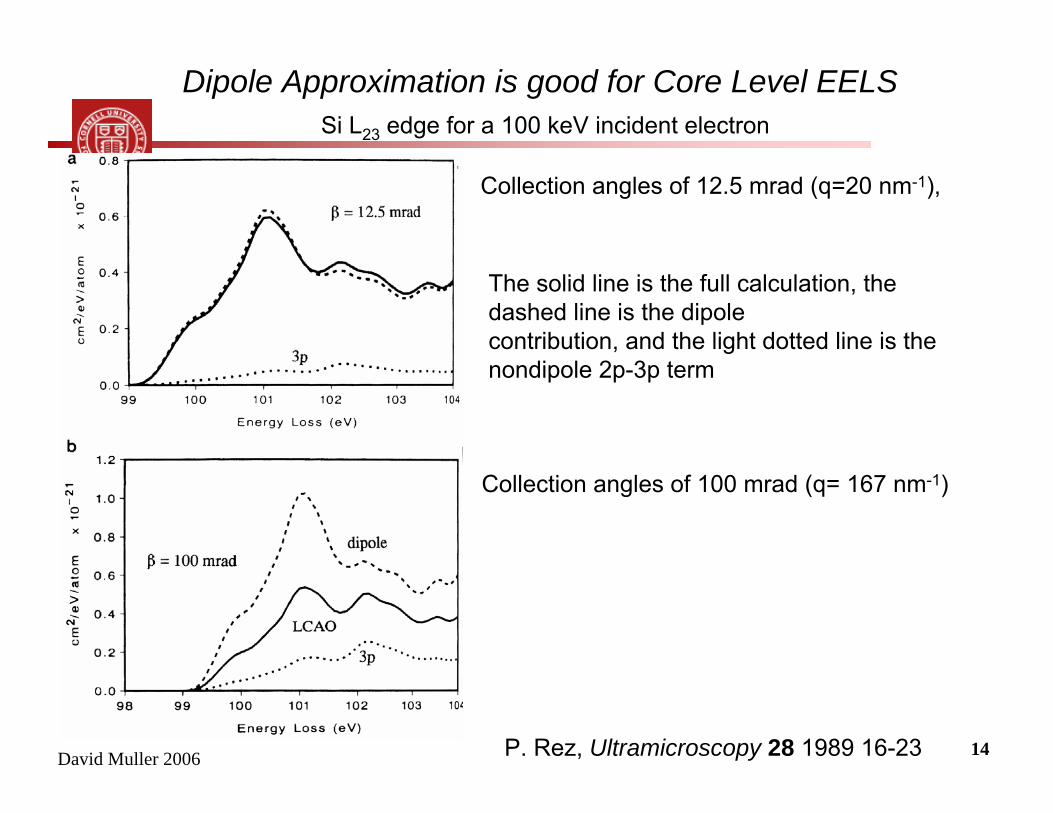
Dipole Approximation is good for Core Level EELS
The solid line is the full calculation, the dashed line is the dipolecontribution, and the light dotted line is the nondipole 2p-3p term
Si L23 edge for a 100 keV incident electron
Collection angles of 100 mrad (q= 167 nm-1)
Collection angles of 12.5 mrad (q=20 nm-1),
David Muller 2006 15
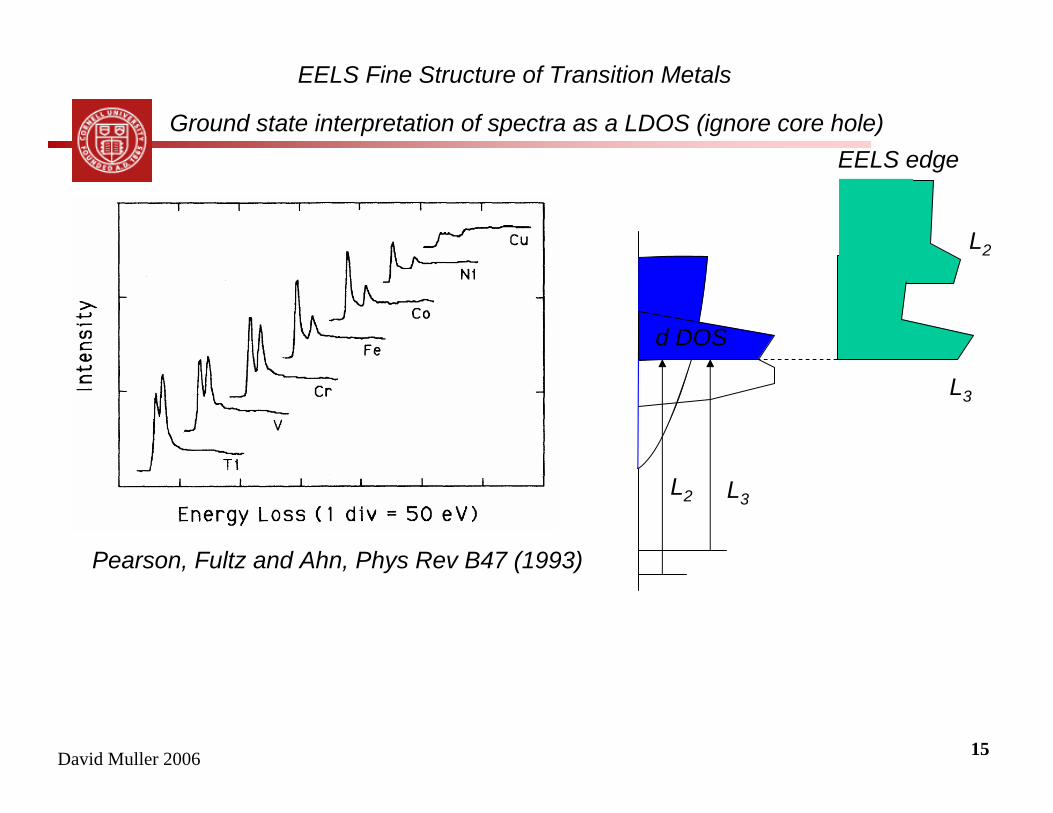
Pearson, Fultz and Ahn, Phys Rev B47 (1993)
EELS Fine Structure of Transition Metals
L2 L3
L3
L2
d DOS
EELS edgeGround state interpretation of spectra as a LDOS (ignore core hole)
David Muller 2006 16
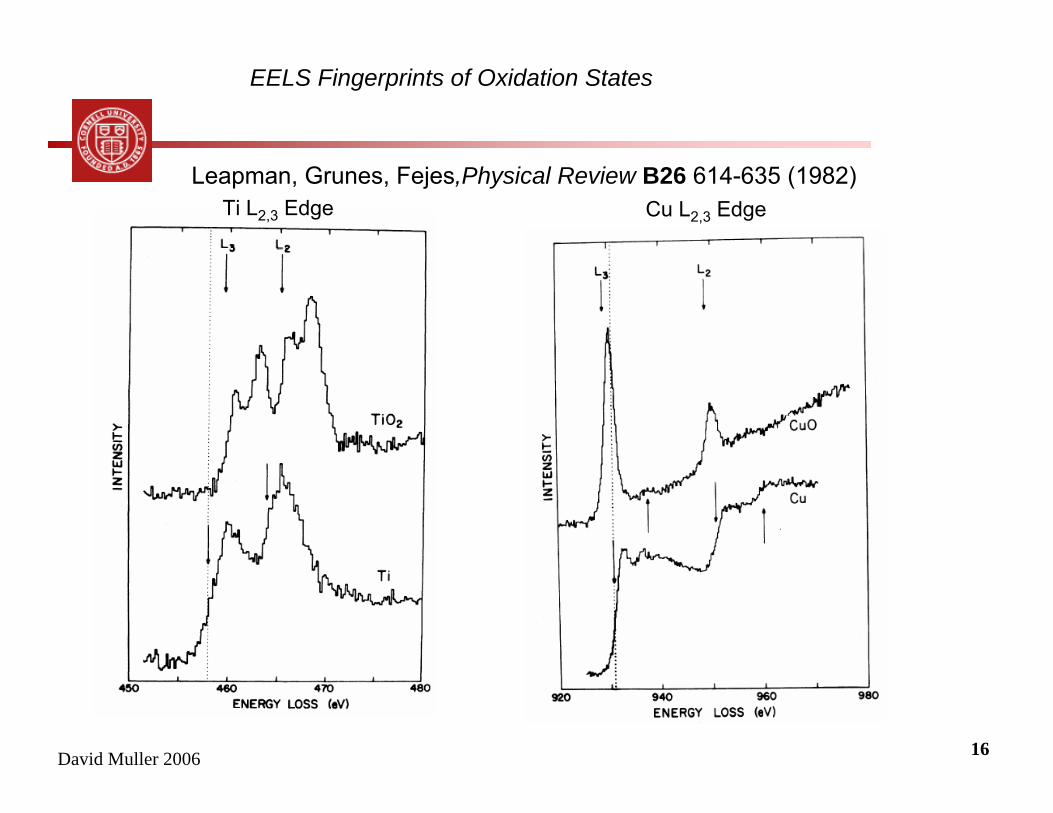
Leapman, Grunes, Fejes,Physical Review B26 614-635 (1982)Cu L2,3 EdgeTi L2,3 Edge
EELS Fingerprints of Oxidation States
David Muller 2006 17
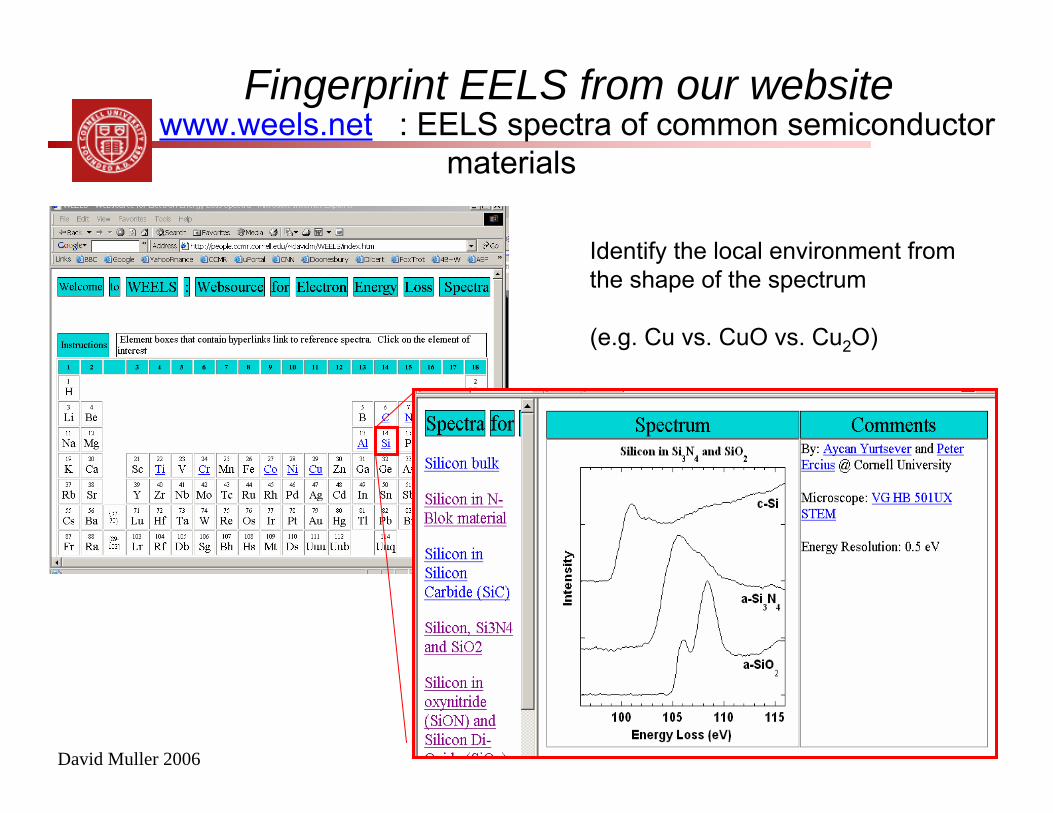
Fingerprint EELS from our websitewww.weels.net : EELS spectra of common semiconductor
materials
Identify the local environment from the shape of the spectrum
(e.g. Cu vs. CuO vs. Cu2O)
David Muller 2006 18
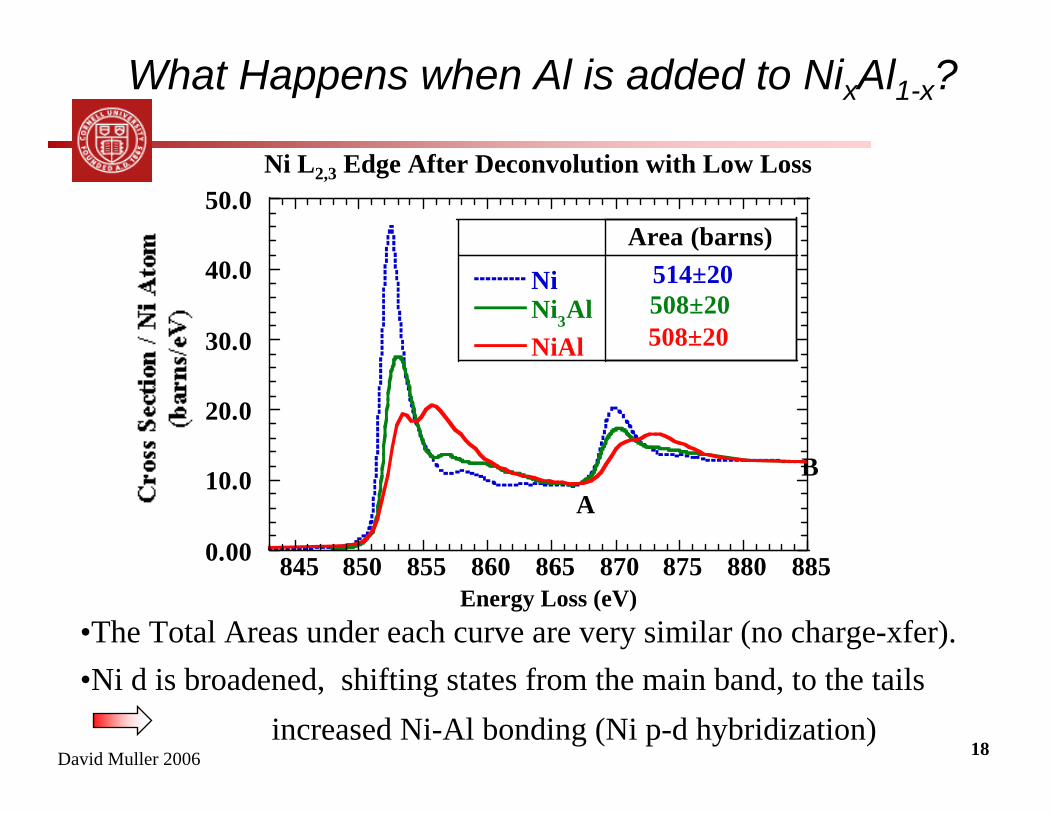
What Happens when Al is added to NixAl1-x?
BA
Energy Loss (eV)
0.00
10.0
20.0
30.0
40.0
50.0
845 850 855 860 865 870 875 880 885
NiNi3AlNiAl
514±20508±20508±20
Area (barns)
Ni L2,3 Edge After Deconvolution with Low Loss
•The Total Areas under each curve are very similar (no charge-xfer).•Ni d is broadened, shifting states from the main band, to the tails
increased Ni-Al bonding (Ni p-d hybridization)
David Muller 2006 19
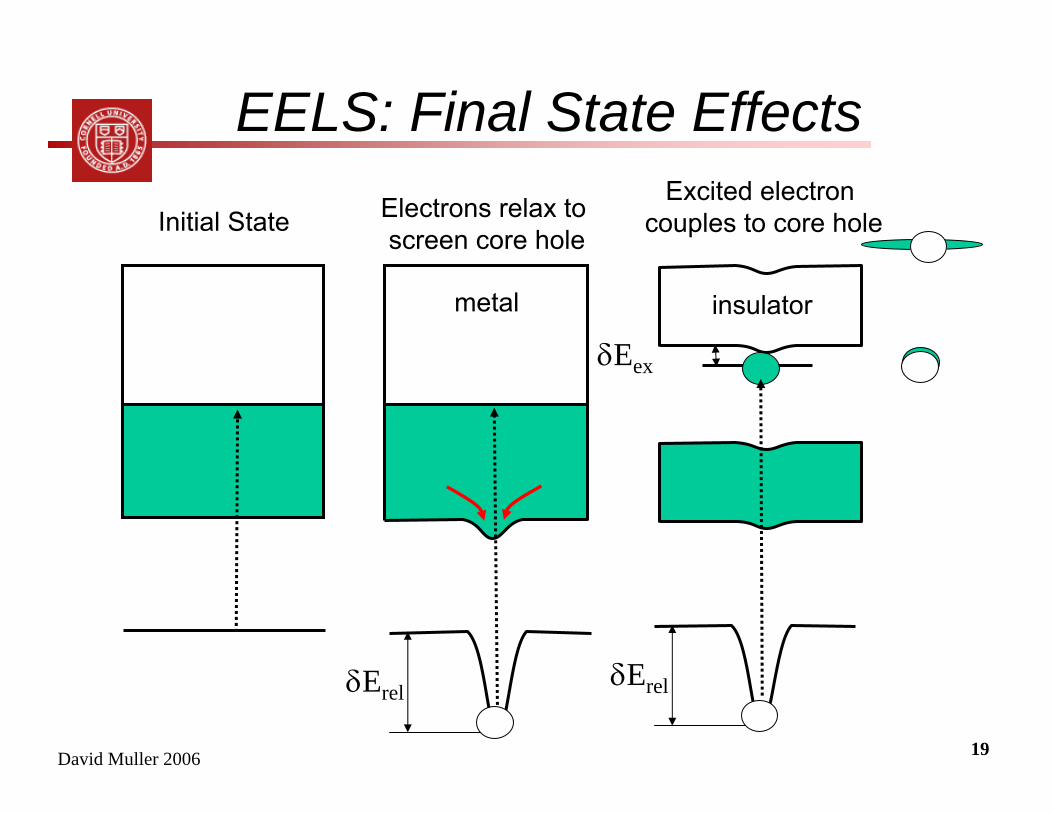
EELS: Final State Effects
metal
δErel
δEex
δErel
insulator
Initial State Electrons relax to screen core hole
Excited electron couples to core hole
David Muller 2006 20
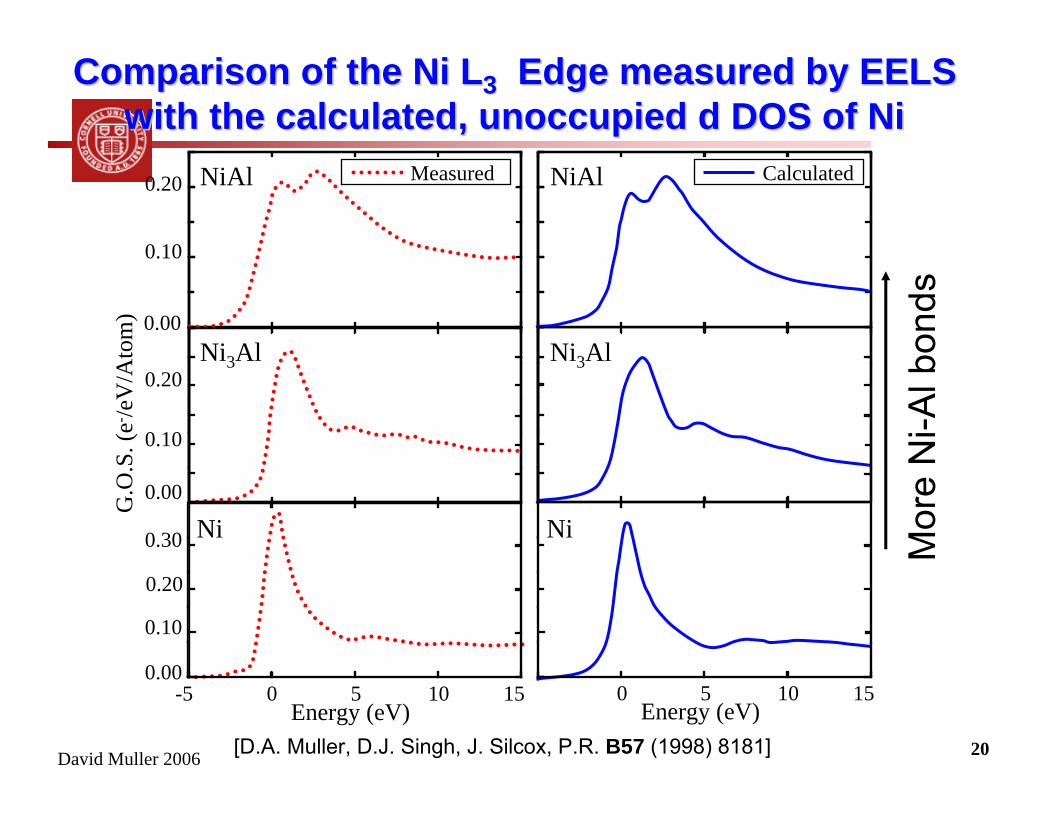
Comparison of the Ni LComparison of the Ni L33 Edge measured by EELSEdge measured by EELSwith the calculated, unoccupied d DOS of Niwith the calculated, unoccupied d DOS of Ni
[D.A. Muller, D.J. Singh, J. Silcox, P.R. B57 (1998) 8181]
Mor
e N
i-Al b
onds
NiAl
Ni3Al
Ni
Calculated
0 5 10 15Energy (eV)
NiAl
Ni3Al
Ni
Measured
0 5 10-5 15Energy (eV)
G.O
.S. (
e- /eV
/Ato
m) 0.00
0.20
0.10
0.00
0.10
0.20
0.00
0.10
0.20
0.30
David Muller 2006 21
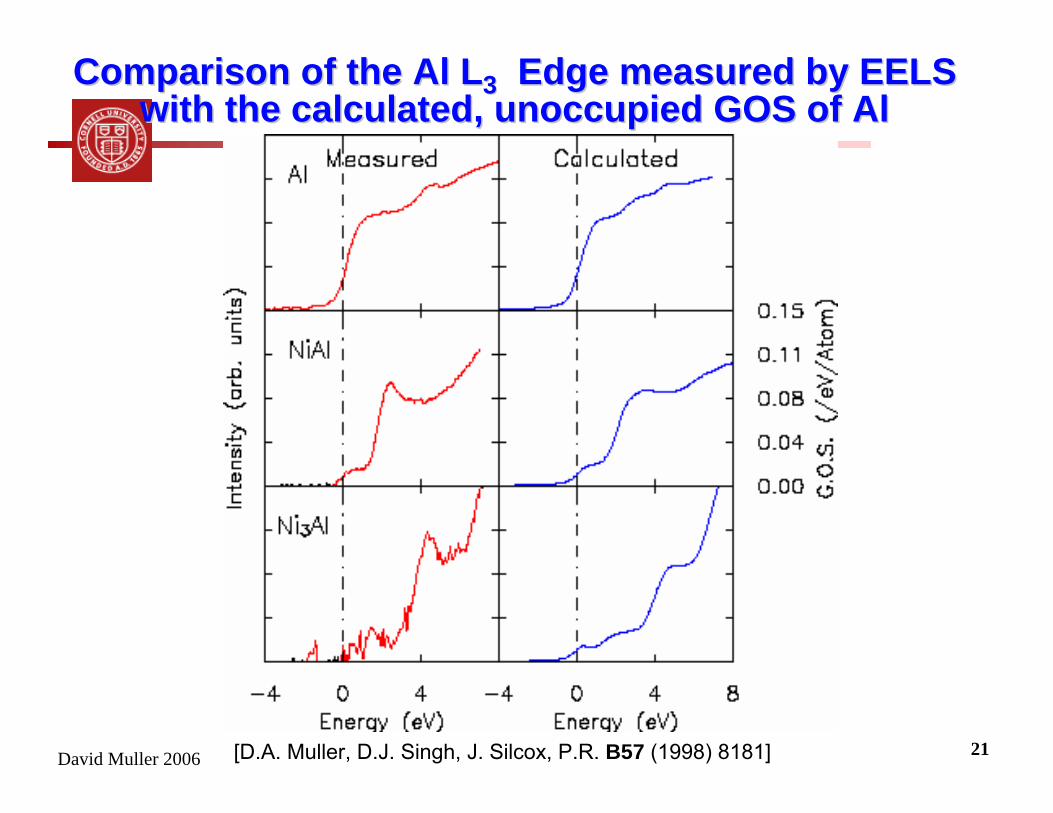
Comparison of the Al LComparison of the Al L33 Edge measured by EELSEdge measured by EELSwith the calculated, unoccupied GOS of Alwith the calculated, unoccupied GOS of Al
[D.A. Muller, D.J. Singh, J. Silcox, P.R. B57 (1998) 8181]
David Muller 2006 22
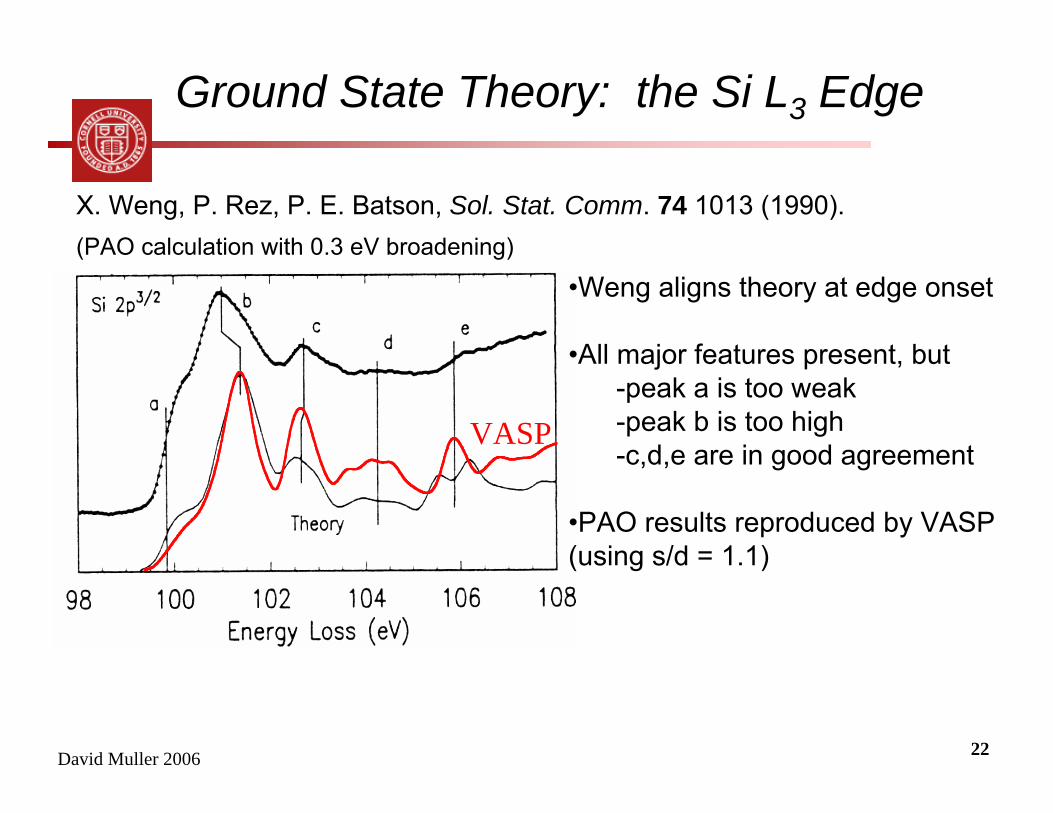
Ground State Theory: the Si L3 Edge
X. Weng, P. Rez, P. E. Batson, Sol. Stat. Comm. 74 1013 (1990).(PAO calculation with 0.3 eV broadening)
VASP
•Weng aligns theory at edge onset
•All major features present, but-peak a is too weak-peak b is too high-c,d,e are in good agreement
•PAO results reproduced by VASP (using s/d = 1.1)
David Muller 2006 23
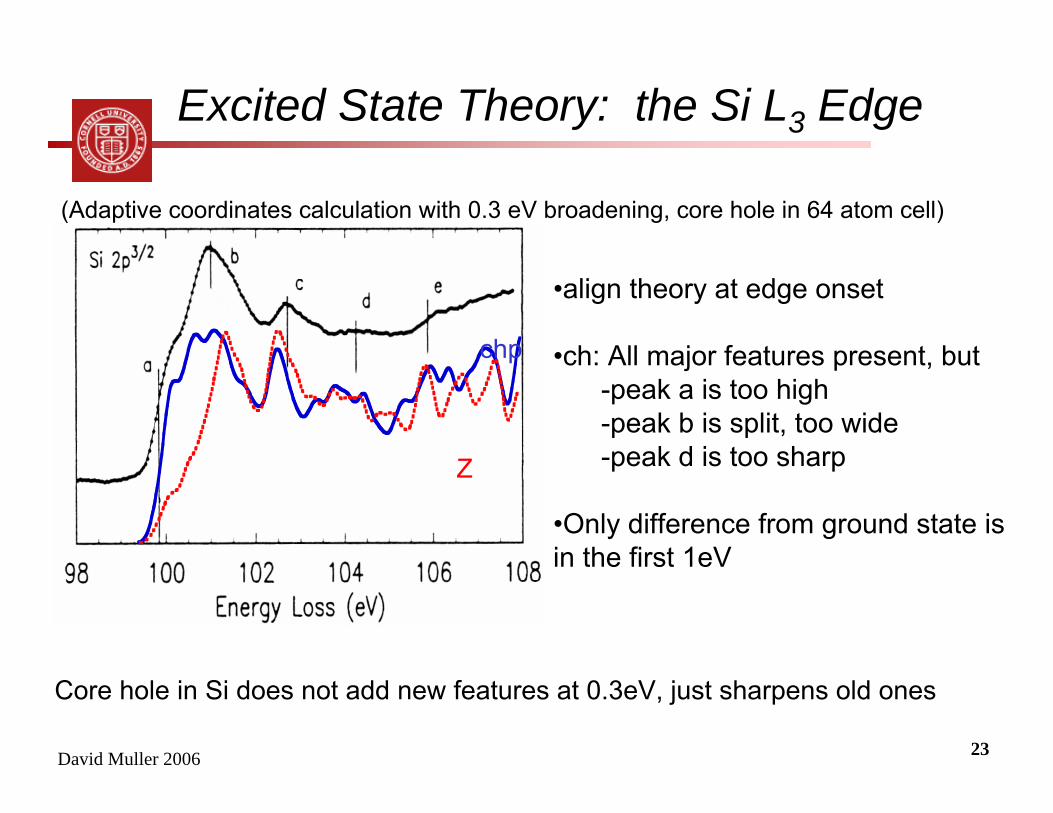
Excited State Theory: the Si L3 Edge
(Adaptive coordinates calculation with 0.3 eV broadening, core hole in 64 atom cell)
•align theory at edge onset
•ch: All major features present, but-peak a is too high-peak b is split, too wide-peak d is too sharp
•Only difference from ground state is in the first 1eV
Core hole in Si does not add new features at 0.3eV, just sharpens old ones
Z
chp
David Muller 2006 24
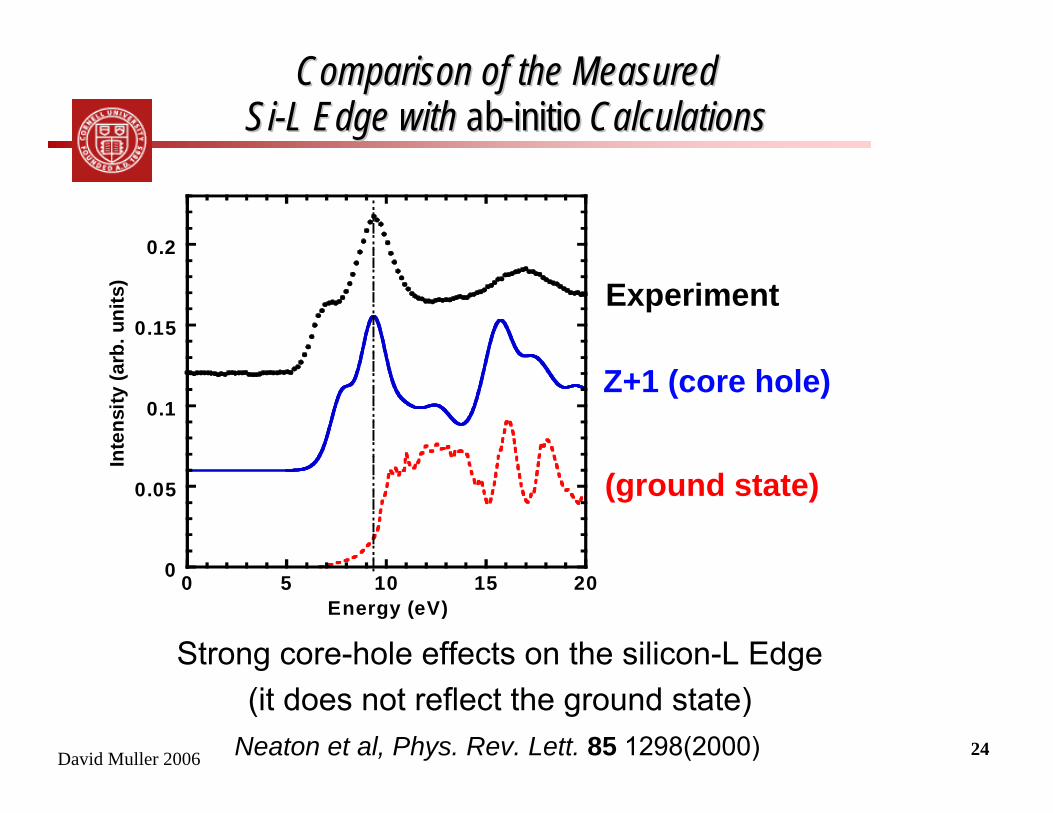
Comparison of the Measured Comparison of the Measured SiSi--L Edge with L Edge with abab--initioinitio CalculationsCalculations
Strong core-hole effects on the silicon-L Edge(it does not reflect the ground state)
0
0.05
0.1
0.15
0.2
0 5 10 15 20
Inte
nsity
(arb
. uni
ts)
Energy (eV)
Experiment
Z+1 (core hole)
(ground state)
Neaton et al, Phys. Rev. Lett. 85 1298(2000)
David Muller 2006 25
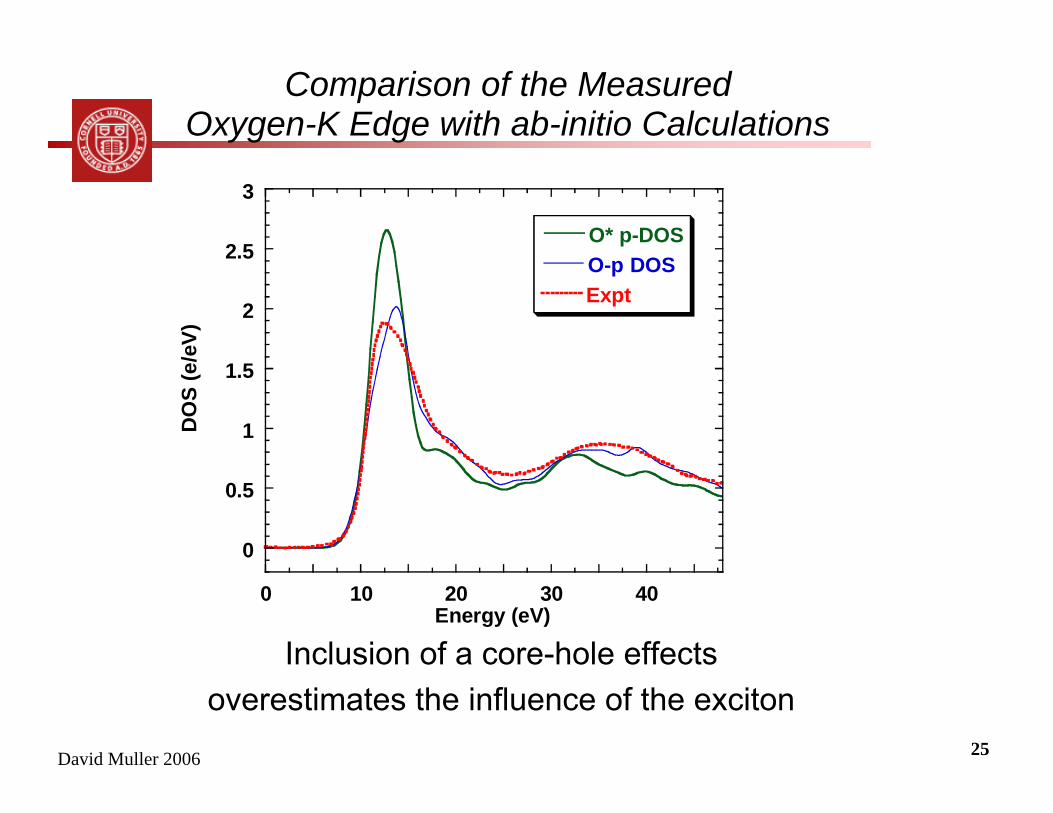
Comparison of the Measured Oxygen-K Edge with ab-initio Calculations
Inclusion of a core-hole effectsoverestimates the influence of the exciton
0
0.5
1
1.5
2
2.5
3
0 10 20 30 40
O* p-DOSO-p DOSExpt
DO
S (e
/eV)
Energy (eV)
David Muller 2006 26
When are core holes important?
• When you have good energy resolution (<1 eV)• When screening is poor
– Metals (small), semiconductors(medium), ionic (huge)– The effect is larger on anions than cations– More noticeable in nanoparticles and clusters than bulk
• Batson’s Rule: core hole effects are more pronounced when the excited electron is confined near the core hole. (It shouldn’t work, but it does.) – Atoms surrounded by strong scatterers (often nodeless valence
wavefunctions 1s, 2p, 3d…) (e.g Si in SiOx, Al in NiAl, TiB2 out of plane)

David Muller 2006 27
Limits of Density Functional Theory (DFT)
A practical matter:•The theory provides total energies for the ground state and (with constraints)
also the energies for excited states.
•One total energy per calculation (minutes → days)
•Core level binding energy Eb = Eexcited - Eground (a difference of 2 total energies)
•A full EELS spectrum needs 1 total energy per excited state ( α E3) YEARS!
Need to understand errors in DFT in order to produce effective approximations
•which errors are large, which will cancel?
•Use EELS binding energies to study systematic errors
We use approximate methods instead (1 calc. per spectrum)
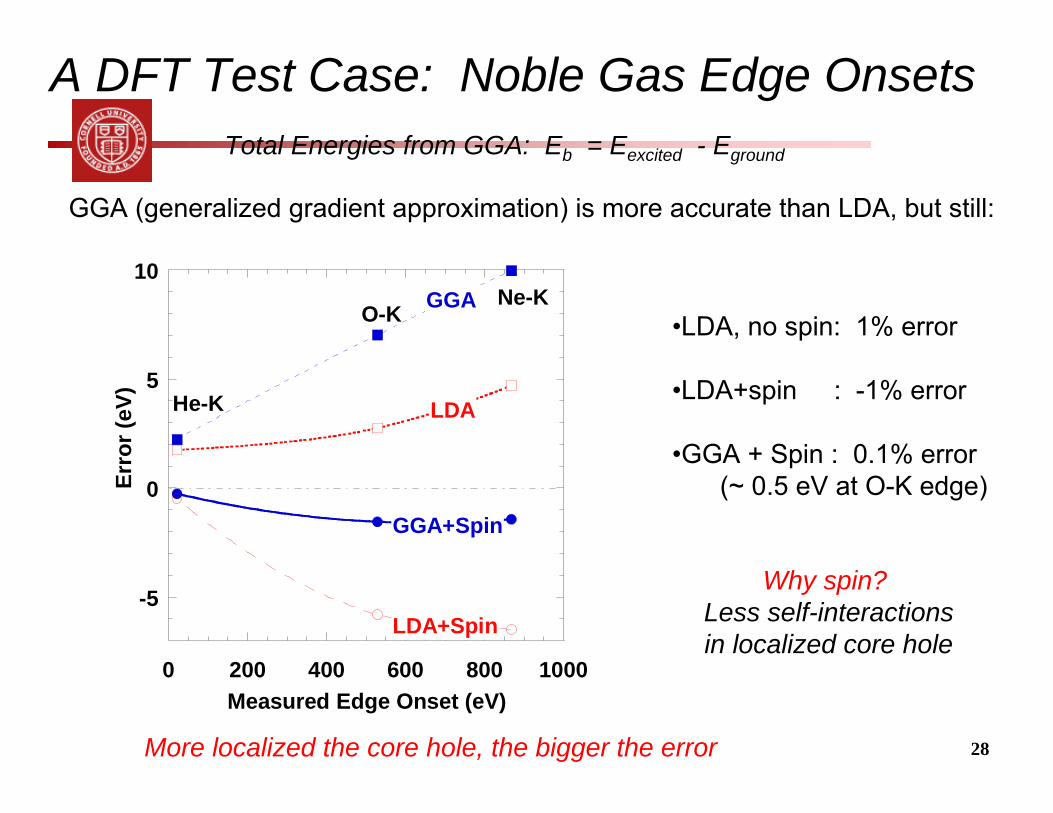
David Muller 2006 28More localized the core hole, the bigger the error
A DFT Test Case: Noble Gas Edge OnsetsTotal Energies from GGA: Eb = Eexcited - Eground
GGA (generalized gradient approximation) is more accurate than LDA, but still:
•LDA, no spin: 1% error
•LDA+spin : -1% error
•GGA + Spin : 0.1% error(~ 0.5 eV at O-K edge)
Why spin?Less self-interactionsin localized core hole
-5
0
5
10
0 200 400 600 800 1000
Erro
r (eV
)
Measured Edge Onset (eV)
He-K
Ne-K
GGA+Spin
LDA
LDA+Spin
GGAO-K
David Muller 2006 29
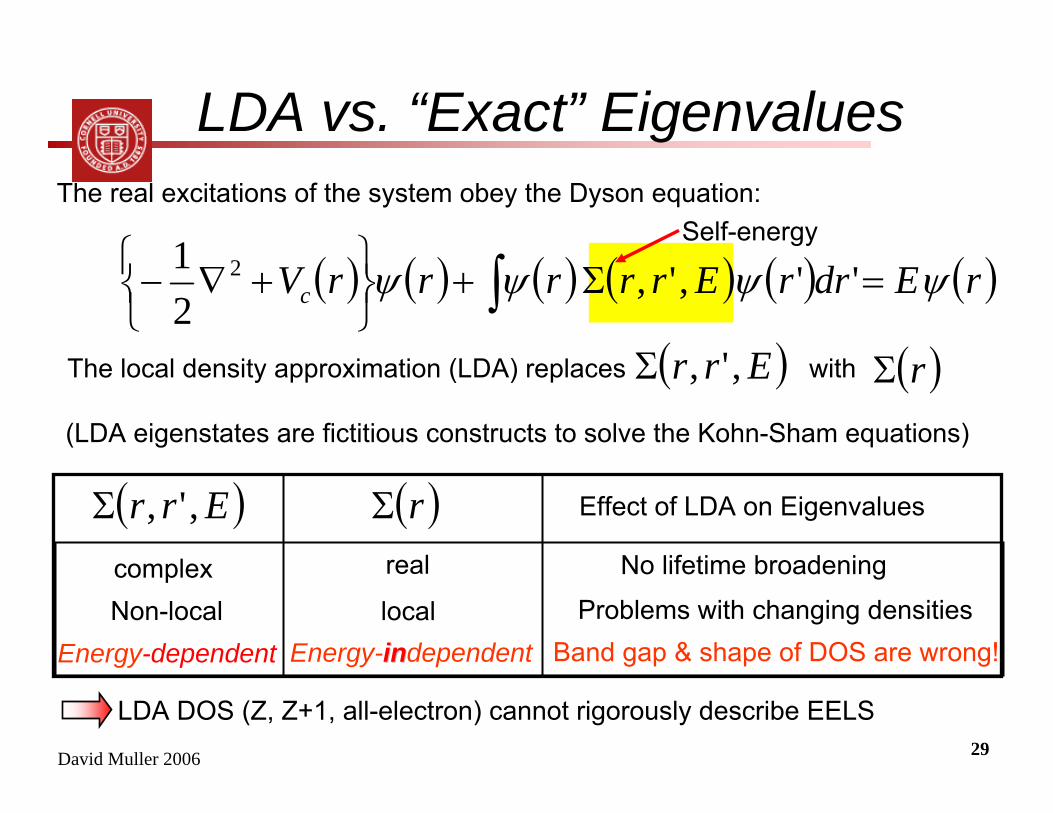
LDA vs. “Exact” EigenvaluesThe real excitations of the system obey the Dyson equation:
The local density approximation (LDA) replaces with
Self-energy
Effect of LDA on Eigenvalues
No lifetime broadening
Problems with changing densitiescomplexNon-local
Energy-dependent
real
localEnergy-inindependent Band gap & shape of DOS are wrong!
(LDA eigenstates are fictitious constructs to solve the Kohn-Sham equations)
LDA DOS (Z, Z+1, all-electron) cannot rigorously describe EELS
( ) ( ) ( ) ( ) ( ) ( )rEdrrErrrrrVc ψψψψ =Σ+⎭⎬⎫
⎩⎨⎧ +∇− ∫ '',',
21 2
( )Err ,',Σ ( )rΣ
( )Err ,',Σ ( )rΣ
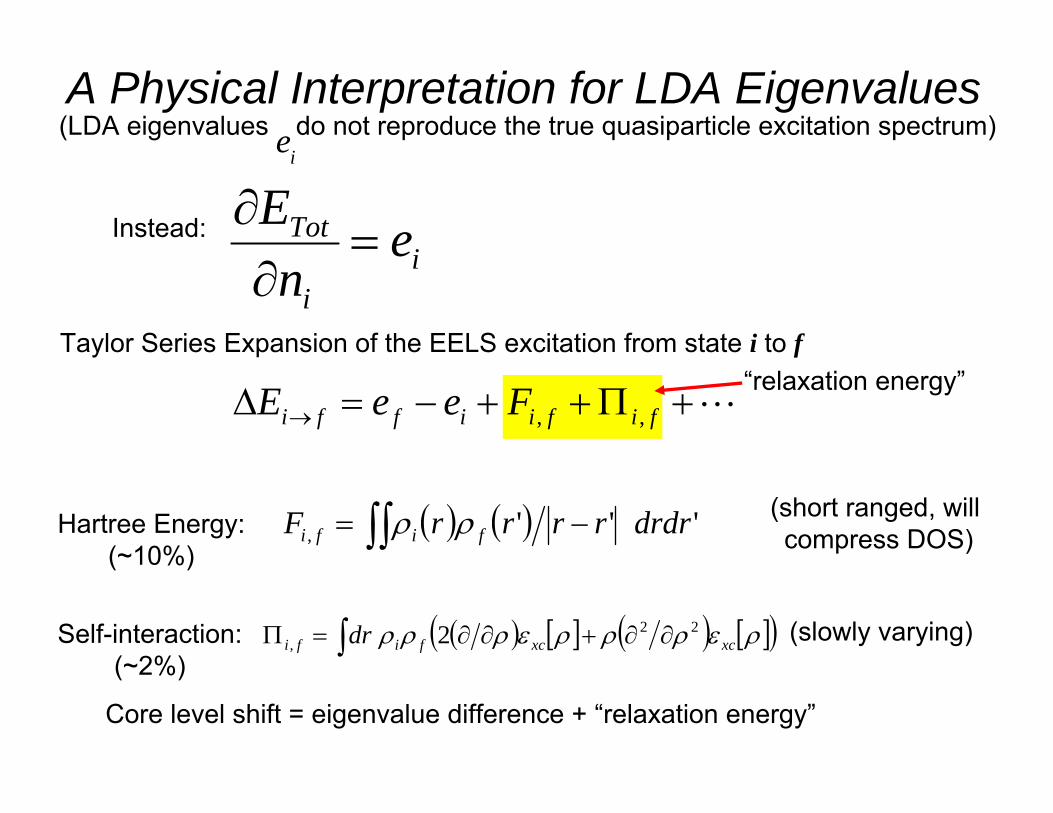
A Physical Interpretation for LDA Eigenvalues(LDA eigenvalues do not reproduce the true quasiparticle excitation spectrum)
Taylor Series Expansion of the EELS excitation from state i to f
Instead:
ie
Self-interaction:(~2%)
(slowly varying)
Hartree Energy:(~10%)
(short ranged, willcompress DOS)
Core level shift = eigenvalue difference + “relaxation energy”
“relaxation energy”
ii
Tot en
E=
∂∂
L+Π++−=∆ → fifiiffi FeeE ,,
( ) [ ] ( ) [ ]( )∫ ∂∂+∂∂=Π ρερρρερρρ xcxcfifi dr 22, 2
( ) ( ) ''', drdrrrrrF fifi ∫∫ −= ρρ
David Muller 2006 31
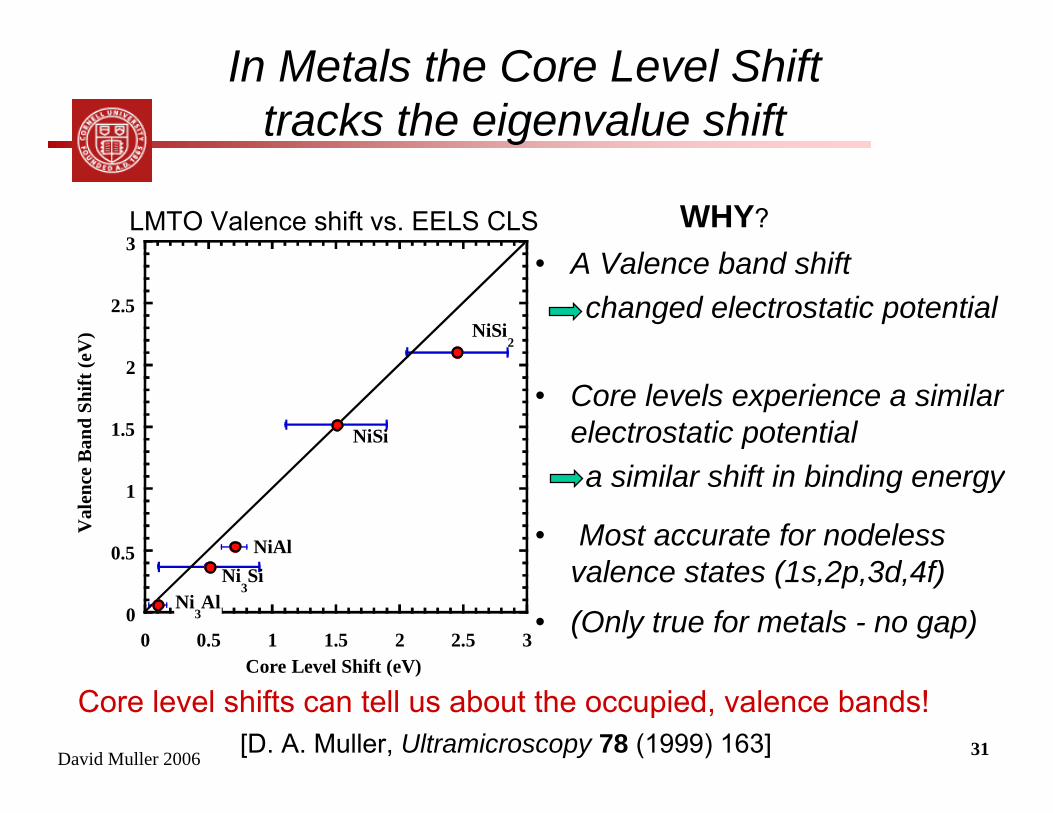
In Metals the Core Level Shift tracks the eigenvalue shift
• A Valence band shift changed electrostatic potential
• Core levels experience a similar electrostatic potentiala similar shift in binding energy
• Most accurate for nodelessvalence states (1s,2p,3d,4f)
• (Only true for metals - no gap)0
0.5
1
1.5
2
2.5
3
0 0.5 1 1.5 2 2.5 3
Val
ence
Ban
d Sh
ift (e
V)
Core Level Shift (eV)
NiSi2
NiAlNi
3Si
Ni3Al
NiSi
Core level shifts can tell us about the occupied, valence bands!
WHY?LMTO Valence shift vs. EELS CLS
[D. A. Muller, Ultramicroscopy 78 (1999) 163]
David Muller 2006 32
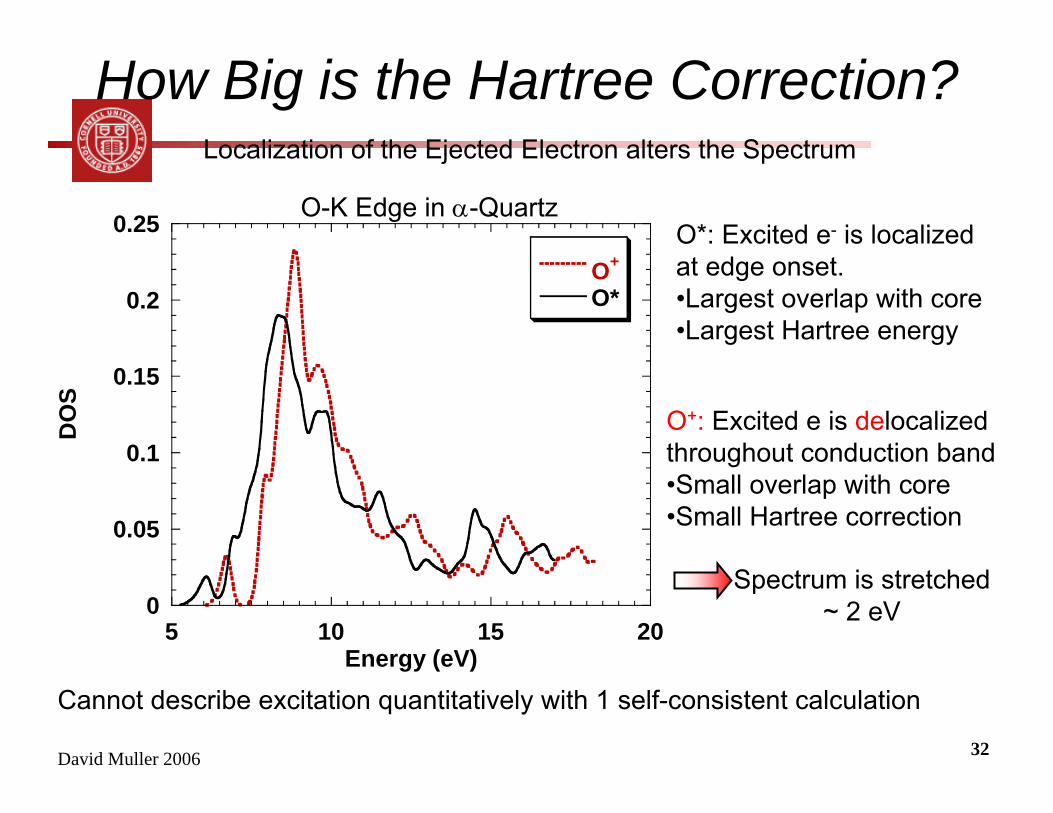
How Big is the Hartree Correction?Localization of the Ejected Electron alters the Spectrum
0
0.05
0.1
0.15
0.2
0.25
5 10 15 20
O+
O*
DO
S
Energy (eV)
O+: Excited e is delocalizedthroughout conduction band•Small overlap with core•Small Hartree correction
O*: Excited e- is localizedat edge onset.•Largest overlap with core•Largest Hartree energy
Cannot describe excitation quantitatively with 1 self-consistent calculation
Spectrum is stretched~ 2 eV
O-K Edge in α-Quartz
David Muller 2006 33
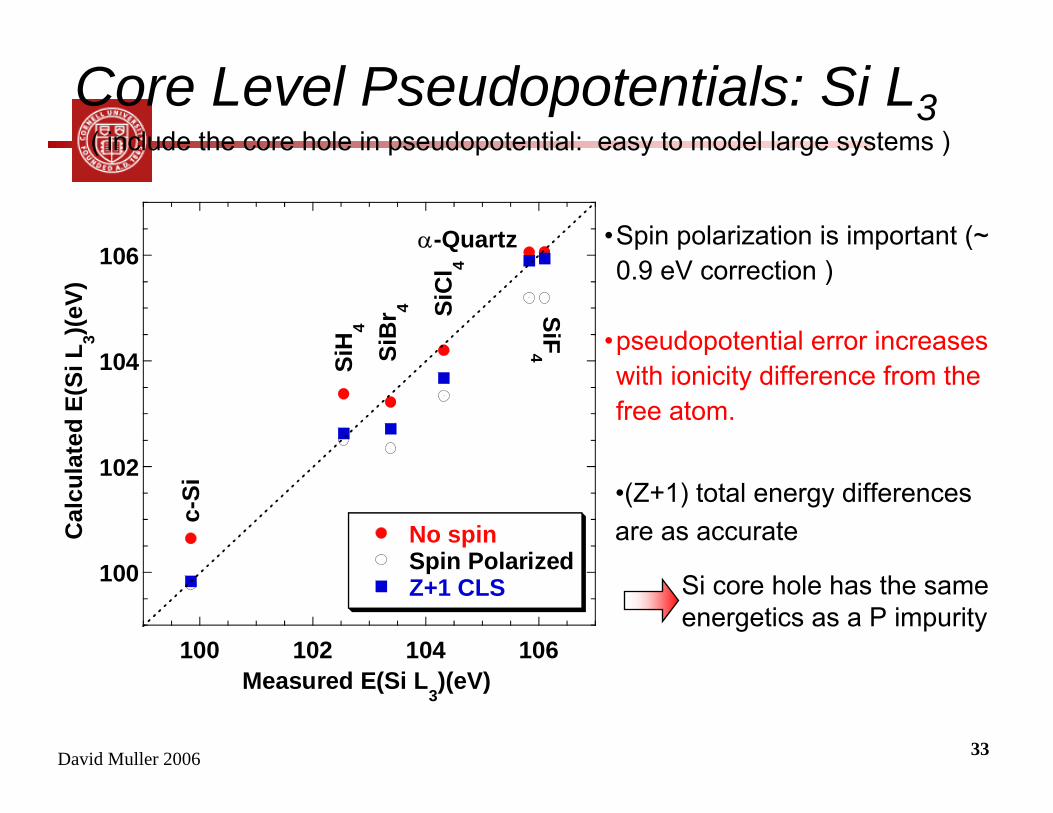
Core Level Pseudopotentials: Si L3
•Spin polarization is important (~ 0.9 eV correction )
•pseudopotential error increases with ionicity difference from the free atom.
( include the core hole in pseudopotential: easy to model large systems )
•(Z+1) total energy differences are as accurate
100
102
104
106
100 102 104 106
No spinSpin PolarizedZ+1 CLS
Cal
cula
ted
E(Si
L3)(e
V)
Measured E(Si L3)(eV)
c-Si
SiH
4
SiB
r 4 SiC
l 4
SiF4
α-Quartz
Si core hole has the same energetics as a P impurity
David Muller 2006 34
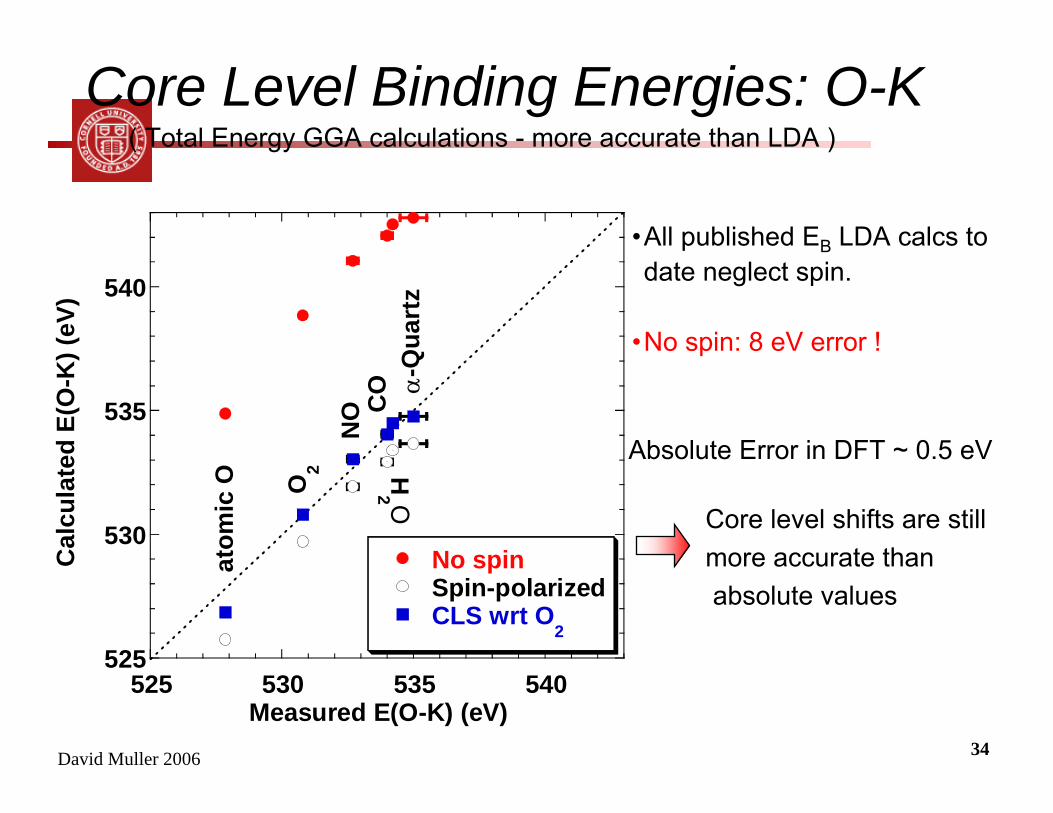
Core Level Binding Energies: O-K
•All published EB LDA calcs to date neglect spin.
•No spin: 8 eV error !
525
530
535
540
525 530 535 540
No spinSpin-polarizedCLS wrt O
2
Cal
cula
ted
E(O
-K) (
eV)
Measured E(O-K) (eV)
atom
ic O H
2 OO2
NO C
O α-Q
uart
z
( Total Energy GGA calculations - more accurate than LDA )
Absolute Error in DFT ~ 0.5 eV
Core level shifts are stillmore accurate thanabsolute values
David Muller 2006 35
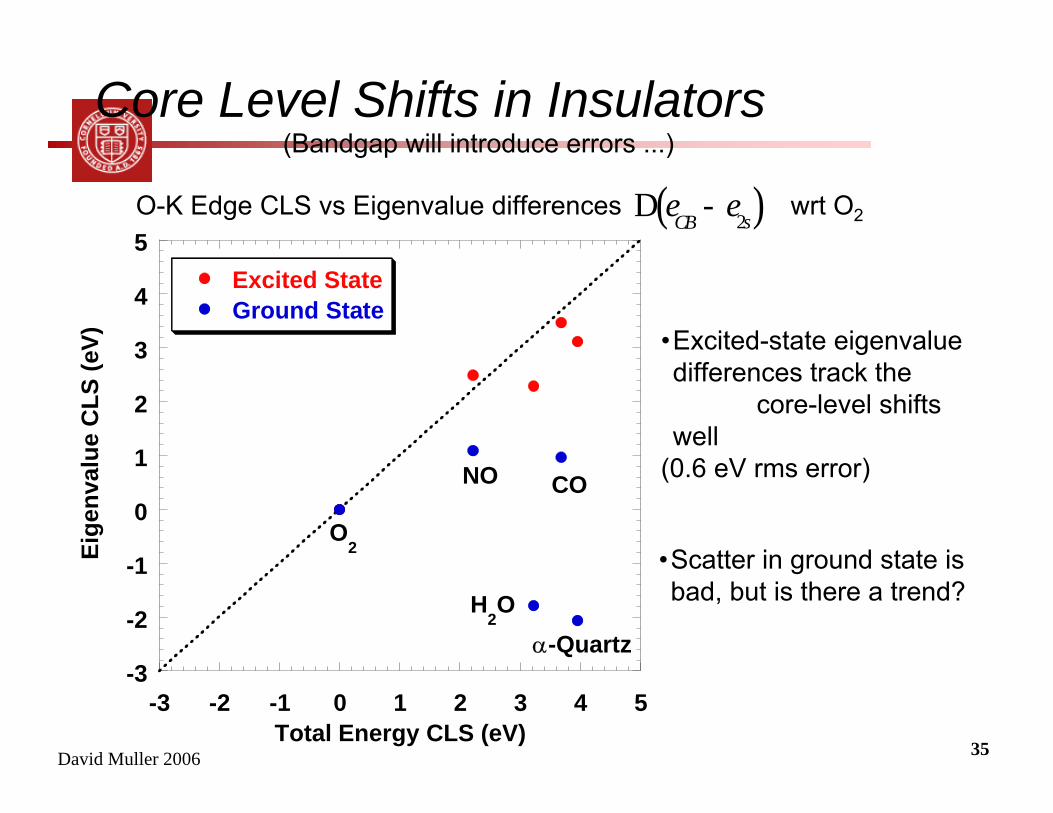
Core Level Shifts in Insulators
•Excited-state eigenvaluedifferences track the
core-level shifts well
(0.6 eV rms error)
-3
-2
-1
0
1
2
3
4
5
-3 -2 -1 0 1 2 3 4 5
Excited StateGround State
Eige
nval
ue C
LS (e
V)
Total Energy CLS (eV)
H2O
α-Quartz
CONO
O2 •Scatter in ground state is
bad, but is there a trend?
(Bandgap will introduce errors ...)
O-K Edge CLS vs Eigenvalue differences wrt O2( )2sCBe eD -
David Muller 2006 36
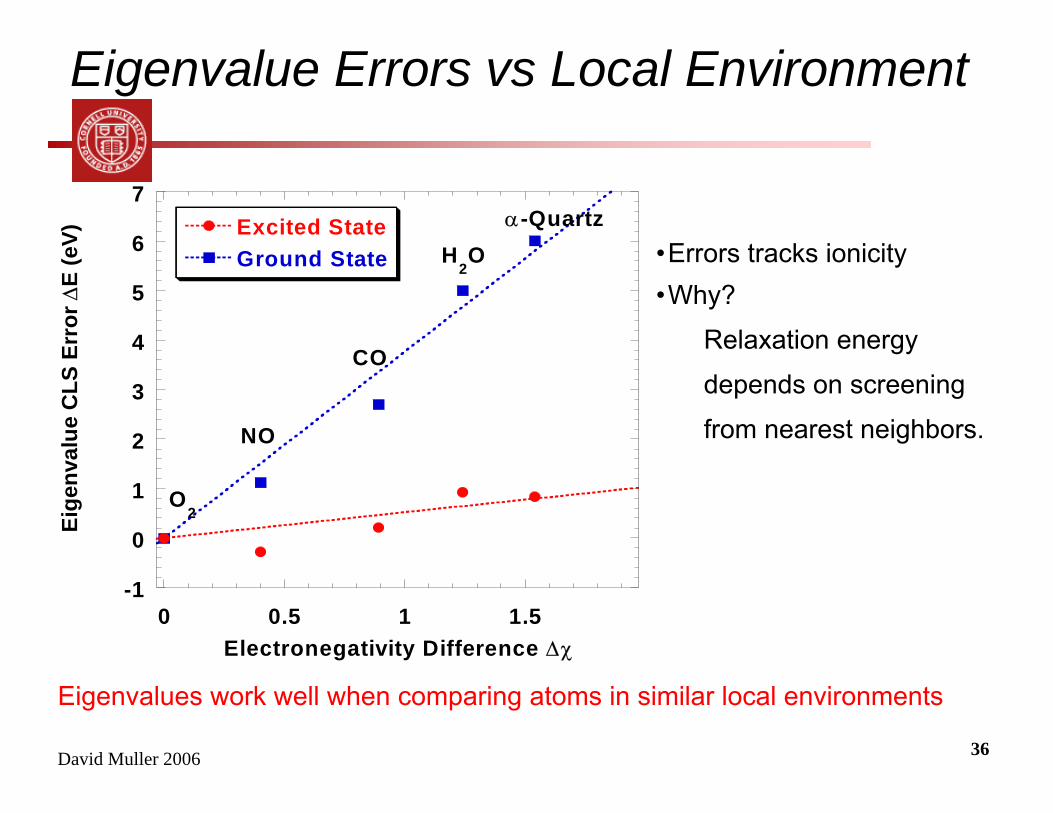
Eigenvalue Errors vs Local Environment
•Errors tracks ionicity•Why?
Relaxation energy
depends on screening
from nearest neighbors.
-1
0
1
2
3
4
5
6
7
0 0.5 1 1.5
Ground StateExcited State
Eige
nval
ue C
LS E
rror
∆E
(eV)
Electronegativity Difference ∆χ
H2O
α-Quartz
CO
NO
O2
Eigenvalues work well when comparing atoms in similar local environments
David Muller 2006 37
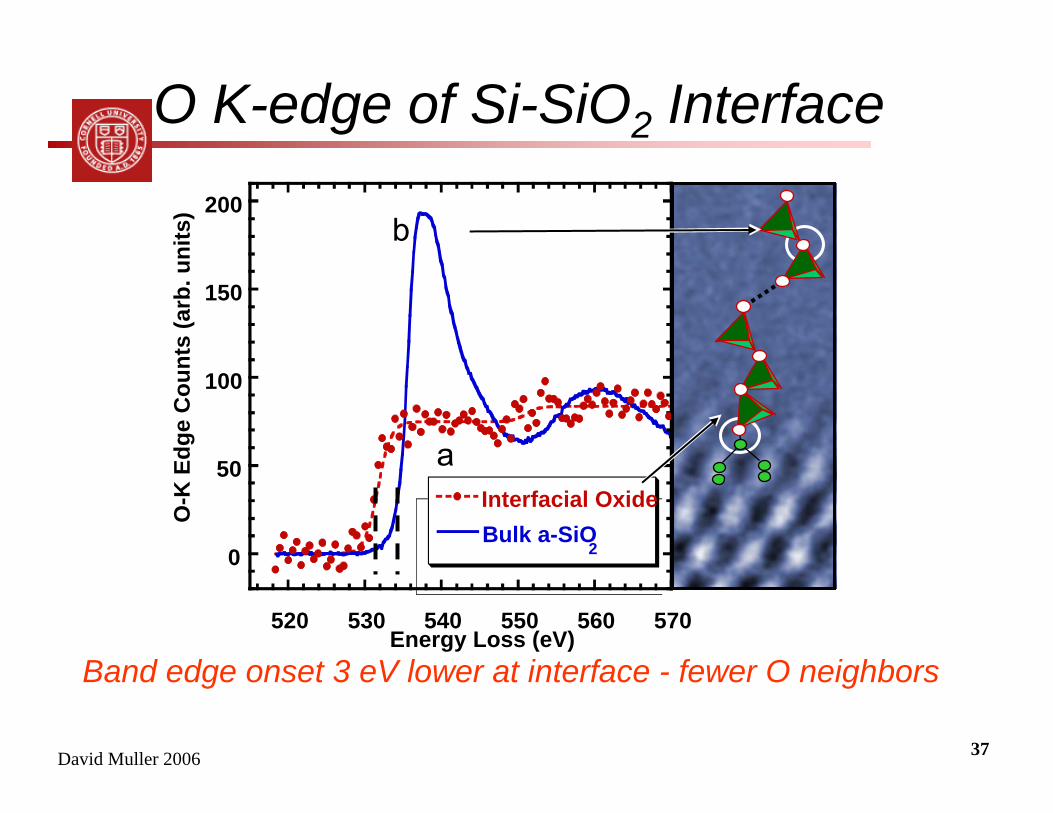
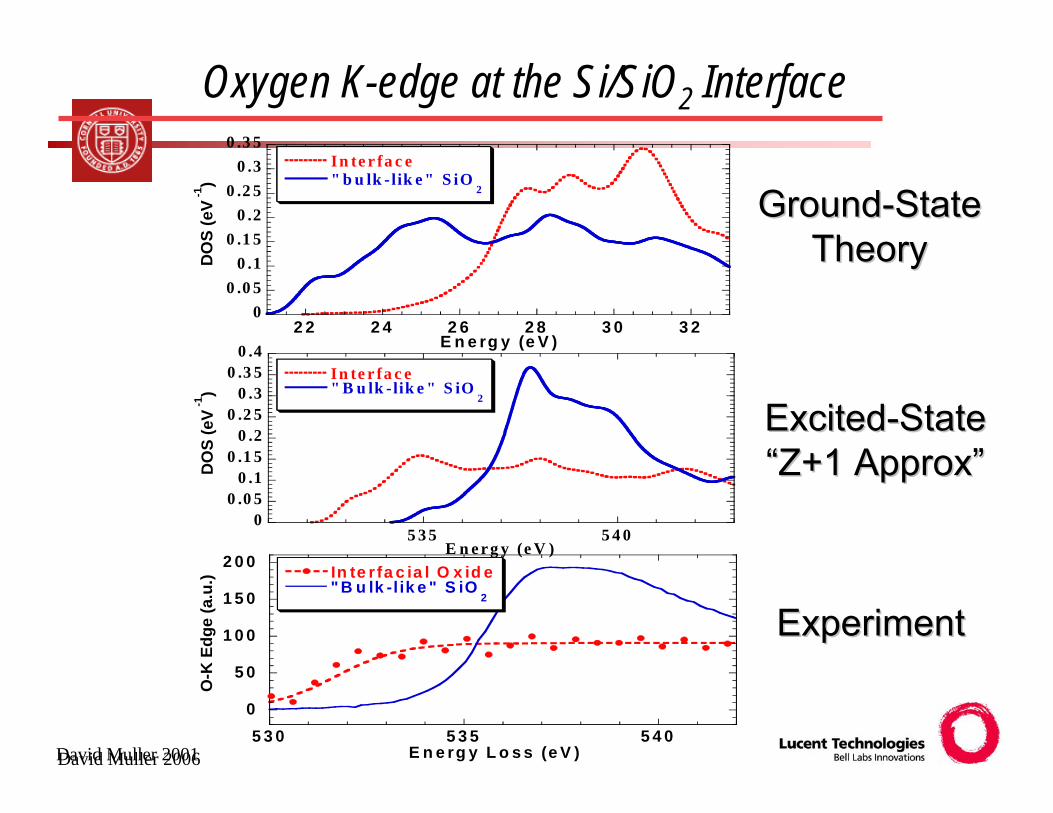
Band edge onset 3 eV lower at interface - fewer O neighbors
O K-edge of Si-SiO2 Interface
a
b
0
50
100
150
200
520 530 540 550 560 570
Interfacial OxideBulk a-SiO
2
O-K
Edg
e C
ount
s (a
rb. u
nits
)
Energy Loss (eV)
David Muller 2006 38David Muller 2001
Oxygen K-edge at the Si/SiO2 Interface
GroundGround--StateStateTheoryTheory
ExperimentExperiment
0
5 0
1 0 0
1 5 0
2 0 0
5 3 0 5 3 5 5 4 0
In te r fa c ia l O x id e" B u lk -l ik e " S iO
2
O-K
Edg
e (a
.u.)
E n e rg y L o s s (e V )
00 .0 5
0 .10 .1 5
0 .20 .2 5
0 .30 .3 5
0 .4
5 3 5 5 4 0
In te r fa c e" B u lk -lik e " S iO
2
DO
S (e
V -1)
E n e r g y (e V )
00 .0 5
0 .10 .1 5
0 .20 .2 5
0 .30 .3 5
2 2 2 4 2 6 2 8 3 0 3 2
In te r fa c e" b u lk - lik e " S iO
2
DO
S (e
V -1)
E n e rg y (e V )
ExcitedExcited--StateState“Z+1 Approx”“Z+1 Approx”
David Muller 2006 39
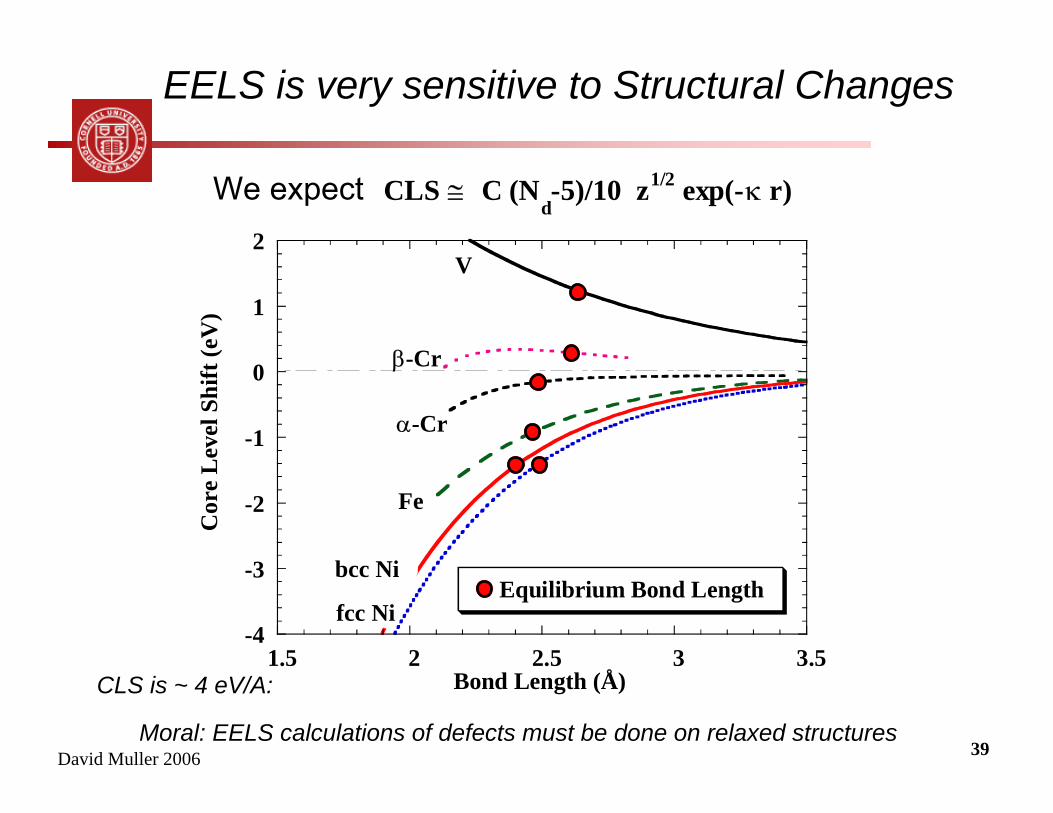
EELS is very sensitive to Structural Changes
CLS ≅ C (Nd-5)/10 z1/2 exp(-κ r)
-4
-3
-2
-1
0
1
2
1.5 2 2.5 3 3.5
Cor
e L
evel
Shi
ft (e
V)
Bond Length (Å)
V
β-Cr
α-Cr
fcc Ni
bcc Ni
Fe
Equilibrium Bond Length
We expect
CLS is ~ 4 eV/A:
Moral: EELS calculations of defects must be done on relaxed structures
David Muller 2006 40
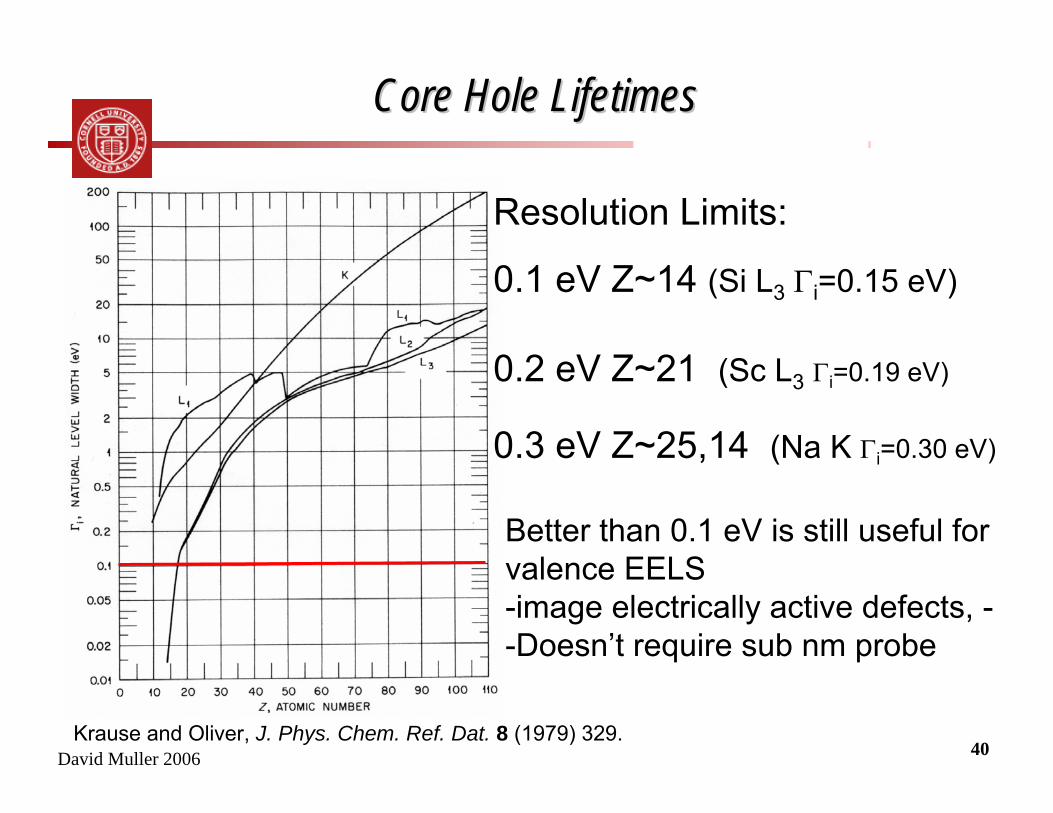
Core Hole LifetimesCore Hole Lifetimes
Resolution Limits:
0.1 eV Z~14 (Si L3 Γi=0.15 eV)
0.2 eV Z~21 (Sc L3 Γi=0.19 eV)
0.3 eV Z~25,14 (Na K Γi=0.30 eV)
Better than 0.1 eV is still useful for valence EELS-image electrically active defects, --Doesn’t require sub nm probe
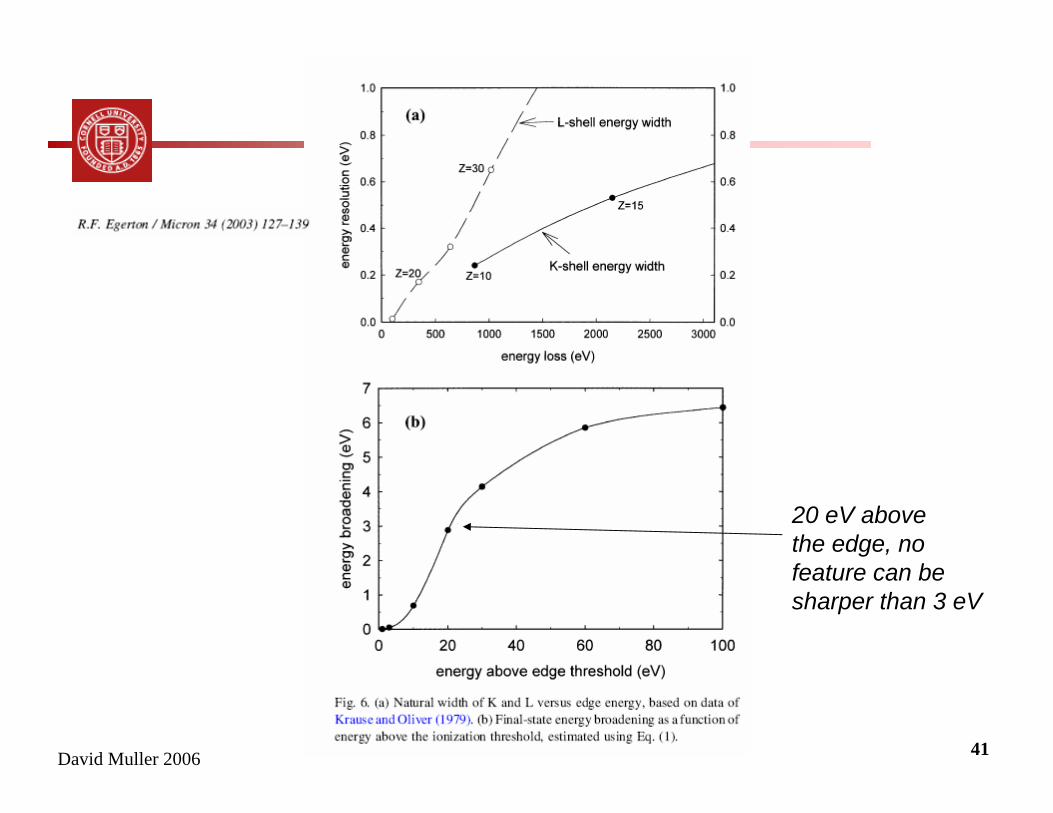
Krause and Oliver, J. Phys. Chem. Ref. Dat. 8 (1979) 329.
David Muller 2006 41
20 eV abovethe edge, no feature can be sharper than 3 eV
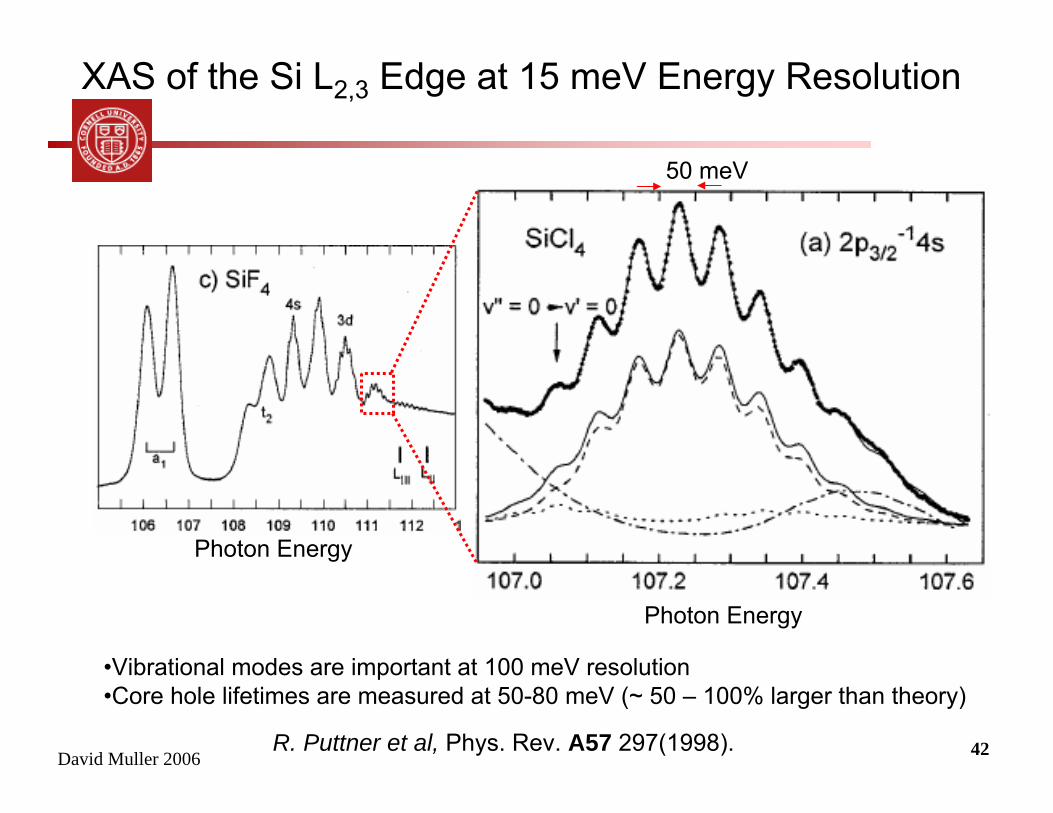
David Muller 2006 42
Photon Energy
Photon Energy
50 meV
XAS of the Si L2,3 Edge at 15 meV Energy Resolution
R. Puttner et al, Phys. Rev. A57 297(1998).
•Vibrational modes are important at 100 meV resolution•Core hole lifetimes are measured at 50-80 meV (~ 50 – 100% larger than theory)
David Muller 2006 43
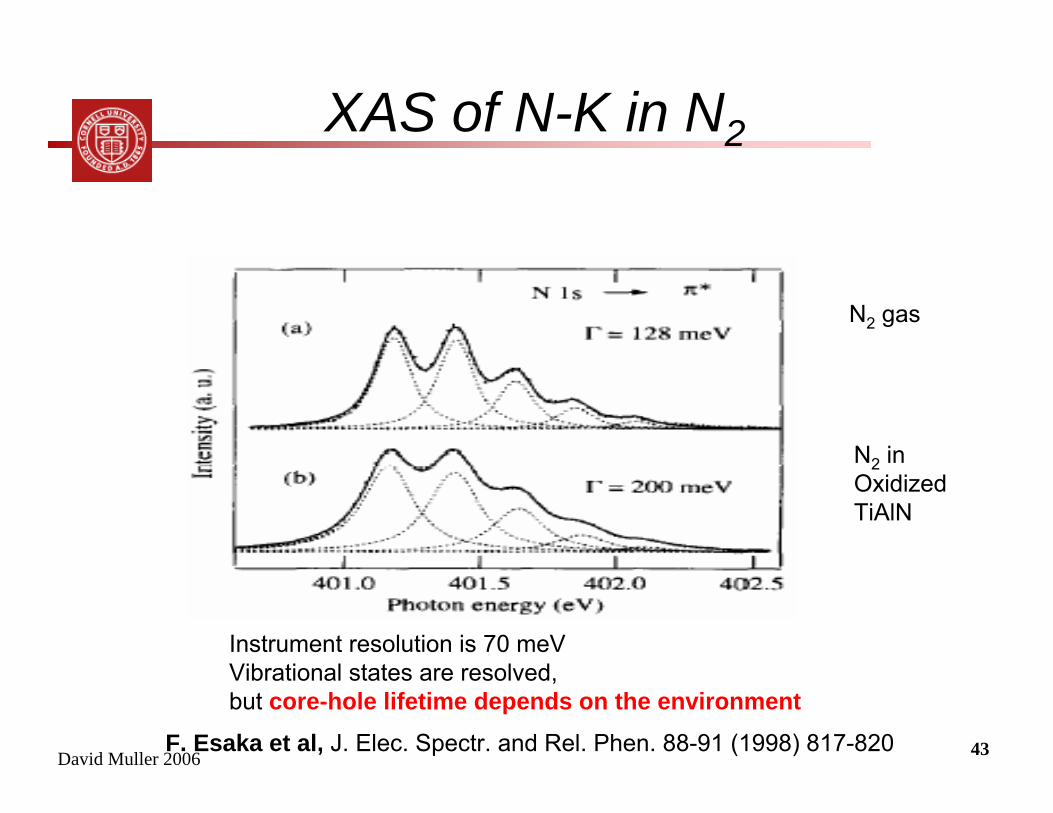
XAS of N-K in N2
F. Esaka et al, J. Elec. Spectr. and Rel. Phen. 88-91 (1998) 817-820
Instrument resolution is 70 meVVibrational states are resolved, but core-hole lifetime depends on the environment
N2 gas
N2 in Oxidized TiAlN
David Muller 2006 44
Inte
nsity
(arb
. uni
ts)
450 455 460 465 470 475Energy (eV)
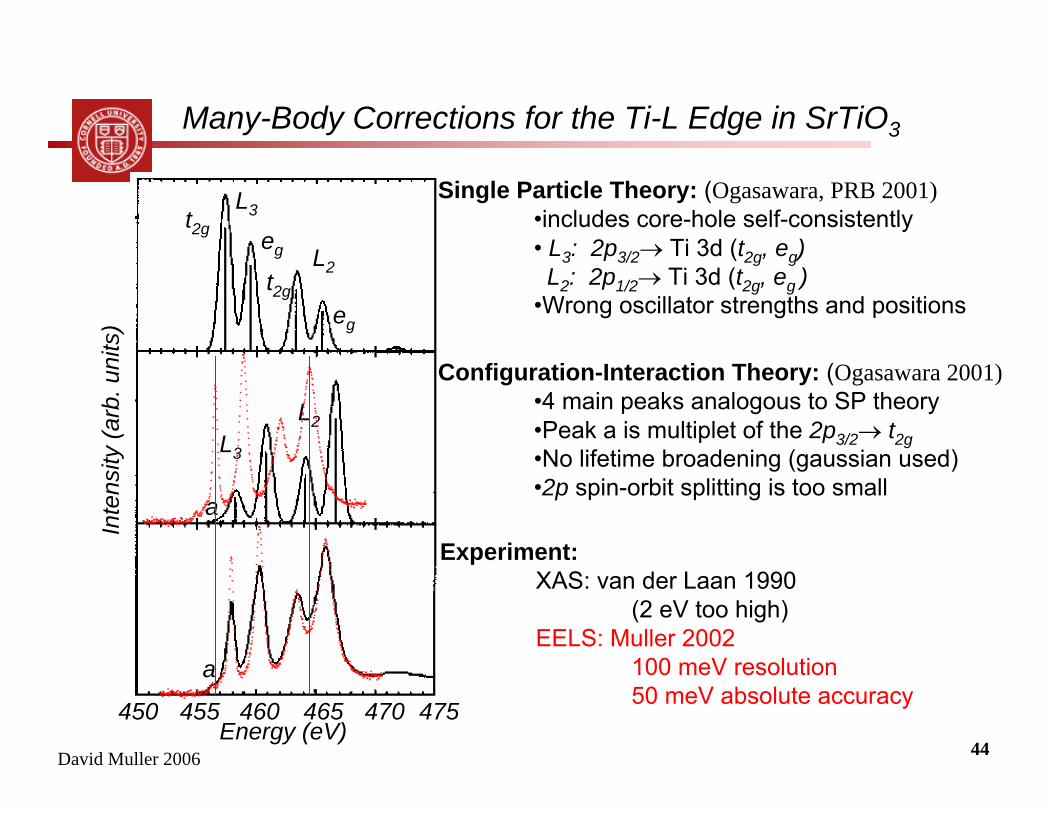
Many-Body Corrections for the Ti-L Edge in SrTiO3
Single Particle Theory: (Ogasawara, PRB 2001)•includes core-hole self-consistently• L3: 2p3/2→ Ti 3d (t2g, eg)L2: 2p1/2→ Ti 3d (t2g, eg )
•Wrong oscillator strengths and positions
Configuration-Interaction Theory: (Ogasawara 2001)•4 main peaks analogous to SP theory•Peak a is multiplet of the 2p3/2→ t2g •No lifetime broadening (gaussian used)•2p spin-orbit splitting is too small
Experiment:XAS: van der Laan 1990
(2 eV too high)EELS: Muller 2002
100 meV resolution50 meV absolute accuracy
L3
L2
t2g eg
t2g
eg
L3
L2
a
a
David Muller 2006 45
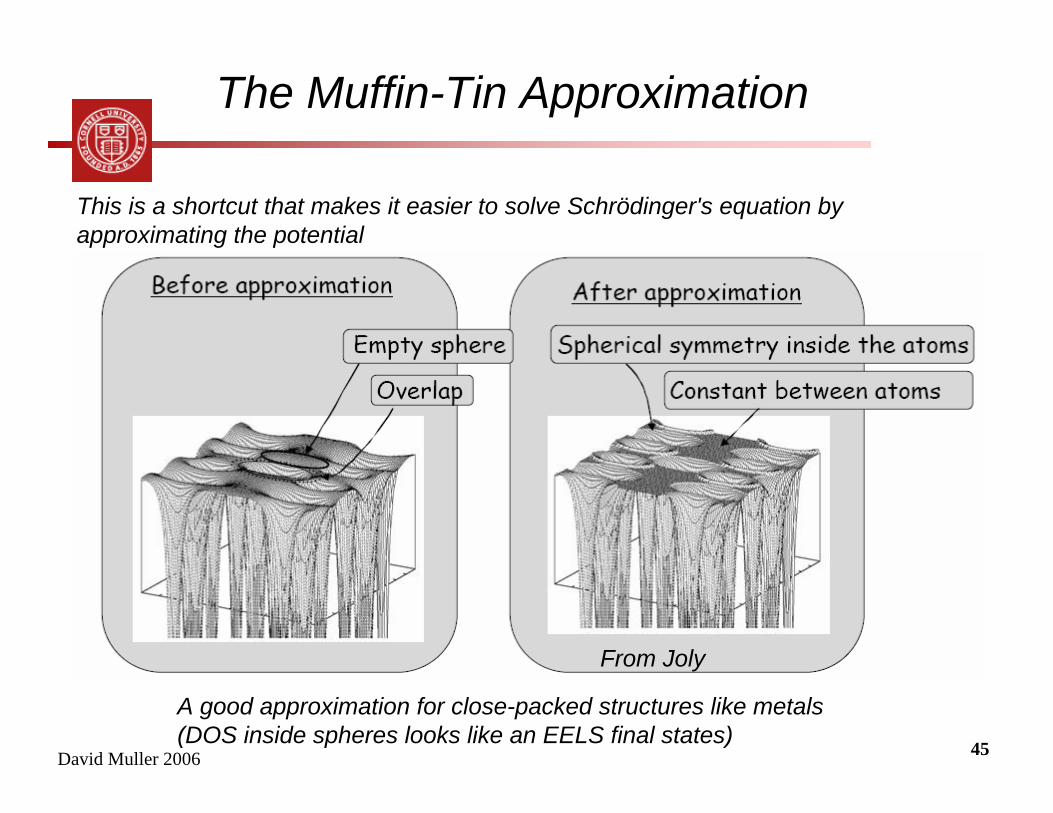
The Muffin-Tin Approximation
This is a shortcut that makes it easier to solve Schrödinger's equation by approximating the potential
A good approximation for close-packed structures like metals(DOS inside spheres looks like an EELS final states)
From Joly
David Muller 2006 46
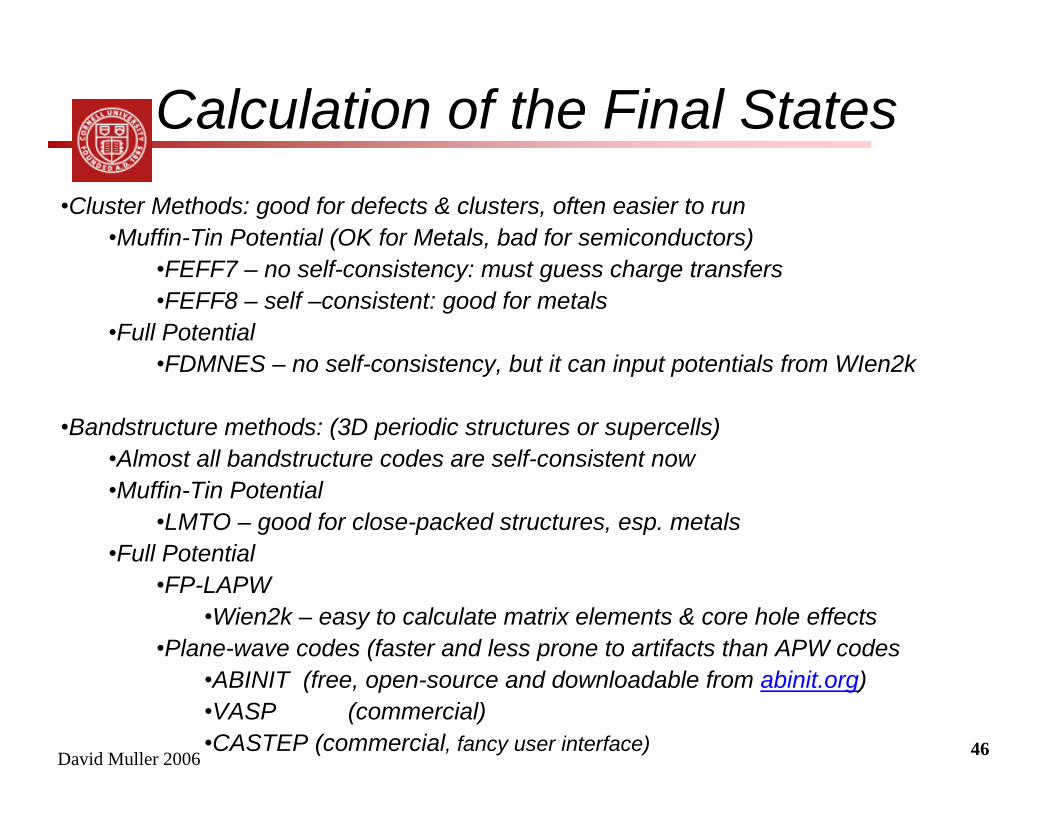
Calculation of the Final States•Cluster Methods: good for defects & clusters, often easier to run
•Muffin-Tin Potential (OK for Metals, bad for semiconductors)•FEFF7 – no self-consistency: must guess charge transfers•FEFF8 – self –consistent: good for metals
•Full Potential•FDMNES – no self-consistency, but it can input potentials from WIen2k
•Bandstructure methods: (3D periodic structures or supercells)•Almost all bandstructure codes are self-consistent now•Muffin-Tin Potential
•LMTO – good for close-packed structures, esp. metals•Full Potential
•FP-LAPW •Wien2k – easy to calculate matrix elements & core hole effects
•Plane-wave codes (faster and less prone to artifacts than APW codes•ABINIT (free, open-source and downloadable from abinit.org)•VASP (commercial)•CASTEP (commercial, fancy user interface)
David Muller 2006 47
Many-Body Calculations
•GW : Correct bandgap, but only a few atoms/supercell
•Configuration-Interaction (CI): very accurate for 1-6 atoms-good for transition metal oxide clusters
•Multiplet: (de Groot, van der Laan) single-atom in a crystal field – good for transition metal oxide crystals. - like CI, except it has adjustable parameters
Strongly-correlated systems, and materials with large core-hole effectscannot be calculated using DFT codes. The options are limited
David Muller 2006 48
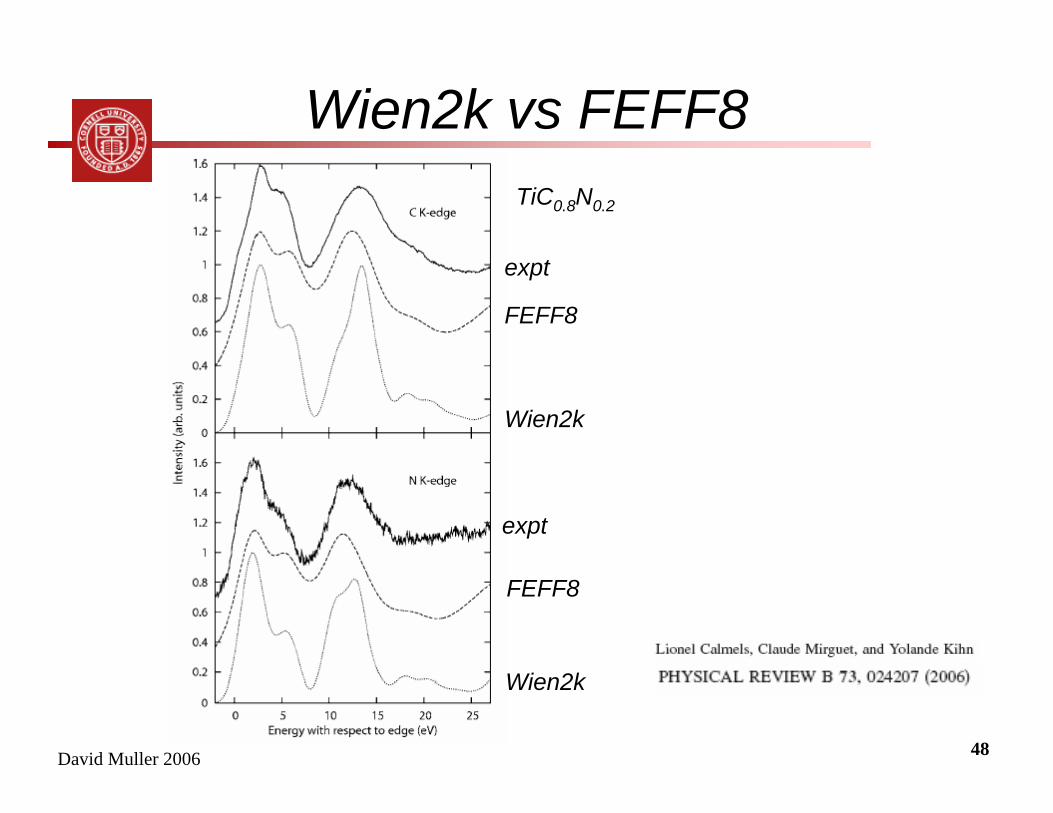
Wien2k vs FEFF8TiC0.8N0.2
expt
expt
Wien2k
Wien2k
FEFF8
FEFF8