internet, censorship, and corruption - g. u
TRANSCRIPT

INTERNET, CENSORSHIP, AND CORRUPTION
The impact of online censorship on the internet’s potential to reduce corruption
NICHOLAS SORAK
WORKING PAPER SERIES 2016:17 QOG THE QUALITY OF GOVERNMENT INSTITUTE
Department of Political Science University of Gothenburg Box 711, SE 405 30 GÖTEBORG December 2016 ISSN 1653-8919 © 2016 by Nicholas Sorak. All rights reserved.

2
Internet, Censorship, and Corruption. The impact of online censorship on the internet’s potential to reduce corruption Nicholas Sorak QoG Working Paper Series 2016:17 December 2016 ISSN 1653-8919
ABSTRACT
Since the advent of the internet, the world has witnessed the explosive growth and development of technologies that provide us with ever-increasing means of accessing information and connecting with one another. This technology is now available in most nations across the world and is used by more than 40% of the world’s population. How does this technology impact our society? Recent evidence suggests that this technology can help in the fight against corruption. But how it does that and what factors limit this potential deserve further investigation. In particular, little is understood about how censorship online impacts this potential. Approached quantitatively using a cross-sectional multiple regression analysis, this study attempts to contribute to that discussion, examining how the effect of internet use on corruption is impacted by government censorship online. This investigation is conducted globally on the country level, measuring how internet cen-sorship interacts with the effect of internet use on several corruption indicators. Furthermore, the study looks at how this interaction affects both grand and petty corruption. The findings support the hypotheses that increased internet use is related to lower levels of corrup-tion, but in societies with high levels of online censorship increased use is instead related to higher levels of corruption. Furthermore, while this relationship seems to exist for grand corruption at the executive and legislative levels of government, this relationship is less clear for petty corruption, particularly at the administrative level of government. Keywords: internet, censorship, corruption, press freedom, horizontal communication, social openness
Nicholas Sorak The Quality of Government Institute Department of Political Science University of Gothenburg [email protected]
3
INTRODUCTION
In April of 2016, the Panama Papers news story broke (Garside et al. 2016). Through the collabora-
tion of more than 100 media organizations around the world under the name the International
Consortium of Investigative Journalists (ICIJ), the story that unfolded painted a picture of a global
network of powerful people, shell companies, and hidden money. This was possible through a leak
of 11.5 million documents from a law firm in Panama, tracing back to the 1970s. While the bulk of
what was uncovered involved no illegal activity, there were soon allegations of corruption, tax
avoidance and evasion, and other unethical activities, leading to financial and political consequences
in many countries. In the immediate fallout, Iceland’s prime minister resigned (Henley 2016), a
corruption investigation began to look into the current and former presidents of Argentina (Man-
der 2016), and protests broke out in many countries (Domonoske 2016).
This was possible, first and foremost, through the hard work of a large number of journalists. But
the way in which this story was pieced together and delivered to the public leaned heavily on inter-
net technology and the availability of this technology around the world. Not only did the internet
allow these journalists to communicate and collaborate with each other, but it made possible the
online resource they developed on the ICIJ website (ICIJ 2016). This resource makes it possible for
other journalists and citizens to search the ICIJ’s published database of records and the connec-
tions between powerful people and their shell companies. The work of the ICIJ has also continued,
leading to the publishing of new leaks and the creation of a resource that allows whistleblowers to
report malfeasance (Ibid.). The ease of access and breadth of coverage makes this a unique accom-
plishment.
This is but one of many recent online developments that aim to fight corruption and abuses of
power. While the internet has emerged as a platform for communication, connection, research, and
entertainment, the past decade has also seen the emergence of the internet as a tool for citizens to
keep a check on abuses of power, such as with the rise of e-government initiatives in the majority
of countries across the globe, whistleblower sites, and the development of resources such as I Paid
A Bribe in India. And these are just the initiatives that have focused on corruption. There are also
other related developments that have the potential to reduce the ability of officials to engage in

4
corrupt practices, such as the migration of news sources to online platforms that now reach a glob-
al audience, the development of Virtual Private Networks (VPNs) and other anonymizing technol-
ogies that allow greater and more private access online, and civil society efforts online.
While the Panama Papers highlight the complexity and sophistication of the financial, corporate,
and governmental structures that allow corrupt behavior and make it difficult to track, the public
has increasingly shown itself capable of exploring novel ways of communicating and collaborating
to combat this problem. Corruption has proven itself to be about more than mere bribery, and the
public is becoming more aware and savvy in addressing that. This is helped along by the explosive
growth of the internet.
The internet has evolved from its beginnings as a military technology and tool of only the wealthi-
est into a resource that has spread to nearly every nation, especially since the advent of
smartphones that have literally put the internet in our hands. The internet has spread through land-
lines, mobile technology, and gaming systems, increasing worldwide each year, as seen in Figure 1.
As of this year, at least 40% of the world’s population is now online and this number is rapidly
rising (Internet Live Stats 2016). We have also seen the rise of social media, now with over 2.34
billion users worldwide (Statista 2016), which allows people around the world the opportunity to
become acquainted with one another without ever meeting in person. This has not only allowed for
greater and easier communication between people, but also granted access to virtually unlimited
information. While it is beyond the scope of this paper to address the potential implications and
consequences of our growing surveillance society, it is worth mentioning that this new world has
made hiding behavior increasingly hard to do, which can make life harder for those who engage in
corrupt practices.

5
FIGURE 1, NUMBER OF GLOBAL INTERNET USERS BY YEAR (INTERNET LIVE STATS 2016)
It is important to take a moment to define what is meant by corruption. This paper examines both
quality of government and corruption. While there are important differences between these two
concepts, this paper uses them largely interchangeably. What is of interest to this paper is how in-
ternet use potentially limits the ability of government officials and other people in positions of
power to abuse that power for personal gain.
Unfortunately, as citizens and journalists discover new ways to use the internet to push back against
corruption, governments discover new ways to use the internet to prevent people from doing so.
Censorship online has grown along with all the other developments online and governments have
used it to effectively suppress certain initiatives and points of view. Perhaps the most well-known
example of online censorship is the Great Firewall of China, the massive censorship and surveil-
lance system implemented by the Chinese government (Denyer 2016).
This system is used to monitor speech, block certain kinds of online content, and filter searches.
There are other practices and systems of online censorship used by governments around the world,
but none quite as broad or effective as the one in China.

6
As an example of how this technology is used, when the Panama Papers were released (which in-
cluded information about Chinese President Xi Jinping’s relatives), the Chinese government or-
dered all content regarding the Papers to be removed from all Chinese websites and media sources
(Phillips 2016). The government also partially blocked the websites of the BBC, CNN, The Guardi-
an, The Economist, and Time magazine following reports on those sites about Chinese connec-
tions to the Panama Papers (Ibid.). Censorship can also be passive, where people become so afraid
of saying or reporting something online that they remain quiet.
Attempts such as these to censor online content have been increasingly discussed as a hindrance to
democracy. But what is less understood is how censorship online relates to corruption. This thesis
attempts to explore this relationship.
This study approaches this issue quantitatively, conducting a cross-sectional analysis at the country
level that investigates how increasing levels of internet use relate to levels and types of corruption,
and how this effect is mediated by levels of online censorship. The findings suggest that internet
use has an important relationship with levels of corruption and that the censorship that govern-
ments employ online has a significant impact on this relationship. Furthermore, it appears that this
effect only plays a significant role with grand corruption, rather than petty corruption.
In this paper, the remainder of this section presents the research aims and contribution to the lit-
erature, Section II examines the current body of literature and gaps regarding the topic, Section III
discusses the theoretical framework applied in this paper, Section IV presents the quantitative mod-
els employed, Section V examines the results of the tests, and Section VI discusses policy recom-
mendations and directions for future research.
Aims and research questions
The aim of this study is to better understand how the spread of internet access potentially impacts
levels of corruption around the world and what factors shape this relationship. The bulk of the
currently available research involving internet and corruption has focused on top-down, e-
government efforts to curb corrupt practices.
A smaller body of work has examined the impact of bottom-up approaches to fighting corruption
using internet technology.

7
This paper aims to contribute to this smaller body of work, both theoretically and quantitatively.
While studies have examined the relationship between internet access and levels of corruption,
studies have not yet examined the extent to which online censorship impacts this relationship. This
paper aims to fill this gap by investigating the global relationship between internet access, online
censorship, and corruption.
This paper examines the following research questions:
Is there a relationship between rates of internet access and levels of corruption?
If so, how does online censorship impact this relationship?
Does this relationship exist for all types of corruption, in all levels of government?
Aims and research questions
This paper contributes to the growing body of work that focuses on both efforts to fight corrup-
tion and the potential of internet technologies. This paper is the first cross-national quantitative
study that investigates how online censorship impacts the relationship between internet access and
levels of corruption. As mentioned above, much work has been done on top-down efforts to curb
corruption through internet technology, but considerably less has examined the potential of bot-
tom-up approaches. Furthermore, previous studies have overlooked the possible mediating effect
of censorship on the ability of the internet to reduce corruption. What research has been done has
often focused on either small or qualitative studies or theoretical perspectives. This paper will add
to that with a large study of trends around the globe.

8
LITERATURE REVIEW: WHAT DO WE KNOW ABOUT THE EFFECT OF THE INTERNET ON CORRUPTION?
Interest in the explosive growth and development of the internet and its resulting impact on our
lives has driven a considerable amount of research and theorizing over the past two decades. In its
most condensed form, the theoretical framework of this paper rests on the idea that – in addition
to imbalances in power – one of the key contributors to corruption in the world is the limitation of
access to information. Corruption exists when money, influence, and favors are able to be extorted
from the public and passed around in circles of power in the shadows. Therefore, greater access to
information and increased ability to digest that information enables populations to better shine light
on those circles and push back against corrupt behavior - whether that pushback occur in the form
of elections, protests, or denying support to businesses. The theoretical framework that is laid out
in the sections that follow focuses on this debate about transparency, censorship, and whether the
internet can help to overcome some of these barriers.
A slowly growing body of work is examining the impact of the internet and related technologies on
quality of government and corruption. While the conclusions in the literature that will be discussed
below have been mixed, the overall results seem generally positive - increased internet access is
related to lower levels of corruption. While some thinkers have perhaps been overly optimistic
about the transformative powers of the internet in many aspects of our lives, the empirical evidence
suggests a meaningful positive impact on the problem of corruption. The currently available rele-
vant literature on the effects of internet on quality of government (QoG) and corruption covers
three primary areas of interest: the spread of internet access, the use of e-government initiatives,
and the use of social media. The thread that is seen through these areas is that the spread of these
technologies seems to correspond with improved QoG and lower levels of corruption, which will
be presented in the following sections.

9
Transparency
While it would be inaccurate to present the issue of internet access and levels of corruption as
merely a matter of transparency, the concept of transparency is at the heart of the matter. So let us
begin the theoretical foundation with an examination of how transparency relates to corruption.
Transparency has been argued to be a powerful tool in the fight against corruption. Without trans-
parency, corruption is less risky and more attractive, trust and social norms against corruption are
undermined, cooperation is more difficult, incentives against corruption are more difficult to use
effectively, and it becomes difficult to choose honest officials (Kolstad & Wiig 2009). Put more
simply, increased information allows people to make better choices about their governments and
representatives (Florini 2002). Pande supports this idea, arguing that low-income voters support
less corrupt candidates when there is more available information (Pande 2011). In a practical sense,
this thinking is the theoretical heart of the work of organizations like Transparency International,
urging transparency-related policies and practices in government and business as a means of com-
bating corruption.
But the issue of transparency appears to be more complicated than that. Some researchers have
found reason to be less optimistic about the potential of transparency in curbing corruption. It
appears that the effect of transparency can be limited when factors like democracy and wealth are
missing (Kolstad & Wiig 2009). Furthermore, it appears that transparency does little to curb cor-
ruption in situations where education levels are low or stakeholders lack the ability to hold officials
accountable (Ibid.). In certain environments, transparency could make corruption and fraud even
worse if it allows those who are willing to pay bribes to more easily identify officials who are recep-
tive to bribery (Ibid.) or in systems that are not governed well or where transparency erodes public
faith (Bauhr & Nasiritouri 2012). Fundamentally, transparency and access to information do not
necessarily mean that corruption will be reduced. There are other important factors that play a role,
but transparency can be an important tool.
Internet access
But can transparency online help improve QoG and curb corruption differently? A growing body
of research is working to answer this question.

10
What this paper proposes is that access to information and communication online functions as a
different kind of transparency, one that can potentially have a greater impact on levels of corrup-
tion.
This question is increasingly relevant as internet and computer technology grows faster, cheaper,
more sophisticated, and more widely spread. More recently, this technology has leapt from our
desks and homes into our hands, with smartphones and other mobile technology changing the ease
with which we connect to information and each other. A number of studies have examined how
these developments have impacted corruption and QoG. While the results vary between countries,
it appears that internet penetration in societies is related to a decrease in corruption (Andersen et al
2011; Garcia-Murillo & Vinod 2005). However, just as suggested by the findings of Bauhr & Nasiri-
touri (2012), increased access to previously unavailable information online could lead to worsened
perceptions of corruption (Posso & Elkins 2014). This is not necessarily a bad thing. It lends sup-
port to the idea that the increase in information through internet access contributes to more accu-
rate views of society and the corruption within it.
This, however, does not pretend that the spread of internet is enough to curb corruption. While
some researchers have promoted the idea that the spread of the internet fights corruption, it ap-
pears that the effect of this is limited by the governance within countries, bureaucratic red tape, and
freedom of the press (Garcia-Murillo 2010). The concept of media freedom is further supported by
others, arguing that access to information is at least as important as this regarding levels of corrup-
tion (Färdigh 2013a). Despite the existence of these limitations, the general consensus seems to be
that citizens finding greater access to information is related to lower levels of corruption. But how
exactly is this increase in access helping with corruption?
The following sections examine the literature regarding top-down and bottom-up internet efforts to
fight corruption. These perspectives are embodied in the proliferation of e-government initiatives
and the evolution of an online civil society, respectively.
E-government
E-government or open government initiatives have become a popular idea in recent years with the
spread of the internet, and this topic represents the bulk of the current literature devoted to the

11
issue of the internet and corruption1. These initiatives are government transparency programs that
take on a variety of forms, but revolve around citizens having greater or easier access to documen-
tation, budgets, government communications, and more online (Bertot et al. 2010; Elbahnasawy
2014; Garcia-Murillo 2013). These initiatives can also provide ways for citizens to engage online
with government officials, offices, and citizens. Examples range from open information about bid-
ding on government contracts in Chile (Shim & Eom 2008), to Pakistan using e-government to
reduce opportunities for tax officials to request bribes from citizens (Andersen 2009), to the US
government making nearly 200,000 datasets of government information available and searchable
(Data.gov 2016). Many times these initiatives have been presented primarily as a means for the
government to fight corruption. At their core, they are top-down initiatives.
Unfortunately, the effectiveness of these campaigns has been inconsistent and faced limitations,
according to the literature. While recent studies have examined these campaigns in places as diverse
as China (Xinli 2015), India and Europe (Prasad & Shivarajan 2015), and North America (Olabe &
Kahn 2012) and found a degree of effectiveness to each, the impact of these campaigns on corrup-
tion was limited by a number of factors such as poor citizen awareness of the initiatives, poor quali-
ty of resources, and poor implementation of the initiatives themselves. These same limitations,
along with political stability, are found in a large, cross-country analysis, although those researchers
did find that e-government initiatives helped overall to reduce corruption (Shim & Eom 2008).
Another cross-country study found e-government initiatives to be a useful tool against corruption,
but that pre-existing levels of corruption could be limiting factor on the effectiveness of the cam-
paign (Bussell 2011).
There are a number of detractors from this evidence, including those who theorize that the poten-
tial of e-government has been overstated (White 1997). There are also studies that find mixed or
insufficient evidence to support these initiatives, where potential is limited by cultural factors
(Bertot et al 2010), corruption finding new opportunities within the initiatives (Charoensukmongkol
& Moqbel 2012), non-democratic conditions (Linde & Karlsson 2013), and poor technical difficul-
ties skills, access, and motivation (McNeal et al 2008). Other limitations appear to be in
1 These initiatives have many labels, also including e-participation and often generically labeled as Internet Communica-
tion Technologies (ICTs). While there are sometimes fine differences in the meanings between these labels, ‘e-government’ is used in this paper as an all-encompassing term meant to capture the development of online initiatives seemingly meant to provide government information to people and allow for greater participation from citizens, regard-less of whether a regime is democratic or non-democratic.

12
establishing what e-government really means, what transparency means (Bauhr & Grimes 2012),
and when transparency actually works to limit corruption (Bauhr & Nasiritouri 2012).
There are certainly reasons to be skeptical of e-government initiatives as a means of improving
quality of government and curbing corruption. However, there are alternative approaches, as top-
down e-government initiatives represent only one way in which the spread of internet could help
reduce levels of corruption. There is also potential in bottom-up initiatives online. The interest in
this topic appeared to grow after the events of the Arab Spring in 2010, when the world saw credit
given to online tools like Facebook and Twitter in spreading awareness and helping people make
the connections that were important to the uprising (Bohler-Muller & van der Merwe 2011; How-
ard et al. 2011). Now a growing body of work has begun to evaluate the impact of social media on
corruption and QoG.
Civil society and social media
Some thinkers have theorized that the internet would help strengthen civil society, leading to bot-
tom-up movements having more impact (Kavanaugh et al 1998; Tadros 2005). This thinking is
based on the idea that the internet eases communication and coordination between groups. And
some empirical evidence supports that, as Kavanaugh found that those members of civil society
who used the internet also had increased interest and participation in civil society issues (Ka-
vanaugh 2005), although the resulting impact that the internet is able to have on a society might
ultimately depend on the kind of culture that is in place (George 2005).
More recent writing on the matter suggests that an online civil society is evolving, which in turn will
help address some of the challenges found by previous research. As mentioned earlier, interest in
the topic spiked following the Arab Spring. Regardless of the outcome of the Arab Spring, it ap-
pears that the proliferation of mobile internet was crucial for helping activists use the internet and
social media to push for change (Bohler-Muller & van der Merwe 2011). A study in China found
evidence that increased internet access is helping civil society strengthen (Yang 2010). However,
there are still common limitations to these effects, as insufficient levels of democracy and economic
development lead to weaker benefits (Galais & Anduiza 2011). Fortunately, there is evidence that as
internet access increases governance improves, regardless of the form of government in place
(Khazaeli & Stockemer 2013).

13
The available literature on this intersection between civil society and the internet is limited and is
not entirely consistent in its findings. Schoemaker and Stemlau recently conducted a review of the
available research, finding little empirical research on the topic (Schoemaker& Stemlau 2014). What
they did find is evidence that the internet offers an alternative to one-way communication, such as
the traditional press. Instead, the internet provides citizens with a two-way communication plat-
form, encouraging the citizen participation that was discussed above. This two-way communication
can be useful in places where democracy or transparency are not provided and grant citizens a kind
of leverage. What seems clear from the review is that there is a need for more empirical research
into the potential of the internet as a bottom-up tool for tackling a number of problems, including
corruption.
Censorship
A large body of work has found that freedom of the press is an important factor in the fight against
corruption (Brunetti & Weder 2003; Dutta & Roy 2012; Freille et al 2007; Färdigh 2013a; Treisman
2007). However, considerably less work has addressed issues of censorship, and even fewer of these
have focused on how censorship online relates to corruption. What is apparent in the body of liter-
ature is a focus on what is happening in China in regards to both press freedom (or the lack there-
of) and the Great Firewall of China that restricts online access to information (Ang 2014; Freedom
House 2009; Qiang 2011). Even a cursory glance at the available literature on the topic reveals that
academia has focused intensely on the effect of internet censorship in China. However, varying
degrees of internet censorship exist all over the world and are worthy of examination.
Censorship of the internet limits the potential impact of the internet on corruption. This censorship
can occur in a number of ways. Perhaps the most common occurrence is the use of filters to shut
off access for citizens to certain websites. In a very recent example of the use of these filters, during
the attempted coup in Turkey in July of 2016, the Turkish government shut off access to Twitter,
Facebook, and YouTube, presumably as an attempt to limit the flow of information and communi-
cation, thereby hindering coordination of the opposition (Greenberg 2016). Access was later re-
stored in order to allow protesters pushing back against the coup to use these sites (Ibid.). The next
week, the leak website Wikileaks would release a database of emails from within President Er-
dogan’s AKP party, leading to Turkey blocking access to the Wikileaks website (Ibid.). This is

14
similar to the previously mentioned example of China restricting access to certain foreign news sites
because they were reporting on potential corruption in the Chinese government through involve-
ment in the Panama Papers.
These are only a couple of the many examples where governments provided evidence that the in-
ternet potentially offers a certain kind of power to protesters and frustrated citizens. Some authors
have theorized that the effect of an open internet will allow citizens to challenge the provided nar-
ratives about society and think for themselves (Al-Kandari & Hasanen 2012; Alterman 1998; Dahl-
berg 2007), which is obviously important for democracy, but also contributes to the fight against
corruption. Furthermore, an uncensored internet makes it possible for people to expose infor-
mation that people in power attempt to cover up (Abdulla 2007).

15
THEORETICAL FRAMEWORK
At its core, this thesis is interested in examining the role of information in fighting corruption, albe-
it through the lens of an internet that ideally is readily accessible and free of censorship. This in-
formation serves as a fuel for bottom-up efforts to push back against corruption and place pressure
on governments to implement change. This paper focuses on three novel mechanisms as the means
for an open internet reducing levels of corruption: the internet as press freedom, the internet as
horizontal communication, and the internet as social openness. This thesis attempts to present
these mechanisms together in a novel way, one in which these mechanisms work together and
overlap in a way that explains not only how increased internet use can reduce corruption, but also
demonstrates how censorship is detrimental to this potential. These perspectives are presented in
the following sections. Following that, there is a discussion of how these mechanisms impact dif-
ferent types of corruption.
The Internet as a new form of press freedom
The first theoretical perspective that will drive the work of this paper is the idea that the internet
serves as a new form of press freedom, one which goes above and beyond the potential of tradi-
tional press outlets. This connection is important because, as discussed earlier, there is a wealth of
literature available linking press freedom with lower corruption. The foundation of this relationship
is that free information allows citizens to stay informed about their governments and others who
occupy positions of power. This information allows citizens to work to hold these powerful people
accountable. In turn, when those in power act in a trustworthy matter, the people develop trust for
the systems in place.
The internet provides a new medium for news outlets to disseminate information. In some ways,
the internet has been thrust upon these outlets2. In other ways, news outlets have embraced the
internet as a way of spreading information and acquiring new readers and viewers. The vast majori-
ty of news sources – beyond the most local of readerships – now have an online edition, whether
2 In English-speaking countries, the advent of the internet has led to a precipitous decline in traditional newspaper read-
ership (Herndon 2012; Rodgers 2016), forcing companies to quickly (and at times awkwardly) embrace the online medi-um.

16
word or video, and they make frequent use of Twitter, Facebook, YouTube, and similar regional
varieties of the same.
This shift to the internet has led some to suggest that traditional press credibility and journalistic
standards are being watered down (Krotoski 2011; Reinardy 2010). There is some truth to this and
reason to be concerned. If journalistic standards are not respected within what qualifies as the
press, especially in the blogosphere, information quality and reliability will degrade. That being said,
the internet as a press outlet offers many potential benefits, especially for the discriminating reader.
In general, I propose that what the internet offers to the press is the ability to overcome the limita-
tions of time and space that restrict traditional news outlets. In traditional news outlets – newspa-
per, radio, and television – there are certain time and space factors that are inescapable. A newspa-
per only has so much space to print, and radio and television only have so much time available to
present their information. Furthermore, these media are anchored in the present. Unless a reader
saves their newspapers or goes to the library to read microfilm, a newspaper can only exist in the
present, with limited ability to refer to its own past articles or the past of people and issues. Radio
and television face similar limitations – they can both replay broadcasts from the past, but there are
only so many hours in a day so they are limited by what they can broadcast from the past and pre-
sent. On the other hand, while the internet is not truly limitless, in theory it is.

17
One primary way the internet transcends these spatial and temporal limitations is through depth of
information via hyperlinks. A feature that is unique to online material, the hyperlink allows readers
the opportunity to access information in ways they never could before. While a newspaper might be
able to refer to an older article, the internet allows the reader to access these old articles immediate-
ly, increasing the depth of information available to them. This allows easier connection to related
issues, as seen in Figure 2 below. Similarly, a reader can more effectively follow the work of a par-
ticular writer who focuses on a topic. If said writer is devoted to covering corrupt practices, readers
can more easily get the big picture of what is going on in a story, something that is particularly use-
ful with a complex issue like corruption. In addition to following written materials, a reader can also
often access radio and television material online, placing all media within reach. However, all of this
could also pose a danger if readers become overwhelmed with the sheer amount of information out
there. While that issue is beyond the scope of this paper, future research will help us better under-
stand what effect this massive leap in available information does to the reading and viewing public3
FIGURE 2, HYPERLINKS LEADING TO RELATED ARTICLES (WATTS 2016)
Another way that the internet transcends space is by crossing boundaries. Potentially the most im-
portant impact of the internet as press freedom is that it allows for greater press freedom in places
where the press is less free. This statement does not mean to suggest that the internet serves as a
replacement for traditional press freedom. There is irreplaceable value in having a free press within
a country – a press that exists within and understands the culture and contexts that it is reporting
on. However, despite its limitations, the internet can allow citizens exposure to alternative news
3 Perhaps the greatest danger the internet poses is the possibility that it will turn into an echo chamber of opinions,
devoid of objective information. There is certainly potential for this. One need only a shallow familiarity with internet trends to be able to recognize the popularity of lists and opinion pieces online. This issue is touched upon in the Con-clusions, but time will tell what the consequences of the internet are in this respect.

18
sources around the world, which could be reporting on the happenings within their country. Fur-
thermore, there is value in the availability of a perspective that is outside of the confines of the
culture and context of a nation, which can be a limiting factor in the press’s ability to report thor-
oughly. However, when censorship occurs, these effects are weakened.
Censorship has a direct impact on all of these potential benefits. Research has found that a lack of
censorship in traditional press is one of the strongest ways to reduce corruption (Brunetti & Weder
2003). Censorship of the press online likely disrupts the benefits of the press in the same way it
does with traditional press. Oppressive governments can censor not only online news outlets, but
also crack down on who blog and attempt to coordinate online. This serves not only to reduce
perceptions of corruption, but can actually enhance the ability of corruption to function and grow.
It therefore stands to reason that this ability to transcend the usual media boundaries of space and
time can be especially important to fighting corruption. Corruption is a complex issue that requires
the exposure of what are often complex networks of influence. The internet is uniquely qualified to
serve as the medium to deliver this kind of information.
The internet as horizontal communication
Building upon the space dimension, the internet also serves as a unique communication and coor-
dination platform, one that has not existed until now. I argue that the characteristics that make this
platform unique in this dimension, described below, offer potential for bottom-up approaches to
tackle corruption in ways that have never existed before. First, it is important to address how the
internet serves as a horizontal communication platform versus traditional communication plat-
forms. Societies have long relied on vertical communication. In vertical communication platforms,
such as traditional press outlets, information on the government is passed down from the govern-
ment to the press to the people (Raycheva 2009).
While obviously a simplified description of this process, it covers the vast majority of how vertical
communication works. Citizens are at the bottom of this configuration, receiving information as it
filters down to them. Information is passed along through newspapers, television, and other pub-
lishing sources. The key characteristic of this kind of outlet is that it is indeed an outlet – as dis-
cussed earlier, the information is rather static (once published) and only flows outward. The flow,
on a grand scale, essentially only works in a downward vertical direction – this is the traditional

19
top-down media.
Some e-government initiatives, whether purposely or not, address some of the problems of having
only vertical systems of communication, as discussed earlier. However, swimming against that ver-
tical stream can be difficult as these hierarchical systems have been in place for a long time for most
modern governments. Furthermore, we can observe that these traditional vertical structures tend to
exist within countries, not between them. In societies with only vertical communication, the public has
little power. There is no true give-and-take in this type of system. In ideal situations, vertical mech-
anisms are in place that allow the press to be critical of the government and work to hold the gov-
ernment accountable (Relly 2012). The press does this by providing information to the people,
which in turn places pressure on the government, especially in democratic settings. However, in less
ideal settings, the people have few options if accountability mechanisms do not function optimally
(Ibid.). Instead, in those situations, the people are merely recipients of information that the gov-
ernment deems acceptable.
Horizontal communication works quite differently. Horizontal communication platforms include
such technologies as the telephone, mobile phones, postal services, copy machines, and – most
importantly – the internet (Skoric & Park 2014). Some of these systems have been in place for a
long time in much of the world and have allowed greater communication of information and coor-
dination of people. But the internet represents an exponential leap in the capabilities of this kind of
system, allowing for the spread of massive amounts of information and the potential coordination
of people across every kind of boundary. Furthermore, the cost of communicating and coordinat-
ing in this way has decreased rapidly – both in terms of time and resources (Salas-Fumás &
Sanchez-Asin 2013). This horizontal system not only allows people to seek alternative sources of
information – whether grassroots or foreign – but also to communicate with one another and pro-
vide feedback to both the press and the government, which can help build and apply pressure
against problems like corruption.
Twitter has emerged as an interesting online approach to horizontal communication. Rather than
merely being the recipients of information from above, the public can now use Twitter to engage
with public figures and government officials. While vertical structures are clearly still in place, a
resource like Twitter can help to flatten these structures and provide some leverage for the public

20
(Bertot et al. 2012). This depends on government officials choosing to use Twitter, it seems in-
creaseingly popular for public government officials to have active social media accounts. While
earlier forms of horizontal communication like letters through the post or even emails allow people
to engage with officials, this communication is still done privately and there is no guarantee of a
response. There is also no guarantee of a response on Twitter, but this communication now hap-
pens in the public sphere. Citizens are now able to publicly ask questions of their government in
front of a global audience and the pressure is increasingly on those officials to respond.
In cases of corruption, these issues can be brought to light in front of a global audience, while at
the same time allowing citizens to coordinate to push back against corruption. This also ties back
into the issue of press freedom as this kind of platform allows journalists to communicate and co-
ordinate with the citizenry more, rather than simply transmitting information to them. As an exam-
ple, Washington Post journalist David Fahrenthold spent months investigating alleged misuse of
funds by US presidential candidate Donald Trump’s charitable foundation, including possibly using
the foundation to help his campaign4 (NPR 2016). Fahrenthold eventually turned to Twitter as a
means of crowdsourcing, reaching out to the public to provide information that might help his
investigation (Ibid.). Through this approach, the public was able to help in the investigation and
track down instances of Trump using his charity to fund personal purchases (Ibid.). As a conse-
quence, Trump’s foundation was ultimately found to be operating in violation of the law. If the
necessary paperwork to address these issues is not submitted in a timely manner5, it is possible that
a legal investigation for fraud will be opened (Fahrenthold 2016a).
Access to the internet is the starting point for this horizontal network, but censorship online can
disrupt this process and hinder its ability to be used for holding those in power accountable. When
people are prevented from accessing information, crossing digital borders, or communicating freely
with one another, horizontal communication breaks down. In those instances, the internet only
serves as another form of vertical communication. The development and expansion of an online
civil society continues this horizontal development. As mentioned earlier, the internet provides a
platform for two-way communication (Schoemaker& Stemlau 2014) that is essential to civil society.
4 Trump based his political campaign on the argument that he was a successful businessman who also contributed
significantly to society. Because of a lack of willingness on the part of the candidate to disclose financial details to back up these claims, reporters took a great interest in investigating these matters themselves. 5 The foundation did not meet the first deadline for necessary paperwork, resulting in an order to shutdown their solicita-
tion operations (Farenthold 2016b). Another extension has been granted for this paperwork and time will tell whether they can prove that they have been operating as a legitimate charity.

21
The internet as social openness
I propose that social openness is another related way that the internet helps overcome spatial limi-
tations. A number of studies have investigated the idea of openness as a way of projecting new
norms into a society (Abbot & Snidal 2001; Sandholz & Gray 2003). Subsequent research provided
evidence that social, political, and trade openness is related to the development of anti-corruption
norms in societies (Charron 2009). While political and trade openness are not quite as relevant to
the idea of the internet curbing corruption, social openness certainly is. The evidence suggests that
social openness creates a kind of bottom-up pressure against corruption as citizens become increas-
ingly informed through new sources of information, such as the internet, and apply pressure to
authorities (Ibid.). However, the ability of this mechanism to affect change is limited when im-
portant factors like press freedom are lacking in society, limiting the flow of this outside infor-
mation (Ibid.).
Continuing in this theoretical line, it seems reasonable to suggest that increased internet access
produces similar social openness. However, this possible effect would be mitigated by the presence
of censorship online. Despite the importance of press freedom within a country, the extent to
which a government applies online censorship is perhaps more important in the context of outside
information. The more that the flow of outside information is restricted by censorship, the less
likely it is that new anti-corruption social norms work their way into a society. In societies with the
highest levels of online censorship, the complete lack of exposure to outside social norms could
lead an echo chamber of social ideas and therefore lead to distorted views and acceptance of cor-
rupt behavior. This results in reduced, ineffective, or absent pressure from the bottom in motivat-
ing change and likely worsening of corruption. As censorship is eased or citizens find new ways to
sidestep these restrictions, greater numbers of the public can be exposed to and internalize anti-
corruption efforts and norms.
Types of corruption
The literature differentiates between grand and petty corruption and the different attitudes regarding
these types (Dahlström 2011). Grand corruption occurs at the highest levels of government, acting
to distort policy while allowing officials at these highest levels to benefit at the expense of the pub-
lic. This kind of corruption is seen in the executive and legislative branches of government. Petty
corruption, on the other hand, involves the solicitation of bribes and abuse of power when

22
interacting with citizens in the lower levels of government. Petty corruption is more likely to be
seen in the judicial branch and administrative levels of government.
There is reason to believe that the mechanisms investigated in this paper do not have the same
effects on all kinds of corruption or levels of government. Grand corruption is likely to impact an
entire country. Also, because it occurs at the national level, it is at times more visible. For fighting
corruption of this sort, the internet can be a valuable tool, allowing the press and people to com-
municate and coordinate across a country while also comparing what is happening at their national
level to the social norms of other countries. Online censorship would have a significant impact on
this potential and therefore impact how successfully a society can tackle their grand corruption
problem.
Petty corruption, on the other hand, is less likely to be impacted by the internet mechanisms inves-
tigated in this paper. Bribery within the administrative level is a more local phenomenon and there-
fore benefits less from the enhanced press aspects of the internet. Online censorship efforts are
also less likely to be aimed at the local level, compared to attempts to cover up corruption at the
national level. It is also less likely to need the internet as a coordination tool because local efforts
are more likely to successfully form without needing the internet. Furthermore, there is evidence
that petty corruption is more tolerated by some societies (Nystrand 2014; Pellegrini & Gerlagh
2008), meaning that the internet would be less utilized to fight it. For these reasons we can expect
that the potential usefulness of the internet as a tool would differ depending on the level of corrup-
tion being examined.
Hypotheses
In the sections above I have reviewed the available literature on the topics of online approaches to
fighting corruption. Furthermore, I have covered the ways in which censorship has an impact on
those online approaches. I also provided the theoretical framework that will guide this study, name-
ly that while the internet serves as a valuable tool in the fight against corruption through three
mechanisms, online censorship poses a direct threat to each of these and hinders the potential of
the internet. Put more simply, I argue the following two primary points:

23
First, an increase in internet access and use allows for greater information awareness, communica-
tion and coordination, and the transfer of norms against corruption. As a result, this allows for the
ment and reduce corruption.
Second, this relationship is conditional upon the extent of online censorship within each country, as
censorship limits or eliminates the potential of these mechanisms to function properly. In places
where censorship is high, the mechanisms through which increased internet use helps to curb cor-
ruption are directly hindered and the internet instead serves to enhance corruption.
Based on this line of thinking, this study tests the following hypotheses:
H1: Increased internet use has a positive relationship with higher quality of government and lower levels of corruption.
H2: The effect of increased internet use is contingent upon the levels of online censorship in the country; under high
levels of censorship, increased internet use has a negative relationship with higher quality of government and lower
levels of corruption.
This study is also concerned with how this relationship can be seen in different levels of govern-
ment. This relationship should be more observable when addressing grand corruption throughout
the branches of government that are most visible at the national level, but less apparent in those
parts of government that affect the local level or where day-to-day corruption is less visible. There-
fore, the following hypothesis are tested:
H3a: Increased internet use under low levels of online censorship has a greater effect on grand corruption at the na-
tional and more visible level of government than it does on petty corruption at the administrative or day-to-day level.

24
RESEARCH DESIGN
This study was approached quantitatively and uses a cross-sectional, large-N Ordinary Least
Squares (OLS) multivariate regression analysis to investigate the relationship between internet use,
internet censorship, and corruption.
There were other options available for tackling this issue. A qualitative design could certainly have
yielded interesting results. For example, a case study about what happens in a set of countries expe-
riencing an increase of internet use under different levels of censorship could provide insight into
the patterns investigated in this study. But there is already a qualitative body of literature looking at
variations of this effect, especially in China, so it was of interest to strike out and approach this
from the quantitative angle.
From that perspective, there were other approaches that could have been taken, such as conducting
a time-series approach. However, there are challenges to this approach, especially as an introducto-
ry study such as this. The introduction and growth of the internet is a relatively recent phenome-
non. Research and data concerning censorship online is also relatively new and underdeveloped at
the moment. Furthermore, there are other factors that are beginning to play a meaningful role in
the relationship explored in this study, such as the introduction of technologies that allow users to
overcome censorship attempts, the impact of online surveillance, and more. Addressing some of
these factors was beyond the scope of this project, and not addressing them could potentially lead
to time-series approaches not capturing an accurate picture of the situation.
Instead, the approach used in this paper was deemed most appropriate. A cross-sectional quantita-
tive study allows for capturing a snapshot of these relationships from a global perspective. In the
event of significant findings, subsequent research could proceed to address these other factors, to
analyze these relationships over time, and to more effectively conduct qualitative studies that give
greater fine-grain details in individual countries.
The research design used in this analysis is presented in detail in the sections below. In the first
section that follows, the operationalization and measurement of the variables employed in the
quantitative models will be discussed. In the second section, the methodology used in this study is
further explained.

25
Operationalization and measurement
The following sections describe the variables used in this study. All variables came from or were
adapted from the QoG and Varieties of Democracy (V-Dem) datasets, with the exception of the
Years of Democracy measure. With the exception of the measures from 1996, all data comes from
2012.
Dependent variable
Quality of Government / Corruption
This paper examines factors that can affect levels of corruption and QoG around the world. Be-
cause of the secretive nature of corruption, it is difficult to identify in precise ways, therefore
measures of corruption often rely on survey and perceptions data. There are a number of useful
measurements of corruption and QoG that use this technique, several of which are employed as the
dependent variables in the models of this study. Multiple dependent variables were used in this
study both for the purpose of robustness and for theoretical reasons that are discussed in detail in
the Methodology section. The measures of corruption used in this study come from several differ-
ent organizations and are discussed below.
The first measure is the International Country Risk Guide (ICRG) Indicator of Quality of Gov-
ernment (QoG) (PRS Group and others n.d.) in the QoG dataset. To create this measure, the
ICRG takes into account political system corruption, the strength and impartiality of the legal sys-
tem and the popular observance of law, and bureaucracy quality. This value is scaled from 0-1, with
0 indicating low quality of government and 1 indicating high quality of government.
The second measure is the World Bank Governance Indicators Control of Corruption (Kaufmann
et al. 2010) in the QoG dataset. This measure is a perception of corruption indicator, pulled from a
number of sources using different measures. The Control of Corruption measure countries on a
scale from -2.5 - 2.5, with -2.5 indicating most corrupt and 2.5 indicating least corrupt.
Other corruption measures were employed as additional checks. These measures were taken from
the Varieties of Democracy Institute (V-Dem) database (Coppedge et al. 2015) and include the
Executive Corruption Index, Legislative Corrupt Activities, Judicial Corrupt Decisions, and Public

26
Sector Corruption Index. These measures are all combined in a separate measure for Political Cor-
ruption. The measures for Political Corruption, Executive Corruption Index, and Public Sector
Corruption Index are scored from 0-1. For readability purposes, these scores were reversed so 0
indicates most corrupt and 1 indicates least corrupt. The Legislative Corrupt Activities measure has
a ranking scale from 0-4 that measures whether legislature members abuse their positions for finan-
cial gain, with 0 indicating commonly and 4 indicating never or hardly ever. The Judicial Corruption
Decisions measure has a ranking scale from 0-4 that measures how often bribes must be paid to
speed up processes or obtain favorable judicial decisions, with 0 indicating always and 4 indicating
never.
Independent variables
Internet use
The main explanatory variable for levels of corruption is the degree of internet access in a country.
In order to capture this concept, the models use the number of internet users (per 100 people) as a
measurement (World Bank 2015), taken from the QoG dataset. In this measure, a person is consid-
ered an internet user if during the past 12 months they accessed internet services through comput-
er, mobile phone, gaming console, or any other internet-capable device. This measure has been
used in a number of other studies (Andersen et al. 2011; Lidman 2011).
This measure is an imperfect measure, certain to capture an amount of “noise” from those individ-
uals who either did not have reliable access to the internet during the year or did not use the inter-
net for any services that are potentially relevant to this study6. However, despite this imperfection,
this measure is still the best measure for the purposes of this study. Without contrary evidence, we
should assume that the percentages of people using these services for purposes not applicable to
this study are roughly equal around the world, leaving us with similar amount of noise in each case.
Furthermore, alternative measures are inferior for a number of reasons. There are measures of
internet subscribers on landlines, but these are problematic because they inherently discriminate
against places where a higher than average number of people live in the home and use the same
subscription. It is also problematic in places where home computers are not affordable or reliable,
6 Examples of these individuals could include people who use the service only to access video games without multiplay-
er capabilities, or those who use the internet primarily to watch popular foreign TV shows - both examples where they are less likely to encounter news, discussion, or information that touches on corruption-related topics.

27
such as places where stable sources of electricity are rare or mobile internet is more prevalent.
There are also measures of mobile users, but these in turn discriminate against users who only use
the internet at home, internet cafes, or other alternatives. Combining these two types of measures
into a single measure generates a great deal of overlap that makes reliable analysis difficult or im-
possible. In the end, the measurement used in this paper is the best fit for this study.
Internet censorship
The other explanatory variable for levels of corruption is the degree of internet censorship a gov-
ernment employs. To account for this variable, the internet censorship effort measure was used
from the Varieties of Democracy Institute dataset (Coppedge et al. 2015). Censorship in this meas-
ure describes government efforts to filter specific sites, perform denial-of-service attacks, or shut
down portions of or the entire internet. This measure originally scales from 1-4, with 1 meaning the
blocking of all content that is not pro-government, and 4 meaning internet that is unrestricted (with
the exception of certain content such as child pornography or military secrets). Because of the di-
rection of this scale and for readability purposes, in the analyses this measure is referred to as Free-
dom from Internet Censorship. Because of an abnormal distribution of this data, a log transformation
was applied to this measure and is noted in the models.
Interaction of internet users and internet censorship
The two independent variables – internet users and internet censorship – were used to create an
interaction effect. This interaction measures the relationship between these two variables. Because
this study is interested in the direct effect online censorship has on the impact of internet access on
corruption, including this interaction is the ideal way to understand this effect.
Control variables
Economic Development
The economic conditions in a country are among the most well-established predictors of levels of
corruption and are accounted for in almost all studies of the problem, including those that investi-
gate the impact of internet use (Goel et al. 2011; Khazaeli & Stockemer 2014; Lidman 2011). For
this reason, the economic development level has been accounted for in the models. The primary
model uses GDP per capita, PPP (constant 2011 international dollar) in the QoG dataset (World

28
Bank 2015). However, it should be noted that – unsurprisingly – this measure and all similar
measures are highly correlated with the level of internet access. This makes sense because poorer
countries will have fewer resources to dedicate to connecting the country and people, while the
opposite is true of wealthier countries. Because of the abnormal distribution of this data, a log
transformation was applied to this measure and is noted in the models.
Colonial origin
There is evidence that former British colonies have lower levels of corruption and better QoG than
countries that were colonized by other countries (Treisman 2000). The evidence suggests that this is
the result of a common law tradition (La Porta et al. 1999; Treisman 2000). This study uses the data
from Hadenius & Teorell (2007) in the QoG dataset to account for former British colonies. Coun-
tries were coded as either being a former British colony (1) or not (0).
Democracy
Many studies have identified a strong relationship between democratic traditions and levels of cor-
ruption (Charron & Lapuente 2010; Treisman 2000; Treisman 2007). Evidence suggests that de-
mocratized nations are less susceptible to corruption or are better able to address these problems
when they arise. While not all researchers agree that this effect is so clear, most quantitative studies
of corruption control for this factor. In order to account for this effect, the number of years of
democracy a country has experienced since 1930 were included. This measure has been used in
other studies (Gerring & Thacker 2004; Grimes 2012; Treisman 2000) and has been argued by
these studies as a more effective predictor of corruption than using measures of current levels of
democracy. Because corruption is a long-term problem that winds its way through a society and
government, there is evidence that the effect democracy has on mediating corruption is better iden-
tified through a long-term measure such as the one employed.
This measure was created from the Polity IV database (Marshall et al. 2015). The number of years
of democracy for each country was calculated by counting the number of years from 1930-2012
that each country had a Polity Score from 6 to 10, scores that indicate democracy.

29
Ethnic Fractionalization
Ethnic fractionalization is another factor that is frequently used as a control variable in studies of
corruption. There is evidence that conflicts within a country between ethnic groups make effective
policymaking more difficult and allow for the presence of corruption (Alesina et al. 2003). Fur-
thermore, this factor is theoretically relevant for this study, as ethnic fractionalization would poten-
tially pose challenges to the horizontal communication and cooperation that this paper argues is an
important component of the bottom-up pressure against corruption. The measure for this variable
was taken from Alesina et al. (2003) in the QoG dataset.
Openness to trade
Openness to trade has been identified as having an important influence on levels of corruption
(Sandholz & Gray 2003). There is evidence that integrating into the international community helps
to lower levels of corruption through both economic incentives and normative pressures. As sug-
gested by Sandholz & Gray, this paper uses the World Bank Development Index measure for trade
as a percentage of GDP, calculated by totaling all imports and exports and dividing by total GDP
(World Bank 2015) in the QoG dataset.
Press freedom
As discussed in the theoretical framework above, the relationship between press freedom and levels
of corruption is well established. A free press plays an important role in reducing levels of corrup-
tion, bringing to light incidents and allowing the citizenry to stay well informed about abuses of
power. In turn, this allows citizens to demand accountability, vote responsibly in democratic coun-
tries, and apply bottom-up pressure to individuals and institutions. Because of the strong relation-
ship between a free press and levels of corruption, this is controlled for in the models. Freedom of
Press ratings are taken from Freedom House (2015) in the QoG dataset.
QoG/Corruption measures from 1996
One of limitations of this cross-sectional study, as discussed in the Methodology section below, is
that causality is not possible to establish. However, in the models that investigate ICRG QoG and
Control of Corruption as the dependent variable, measurements of these variables from 1996 were
included as control variables (PRS Group and others n.d.; World Bank 2015). This method was

30
used in a previous study of the effect of civil society on levels of corruption (Grimes 2012), and is
intended to help address potential concerns with reverse causality and possible exogenous factors.
This control for these particular dependent variables was included for several reasons. First, these
two measures serve as the two primary high-level indicators of levels of corruption and are reliable
measures. Second, these two measures had data on a sufficiently large number of countries for this
past measure, which was not true for the other measures. Third, 1996 was an optimal year not only
because this specific measure was used in a previous study, but also because Internet Explorer was
first bundled with Windows 95 by Microsoft in 1996 (Network World 2015). As the first internet
browser to be included in what was by far the most popular operating system at the time7, this
marked one of the commonly accepted points where the internet became “mainstream” and ush-
ered in a new era of consumer-level access to the new World Wide Web. Choosing a measurement
of corruption in 1996 is an ideal way of marking corruption levels just as the internet era began,
providing a more reliable way to attempt a measure of the possible impact the internet has had on
corruption from 1996 to today.
Methodology
The following sections describe the methodology used in this quantitative study. This study uses an
OLS multiple regression using the variables described above. The first section addresses both the
power and limitations of this method, while the second section details the models used in the anal-
yses.
Samples
In order to best examine global trends, especially with the disparity of levels of internet access in
different countries, a cross-sectional approach for all available countries was used. One reason for
this approach is that reliable data about the extent of internet access is limited to the country level
in many places. Countries that do provide finer-grain detail about internet users and access are of-
ten countries less challenged by corruption relative to the rest of the world, so a country-level anal-
ysis was the best approach in order to also include places that face greater problems with corrup-
tion. Another reason is that censorship online is generally implemented country-wide by
7 Internet Explorer would become and remain the most widely used internet browser for the following decade and a half
(StatCounter 2016).

31
governments, so the available data only allowed for this approach.
Because data was missing for certain countries in each variable, not every country could be included
in the samples used. However, the samples are representative of large parts of the world, covering
most countries in all regions of the world. For the ICRG QoG variable, the analyses drew from a
sample of 118 countries. A larger sample of 144 countries was used for all other dependent varia-
bles. In both cases, the excluded countries were primarily low-population nations, often island na-
tions, with a number of other countries excluded from each region. Figures 1 and 2, seen below, are
maps that show the countries included in each sample, respectively. In some models, outliers were
excluded and are discussed in the Empirical Results section. All outliers are also listed individually
in the tables for each model in the Empirical Results section.
FIGURE 3, SAMPLE COUNTRIES FOR ICRG QOG

32
FIGURE 4, SAMPLE COUNTRIES FOR ALL OTHER DVS
Models
Each of the seven QoG/corruption dependent variables used in this study is approached similarly.
In each analysis, a multiple regression model is employed that adds one new variable to each subse-
quent model, beginning with internet use, then adding censorship, the interaction term, and each
control variable.
The multiple dependent variables serve as a robustness test for this data, but they also provide evi-
dence related to the theoretical underpinnings of this paper. The dependent variables begin on the
highest level of QoG, then work downward to the lowest-level concepts of corruption that relate to
the theories guiding this study. The first model makes use of the ICRG QoG variable, which is the
most complex of the dependent variables and includes measures for bureaucracy and legal aspects
in addition to corruption. From there, the models use Control of Corruption, which is more “pure”
in that it only covers corruption, but is also a higher-level measure. The tests then proceed to the
Varieties of Democracy measures, starting at the combined Political Corruption measure, then in-
vestigating the individual aspects of corruption that make up that measure: Executive, Legislative,
Judicial, and Public Sector. These low-level measures allow for a better understanding of how in-
ternet use and censorship relate to different kinds of corruption that are experienced on the indi-
vidual level by citizens.

33
Strengths and limitations of the methodology
As discussed earlier, a quantitative analysis was chosen for this study because of the nature of the
issues being investigated. My interest in this topic concerns the current global trends regarding cor-
ruption and the impact of the proliferation of internet access around the world. For this reason, a
large-N study was the most logical approach. In the event that the quantitative findings supported
the hypotheses, qualitative investigations would serve well as follow-up analyses for a more detailed
understanding of this relationship under certain national contexts.
A cross-sectional analysis of this size was chosen over time-series analysis for this study for a num-
ber of reasons. First, the interaction effect investigated in this study does not appear to have been
used before, based on the review of the body of literature, so it was of interest to first establish in
this paper whether this relationship between internet use, censorship, and corruption existed at all.
Second, changes in how some of the primary corruption measures are gathered and the relative
consistency of corruption measures over time in many places can make time-series analysis difficult.
Third, some aspects of the censorship issue that are likely to be important to account for in a time-
series analysis, such as the recent proliferation of anonymizing technologies, and the relative lack of
available data on these issues posed challenges that were beyond the scope of this paper8. Fourth,
this paper follows the findings of previous literature, both empirically and theoretically, which fur-
ther justifies the use of a cross-sectional analysis.
Unfortunately – even with the support of previous literature – without a time-series analysis, causa-
tion is impossible to establish. Nevertheless, this study implements measures that attempt to com-
pensate for this problem. First, several measures of QoG and corruption are used as dependent
variables, which makes for more robust findings. Second, if only QoG was being measured, the
criticism could be made that reverse causation explains the findings: good government provides
internet access and does not censor. For this reason, multiple aspects of corruption are analyzed in
this paper, which are theoretically more likely to be impacted by internet use and freedom from
censorship. Third, as discussed above, dependent variable measures from 1996 were included in
some models to address concerns of potential reverse causality.
8 These issues are discussed in more detail in the Conclusions section.

34
High correlations are also a concern in the study of these issues. Because of the strong theoretical
and empirical relationship between the economic conditions in a country and the level of corrup-
tion it experiences, it is necessary to control for this factor. However, the number of internet users
in a country is correlated with these economic indicators. Countries with more wealth and greater
technical resources are obviously better equipped to invest and build in the necessary infrastructure
that is required to provide a communications network that connects its citizens. This is especially
true in places with largely rural areas, even in the most developed countries, where there are finan-
cial challenges in building these communications networks and extending access to all people. Fur-
thermore, citizens in wealthier countries are better able to afford the costs of internet access. It is
impossible to completely separate these two factors, so we must accept some limitation in the pow-
er of these models. Numerous alternative measures of economic conditions were considered, but
all had similarly high correlations with the number of internet users. Supported by the widespread
use of the variable as a measurement of economic development in studies of corruption, GDP per
capita (PPP) was ultimately employed in this study. Multicollinearity tests for this measure in the
models were within acceptable ranges.
Another strong correlation exists between press freedom and internet censorship. It seems obvious
that governments that restrict freedom of the press are more likely to restrict freedom online as
well, leading to a high correlation between these variables. However, a large body of work has ex-
amined the strong theoretical and empirical relationship between press freedom and corruption, so
it is again necessary to control for this factor here. However, multicollinearity tests for this measure
in the models were within acceptable ranges.
There are other factors that could further strengthen the models used in this study. However, some
of these factors are beyond the scope of this paper or the currently available data for these very
recent issues. Some of these limitations are addressed in detail in the Conclusion during the discus-
sion about paths ahead for future research.

35
EMPIRICAL RESULTS AND ANALYSIS
The results of the multiple regression analysis are presented in the following sections. Through
multiple regression, the analysis tests the relationship between levels of internet use and levels of
corruption by country, and what effect, if any, government censorship of the internet has on this
relationship. The analysis is presented progressively through a series of models that follow the theo-
retical framework.
In the first section that follows, validity and reliability tests of the models are discussed. In the sec-
ond section, the results of the models are presented and analyzed. In the third section, the results
are discussed in greater detail.
Validity and reliability checks
In the following sections, the standard tests for validity and reliability of linear regression are dis-
cussed. It is important that the regression models meet all of the assumptions discussed below.
Additional details about these assumptions are presented in Appendix A.
Normal Distribution of Variables
Most variables were distributed normally, but two variables were skewed: GDP per capita (PPP) and
Freedom from internet censorship. The necessary steps for log transformations were performed on both
of these. The transformed variables did not have perfect normal distributions, but the results are
sufficient for a regression analysis without affecting the results significantly.
Linearity
All models were tested for linearity. Variables were tested for linear relationships with the depend-
ent variables and were acceptably so.
Outliers
Each set of models exploring a dependent variable was checked for outliers. This was tested by
plotting Studentized Deleted Residuals vs. Centered Leverage Values. Any cases that fell outside of

36
the range of 3.00 and -3.00 for Studentized Deleted Residuals were deemed outliers. Cases with
large Centered Leverage Values were also considered in relationship to Studentized Deleted Resid-
uals, but none had undue influence on the models. Other tests for outliers were also considered,
but were deemed overly aggressive and resulted in an unacceptable number of cases labeled as out-
liers, potentially affecting the reliability of the results. When possible, all cases were left in the mod-
els and not all sets of models had outliers. Any outliers that were removed are indicated in the table
notes for the tests of each dependent variable. Alternate versions of the regressions that include the
outliers were also produced and are included in Appendix A.
Multicollinearity
Correlations were checked for all variables. As discussed earlier, strong correlations exist between
several variables: internet use and GDP per capita (PPP), and internet censorship and freedom of
the press. The connection between these variables is clear, but economic development and press
freedom have strong theoretical and empirical relationships with corruption that are well estab-
lished and these controls are used in the majority of corruption studies, so they were deemed neces-
sary for this study. A number of alternative variables that controlled for these factors and had been
established in past literature were all considered. The ones used in this study were chosen on the
basis of having a combination of the lowest correlation with the IVs and the largest number of
cases.
While correlation was a concern, all variables were checked for multicollinearity within the models
and there is no evidence that the correlations had a significant effect on the models. Because of the
interaction effect used in the models, there was some multicollinearity between the IVs and the
Interaction Term, which was expected and is acceptable because they use the same base variables.
All other variables passed the test for multicollinearity, having a Tolerance > .200 and a VIF > 5.00.
Normality of the Distribution of Errors
The errors for the models were all distributed normally and fell within the acceptable range. The
means for these were nearly 0 and the standard deviations fell between 1 and -1. P-P plots were
generated for all models and, while some deviated slightly from the ideal, all fell within the accepta-
ble range and did not reveal any significant problems. Histograms and P-P plots can be found in
Appendix A.
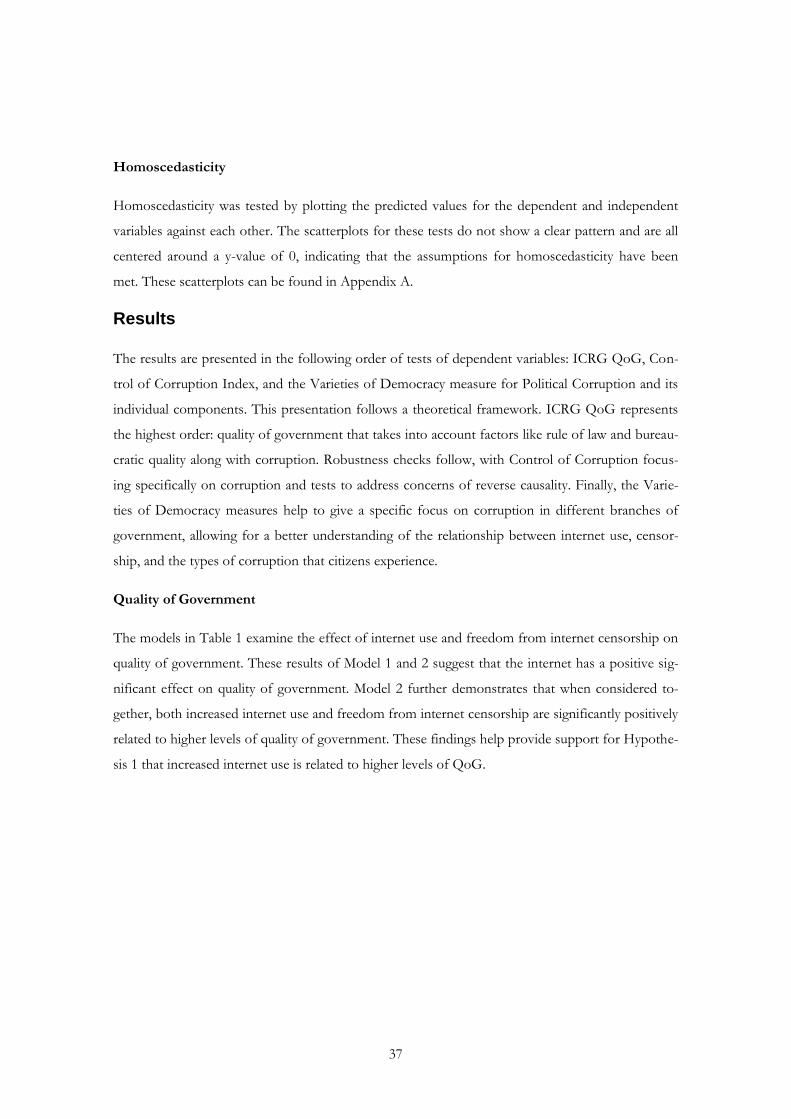
37
Homoscedasticity
Homoscedasticity was tested by plotting the predicted values for the dependent and independent
variables against each other. The scatterplots for these tests do not show a clear pattern and are all
centered around a y-value of 0, indicating that the assumptions for homoscedasticity have been
met. These scatterplots can be found in Appendix A.
Results
The results are presented in the following order of tests of dependent variables: ICRG QoG, Con-
trol of Corruption Index, and the Varieties of Democracy measure for Political Corruption and its
individual components. This presentation follows a theoretical framework. ICRG QoG represents
the highest order: quality of government that takes into account factors like rule of law and bureau-
cratic quality along with corruption. Robustness checks follow, with Control of Corruption focus-
ing specifically on corruption and tests to address concerns of reverse causality. Finally, the Varie-
ties of Democracy measures help to give a specific focus on corruption in different branches of
government, allowing for a better understanding of the relationship between internet use, censor-
ship, and the types of corruption that citizens experience.
Quality of Government
The models in Table 1 examine the effect of internet use and freedom from internet censorship on
quality of government. These results of Model 1 and 2 suggest that the internet has a positive sig-
nificant effect on quality of government. Model 2 further demonstrates that when considered to-
gether, both increased internet use and freedom from internet censorship are significantly positively
related to higher levels of quality of government. These findings help provide support for Hypothe-
sis 1 that increased internet use is related to higher levels of QoG.

38
TABLE 1, MULTIPLE REGRESSION (OLS). THE EFFECT OF THE NUMBER OF INTERNET USERS
AND INTERNET CENSORSHIP ON THE QUALITY OF GOVERNMENT.
DV: ICRG Quality of Government (0-1)
Model 1 Model 2 Model 3 Model 4 Model 5 Model 6 Model 7 Model 8 Model 9
Internet users (per 100) .006*** .005*** -.007** -.009** -.009*** -.007** -.007** -.007** -.007**
(.000) (.000) (.003) (.003) (.003) (.003) (.003) (.003) (.003)
Freedom from internet - .057* -.175** -.169** -.184** -.177** -.178** -.181** -.232***
censorship (ln) - (.032) (.056) (.055) (.053) (.051) (.052) (.052) (.057)
Internet use * Internet - - .005*** .005*** .006*** .005*** .005*** .005*** .005***
censorship (ln) - - (.001) (.001) (.001) (.001) (.001) (.001) (.001)
GDP per capita, PPP (ln)
- - - .032* .030* .024 .023 .023 .027*
- - - (.016) (.015) (.015) (.015) (.015) (.015)
British colonies - - - - .077** .062** .063** .063** .059*
- - - - (.023) (.023) (.023) (.023) (.023)
Years of democracy since
- - - - - .002** .002** .002** .001*
1930 - - - - - (.000) (.000) (.001) (.001)
Ethnic fractionalization - - - - - - -.018 -.019 -.020
(0-1) - - - - - - (.042) (.043) (.042)
Openness to trade - - - - - - - .000 .000
- - - - - - - (.000) (.000)
Freedom of press status - - - - - - - - .046*
(1-3) - - - - - - - - (.023)
Constant .289*** .173* .696*** .436* .458** .479** .498** .496 .512**
(.019) (.067) (.124) (.177) (.170) (.164) (.171) (.171) (.169)
R2
.672 .681 .735 .745 .767 .787 .787 .788 .796
N 117 117 117 117 117 117 117 117 117
*p<.10; **p<.01; ***p<.001. Standard errors within parentheses. Outlier Venezuela removed.

39
Before interpreting the effect of the interaction term introduced in Model 3, it is important to note
a condition that impacts the reading of all findings. The effect of the interaction term is understood
through a reading of the variables that comprise it. In models that include the interaction term, the
coefficient for internet users describes what happens to QoG levels when freedom from internet
censorship is 0 (meaning censorship is most severe), and the coefficient for freedom from internet
censorship describes what happens to QoG levels when internet users is 0. However, there logically
cannot be a situation where there are no internet users but there is online censorship, so the focus
will primarily be on the results for internet users and the interaction term.
With the introduction of the interaction term in Model 3, both internet use and freedom from in-
ternet censorship begin to have a significant negative coefficient across all remaining models, while
the interaction term maintains a positive significant coefficient across those models. This indicates
that when the number of internet users increases under conditions of severe online censorship, we
can expect that to see lower levels of quality of government. This effect is relatively consistent
across models. From this, we would expect that in countries with higher levels of internet access
but also more online censorship, we will find lower levels of QoG.
While it is possible to draw conclusions about the direction of this relationship based on these re-
sults, detailed interpretation of the coefficient is challenging due to the inclusion of two continuous
variables, one of which is logged, in the interaction term. In order to better understand the interac-
tion effect, a graph of the marginal effects was created. Figure 3 shows the marginal effects of the
number of internet users under different levels of online censorship for the QoG measure9. In that
figure, we see that internet use only begins to have a significant positive effect on quality of gov-
ernment when levels of freedom from internet censorship are around 2 (logged measure). For the
untransformed original censorship variable presented on an ordinal scale, this represents a score of
around 2.5. While the original scale is divided by whole numbers, this roughly corresponds with a
situation where there is some degree of censorship online, but some sites that are critical of the
government are allowed.
9 The figure uses the beta coefficients of the regression model with a 95 percent confidence interval. The data comes
from Model 9 in Table 1.

40
Prior to this level of freedom from internet censorship, increased internet use appears to reduce
quality of government. Only after crossing this threshold can we expect that increases in internet
use will be related to better quality of government. Around this score of 2, increased internet use
has a weak positive effect on quality of government. However, as freedom from internet censorship
increases, the relationship between internet use and quality of government grows stronger. In ideal
situations with the greatest degree of freedom from internet censorship, Figure 3 suggests that
when there is a 1% increase in the number of internet users we can expect to see an increase of
around .007 on the QoG scale. This is a modest but meaningful effect.
FIGURE 3, MARGINAL EFFECTS OF INTERNET USE ON QUALITY OF GOVERNMENT AT DIFFER-
ENT LEVELS OF FREEDOM FROM ONLINE CENSORSHIP

41
The results of this set of models provide support for the Hypotheses 1 and 2. We see evidence that
increased internet use has a positive relationship with quality of government, but that this relation-
ship is contingent upon the level of online censorship. However, it is impossible to assume causali-
ty. Furthermore, a reasonable objection could be made, positing that it is instead good government
that leads to increased internet access and low levels of censorship. While an opposing theory such
as this cannot be rejected without a time-series analysis, checks for robustness and a partial ac-
counting for causality in order to address this possibility were performed and are described in the
sections that follow.
Robustness Checks
The test for robustness using Control of Corruption, seen in Tables 2, shows similar results to
those seen for QoG. We find in Models 1 and 2 that increased internet use and low levels of cen-
sorship online have significant positive relationships with lower levels of corruption. However,
when the interaction term is introduced in Model 3, these relationships again become negative,
suggesting that higher levels of internet use under systems that censor heavily are related to in-
creased levels of corruption. This interaction effect remains significant even after controlling for
what are the significant effects of democracy and press freedom.
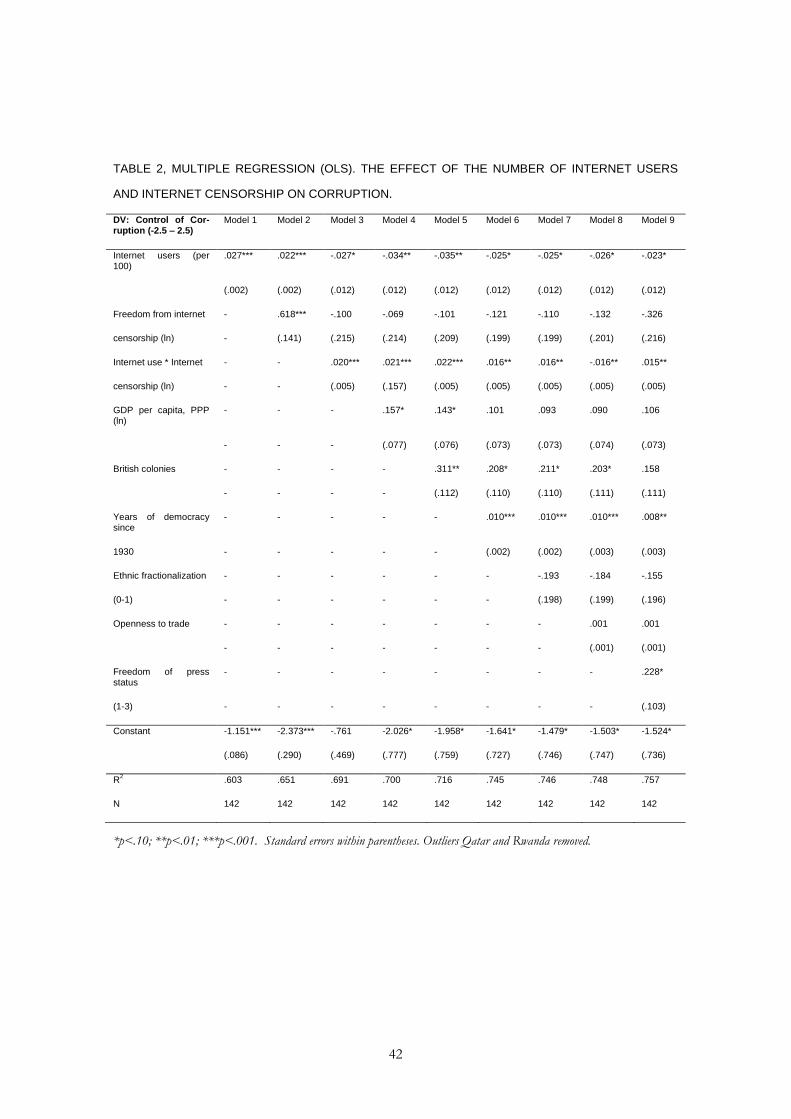
42
TABLE 2, MULTIPLE REGRESSION (OLS). THE EFFECT OF THE NUMBER OF INTERNET USERS
AND INTERNET CENSORSHIP ON CORRUPTION.
DV: Control of Cor-ruption (-2.5 – 2.5)
Model 1 Model 2 Model 3 Model 4 Model 5 Model 6 Model 7 Model 8 Model 9
Internet users (per 100)
.027*** .022*** -.027* -.034** -.035** -.025* -.025* -.026* -.023*
(.002) (.002) (.012) (.012) (.012) (.012) (.012) (.012) (.012)
Freedom from internet - .618*** -.100 -.069 -.101 -.121 -.110 -.132 -.326
censorship (ln) - (.141) (.215) (.214) (.209) (.199) (.199) (.201) (.216)
Internet use * Internet - - .020*** .021*** .022*** .016** .016** -.016** .015**
censorship (ln) - - (.005) (.157) (.005) (.005) (.005) (.005) (.005)
GDP per capita, PPP (ln)
- - - .157* .143* .101 .093 .090 .106
- - - (.077) (.076) (.073) (.073) (.074) (.073)
British colonies - - - - .311** .208* .211* .203* .158
- - - - (.112) (.110) (.110) (.111) (.111)
Years of democracy since
- - - - - .010*** .010*** .010*** .008**
1930 - - - - - (.002) (.002) (.003) (.003)
Ethnic fractionalization - - - - - - -.193 -.184 -.155
(0-1) - - - - - - (.198) (.199) (.196)
Openness to trade - - - - - - - .001 .001
- - - - - - - (.001) (.001)
Freedom of press status
- - - - - - - - .228*
(1-3) - - - - - - - - (.103)
Constant -1.151*** -2.373*** -.761 -2.026* -1.958* -1.641* -1.479* -1.503* -1.524*
(.086) (.290) (.469) (.777) (.759) (.727) (.746) (.747) (.736)
R2
.603 .651 .691 .700 .716 .745 .746 .748 .757
N 142 142 142 142 142 142 142 142 142
*p<.10; **p<.01; ***p<.001. Standard errors within parentheses. Outliers Qatar and Rwanda removed.

43
In order to better understand this interaction effect, the marginal effects are again graphed. Figure 4
shows the marginal effects of the number of internet users under different levels of online censor-
ship for the Control of Corruption measure10. We see again that increased internet use is related to
higher levels of corruption until a freedom from internet corruption score of 2 is achieved (logged
measure). However, after crossing this threshold, increased internet use appears to have a progres-
sively stronger relationship with lower levels of corruption. In ideal situations with the greatest
degree of freedom from online censorship, when there is a 1% increase in the number of internet
users we can expect to see an increase of .02 on the Control of Corruption scale. This is again a
modest yet significant effect and is slightly stronger than that seen with QoG.
FIGURE 4, MARGINAL EFFECTS OF INTERNET USE ON CONTROL OF CORRUPTION AT DIFFER-
ENT LEVELS OF FREEDOM FROM ONLINE CENSORSHIP
10 The figure uses the beta coefficients of the regression model with a 95 percent confidence interval. The data comes
from Model 9 in Table 2.

44
The results of this test continue to provide support for Hypotheses 1 and 2. However, we cannot
determine the direction of the relationship or establish causality.
Causality Checks
In order to partially account for the possibility of reverse causality in these relationships, additional
sets of models were created for both the ICRG QoG and Control of Corruption dependent varia-
bles. These sets of models include measures of the respective dependent variable taken from 1996,
prior to the proliferation of internet access around the world. This variable is used as a control to
account for the influence of previous levels of corruption on current level of corruption.
In the set of models for QoG in Table 3 below, we see that the results are similar to the models in
Table 1, resulting in significant effects for all independent variables. In Model 10, the interaction
effect continues to show a significant positive effect, while internet use shows a negative positive
effect, indicating that we are seeing the same relationships observed in other models. These effects
are not as strong as those seen in Table 1, but they hold up and maintain significance despite the
control for quality of government levels in 1996. While this does not dispel the possibility of re-
verse causality being a factor, it does help to further provide support for the idea that higher levels
of internet access with low levels of censorship help to create quality of government.

45
TABLE 3, MULTIPLE REGRESSION (OLS). THE EFFECT OF THE NUMBER OF INTERNET USERS
AND INTERNET CENSORSHIP ON THE QUALITY OF GOVERNMENT.
DV: ICRG Quality of Government (0-1)
Model 1 Model 2 Model 3 Model 4 Model 5 Model 6 Model 7 Model 8 Model 9 Model 10
Internet users .006*** .006*** -.006* -.007* -.008** -.006* -.006* -.007* -.007* -.004*
(per 100) (.000) (.000) (.003) (.003) (.003) (.003) (.003) (.003) (.003) (.002)
Freedom from internet - .042 -.163** -.160** -.174** -.172** -.173** -.180** -.237*** -.149**
censorship (ln) - (.033) (.056) (.056) (.054) (.053) (.053) (.054) (.060) (.053)
Internet use * Internet - - .005*** .005*** .005*** .005*** .005*** .005*** .005*** .003**
censorship (ln) - - (.001) (.001) (.001) (.001) (.001) (.001) (.001) (.001)
GDP per capita, PPP - - - .026 .024 .021 .020 .020 .025 .010
(ln) - - - (.016) (.015) (.015) (.015) (.015) (.015) (.013)
British colonies - - - - .068** .057* .059* .059* .055* .033
- - - - (.024) (.024) (.024) (.024) (.024) (.020)
Years of democracy - - - - - .001* .001* .001* .001* .000
since 1930 - - - - - (.001) (.001) (.001) (.001) (.000)
Ethnic fractionalization - - - - - - -.021 -.022 -.020 -.030
(0-1) - - - - - - (.045) (.045) (.045) (.038)
Openness to trade - - - - - - - .000 .000 .000
- - - - - - - (.000) (.000) (.000)
Freedom of press - - - - - - - - .049* .040*
status (1-3) - - - - - - - - (.024) (.021)
ICRG QoG 1996 - - - - - - - - - .439***
- - - - - - - - - (.069)
Constant .293*** .207** .669*** .464* .482** .496** .518** .513** .527** .322*
(.018) (.070) (.124) (.177) (.171) (.168) (.175) (.175) (.173) (.149)
R2
.708 .713 .758 .764 .782 .793 .793 .795 .803 .862
N 106 106 106 106 106 106 106 106 106 106
*p<.10; **p<.01; ***p<.001. Standard errors within parentheses. Outlier Venezuela removed.

46
However, the results of the Control of Corruption causality check do not help to clarify this matter.
Seen in Table 4 below, no independent or control variables have significant effects in the full mod-
el, including ones that were significant in Table 2. These results do not provide support for the
hypothesis, although they also offer no further clarity about the effect of other factors. However,
another study that used this same method indicated that because Control of Corruption is a stand-
ardized measure, it can be an unreliable variable for this procedure because it is a standardized vari-
able and less likely to show actual changes over time (Grimes 2012). We are unfortunately left
without a firm answer regarding causality.

47
TABLE 4, MULTIPLE REGRESSION (OLS). THE EFFECT OF THE NUMBER OF INTERNET USERS
AND INTERNET CENSORSHIP ON CORRUPTION.
DV: Control of Corrup-tion (0-1)
Model 1 Model 2 Model 3 Model 4 Model 5 Model 6 Model 7 Model 8 Model 9 Model 10
Internet users .027*** .023*** -.027* -.035** -.036** -.025* -.026* -.027* -.024* -.002
(per 100) (.002) (.002) (.012) (.012) (.012) (.012) (.012) (.012) (.012) (.009)
Freedom from internet - .600*** -.128 -.096 -.136 -.163 -.154 -.179 -.365* .108
censorship (ln) - (.142) (.216) (.214) (.210) (.199) (.200) (.201) (.218) (.176)
Internet use * Internet - - .021*** .021*** .022*** .017** .017** .017** .015** .004
censorship (ln) - - (.005) (.005) (.005) (.005) (.005) (.005) (.005) (.004)
GDP per capita, PPP - - - .162* .146* .103 .094 .090 .102 .032
(ln) - - - (.077) (.076) (.073) (.073) (.073) (.073) (.057)
British colonies - - - - .313** .214* .219* .213* .176 .010
- - - - (.113) (.110) (.110) (.111) (.111) (.087)
Years of democracy - - - - - .010*** .010*** .010*** .009** .002
since 1930 - - - - - (.002) (.002) (.003) (.003) (.002)
Ethnic fractionalization - - - - - - -.181 -.177 -.170 -.071
(0-1) - - - - - - (.201) (.210) (.199) (.154)
Openness to trade - - - - - - - .001 .001 .000
- - - - - - - (.001) (.001) (.001)
Freedom of press status - - - - - - - - .219* .055
(1-3) - - - - - - - - (.106) (.084)
Control of Corruption - - - - - - - - - .550***
1996 - - - - - - - - - (.058)
Constant -1.168*** -2.351*** -.717 -2.025* -1.927* -1.582* -1.418* -1.429* -1.410* -1.059*
(.086) (.291) (.471) (.776) (.759) (.726) (.749) (.750) (.740) (.573)
R2
.610 .655 .696 .705 .721 .750 .752 .754 .761 .859
N 140 140 140 140 140 140 140 140 140 140
*p<.10; **p<.01; ***p<.001. Standard errors within parentheses. Outliers Qatar and Rwanda removed.

48
Varieties of Democracy Models
The sets of models tested in this section help to examine how the relationship between internet use
and online censorship potentially effects different kinds of corruption, helping to test Hypothesis 3.
The first model discussed examines Political Corruption, which is a combined measure of the sub-
sequent dependent variables for corruption in the executive, legislative, judicial, and public sector
branches.
The set of models for Political Corruption in Table 5 below show a significant relationship for the
interaction term across all models, as was expected. While Control of Corruption was both created
differently, it examines both grand and petty corruption. We therefore approach this test expecting
that the Political Corruption captures similar factors through combining the types of corruption
seen in all branches of government. Because of this, we can expect that the effects would hold
across these models as well.
As expected, we see that Models 1 and 2 show that an increase in internet use has a significant posi-
tive relationship with lower levels of corruption. In Model 3, with the introduction of the interac-
tion term, we again see that internet use begins to have a negative relationship with lower levels of
corruption, although this effect is not significant in these models. The interaction term again shows
a significant positive effect with lower levels of corruption, indicating that we are seeing the same
effect as in previous models. This provides additional support for both Hypotheses 1 and 2.

49
TABLE 5, MULTIPLE REGRESSION (OLS). THE EFFECT OF THE NUMBER OF INTERNET USERS
AND INTERNET CENSORSHIP ON CORRUPTION.
DV: V-Dem Political Corruption (0-1)
Model 1 Model 2 Model 3 Model 4 Model 5 Model 6 Model 7 Model 8 Model 9
Internet users .007*** .006*** -.003 -.007* -.008* -.006 -.006 -.006* -.005
(per 100) (.001) (.001) (.003) (.004) (.003) (.003) (.003) (.003) (.003)
Freedom from internet - .184*** .043 .051 .033 .030 .036 .026 -.053
censorship (ln) - (.041) (.065) (.063) (.061) (.059) (.060) (.060) (.064)
Internet use * Internet - - .004** .004** .005*** .004** .004* .004** .003*
censorship (ln) - - (.001) (.001) (.001) (.001) (.001) (.001) (.001)
GDP per capita, PPP (ln) - - - .072** .064** .056* .055* .053* .060**
- - - (.023) (.022) (.022) (.022) (.022) (.021)
British colonies - - - - .120*** .100** .102** .099** .080*
- - - - (.033) (.033) (.033) (.033) (.033)
Years of democracy since - - - - - .002* .002* .002** .001*
1930 - - - - - (.001) (.001) (.001) (.001)
Ethnic fractionalization - - - - - - -.055 -.052 -.040
(0-1) - - - - - - (.059) (.059) (.058)
Openness to trade - - - - - - - .000 .000
- - - - - - - (.000) (.000)
Freedom of press status - - - - - - - - .094**
(1-3) - - - - - - - - (.031)
Constant .206** -.157* .157 -.404* -.349 -.294 -.259 -.267 -.276
(.025) (.084) (.140) (.225) (.216) (.213) (.217) (.216) (.210)
R2
.565 .620 .640 .663 .693 .707 .709 .712 .731
N 144 144 144 144 144 144 144 144 144
*p<.10; **p<.01; ***p<.001. Standard errors within parentheses.

50
The effect of internet use and online censorship is then tested against measures of corruption for
each branch of government. Table 6 shows tests that address the highest levels of government –
the Executive Corruption Index and the Legislative Corrupt Activities measures – and are intended
to test for how these factors relate to levels of grand corruption. As predicted for both of these
dependent variables, in Models 1 and 5, we see that increased internet use has a significant positive
relationship with lower levels of corruption. This effect continues in both Models 2 and 6 and we
see a significant positive relationship between freedom from internet censorship and lower levels of
corruption. In Models 3 and 7, we see a significant positive coefficient for the interaction term,
while internet use again becomes negative. The interaction term maintains significance in the full
models.

51
TABLE 6, MULTIPLE REGRESSION (OLS). THE EFFECT OF THE NUMBER OF INTERNET USERS
AND INTERNET CENSORSHIP ON CORRUPTION.
V-Dem Executive Corruption Index (0-1) V-Dem Legislative Corrupt Activities (0-4)
Model 1 Model 2 Model 3 Model 4 Model 5 Model 6 Model 7 Model 8
Internet users (per 100) .007*** .005*** -.004 -.005 .018*** .015*** -.020 -.014
(.001) (.001) (.004) (.004) (.002) (.002) (.012) (.013)
Freedom from internet - .254*** .115* .006 - .445** -.051 -.362
censorship (ln) - (.043) (.069) (.069) - (.147) (.227) (.245)
Internet use * Internet - - .004* .003* - - .014** .011*
censorship (ln) - - (.002) (.001) - - (.005) (.005)
GDP per capita, PPP (ln) - - - .057* - - - -.022
- - - (.023) - - - (.082)
British colonies - - - .049 - - - .212*
- - - (.036) - - - (.127)
Years of democracy since - - - .001* - - - .004
1930 - - - (.001) - - - (.003)
Ethnic fractionalization - - - -.042 - - - .110
(0-1) - - - (.063) - - - (.221)
Openness to trade - - - .000 - - - .001
- - - (.000) - - - (.001)
Freedom of press status - - - .115** - - - .238*
(1-3) - - - (.034) - - - (.118)
Constant .261*** -.239** .069 -.335 1.116*** .236 1.345** 1.509*
(.028) (.089) (.149) (.228) (.086) (.303) (.491) (.805)
R2
.488 .590 .608 .694 .405 .442 .472 .531
N 143 143 143 143 142 142 142 142
*p<.10; **p<.01; ***p<.001. Standard errors within parentheses. Models 1-4: Outlier Guyana removed. Models 5-8:
Outlier Saudi Arabia removed.

52
These tests in Table 6 continue to support Hypotheses 1 and 2, suggesting that increased internet
use is related to lower levels of corruption, but that this relationship is conditional upon the levels
of online censorship present. Furthermore, these results provide evidence that supports Hypothesis
3, suggesting that these relationships have a significant effect upon grand corruption of corruption
that is more visible on the national level.
The tests in Table 7 are intended to examine the effect of internet use and censorship on petty or
low-level corruption. These tests are conducted using the Judicial Corrupt Decisions measure and
the Public Sector Corruption Index. These tests provide mixed results.
The tests for the first three models of each corruption measure provide the same results seen in the
previous models. We see significant positive effects for internet use and freedom from internet
censorship in the first two models. The introduction of the interaction term results in a significant
positive coefficient for that variable, while the coefficient for internet use becomes negative (and
insignificant). However, these measures of corruption diverge in the full models.
The interaction term in the full model for the judicial corruption measure maintains a significant
positive coefficient, although this effect is not as strong as the one observed in the full model of the
legislative measure (measured along the same scale). However, the interaction term in the full mod-
el for public sector corruption is no longer significant. Instead, GDP per capita (PPP), Years of
Democracy, and Freedom of the Press status are the control variables that maintain significance in
this model.

53
TABLE 7, MULTIPLE REGRESSION (OLS). THE EFFECT OF THE NUMBER OF INTERNET USERS
AND INTERNET CENSORSHIP ON CORRUPTION.
V-Dem Judicial Corrupt Decisions (0-4) V-Dem Public Corruption Index (0-1)
Model 1 Model 2 Model 3 Model 4 Model 5 Model 6 Model 7 Model 8
Internet users (per 100) .026*** .021*** -.003 -.016 .008*** .006*** -.002 -.003
(.002) (.002) (.012) (.011) (.001) (.001) (.004) (.004)
Freedom from internet - .583*** .216 .010 - .211*** .079 -.032
censorship (ln) - (.138) (.222) (.206) - (.044) (.071) (.068)
Internet use * Internet - - .010* .010* - - .004* .002
censorship (ln) - - (.005) (.004) - - (.002) (.001)
GDP per capita, PPP (ln) - - - .251*** - - - .075***
- - - (.070) - - - (.022)
British colonies - - - .450*** - - - .051
- - - (.105) - - - (.034)
Years of democracy since - - - .005* - - - .002**
1930 - - - (.003) - - - (.001)
Ethnic fractionalization - - - -.395* - - - .023
(0-1) - - - (.184) - - - (.060)
Openness to trade - - - .001 - - - .000
- - - (.001) - - - (.000)
Freedom of press status - - - .185* - - - .115***
(1-3) - - - (.098) - - - (.032)
Constant 1.247*** .092 .909* -.860 .192*** -.226* .069 -.511*
(.084) (.284) (.480) (.670) (.028) (.090) (.154) (.225)
R2
.488 .590 .608 .694 .405 .442 .472 .531
N 143 143 143 143 142 142 142 142
*p<.10; **p<.01; ***p<.001. Standard errors within parentheses. Models 1-4: Outlier Cuba removed. Models 5-8: Outlier
Rwanda removed.

54
These mixed results suggest that there is something different happening at the more local level of
corruption. However, the results are somewhat inconclusive. The results suggest that this interac-
tion between internet use and online censorship has a meaningful relationship with judicial corrup-
tion. However, there is no evidence for this relationship in regards to administrative or more street-
level corruption. These results provide some support for Hypothesis 3, but these results are dis-
cussed in more detail in the following section.
Discussion
Overall, the results above support Hypotheses 1 and 2. While the precise effect of internet use and
online censorship on quality of government and levels of corruption varies across models and de-
pendent variables, the results are significant and are largely consistent. Observed on their own,
increased internet use and lower levels of online censorship have a significant positive relationship
with higher quality of government and lower levels of corruption. However, the results for models
with the interaction term demonstrate that this relationship is conditional. Under more extreme
censorship, higher levels of internet use are not only ineffective at reducing corruption, they are
related to higher levels of corruption. It appears that it is not until a certain level of freedom from
internet censorship is established – roughly corresponding to environments where some criticism
of the government online is tolerated – that increases in internet use have the potential to reduce
corruption. Based on these results, we reject the null hypotheses that there is no relationship be-
tween these factors and levels of corruption.
Furthermore, these results support Hypothesis 3. Based on the evidence presented here, increased
internet use under adequate levels of freedom from internet censorship is related to lower levels of
grand corruption. There is also evidence that these factors do not have a significant effect on petty
corruption. While tests for judicial corruption were significant – albeit not as strong as the grand
corruption measures – there are also explanations that can address this discrepancy.

55
One possible reason for these results is that the judicial branch is often used as a way to hold offi-
cials in the executive and legislative branch accountable for corrupt behaviors (Treisman 2000). The
judicial branch therefore does not operate solely on the local level and would be more likely to
receive attention on the national level. At the national level, the internet – through the theoretical
mechanisms argued in this paper– plays a more useful role in addressing judicial corruption. Other
research links grand and petty corruption in the judicial branch (Mashali 2012), meaning that a
crossover effect could be seen. Despite the measure specifically addressing bribery in the judicial
branch, the internet mechanisms that would put pressure on judges to reduce corrupt behavior on
the national level could have the side effect of reducing attempts at bribery at the local level.
However, at the purely administrative and local level, we see that increased internet use and low
levels of censorship do not have a meaningful relationship with levels of corruption. At first glance,
it seems confusing why the internet does not also provide the same benefits at the local level. There
is a certain common sense to the notion that increased internet use and low censorship online
would have the biggest impact on corruption in local level bureaucracy, where the public interacts
most with their government. Intuitively, it seems that the internet would help people in communi-
ties to connect, communicate, and collectively apply pressure to incidents of corruption. However,
upon closer examination through the theoretical framework advanced in this study, this mechanism
at the local level is actually not so effective.
Instead, it makes more sense that other factors would be more important at the local and bureau-
cratic level. At the local level, the interaction of internet and censorship is probably less likely to be
an important factor in enhancing the press, providing a horizontal communication platform, and
allowing social openness to international norms. Instead, what is more likely to be most effective at
this level is the existence of a free and active local press that informs communities about incidents
of corruption, neighbors being able and willing to coordinate, democratic mechanisms in place that
can help the public make corrections to the system when possible, and the economic resources to
pay civil servants an adequate wage that reduces the incentive to seek bribes and other abuses of
power for money. The results of the full model for public sector corruption and the control varia-
bles that are found to be significant are consistent with these aspects. While a free internet could
certainly be a tool for addressing corruption at the local and bureaucratic level, the mechanisms
argued in this paper seem unlikely to provide as much benefit at this level. This warrants a closer
look at the effectiveness of online initiatives like I Paid A Bribe, which focus on administrative-level

56
bribes, and the mechanisms that drive them. Based on the evidence provided above, we reject the
null hypothesis that increased internet use under low levels of online censorship has the same posi-
tive relationship with lower levels of all types of corruption.
However, while the findings support these hypotheses, they do not establish causality. The causality
test for ICRG QoG helps to address some concerns about reverse causality, but we cannot reject
the possibility that reverse causality might be the source of these results. It does, however, seem
reasonable that for quality of government there exists a two-way relationship. It is possible that
good governments – when the necessary factors and resources are available – are not only more
likely to work to increase internet access for their citizens, but are also less likely to censor online.
However, on the other hand, the results of this study and others also support the argument that
under systems that have high levels of internet use and low censorship, citizens, journalists, and
civil society are better equipped to apply pressure to their governments to maintain high levels of
bureaucratic quality, to respect the rule of law, and to avoid engaging in corrupt behaviors. It is
possible that both sides of these factors have influence on these systems.
The results are somewhat less clear regarding Control of Corruption. While the results above con-
tinue to support the relationships proposed in Hypotheses 1 and 2, the results of the causality test
are unclear. Insignificant results for all variables leave us unable to draw conclusions about the di-
rection of origin of the effect seen in the results. The argument that corruption directly limits inter-
net use or causes online censorship is not as strong, but time-series analyses will be required to find
answers to these questions.

57
CONCLUSIONS
The internet has the potential to act as a new form of press freedom that enhances earlier capabili-
ties, to help people communicate and coordinate in ways they never could before including across
borders, and to help open societies to new norms. All of these have the potential to reduce corrup-
tion as societies increasingly embrace a free and open internet. The evidence presented in this paper
supports these ideas. That evidence suggests that the ability of the internet to function in these
ways to curb corruption is directly impacted by government censorship efforts. Furthermore, it
appears that these mechanisms are most useful at the national level, addressing grand rather than
petty corruption.
The findings contribute to the current body of literature. As the first study examining this interac-
tion between internet use and online censorship, it uncovers interesting relationships that are wor-
thy of deeper investigation. The discovery that increased internet use under high levels of censor-
ship can potentially worsen corruption in a country helps to both the good and bad that the inter-
net can lead to. It is not a panacea that will cure all of society’s problems. But it can be a useful tool
for addressing both corruption and issues with democracy. The following sections will discuss
some of the policy implications and directions for future research.
Policy implication
While there are many reasons to continue spreading internet access – including education, demo-
cratic efforts, and simply connecting the world – the potential to help curb corruption adds just one
more reason to this growing list. But the results of this study show it goes beyond just spreading
the internet. Because the results suggest that censorship online negatively impacts the potential of
the internet to reduce corruption, greater effort should be placed on helping to reduce online cen-
sorship. This is obviously a challenging task.
Within countries, effort should be placed on keeping the internet free and open in order to help
keep corruption levels low. Between countries, effort should also be placed on promoting an inter-
national culture of free and open internet. Beyond that, creating opportunities that allow citizens of
more repressive countries to sidestep censorship and access the wider internet could be helpful.

58
Although it has been criticized for a number of reasons, the Tor network is an anonymizing system
online has been used by dissidents for years to access information and communicate in ways that
would not otherwise have been possible (Levine 2014). Ideally, governments and organizations
would invest in developing similar technologies in order to curb corruption.
The United Nations has already taken steps to recognize internet access as a right that must be
ensured in order to allow the proper exercise of other fundamental rights, such as freedom of ex-
pression (United Nations 2011). While there are some potentially serious problems to declaring
internet access a universal right, the discussion about this could help normalize the idea that inter
net access seems to increasingly be a necessity of life in the 21st century. Movements such as these
could help lead to the spread of internet access while at the same time enshrining in that spread of
access the principle of a free and open internet. The results of this study provide evidence that this
line of discussion should be pursued in the interest of fighting corruption around the globe.
Recommendations for future studies
Deeper and more nuanced investigations can help to better examine the subtle effects of this
mechanism. Beyond the measure of censorship used here, there are other factors that are likely to
complicate and affect this relationship.
A time-series analysis is the next logical step in examining this relationship. A number of factors
will help lead to a successful time-series analysis. One factor is the growing body of information
regarding the spread of the internet and its use. For a project of greater scope and resources, a bet-
ter accounting of the rapid spread of mobile internet access along with landline use will likely pro-
vide more interesting and accurate results in coming years. Another factor is finer-grain detail of
censorship online. The study of this topic is relatively new and there are several different organiza-
tions gathering data. For example, Freedom House has been slowly developing their own dataset of
internet freedom, but it is only in its fifth year and examines a rather low number of countries
(Freedom House 2016). Other organizations, such as the OpenNet Initiative and the US State De-
partment have put a focus on internet freedom and have been collecting data on the topic (Open-
Net Initiative 2016; HumanRights.Gov 2016).

59
Another factor that was not accounted for in this study was online surveillance. It has been sug-
gested that surveillance online acts as another kind of censorship that does not require the blocking
of websites (Liang & Lu 2010). Instead, under a surveillance system, there is evidence that citizens
self-censor due to concern that websites they visit, things they say, or people they communicate
with will have adverse consequences. The cumulative effect could be similar to that of “traditional”
censorship. This could have important implications for countries that have low levels of censor-
ship, but seemingly high levels of surveillance online, such as the United States. As more data be-
comes available about the effect and use of surveillance as a censorship tool, it will be important to
account for this in future studies.
The increasing use of VPNs, Tor, and other anonymizing technologies will likely have an important
influence on the relationships explored in this paper. The measure of censorship used in this study
partially accounts for these factors, providing a rating category for countries that censor extensively,
but where the citizens are able to sometimes circumvent this censorship. Yet, for example, in the
raw ordinal data for the censorship measure, China is included in the category of countries that
censor extensively but users cannot circumvent the censorship. In recent years, however, the Tor
network and other anonymizing technologies have provided Chinese citizens with a means to get
around the Great Firewall of China and access political information – including details about cor-
ruption – that the Chinese government wishes to prevent them seeing. Currently, accurate data
about these technologies is understandably difficult to come by. If and when accurate data becomes
available, it will be useful to incorporate this into future studies on these topics in order to get a
more accurate picture of the effects studied here.
Other issues are also worthy of consideration, such as how treatment and laws regarding whistle-
blowers affects the internet’s potential, what conditions contribute to the internet becoming an
echo chamber where people only see and hear what they want, and what happens when sites like
Wikileaks become politicized. There are many directions to take future research and many factors
to consider.
Final Remarks
The results of this study provide support for the idea that increasing internet access could be help-
ing to reduce corruption, but that the level of censorship within countries has a significant effect on

60
this relationship. However, there are other conditions that also play an important role to in this
equation, including economic development, free press, and democratic traditions. Furthermore,
additional studies are required in order to truly establish the direction of this relationship.
Time will tell whether these observed effects are consistent. If so, they offer some hope for bot-
tom-up efforts working to tackle corruption. Yet challenges lie ahead for those hoping to use the
internet as a tool for positive change. Increases in surveillance, crackdowns on whistleblowers, the
development of echo chambers, and the use of the internet as a tool to instead muddy the waters of
objective information all could lead to the internet doing more harm than good.

61
REFERENCES
Abbott, J. (2013). Introduction: Assessing the Social and Political Impact of the Internet and New
Social Media in Asia. Journal of Contemporary Asia, 43(4), 579-590.
Abbott, K.W. & Snidal, D. (2001). International ’standards’ and international governance. Journal of
European Public Policy, 8(3), 345-370.
Alesina, A., Devleeschauwer, A., Easterly, W., Kurlat, S., & Wacziarg, R. (2003). Fractionalization.
Journal of Economic Growth, 8(2), 155-194.
Andersen, T.B. (2009). E-government as an anti-corruption strategy. Information Economics and Policy,
21, 201-210.
Andersen, T. B., Bentzen, J., Dalgaard, C. J., & Selaya, P. (2011). Does the Internet Reduce
Corruption? Evidence from U.S. States and Across Countries. The World Bank Economic Review, 25,
387-417.
Aron, L. (2011). Nyetizdat: How the Internet Is Building Civil Society in Russia. American Enterprise
Institute for Public Policy Research: Russia Outlook. Spring.
Bauhr, M. & Grimes, M. (2012). What is Government Transparency? New Measures and Relevance
for Quality of Government. Quality of Government Institute Working Paper Series, 2012(16).
Bauhr, M., & Nasiritousi, N. (2012). Resisting Transparency: Corruption, Legitimacy, and the
Quality of Global Environmental Policies. Global Environmental Politics, 12(4), 9-29.
Bertot, J. C., Jaeger, P. T., & Grimes, J. M. (2010). Using ICTs to create a culture of transparency:
E-government and social media as openness and anti-corruption tools for societies. Government
Information Quarterly, 27(3), 264-271.
Bertot, J. C., Jaeger, P. T., & Grimes, J. M. (2012). Promoting transparency and accountability
through ICTs, social media, and collaborative e-government. Transforming Government: People, Process
and Policy, 6(1), 78-91.

62
Bohler-Muller, N., & Van der Merwe, C. (2011). The potential of social media to influence socio-
political change on the African Continent. Policy Brief, Africa Institute, South Africa.
Brunetti, A., & Weder, B. (2003). A free press is bad news for corruption. Journal of Public Economics,
87(7), 1801-1824.
Bussell, J. (2011). Explaining Cross‐National Variation in Government Adoption of New
Technologies. International Studies Quarterly, 55(1), 267-280.
Charoensukmongkol, P., & Moqbel, M. (2014). Does investment in ICT curb or create more
corruption? A cross-country analysis. Public Organization Review, 14(1), 51-63.
Charron, N. (2009). The impact of socio-political integration and press freedom on corruption. The
Journal of Development Studies, 45(9), 1472-1493.
Charron, N., & Lapuente, V. (2010). Does democracy produce quality of government? European
Journal of Political Research, 49(4), 443-470.
Cornell, A., & Grimes, M. (2014). Disruptive Protests and Bureaucratic Structures in Latin America
and the Caribbean. Quality of Government Institute: Working Paper Series, 2014(04).
Dahlström, C. (2012). Bureaucracy and the different cures for grand and petty corruption. QoG
Working Paper Series, 2011(20).
Data.gov. (2016). The home of the U.S. Government’s open data. Data.gov.
Denyer, S. (2016, May 23). China’s scary lesson to the world: Censoring the Internet works. The
Washington Post. Retrieved from https://www.washingtonpost.com/world/asia_pacific/chinas-
scary-lesson-to-the-world-censoring-the-internet-works/2016/05/23/413afe78-fff3-11e5-8bb1-
f124a43f84dc_story.html.
Domonoske, C. (2016, April 5). Fallout from Panama Papers Echoes Around the World. NPR.
Retrieved from http://www.npr.org/sections/thetwo-way/2016/04/05/473115334/fallout-from-
panama-papers-echoes-around-the-world.
Elbahnasawy, N. G. (2014). E-government, internet adoption, and corruption: An empirical
investigation. World Development, 57, 114-126.

63
Färdigh, M. (2013a). What’s the use of a free media? The role of media in curbing corruption and
promoting quality of government (Ph.D.). University of Gothenburg.
Färdigh, M. A. (2013b). Free, Accessible Media and Quality of Government. Quality of Government
Institute: Working Paper Series, 2013(17).
Florini, A. M. (2002). Increasing transparency in government. International Journal on World Peace, 3-
37.
Fahrenthold, D. (2016a, October 3). Trump Foundation ordered to stop fundraising by N.Y.
attorney general’s office. The Washington Post. Retrieved from
https://www.washingtonpost.com/politics/trump-foundation-ordered-to-stop-fundraising-by-ny-
attorney-generals-office/2016/10/03/1d4d295a-8987-11e6-bff0-d53f592f176e_story.html.
Fahrenthold, D. (2016b, October 17). New York attorney general grants Trump Foundation more
time to file proper paperwork, comply with state charity laws. The Washington Post. Retrieved
from https://www.washingtonpost.com/news/post-politics/wp/2016/10/17/new-york-attorney-
general-grants-trump-foundation-more-time-to-file-proper-paperwork-comply-with-state-charity-
laws/.
Freedom House. (2016). Freedom on the Net 2015. Freedom House. Retrieved from
https://freedomhouse.org/report/freedom-net/freedom-net-2015.
Freille, S., Haque, M. E., & Kneller, R. (2007). A contribution to the empirics of press freedom and
corruption. European Journal of Political Economy, 23(4), 838-862.
Galais, C., & Anduiza, E. (2011). The contextual conditionings of digital media effects on civic
attitudes. Presentation, ECPR General Conference, Rejkjavik.
Garcia-Murillo, M., & Vinod, H. D. (2005). Opening to the world: The effect of internet access on
corruption. Retrieved July 13, 2016, from
http://ischools.org/images/iConferences/iconference_corruption21.doc.
Garcia-Murillo, M. (2010). The effect of internet access on government corruption. Electronic
Government, An International Journal, 7(1), 22-40.

64
Garcia-Murillo, M. (2013). Does a government web presence reduce perceptions of corruption?
Information Technology for Development, 19(2), 151-175.
Garside, J., Watt, H., & Pegg, D. (2016, April 3). The Panama Papers: how the world’s rich and
famous hide their money offshore. The Guardian. Retrieved from
https://www.theguardian.com/news/2016/apr/03/the-panama-papers-how-the-worlds-rich-and-
famous-hide-their-money-offshore.
George, C. (2005). The internet's political impact and the penetration/participation paradox in
Malaysia and Singapore. Media, Culture & Society, 27(6), 903-920.
Gerring, J., & Thacker, S. (2004). Political institutions and governance: pluralism versus centralism.
British Journal of Political Science, 34(2), 295-303.
Goel, R. K., Nelson, M. A., & Naretta, M. A. (2012). The internet as an indicator of corruption
awareness. European Journal of Political Economy, 28(1), 64-75.
Grimes. (2008a). The conditions of successful civil society involvement in combating corruption: A
survey of case study evidence. Quality of Government Institute Working Paper Series, 2008(22).
Grimes, M. (2008b). Contestation or Complicity: Civil Society as Antidote or Accessory to Political
Corruption, Quality of Government Institute: Working Papers Series, 2008(8).
Grimes, M. (2013). The Contingencies of Societal Accountability: Examining the Link Between
Civil Society and Good Government. Studies in Comparative International Development, 48(4), 380-402.
Henley, J. (2016, April 5). Iceland PM steps aside after protests over Panama Papers revelations.
The Guardian. Retrieved from https://www.theguardian.com/world/2016/apr/05/iceland-prime-
minister-resigns-over-panama-papers-revelations.
Howard, P. N., Duffy, A., Freelon, D., Hussain, M. M., Mari, W., & Maziad, M. (2011). Opening
closed regimes: what was the role of social media during the Arab Spring? Project on Information
Technology & Political Islam, Working Paper 2011.1.
Howard, P. N., & Hussain, M. M. (2013). Democracy's fourth wave?: Digital media and the Arab
Spring. Oxford University Press.

65
HumanRights.Gov. (2016). Internet Freedom. HumanRights.Gov. Retrieved from
http://www.humanrights.gov/dyn/issues/internet-freedom.html.
Jenkins, R. (2007). Civil society versus corruption. Journal of Democracy, 18(2), 55-69.
Kaufmann, D. (1997). Corruption: the facts. Foreign Policy, 107, 114-131.
Kaufmann, D. (1998). Challenges in the Next Stage of Anti-corruption. New Perspectives on Combating
Corruption, 139-64.
Kavanaugh, A., Carroll, J. M., Rosson, M. B., Reese, D. D., & Zin, T. T. (2005). Participating in
civil society: the case of networked communities. Interacting with Computers, 17(1), 9-33.
Khan, M. (1998). The role of civil society and patron-client networks in the analysis of corruption.
In OECD/UNDP, Corruption and Integrity Improvement Initiatives in Developing Countries. New York:
UNDP, Management Development and Governance Division.
Khazaeli, S., & Stockemer, D. (2013). The Internet: A new route to good governance. International
Political Science Review, 34(5), 463-482.
Kock, N., & Gaskins, L. (2014). The mediating role of voice and accountability in the relationship
between internet diffusion and government corruption in Latin America and Sub-Saharan Africa.
Information Technology for Development, 20(1), 23-43
Krotoski, A. (2011, February 20). What effect has the internet had on journalism? The Guardian.
Retrieved from https://www.theguardian.com/technology/2011/feb/20/what-effect-internet-on-
journalism.
La Porta, R., Lopez-de-Silanes, F., Shleifer, A., & Vishny, R. (1999). The quality of government.
Journal of Law, Economics, and Organization, 15(1), 222-279.
Landell-Mills, P. (2006, November). Towards a fairer world: Why is corruption still blocking the way? Goals,
themes and outcomes. Paper presented at 12th Anti-Corruption Conference, Guatemala City and
Antigua, Guatemala, 15-18 November.
Leenders, R., & Sfakianakis, J. (2003). Middle East and North Africa. Transparency International Global
Corruption Report.

66
Levine, Y. (2014, July 16). Almost Everyone Involved in Developing Tor was (or is) Funded by the
US Government. Pando. Retrieved from https://pando.com/2014/07/16/tor-spooks/.
Liang, B., & Lu, H. (2010). Internet development, censorship, and cyber crimes in China. Journal of
Contemporary Criminal Justice, 26(1), 103-120.
Lidman, R. (2011). Is the Internet Mightier than the Sword: An Anti-Corruption Perspective. Global
Strategy and Practice of E-Governance: Examples from Around the World: Examples from Around the World,
338.
Linde, J., & Karlsson, M. (2013). The Dictator's New Clothes: The Relationship Between E-
Participation and Quality of Government in Non-Democratic Regimes. International Journal of Public
Administration, 36(4), 269-281.
Mander, B. (2016, April 8). Panama Papers open new chapter in Argentina corruption drama.
Financial Times. Retrieved from https://www.ft.com/content/1d9472a4-fcd0-11e5-a31a-
7930bacb3f5f.
Mashali, B. (2012). Analyzing the relationship between perceived grand and petty corruption in
developing countries: case study of Iran. International Review of Administrative Sciences, 78(4), 775-787.
McNeal, R., Hale, K., & Dotterweich, L. (2008). Citizen–government interaction and the Internet:
Expectations and accomplishments in contact, quality, and trust. Journal of Information Technology &
Politics, 5(2), 213-229.
Network World. (2016, August 16). Today, August 16, Internet Explorer turns 20. Network World.
Retrieved from http://www.networkworld.com/article/2971617/microsoft-subnet/happy-20th-
birthday-internet-explorer.html.
NPR. (2016). Journalist Says Trump Foundation May Have Engaged In ‘Self-Dealing’. NPR: Fresh
Air. Retrieved from http://www.npr.org/2016/09/28/495782978/journalist-says-trump-
foundation-may-have-engaged-in-self-dealing.
Nystrand, M. (2014). Petty and grand corruption and the conflict dynamics in northern Uganda.
Third World Quarterly, 35(5), 821-835.

67
Odoemene, A. (2012). Fighting Corruption without the State: Civil Society Agency and the
“Otokoto Saga”. Journal of Historical Sociology, 25(3), 475-503.
Olabe, P. B., & Kahn, T. (2012). From Information to Participation: The Potential of New
Technologies on Accountability Initiatives. Inter-American Development Bank Technical Notes.
OpenNet Initiative. (2016). About ONI. OpenNet Initiative. Retrieved from
https://opennet.net/about-oni.
Pande, R. (2011). Can informed voters enforce better governance? Experiments in low-income
democracies. Annual Review of Economics, 3(1), 215-237.
Pellegrini, L. & Gerlagh, R. (2008). Causes of corruption: A survey of cross-country analyses and
extended results. Economics of Governance, 9(3), 245-263.
Posso, A., & Elkins, M. (2014). Ignorance is Bliss! Internet Usage and Perceptions of Corruption in
a Panel of Developing Countries. International Journal of Communication, 8, 2561-2577.
Prasad, A., & Shivarajan, S. (2015). Understanding the role of technology in reducing corruption: a
transaction cost approach. Journal of Public Affairs, 15(1), 19-36.
Raycheva, L. (2009). The Challenges of ICT to Media Pluralism. Press Freedom and Pluralism in
Europe: Concepts and Conditions, 75.
Reinardy, S. (2010). Need for speed onto internet clashes with journalistic values. Newspaper Research
Journal, 31(1), 69-83.
Relly, J. E. (2012). Examining a model of vertical accountability: A cross-national study of the
influence of information access on the control of corruption. Government Information Quarterly, 29(3),
335-345.
Salas-Fumás, V., & Sanchez-Asin, J. J. (2013). Information and trust in hierarchies. Decision Support
Systems, 55(4), 988-999.
Salmon, C. T., Fernandez, L., & Post, L. A. (2010). Mobilizing public will across borders: Roles and
functions of communication processes and technologies. Journal of Borderlands Studies, 25(3-4), 159-
170.

68
Sandholtz, W., & Gray, M. M. (2003). International integration and national corruption. International
Organization, 57(04), 761-800.
Schoemaker, E., & Stremlau, N. (2014). Media and conflict: An assessment of the evidence. Progress
in Development Studies, 14(2), 181-195.
Setiyono, B., & McLeod, R. H. (2010). Civil society organisations' contribution to the anti-
corruption movement in Indonesia. Bulletin of Indonesian Economic Studies, 46(3), 347-370.
Shim, D. C., & Eom, T. H. (2008). E-government and anti-corruption: Empirical analysis of
international data. International Journal of Public Administration, 31(3), 298-316.
Shim, D. C., & Eom, T. H. (2009). Anticorruption effects of information communication and
technology (ICT) and social capital. International review of Administrative Sciences, 75(1), 99-116.
Shirky, C. (2011). The political power of social media: Technology, the public sphere, and political
change. Foreign Affairs, 90(1), 28-41.
Smith, D. (2014). Internet use on mobile phones in Africa predicted to increase 20-fold. The
Guardian. Retrieved from http://www.theguardian.com/world/2014/jun/05/internet-use-mobile-
phones-africa-predicted-increase-20-fold
StatCounter. (2016). Browser Usage – Worldwide. StatCounter. Retrieved on 10 September 2016
from http://gs.statcounter.com/#all-browser-ww-monthly-200812-201609.
Tadros, M. (2005). Knowing the Promises, Facing the Challenges: The Role of the Internet in
Development and Human Rights Campaigns and Movements in the Arab Middle East. In
Leatherman, J. & Vebber, J., Charting Transnational Democracy: Beyond Global Arrogance. New York:
Palgrace Macmillan, 173-193.
Treisman, D. (2000). The causes of corruption: a cross-national study. Journal of Public Economics,
76(3), 399-457.
Treisman, D. (2007). What have we learned about the causes of corruption from ten years of cross-
national empirical research? Annual Review of Political Science, 10, 211-244.

69
United Nations. (2011). Report of the Special Rapporteur on the promotion and protection of the
right to freedom of opinion and expression, Frank La Rue. United Nations General Assembly,
A/HRC/17/27, 16 May 2011.
Watts, J. (2016, June 15). Former Brazil president Lula poised for corruption trial, associates fear.
The Guardian. Retrieved from https://www.theguardian.com/world/2016/jun/15/brazil-luiz-
inacio-lula-da-silva-corruption-trial-petrobras.
White, C. S. (1997). Citizen participation and the Internet: Prospects for civic deliberation in the
information age. The Social Studies, 88(1), 23-28.
Xinli, H. (2015). Effectiveness of information technology in reducing corruption in China: A
validation of the DeLone and McLean information systems success model. The Electronic Library,
33(1), 52-64.
Yang, G. (2003). The Internet and civil society in China: A preliminary assessment. Journal of
Contemporary China, 12(36), 453-475.

70
DATA
Alesina, A., Devleeschauwer, A., Easterly, W., Kurlat, S., & Wacziarg, R. (2003). Fractionalization. Journal of Economic Growth, 8(2), 155-194.
Coppedge, M., et al. (2015). V-Dem Dataset v5. Varieties of Democracy (V-Dem) Project.
Freedom House. (2015). Freedom in the world: Aggregate and subcategory scores. Freedom House. Retrieved from https://freedomhouse.org/report/freedom-world-aggregate-and-subcategory-scores.
Hadenius, A. & Teorell, J. (2007). Pathways from authoritarianism. Journal of Democracy, 18(1), 143-157.
Kaufmann, D., Kraay, A., & Mastruzzi, M. (2010). The Worldwide Governance Indicators: A summary of methodology, data and analytical issues. World Bank Policy Research Working Paper, 5430.
Marshall, M., Gurr, T., & Jaggers, K. (2015). Polity IV Project: Political Regime Characteristics and Transitions, 1800-2015. Center for Systemic Peace. Retrieved from http://www.systemicpeace.org/.
PRS Group and others. (n.d.). International Country Risk Guide. Political Risk Services.
Teorell, J, Dahlberg, S., Holmberg, S., Rothstein, B., Khomenko, A. & Svensson, R. (2016). The Quality of Government Standard Dataset, version Jan16. University of Gothenburg: The Quality of Gov-ernment Institute. Retrieved from http://www.qog.pol.gu.se.
World Bank. (2015). World development indicators. The World Bank, Washington DC.

71
Appenix 1: Validity and Reliability Checks
ICRG QoG (outliers removed except first scatterplot)

72
Control of Corruption (outliers removed except first scatterplot)

73
V-Dem Political Corruption (no outliers)

74

75
V-Dem Executive Corruption Index (outliers removed except first scatterplot)

76
V-Dem Legislative Corrupt Activities (outliers removed except first scatterplot)

77
V-Dem Judicial Corrupt Decisions (outliers removed except first scatterplot)

78
V-Dem Public Sector Corruption Index (outliers removed except first scatterplot)

79

80
Appenix 2: Models with Outliers
ICRG QoG
TABLE 1, MULTIPLE REGRESSION (OLS). THE EFFECT OF THE NUMBER OF INTERNET USERS
AND THE INTERNET CENSORSHIP EFFORT BY THE GOVERNMENT ON THE QUALITY OF GOV-
ERNMENT.
DV: ICRG Quality of Government (0-1)
Model 1 Model 2 Model 3 Model 4 Model 5 Model 6 Model 7 Model 8 Model 9
Internet users (per 100) .006*** .005*** -.008** -.009** -.010*** -.008** -.008** -.008** -.008**
(.000) (.000) (.003) (.003) (.003) (.003) (.003) (.003) (.003)
Freedom from internet - .063* -.180** -.175** -.190** -.185** -.186** -.191** -.255***
censorship (ln) - (.033) (.058) (.058) (.055) (.054) (.054) (.055) (.059)
Internet use * Internet - - .006*** .006*** .006*** .005*** .005*** .005*** .005***
censorship (ln) - - (.001) (.001) (.001) (.001) (.001) (.001) (.001)
GDP per capita, PPP (ln)
- - - .031* .029* .023 .022 .023 .028*
- - - (.016) (.016) (.016) (.016) (.016) (.015)
British colonies - - - - .081** .069** .070** .070** .064**
- - - - (.024) (.024) (.024) (.024) (.024)
Years of democracy since
- - - - - .001* .001* .001** .001*
1930 - - - - - (.001) (.001) (.001) (.001)
Ethnic fractionalization - - - - - - -.026 -.028 -.028
(0-1) - - - - - - (.045) (.045) (.044)
Openness to trade - - - - - - - .000 .000
- - - - - - - (.000) (.000)
Freedom of press status - - - - - - - - .060*
(1-3) - - - - - - - - (.023)
Constant .287*** .160* .708*** .455* .477** .497** .525** .521** .538**
(.020) (.069) (.129) (.184) (.177) (.173) (.180) (.180) (.176)
R2
.650 .661 .719 .728 .753 .767 .767 .768 .782
N 118 118 118 118 118 118 118 118 118
*p<.10; **p<.01; ***p<.001. Standard errors within parentheses.

81
Control of Corruption
TABLE 2, MULTIPLE REGRESSION (OLS). THE EFFECT OF THE NUMBER OF INTERNET USERS
AND THE INTERNET CENSORSHIP EFFORT FROM THE GOVERNMENT ON THE CORRUPTION.
DV: Control of Corrupt-ion (-2.5 – 2.5)
Model 1 Model 2 Model 3 Model 4 Model 5 Model 6 Model 7 Model 8 Model 9
Internet users (per 100) .027*** .023*** -.022* -.031* -.033** -.022* -.022* -.023* -.222
(.002) (.002) (.012) (.012) (.012) (.012) (.012) (.012) (.235)
Freedom from internet - .517*** -.160 -.143 -.191 -.204 -.189 -.205 -4.032
censorship (ln) - (.142) (.221) (.218) (.214) (.206) (.207) (.210) (4.427)
Internet use * Internet - - .019*** .020*** .022*** -.016** .016** .016** .206*
censorship (ln) - - (.005) (.005) (.005) (.005) (.005) (.005) (.095)
GDP per capita, PPP (ln) - - - .164* .143* .108 .103 .101 2.173
- - - (.080) (.078) (.076) (.076) (.077) (1.481)
British colonies - - - - .328** .238* .243* .238* 3.733
- - - - (.116) (.115) (.116) (.116) (2.281)
Years of democracy - - - - - .009** .009** .009** .127*
since 1930 - - - - - (.003) (.003) (.003) (.055)
Ethnic fractionalization - - - - - - -.156 -.150 1.571
(0-1) - - - - - - (.206) (.207) (3.985)
Openness to trade - - - - - - - .001 .001
- - - - - - - (.001) (.026)
Freedom of press status - - - - - - - - 4.846*
(1-3) - - - - - - - - (2.132)
Constant -1.127*** -2.145*** -.641 -1.920* -1.769* -1.522* -1.421* -1.435* 7.257
(.027) (.292) (.477) (.782) (.765) (.741) (.754) (.756) (14.533)
R2
.591 .626 .662 .672 .690 .714 .715 .716 .719
N 144 144 144 144 144 144 144 144 143
*p<.10; **p<.01; ***p<.001. Standard errors within parentheses.

82
V-Dem Executive Corruption Index
TABLE 4, MULTIPLE REGRESSION (OLS). THE EFFECT OF THE NUMBER OF INTERNET USERS
AND THE INTERNET CENSORSHIP EFFORT FROM THE GOVERNMENT ON THE CORRUPTION.
DV: V-Dem Executive Corruption Index (0-1)
Model 1 Model 2 Model 3 Model 4 Model 5 Model 6 Model 7 Model 8 Model 9
Internet users (per 100) .007*** .005*** -.004 -.008* -.009* -.006 -.006 -.006 -.005
(.001) (.001) (.004) (.004) (.004) (.004) (.004) (.004) (.004)
Freedom from internet - .245*** .100 .107 .096 .093 .099 .091 .004
censorship (ln) - (.044) (.070) (.069) (.068) (.067) (.067) (.067) (.072)
Internet use * Internet - - .004* .004** .005** .003* .003* .003* .003*
censorship (ln) - - (.002) (.002) (.002) (.002) (.002) (.002) (.002)
GDP per capita, PPP (ln) - - - .067** .062* .053* .051* .050* .057*
- - - (.025) (.025) (.025) (.025) (.025) (.024)
British colonies - - - - .076* .053 .055 .053 .032
- - - - (.037) (.037) (.037) (.037) (.037)
Years of democracy since - - - - - .002** .002** .002** .002*
1930 - - - - - (.001) (.001) (.001) (.001)
Ethnic fractionalization (0-1)
- - - - - - -.068 -.065 -.052
- - - - - - (.067) (.067) (.065)
Openness to trade - - - - - - - .000 .000
- - - - - - - (.000) (.000)
Freedom of press status - - - - - - - - .102**
(1-3) - - - - - - - - (.035)
Constant .258*** -.226* .097 -.424* -.389 -.326 -.282 -.289 -.299
(.028) (.090) (.152) (.246) (.243) (.239) (.243) (.243) (.237)
R2
.483 .577 .597 .616 .527 .646 .649 .651 .672
N 144 144 144 144 144 144 144 144 144
*p<.10; **p<.01; ***p<.001. Standard errors within parentheses.

83
V-Dem Judicial Decision Corruption
Table 6. Multiple regression (OLS). The effect of the number of internet users and the internet censorship effort from the government on the corruption.
DV: V-Dem Judicial Corrupt Decisions (0-4)
Model 1 Model 2 Model 3 Model 4 Model 5 Model 6 Model 7 Model 8 Model 9
Internet users (per 100) .025*** .022*** -.005 -.025* -.028* -.022* -.022* -.022* -.020*
(.002) (.002) (.012) (.012) (.011) (.012) (.011) (.011) (.011)
Freedom from internet - .503*** .097 .133 .059 .051 .088 .068 -.115
censorship (ln) - (.141) (.227) (.212) (.198) (.196) (.195) (.197) (.213)
Internet use * Internet - - .011* .014** .016*** .013** .012** .012** .011*
censorship (ln) - - (.005) (.005) (.004) (.005) (.005) (.005) (.005)
GDP per capita, PPP (ln)
- - - .354*** .321*** .301*** .289*** .268*** .302***
- - - (.078) (.073) (.072*** (.072) (.072) (.071)
British colonies - - - - .508*** .454*** .467*** .461*** .418***
- - - - (.108) (.109) (.108) (.109) (.109)
Years of democracy since
- - - - - .005* .005* .006* .004
1930 - - - - - (.002) (.002) (.003) (.003)
Ethnic fractionalization - - - - - - -.391* -.384* -.356*
(0-1) - - - - - - (.194) (.194) (.192)
Openness to trade - - - - - - - .001 .000
- - - - - - - (.001) (.001)
Freedom of press status
- - - - - - - - .216*
(1-3) - - - - - - - - (.103)
Constant 1.267*** .275 1.179* -.1588* -1.354* -1.206* -.954 -.971 -.993
(.086) (.290) (.490) (.760) (.710) (.704) (.708) (.709) (.700)
R2
.568 .604 .618 .668 .714 .723 .731 .732 .741
N 144 144 144 144 144 144 144 144 144
*p<.10; **p<.01; ***p<.001. Standard errors within parentheses.

84
V-Dem Public Sector Corruption Index
TABLE 7, MULTIPLE REGRESSION (OLS). THE EFFECT OF THE NUMBER OF INTERNET USERS
AND THE INTERNET CENSORSHIP EFFORT FROM THE GOVERNMENT ON THE CORRUPTION.
DV: V-Dem Public Corruption Index (0-1)
Model 1 Model 2 Model 3 Model 4 Model 5 Model 6 Model 7 Model 8 Model 9
Internet users (per 100) .008*** .006*** -.004 -.008* -.009* -.005 -.005 -.006 -.004
(.001) (.001) (.004) (.004) (.004) (.004) (.004) (.004) (.004)
Freedom from internet - .195*** .041 .049 .034 .030 .031 .024 -.075
censorship (ln) - (.045) (.565) (.069) (.068) (.065) (.066) (.066) (.070)
Internet use * Internet - - .004** .005** .005** .003* .003* .003* .003*
censorship (ln) - - (.002) (.002) (.002) (.002) (.002) (.002) (.002)
GDP per capita, PPP (ln) - - - .077** .071** .059* .059* .058* .066**
- - - (.025) (.025) (.024) (.024) (.024) (.023)
British colonies - - - - .101** .071* .071* .069* .046
- - - - (.037) (.036) (.037) (.037) (.036)
Years of democracy since
- - - - - .003*** .003** .003*** .002*
1930 - - - - - (.001) (.001) (.001) (.001)
Ethnic fractionalization - - - - - - -.016 -.014 .001
(0-1) - - - - - - (.065) (.065) (.063)
Openness to trade - - - - - - - .000 .000
- - - - - - - (.000) (.000)
Freedom of press status - - - - - - - - .117**
(1-3) - - - - - - - - (.034)
Constant .200*** -.185* .158 -.446* -.399 -.317 -.306 -.313 -.325
(.008) (.092) (.154) (.248) (.243) (.234) (.239) (.239) (.230)
R2
.536 .591 .612 .636 .655 .685 .685 .687 .712
N 144 144 144 144 144 144 144 144 144

85
ICRG QoG Causality Check
TABLE 8. MULTIPLE REGRESSION (OLS). THE EFFECT OF THE NUMBER OF INTERNET USERS
AND THE INTERNET CENSORSHIP EFFORT BY THE GOVERNMENT ON THE QUALITY OF GOV-
ERNMENT.
DV: ICRG Quality of Government (0-1)
Model 1 Model 2 Model 3 Model 4 Model 5 Model 6 Model 7 Model 8 Model 9 Model 10
Internet users (per 100) .006*** .006*** -.007* -.008** -.009** -.007* -.008* -.008** -.008** -.005*
(.000) (.000) (.003) (.003) (.003) (.003) (.003) (.003) (.003) (.002)
Freedom from internet - .050 -.169** -.166** -.181** -.180** -.181** -.190** -.264*** -.171**
censorship (ln) - (.035) (.059) (.058) (.057) (.056) (.056) (.057) (.062) (.055)
Internet use * Internet - - .005*** .005*** .006*** .005*** .005*** .005*** .005*** .003**
censorship (ln) - - (.001) (.001) (.001) (.001) (.001) (.001) (.001) (.001)
GDP per capita, PPP (ln) - - - .025 .023 .020 .019 .020 .026 .011
- - - (.017) (.016) (.016) (.016) (.016) (.016) (.014)
British colonies - - - - .073** .065* .067* .067** .061* .038*
- - - - (.025) (.025) (.025) (.025) (.025) (.021)
Years of democracy - - - - - .001* .001* .001* .001 .000
since 1930 - - - - - (.001) (.001) (.001) (.001) (.001)
Ethnic fractionalization - - - - - - -.029 -.030 -.026 -.036
(0-1) - - - - - - (.048) (.048) (.046) (.039)
Openness to trade - - - - - - - .000 .000 .000
- - - - - - - (.000) (.000) (.000)
Freedom of press status - - - - - - - - .065* .054*
(1-3) - - - - - - - - (.025) (.021)
ICRG QoG 1996 - - - - - - - - - .452***
- - - - - - - - - (.072)
Constant .291*** .190* .682*** .484* .502** .515** .545** .538** .552** .339*
(.019) (.073) (.130) (.186) (.179) (.177) (.185) (.185) (.180) (.156)
R2
.682 .689 .738 .744 .764 .771 .772 .775 .790 .850
N 107 107 107 107 107 107 107 107 107 107
*p<.10; **p<.01; ***p<.001. Standard errors within parentheses.

86
Control of Corruption Causality Check
TABLE 4. MULTIPLE REGRESSION (OLS). THE EFFECT OF THE NUMBER OF INTERNET USERS
AND THE INTERNET CENSORSHIP EFFORT BY THE GOVERNMENT ON THE QUALITY OF GOV-
ERNMENT.
DV: Control of Corruption (0-1)
Model 1 Model 2 Model 3 Model 4 Model 5 Model 6 Model 7 Model 8 Model 9 Model 10
Internet users .027*** .023*** -.022* -.031* -.034** -.023* -.023* -.024* -.021* .000
(per 100) (.002) (.002) (.012) (.012) (.012) (.012) (.012) (.012) (.012) (.010)
Freedom from internet - .498** -.189 -.172 -.228 -.247 -.235 -.252 -.442* .025
censorship (ln) - (.143) (.222) (.219) (.215) (.207) (.208) (.210) (.229) (.192)
Internet use * Internet - - .019*** .020*** .022*** .016** .016** .016** .015** .004
censorship (ln) - - (.005) (.005) (.005) (.005) (.005) (.005) (.005) (.004)
GDP per capita, - - - .168* .146* .110 .105 .102 .115 .039
PPP (ln) - - - (.080) (.078) (.076) (.076) (.077) (.076) (.062)
British colonies - - - - .331** .245* .252* .248* .209* .037
- - - - (.117) (.115) (.116) (.117) (.117) (.096)
Years of democracy - - - - - .009** .009** .009** .008** .001
since 1930 - - - - - (.003) (.003) (.003) (.003) (.002)
Ethnic fractionalization - - - - - - -.145 -.142 -.133 -.048
(0-1) - - - - - - (.209) (.210) (.207) (.167)
Openness to trade - - - - - - - .001 .000 .000
- - - - - - - (.001) (.001) (.001)
Freedom of press - - - - - - - - .224* .060
status (1-3) - - - - - - - - (.113) (.093)
Control of Corruption - - - - - - - - - .555***
1996 - - - - - - - - - (.065)
Constant -1.143*** -2.123*** -.594 -1.911* -1.730* -1.458* -1.356* -1.362* -1.351* -.924
(.087) (.293) (.478) (.781) (.765) (.740) (.756) (.758) (.750) (.605)
R2
.597 .626 .666 .677 .695 .720 .721 .721 .729 .827
N 142 142 142 142 142 142 142 142 142 142
*p<.10; **p<.01; ***p<.001. Standard errors within parentheses.