international journal of greenhouse gas control journal of greenhouse gas control 5 ... department...
TRANSCRIPT

Journal Identification = IJGGC Article Identification = 374 Date: July 6, 2011 Time: 2:16 pm
Dp
YI
a
ARRAA
KCSTCC
1
cgct2spiIstol1otttr
tt
1d
International Journal of Greenhouse Gas Control 5 (2011) 788–797
Contents lists available at ScienceDirect
International Journal of Greenhouse Gas Control
j our na l ho me p age: www.elsev ier .com/ locate / i jggc
etermining the corrosive potential of CO2 transport pipeline in highCO2–water environments
oon-Seok Choi ∗, Srdjan Nesicnstitute for Corrosion and Multiphase Technology, Department of Chemical and Biomolecular Engineering, Ohio University, Athens, OH 45701, USA
r t i c l e i n f o
rticle history:eceived 27 July 2010eceived in revised form 8 November 2010ccepted 15 November 2010vailable online 13 December 2010
a b s t r a c t
The corrosive potential of carbon steel was evaluated under high pressure CO2–water systems to sim-ulate the condition of CO2 transportation pipeline in the CO2 capture and storage (CCS) applications.To understand the thermodynamic properties of CO2–water systems related to the corrosion phenom-ena, thermodynamic modeling were conducted to determine the mutual solubilities of CO2 and waterin the two coexisting phases, and to calculate the concentrations of corrosive species in the free water
eywords:O2 transport pipelineupercritical CO2
hermodynamic modelingO2 corrosion
at various pressures and temperatures. Carbon steel samples were exposed to water-saturated CO2, andCO2-saturated water in the CO2 pressure range of 40–80 bar at 50 ◦C. The corrosion rate of samples wasdetermined by weight loss measurements. The surface morphology and the composition of the corrosionproduct layers were analyzed by using surface analytical techniques (SEM and EDS).
© 2010 Elsevier Ltd. All rights reserved.
arbon steel. Introduction
Emissions from fossil fuel-fired power plants represent a signifi-ant source of carbon dioxide (CO2) emissions, a known greenhouseas. The capture and storage of CO2 in geological reservoirs is nowonsidered to be one of the main options for achieving deep reduc-ions in greenhouse gas emissions (Rubin et al., 2005; Connell,005). The CO2 capture and storage (CCS) process involves threetages: capture of the CO2 from the power plant or industrialrocess, transmission of the CO2 to the storage site followed by
njection into the geological reservoir (Gale and Davison, 2004).n order to avoid two-phase flow regimes and increase the den-ity of the CO2, the captured CO2 gas is typically compressed tohe supercritical state while the temperature and the pressure arever 31.1 ◦C and 73.8 bar, respectively, thereby making it easier andess costly to transport (Gale and Davison, 2004; Kruse and Tekiela,996). The research activities are largely concentrating on devel-pment of the capture technology to reduce costs, and on assessinghe technical feasibility of injecting and monitoring the CO2 withinhe geological reservoirs themselves (Stevens and Gale, 2000). Lit-le of the research is being conducted on CO2 transmission, but thisemains a critical component that should not be overlooked.
Low alloy carbon steel pipelines have been used for transporta-ion of CO2 at high pressure, but in all cases, CO2 must be driedo eliminate the corrosion risk (Seiersten and Kongshaug, 2005).
∗ Corresponding author. Tel.: +1 740 593 9944; fax: +1 740 593 9949.E-mail address: [email protected] (Y.-S. Choi).
750-5836/$ – see front matter © 2010 Elsevier Ltd. All rights reserved.oi:10.1016/j.ijggc.2010.11.008
However, if CO2 transport is to be achieved at a large scale or inexisting pipelines, it will not be practical to dry it sufficiently andliquid water “breakout” is to be expected. Furthermore, drying CO2contributes to an increase in handling cost, especially for offshoreinstallations where weight allowance and space for process equip-ment installation are very restricted (Kongshaug and Seiersten,2004). When free water exists in the pipeline, it will be saturatedwith CO2 and the corrosion rate will be significant for carbon steelbecause of the formation of carbonic acid (H2CO3). In addition, eventhough pure, dry CO2 is not corrosive, there are several studieswhich provide qualitative evidence for corrosion on carbon steelin water-saturated supercritical CO2 phase (Russick et al., 1996;Propp et al., 1996; McGrail et al., 2009). Thus, to be able to con-sider the corrosion risk in such pipelines, quantitative evaluationof corrosion in both CO2-saturated water and water-saturated CO2phases will be needed.
The impact of CO2 corrosion on carbon steel has been studiedextensively at pressures relevant for oil and gas transport (up to20 bar CO2). At higher pressures experimental data are sparse.Since CO2 changes from gaseous to liquid or supercritical withincreasing pressure, it will lead to different interactions withwater, i.e., CO2 solubility in water will not follow Henry’s law inliquid or supercritical CO2 conditions, which results in changingwater chemistry. Since the solubility of water in CO2 is related tothe free-liquid water formation and the solubility of CO2 in water
correlates with the corrosive potential of free water, accurateestimations of the mutual solubilities of CO2 and water are animportant issue in CO2 transportation pipeline corrosion. Althoughmany studies have been done to model mutual solubilities of CO2
Journal Identification = IJGGC Article Identification = 374 Date: July 6, 2011 Time: 2:16 pm
l of Greenhouse Gas Control 5 (2011) 788–797 789
aw
ppdcsteb
2
c2
2
T1Toeeilscs
a
H
K
C
K
wpva
K
wsmP
tb
y
w
TE
aCO2 = 55.508xCO2 (8)
0.010
0.015
0.020
0.025
0.030
le fra
ction o
f w
ate
r
15oC 25
oC
35oC 45
oC
55oC 65
oC
75oC 85
oC
Y.-S. Choi, S. Nesic / International Journa
nd water at high pressures, there is no attempt to predict theater chemistry at such a high pressure.
Thus, in the present study, to understand the thermodynamicroperties of CO2–water systems related to observed corrosionhenomena, thermodynamic modeling studies were conducted toetermine the mutual solubilities of CO2 and water in the twooexisting phases, and to calculate the concentrations of corrosivepecies in the free-liquid water at various ranges of pressure andemperature (up to 300 bar, 85 ◦C). In addition, the corrosion prop-rties with increasing pressure were investigated for carbon steely weight loss measurements and surface analysis techniques.
. Thermodynamic modeling
The thermodynamic model used in this work was based on aombination of mutual solubilities of CO2 and water (Spycher et al.,003), and chemistry of water-rich phase (Nordsveen et al., 2003).
.1. Modeling for mutual solubilities of the CO2–water system
Spycher et al. (2003) reviewed the published experimental P--x data for the CO2–water system in the temperature range of2–100 ◦C at pressures up to 600 bar to develop a solubility model.hey used a non-iterative procedure to calculate the compositionf the compressed CO2 and liquid phase at equilibrium based onquating chemical potentials and using the Redlich–Kwong (RK)quation of state (EOS) (Redlich and Kwong, 1949). Their procedures kept as simple as possible and is suitable for our purpose to estab-ish a preliminary thermodynamic model to predict the mutualolubilities of CO2 and water in high pressure CO2 pipeline appli-ations. In the following, an approach for calculating the mutualolubilities of CO2 and water is presented using the Spycher model.
At equilibrium in the CO2–water system, the following equilibriand equations to define relationships can be written:
2O(g) ↔ H2O(l) (1)
H2O =fH2O(g)
aH2O(l)(2)
O2(g) ↔ CO2(aq) (3)
CO2 =fCO2(g)
aCO2(aq)(4)
here K is true equilibrium constants, f is fugacity of the gas com-onents, and a is activity of components in the liquid phase. The Kalues for water and CO2 are functions of pressure and temperatures:
(T,P) = K0(T,P0)
exp
((P − P0)Vi
RT
)(5)
here P, P0, R, T are pressure, reference pressure (1 bar), gas con-tant and temperature in K, respectively. Vi is the average partialolar volume of the pure component i over the pressure interval
0 to P.From the definition of fugacity (fi = ∅ iyiP) (Prausnitz et al., 1986),
he mole fraction of water in the CO2 phase (yH2O) can be writteny combining Eqs. (2) and (5):( )
H2O =K0H2OaH2O
∅H2OPexp
(P − P0)VH2O
RT(6)
here, ∅H2O is the fugacity coefficient of water.
able 1lement analysis for the X65 carbon steel used in the tests (wt.%).
C Mn Si P S Cr Cu Ni Mo Al
0.065 1.54 0.25 0.013 0.001 0.05 0.04 0.04 0.007 0.041
Fig. 1. The test autoclave used for corrosion experiments.
For better accuracy at high pressures, the water activity devi-ation from unity caused by dissolved CO2 should be taken intoaccount. Using Raoult’s law, the water activity can be approximatedby its mole fraction in the water phase (xH2O = 1 − xCO2 ), such that:
yH2O =K0
H2O(1 − xCO2 )
∅H2OPexp
((P − P0)VH2O
RT
)(7)
where, xCO2 is the mole fraction of CO2 in the water phase. There isthe following relationship between aCO2 and xCO2 :
3002502001501005000.000
0.005
Mo
Pressure (bar)
Fig. 2. Calculated solubility of water in CO2 as functions of pressure and tempera-ture.

Journal Identification = IJGGC Article Identification = 374 Date: July 6, 2011 Time: 2:16 pm
790 Y.-S. Choi, S. Nesic / International Journal of Gr
3002502001501005000.000
0.005
0.010
0.015
0.020
0.025
0.030
0.035
Mole
fra
ction o
f C
O2
Pressure (bar)
15oC 25
oC
35oC 45
oC
55oC 65
oC
75oC 85
oC
Ft
x
Fa
ig. 3. Calculated solubility of CO2 in water as functions of pressure and tempera-ure.
Substituting Eqs. (5) and (8) into Eq. (4) gives:
CO2 =∅CO2 (1 − yH2O)P
55.508K0CO2(g)
exp
(− (P − P0)VCO2
RT
)(9)
3002502001501005000.000
0.005
0.010
0.015
0.020
3002502001501005000.000
0.005
0.010
0.015
0.020
50oC
Measurement
Simulation
Mole
fra
ction o
f w
ate
r
Pressure (bar)
20oC
Measurement
Simulation
Mole
fra
ction o
f w
ate
r
ig. 4. Comparison between experimental data (Wiebe, 1941; Coan and King, 1971; Songnd calculated water solubility in CO2 at various pressures and temperatures.
eenhouse Gas Control 5 (2011) 788–797
Eqs. (7) and (9) can be solved directly by setting:
A =K0
H2O
∅H2OPtotexp
((P − P0)VH2O
RT
)(10)
B = ∅CO2 Ptot
55.508K0CO2(g)
exp
(− (P − P0)VCO2
RT
)(11)
Using parameters A and B, we can calculate the mole fraction ofwater in the CO2 phase (yH2O) and the mole fraction of CO2 in thewater phase (xCO2 ) as follows:
yH2O =(1 − B)
((1/A)B)(12)
xCO2 = B(1 − yH2O) (13)
The average partial molar volume of the pure water(VH2O = 18.1 cm3/mol) and CO2 (VCO2(g) = 32.6 cm3/mol, VCO2(l) −32 cm3/mol), and the K parameters were obtained from the litera-ture and/or by calibration to the solubility data:
log K0H2O = −2.209 + 3.097 × 10⁻²T − 1.098 × 10⁻⁴T2
−7 3
+ 2.048 × 10 T (14)log K0CO2(g) = 1.189 + 1.304 × 10⁻²T − 5.446 × 10⁻⁵T2 (15)
3002502001501005000.000
0.005
0.010
0.015
0.020
3002502001501005000.000
0.005
0.010
0.015
0.020
Measurement
Simulation
75oC
Measurement
Simulation
Pressure (bar)
25oC
and Kobayashi, 1987; Briones et al., 1987; King et al., 1992; Bamberger et al., 2000)

Journal Identification = IJGGC Article Identification = 374 Date: July 6, 2011 Time: 2:16 pm
l of Gr
l
w
fCup1
P
wac
c
a
b
Fa
Y.-S. Choi, S. Nesic / International Journa
og K0CO2(l) = 1.169 + 1.368 × 10⁻²T − 5.380 × 10⁻⁵T2 (16)
here T is temperature in ◦C.The fugacity coefficients in Eqs. (10) and (11) should be derived
rom an equation of state (EOS) which can calculate properties ofO2–water mixtures. In this study, Redlich–Kwong (RK) EOS wassed to get the fugacity coefficients and the volume of the com-ressed gas phase. The RK EOS is given by (Redlich and Kwong,949):
=(
RT
V − b
)−
(a
T0.5V(V + b)
)(17)
here V is the molar volume of the CO2-rich phase at pressure Pnd temperature T, and R is the gas constant. Parameters a and bharacterize intermolecular attraction and repulsion, respectively.
For CO2–water mixtures, the mixture constants amix and bmixan be calculated by the standard mixing rules:
mix =n∑
i=1
n∑j=1
yiyjaij = y2H2OaH2O + 2yH2OyCO2 aH2O–CO2 + y2
CO2aCO2
(18)
mix =n∑
i=1
yibi = yH2ObH2O + yCO2 bCO2 (19)
3002502001501005000.000
0.005
0.010
0.015
0.020
0.025
0.030
0.035
3002502001501005000.000
0.005
0.010
0.015
0.020
0.025
0.030
0.035
Measurement
Simulation
Mo
le f
ractio
n o
f C
O2
Pressure (bar)
Measurement
Simulation
Mo
le f
ractio
n o
f C
O2
50oC
20oC
ig. 5. Comparison between experimental data (Wiebe, 1941; Coan and King, 1971; Songnd calculated CO2 solubility in water at various pressures and temperatures.
eenhouse Gas Control 5 (2011) 788–797 791
From these mixing rules and Eq. (17), the fugacity coefficient ofcomponent k in mixture with other component i can be calculatedas:
ln(∅k) = ln(
V
V − bmix
)+
(bk
V − bmix
)
−(
2∑n
i=1yiaik
RT1.5bmix
)ln
(V + bmix
V
)+
(amixbk
RT1.5b2mix
)
×[
ln(
V + bmix
V
)−
(bmix
V + bmix
)]− ln
(PV
RT
)(20)
To avoid an iterative scheme, the assumption of infinite waterdilution in the CO2-rich phase is made that yH2O = 0 and yCO2 = 1in the mixing rules in Eqs. (18) and (19). Then, amix and bmix can bereplaced to aCO2 and bCO2 in Eq. (20), respectively. And the volumeof the compressed gas phase (V) can be calculated by recasting RKEOS in terms of volume:
V3 − V2(
RT
P
)− V
(RTbCO2
P− aCO2
PT0.5+ b2
CO2
)−
(aCO2 bCO2
PT0.5
)= 0
(21)
where, R = 83.1447 bar cm3 mol−1 K−1, V is in cm3/mol, P is in bar,and T is in K.
3002502001501005000.000
0.005
0.010
0.015
0.020
0.025
0.030
0.035
3002502001501005000.000
0.005
0.010
0.015
0.020
0.025
0.030
0.035
Measurement
Simulation
75oC
25oC
Measurement
Simulation
Pressure (bar)
and Kobayashi, 1987; Briones et al., 1987; King et al., 1992; Bamberger et al., 2000)

Journal Identification = IJGGC Article Identification = 374 Date: July 6, 2011 Time: 2:16 pm
7 l of Gr
ip
2p
ftatceIis‘
s
C
H
H
H
Heacct
sb
K
K
K
K
w(i
aSr
C
cp
stannous chloride and hydrochloric acid to make 1000 ml) (ASTMG1, 2003). The specimens were then rinsed in distilled water, driedand weighed to 0.1 mg. The corrosion rate can be calculated by the
a
b
3002502001501005000.000
0.001
0.002
0.003
0.004
0.005
H2C
O3 c
on
ce
ntr
atio
n (
mo
l/L
)
Pressure (bar)
15oC 25
oC
35oC 45
oC
55oC 65
oC
75oC 85
oC
0.00 00
0.00 02
0.00 04
0.00 06
0.00 08
0.00 10
0.00 12
HC
O3
- con
cen
tratio
n (
mol/L)
15oC 25
oC
35oC 45
oC
55oC 65
oC
75oC 85
oC
92 Y.-S. Choi, S. Nesic / International Journa
A FORTRAN program was used to calculate the mutual solubil-ties of CO2 and water in the temperature range of 15–85 ◦C andressure up to 300 bar.
.2. Modeling for the chemistry of free water and for therediction of FeCO3 precipitation
Understanding water chemistry is an important preconditionor predicting corrosion under high CO2 pressure. The concentra-ions of carbonic species (CO2(aq), H2CO3, HCO3
−, and CO32−) as well
s autogenous pH in the water phase were calculated to provide aool for estimating water chemistry of a pipeline when water pre-ipitates using the solubility of CO2 and equilibrium constants forach chemical reaction at various pressure and temperature ranges.n the case of CO2 transporting pipelines, due to a virtually unlim-ted supply of CO2, there is constant partial pressure of CO2 on theurface of free water so that the system can be considered as anopen’ system.
Once CO2 dissolves in water (Eq. (3)), CO2(aq) is involved in aequence of chemical reactions as follows:
O2(aq) + H2OKhyd←→H2CO3 (Hydration of aqueous CO2) (22)
2CO3Kca←→H+ + HCO3
− (Dissociation of carbonic acid) (23)
CO3− Kbi←→H+ + CO3
2− (Dissociation of bicarbonate ion) (24)
2OKw←→H+ + OH− (Dissociation of water) (25)
With the partial pressure of CO2 known in an open system,enry’s law can be applied in order to calculate the vapor–liquidquilibrium of CO2 at low pressure (Brown et al., 2003). However,t high pressure, Henry’s law cannot be used to calculate the con-entration of CO2 in the solution. Thus, in the present study, theoncentrations of CO2 in the water (CCO2 ) were calculated usinghe solubility of CO2 in water (xCO2 ) obtained from Eq. (13).
Once concentration of dissolved CO2 is fixed, the reactionshown above can be described by equilibria reactions as followsased on the assumption of infinite dilution:
hyd =CH2CO3
CCO2 CH2O(26)
ca =CH+CHCO3
−
CH2CO3
(27)
bi =CH+CCO3
2−
CHCO3−
(28)
w =CH+COH−
CH2O(29)
here CH2CO3 , CHCO3− , CCO3
2− , CH+ , and COH− are the concentrationsmol/L) of carbonic acid, bicarbonate ion, carbonate ion, hydrogenon, and hydroxide ion, respectively.
The equilibrium constants, K, are a function of the temperaturend are available in the open literature (Nordsveen et al., 2003).ince the solution cannot have a net charge, an electroneutralityelation is required. Mathematically, it is expressed as:
H+ = CHCO3− + 2 × CCO3
2−COH− (30)
FORTRAN and Excel programs were used to calculate the con-entrations of species in the solution with various temperature andressure ranges.
eenhouse Gas Control 5 (2011) 788–797
3. Materials and methods
The test specimens were machined from API X65 low carbonsteel with a size of 25 mm × 15 mm × 3 mm. The composition of thissteel is given in Table 1. The specimens were ground with 600 gritsilicon carbide paper, cleaned with alcohol in an ultrasonic bath,dried, and weighed using a balance with a precision of 0.1 mg. Theelectrolyte used in this work was DI water.
The weight loss experiments were performed in a 2000 psi staticautoclave with 1000 ml volume (Fig. 1). 400 ml of solution wasadded to the autoclave and CO2 gas was bubbled for 3 h to removeoxygen before starting the test. Corrosion tests were conductedunder different partial pressures of CO2 (pCO2, 40–80 bar) at 50 ◦C.When both water and CO2 are added in the autoclave, there is aphase separation with the water phase at the bottom. Specimenswere inserted both in the water-saturated CO2 phase at the top ofthe autoclave and in the CO2-saturated water phase at the bottom.
The corrosion rates were determined from weight-loss methodat the end of a 24-h exposure. The specimens were removed andcleaned for 5 min in Clarke solution (20 g antimony trioxide + 50 g
300250200150100500
Pressure (ba r)
Fig. 6. Variations of (a) H2CO3 and (b) HCO3− concentrations as functions of pressure
and temperature obtained from the water chemistry model.

Journal Identification = IJGGC Article Identification = 374 Date: July 6, 2011 Time: 2:16 pm
l of Gr
f
C
ap
4
4
(wawtgiatu
Ft
CO2 solubility trend with pressure reflected two solubility curvesfor two distinct phases: liquid or supercritical CO2 above saturationpressure, and gaseous CO2 below this pressure. This resulted in abreak in slope on the overall solubility trends.
3.0
3.2
3.4
3.6
3.8
4.0
pH
Predicted pH
Measured pH
a
Y.-S. Choi, S. Nesic / International Journa
ollowing equation (ASTM G31, 1994):
orrosion rate (mm/y) = 8.76 × 10⁴ × weight loss (g)area (cm2) × density (g/cm3) × time (h)
(31)
The morphology and compositions of corrosion products werenalyzed by scanning electron microscopy (SEM) and energy dis-ersive X-ray spectroscopy (EDS).
. Results and discussion
.1. Thermodynamic modeling
The mutual solubilities of CO2 and water calculated using Eqs.12) and (13) are shown in Figs. 2 and 3 in terms of mole fractions ofater and CO2. The solubility of water in CO2 showed high values
t low pressures, passes through a minimum, and then increasedith pressure. The discontinuity in water solubility at subcritical
emperatures (15, 25 ◦C) coincides with the phase change from aaseous to a liquid CO2. Above the critical temperature (31.1 ◦C), it
s related to the phase change from a gaseous to a supercritical CO2fter which the trend with pressure becomes smoother. However,he solubility of CO2 in water increased sharply with rising pressurep to the saturation pressure and at a lesser rate thereafter. The3002502001501005000.0
2.0x10⁻¹¹
4.0x10⁻¹¹
6.0x10⁻¹¹
8.0x10⁻¹¹
1.0x10⁻¹⁰
CO
3
2- c
on
ce
ntr
atio
n (
mo
l/L
)
Pressure (bar)
15oC 25
oC
35oC 45
oC
55oC 65
oC
75oC 85
oC
300250200150100500
3.0
3.2
3.4
3.6
3.8
4.0
4.2
4.4
pH
Pressure (bar)
15oC 25
oC
35oC 45
oC
55oC 65
oC
75oC 85
oC
a
b
ig. 7. Variations of (a) CO32− concentration and (b) pH as functions of pressure and
emperature obtained from the water chemistry model.
eenhouse Gas Control 5 (2011) 788–797 793
300250200150100500
Pressure (bar)
300250200150100500
3.0
3.2
3.4
3.6
3.8
4.0
pH
Pressure (bar)
Predicted pH
Measured pH
300250200150100500
3.0
3.2
3.4
3.6
3.8
4.0
pH
Pressure (bar)
Predicted pH
Measured pH
b
c
Fig. 8. Comparison between experimental data (Meyssami et al., 1992) and calcu-lated pH at various pressures and temperatures: (a) 32 ◦C, (b) 37 ◦C, and (c) 42 ◦C.
Journal Identification = IJGGC Article Identification = 374 Date: July 6, 2011 Time: 2:16 pm
7 l of Gr
tiidwicwwea
we1TalttdCt1ia
citidiupfce1iC
Fs
As shown in Fig. 9, the corrosion rates of carbon steel in the CO2-saturated water phase are much higher than in the water-saturatedCO2 phase. The corrosion rates of carbon steel in the CO2-saturatedwater were in the range of 18–20 mm/y and the increase of pCO2
94 Y.-S. Choi, S. Nesic / International Journa
The effects of temperature on the solubility of water and onhe solubility of CO2 are significantly different, and the solubil-ty of water increased while the solubility of CO2 decreased withncrease in temperature. This behavior of the CO2–water system isue probably to changes in compressibility of CO2 and hydration ofater (Teng and Yamasaki, 2002), e.g., at 80 bar the density of CO2
s 707.2 kg/m3 at T = 30 ◦C and becomes 966 kg/m3 at T = 0 ◦C, indi-ating that the resistance for water to penetrate into CO2 decreasesith increasing temperature; in comparison, water density variesith temperature only slightly, and the effect of hydration, which
nhances the dissolution of CO2 in water is greater at low temper-ture than at high temperatures.
Fig. 4 shows a comparison between the predicted solubility ofater in CO2 and that from experimental data available in the lit-
rature (Wiebe, 1941; Coan and King, 1971; Song and Kobayashi,987; Briones et al., 1987; King et al., 1992; Bamberger et al., 2000).he comparison demonstrates an acceptable match in the temper-ture range of 15–50 ◦C, however, calculated water solubility hasess accuracy at higher temperatures, because the water mole frac-ions in the CO2 phase keeps increasing with temperature so thathe assumption of infinite water dilution should eventually breakown (Spycher et al., 2003). A comparison between solubility ofO2 in water calculated using the model versus the experimen-al data (Wiebe, 1941; Coan and King, 1971; Song and Kobayashi,987; Briones et al., 1987; King et al., 1992; Bamberger et al., 2000)
s represented in Fig. 5. Results presented in this figure show a goodgreement at various temperatures and pressures.
The effects of pressure and temperature on the concentrations ofarbonic species (H2CO3, HCO3
−, and CO32−) and pH (H+) are shown
n Figs. 6 and 7. The concentrations of H2CO3 and HCO3− showed
he same trends as the solubility of CO2 in water shown in Fig. 3,.e., the concentrations increased with increasing pressure whereasecreased with temperature. However, the concentration of CO3
2−
ncreased with increasing pressure and temperature. The pH val-es changed in the range of 4.4–3, decreasing with an increase inressure and increasing with temperature. The autogenous pH ofree water will be in the range of 3.1–3.3 under supercritical CO2ondition (P > 73 bar, T > 31.1 ◦C), which can lead to a more acidic
nvironment compared with atmospheric conditions (pH 3.9 atbar, 25 ◦C). At such low pH values, the solubility of iron carbonates sufficiently high that no precipitate would be observed (scale-freeO2 corrosion).
80706050400.1
1
10
100
Corr
osio
n r
ate
(m
m/y
)
Pressure (bar)
CO2-rich phase
Water-rich phase
ig. 9. Measured corrosion rates in the CO2-saturated water and the water-aturated CO2 phases at 50 ◦C as a function of CO2 partial pressure.
eenhouse Gas Control 5 (2011) 788–797
The measured (Meyssami et al., 1992) and predicted pH valuesare plotted in Fig. 8. It can be found that the thermodynamic modelclosely predicted the pH at different pressures and temperatures.
4.2. Corrosion tests under high pCO2–water system
Fig. 9 shows the corrosion rates of carbon steel in the CO2-saturated water phase and the water-saturated CO2 phase underdifferent pCO2 after 24 h at 50 ◦C. Note that the CO2 phase wasgaseous at 40 and 60 bar, whereas it was supercritical at 80 bar.
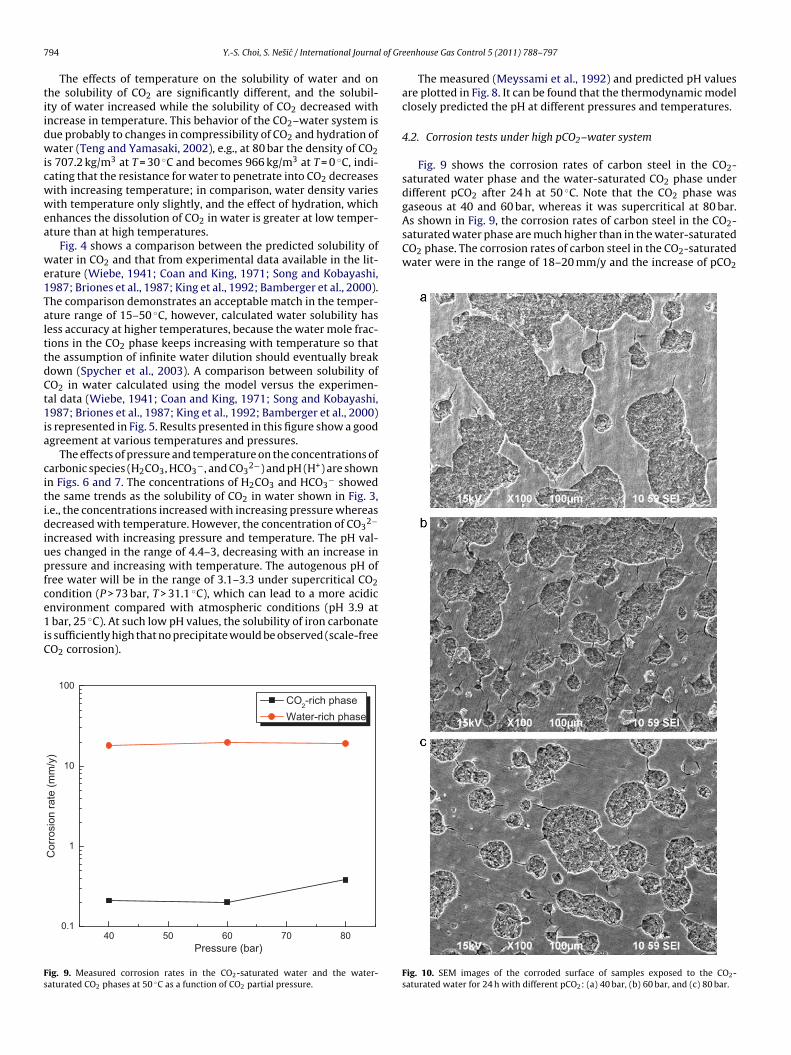
Fig. 10. SEM images of the corroded surface of samples exposed to the CO2-saturated water for 24 h with different pCO2: (a) 40 bar, (b) 60 bar, and (c) 80 bar.

Journal Identification = IJGGC Article Identification = 374 Date: July 6, 2011 Time: 2:16 pm
l of Gr
icbatar
2
t2cc4(wle
ispps
Fts
2shown in Fig. 12, uniform corrosion attack was observed on thesurface for all samples, i.e., no localized corrosion. This impliesthat even though the Fe3C film locally formed on the steel surface,
Y.-S. Choi, S. Nesic / International Journa
n the system did not significantly increase the corrosion rates ofarbon steel. A similar high corrosion rate was reported for car-on steel at 82 bar pCO2, 80 ◦C (Cui et al., 2004). The commonlyccepted explanation for the effect of pCO2 on the corrosion rate ishat with pCO2 the concentration of H2CO3 increases and acceler-tes the cathodic reaction (Eq. (32)) and ultimately the corrosionate (Nesic, 2007).
H2CO3+ 2e−→ H2+ 2HCO3− (32)
Based on the water chemistry predicted in Fig. 6(a), the concen-rations of H2CO3 in these experiments would be 1.67 mM (40 bar),.26 mM (60 bar), and 2.68 mM (80 bar). Compared with the con-entration at 1 bar (0.044 mM), it increases almost 60 times withhanging pCO2 from 1 bar to 80 bar, whereas pH changes from.05 (1 bar) to 3.14 (80 bar) (Fig. 7(b)). This agrees with the findingWang et al., 2004) that the anodic reaction is practically unaffectedhen the pCO2 is increased from 3 to 20 bar while the cathodic
imiting current density is strongly increased due to the dominantffect of H2CO3.
Fig. 10 shows the surface morphologies of the corroded samplesn the CO2-saturated water phase at different pressures. It can be
een that the morphologies were almost identical with differentressures and the surface was locally covered by the corrosionroducts. Fig. 11 represents the SEM image and EDS spectra of theample surface exposed to the CO2-saturated water phase at 80 barig. 11. SEM image and EDS spectra of the corroded surface of samples exposed tohe CO2-saturated water for 24 h at 80 bar pCO2 and 50 ◦C: (a) SEM image, (b) EDSpectrum of area A, and (c) EDS spectrum of area B.
eenhouse Gas Control 5 (2011) 788–797 795
and 50 ◦C. The corrosion product consists mainly of iron carbide(Fe3C) and constituents of some alloying elements from the carbonsteel (area A), whereas the uncovered region was identified assteel substrate with trace amounts of carbon and oxygen (area B).The Fe3C initially presents in the carbon steel, reveals after thepreferential dissolution of ferrite (�-Fe) and accumulates on thesteel surface, therefore it is non-protective, porous and easily peelsoff from the substrate (Kermani and Morshed, 2003). Fig. 12 showsthe surface morphologies of samples in the CO2-saturated waterphase under different pCO after cleaning with Clarke solution. As
Fig. 12. SEM images of the corroded surface of samples exposed to the CO2-saturated water for 24 h with different pCO2 (after cleaning): (a) 40 bar, (b) 60 bar,and (c) 80 bar.

Journal Identification = IJGGC Article Identification = 374 Date: July 6, 2011 Time: 2:16 pm
7 l of Gr
in
spctsbF
F
96 Y.-S. Choi, S. Nesic / International Journa
t did not initiate localized corrosion due to the non-protectiveature of Fe3C film.
Fig. 13 shows the SEM images and EDS spectra of the sampleurface after 24 h in the water-saturated CO2 phase with differentressures. It is interesting to note that the sample surfaces wereovered by corrosion products after 24 h in the CO2-rich phase evenhough there was no free-water on the sample surface at the initial
tage. SEM and EDS analysis showed that the surface was coveredy dense, crystalline iron carbonate (FeCO3), and the grain size ofeCO3 decreased with increasing pressure. This indicates that cor-ig. 13. SEM images and EDS spectra of the corroded surface of samples exposed to the w
eenhouse Gas Control 5 (2011) 788–797
rosion can take place in the water-saturated CO2 phase under highpCO2 conditions, but the corrosion rate is low (∼0.2 mm/y) due tothe formation of FeCO3 on the steel surface. This may be explainedby the condensation of water from the CO2 phase due to pressure ortemperature changes during the experiment. Since the CO2 phasewas saturated by water, it is very likely that dissolved water cancondense with small changes of pressure and temperature. Once
the water condenses on the steel surface, it will become immedi-ately saturated with CO2 so that FeCO3 can precipitate on the steelsurface and further reduce the corrosion reaction.ater-saturated CO2 for 24 h with different pCO2: (a) 40 bar, (b) 60 bar, and (c) 80 bar.

Journal Identification = IJGGC Article Identification = 374 Date: July 6, 2011 Time: 2:16 pm
l of Gr
5
tppsbf
•
•
•
•
•
•
•
A
fC
R
A
A
B
Y.-S. Choi, S. Nesic / International Journa
. Conclusions
The mutual solubilities of CO2 and water, and the chemistry ofhe free water over wide ranges of temperature and pressure, wereredicted by thermodynamic modeling. In addition, the corrosionroperties with increasing pressure were investigated for carbonteel in both CO2-saturated water and water-saturated CO2 phasesy weight loss measurements and surface analysis techniques. Theollowing conclusions are drawn:
The solubility of water in CO2 and the solubility of CO2 in waterincreased with increasing pressure, however, the solubility of CO2in water was much larger than that of water in CO2.The solubility of water in CO2 increased while the solubility ofCO2 in water decreased with an increase in temperature.The calculated water solubility in CO2 showed good agree-ment between the calculated and experimental data at lowand medium temperatures, and up to 300 bar of pressure.When temperature was above 75 ◦C, there were significantdiscrepancies.The calculated CO2 solubility in water from 15 to 85 ◦C, and up to300 bar, showed a good agreement with experimental data.The concentrations of CO2(aq), H2CO3 and HCO3
− increased withincreasing pressure but decreased with an increase in tem-perature. The concentration of CO3
2− increased linearly withincreasing pressure and temperature, and the pH value changedin the range of 4.4–3 which decreased with an increase in pressureand increased with increasing temperature.The corrosion rates of carbon steel in the CO2-saturated waterwere very high but did not significantly change with pressurefrom 40 to 80 bar.Corrosion can take place in the water-saturated CO2 phase underhigh pressure conditions when no free water is present, but thecorrosion rate was low (∼0.2 mm/y) due to the formation ofFeCO3 on the steel surface.
cknowledgments
The authors would like to acknowledge the financial supportrom Ohio Coal Development Office (OCDO) for the Institute fororrosion and Multiphase Technology at Ohio University.
eferences
STM Standard G1-03, 2003. Standard practice for preparing, cleaning, and evalu-ating corrosion test specimens. In: Annual Book of ASTM Standards, vol. 03. 02,ASTM International, West Conshohocken, PA.
STM Standard G 31, 1994. Standard practice for laboratory immersion corrosion
testing of metals. In: Annual Book of ASTM Standards, vol. 03. 02, ASTM Inter-national, West Conshohocken, PA.amberger, A., Sieder, G., Maurer, G., 2000. High-pressure (vapor + liquid) equi-librium in binary mixtures of (carbon dioxide + water or acetic acid) attemperatures from 313 to 353 K. The Journal of Supercritical Fluids 17, 97–110.
eenhouse Gas Control 5 (2011) 788–797 797
Briones, J.A., Mullins, J.C., Thies, M.C., Kim, B.U., 1987. Ternary phase equilibria foracetic acid–water mixtures with supercritical carbon dioxide. Fluid Phase Equi-libria 36, 235–246.
Brown, B., Lee, K.-L.J., Nesic, S., 2003. Corrosion in multiphase flow containing smallamounts of H2S, CORROSION/2003. NACE, Houston, TX, Paper No. 03341.
Coan, C.R., King, A.D., 1971. Solubility of water in compressed carbon dioxide, nitrousoxide, and ethane. Evidence for hydration of carbon dioxide and nitrous oxidein the gas phase. Journal of the American Chemical Society 93 (8), 1857–1862.
Connell, D.P., 2005. Carbon Dioxide Capture Options for Large Point Sources inthe Midwestern United States: An Assessment of Candidate Technologies, FinalReport. CONSOL Energy Inc., South Park, PA.
Cui, Z.D., Wu, S.L., Li, C.F., Zhu, S.L., Yang, X.J., 2004. Corrosion behavior of oil tubesteels under conditions of multiphase flow saturated with super-critical carbondioxide. Materials Letters 58, 1035–1040.
Gale, J., Davison, J., 2004. Transmission of CO2-safety and economic considerations.Energy 29, 1319–1328.
Kermani, M.B., Morshed, A., 2003. Carbon dioxide corrosion in oil and gas production– a compendium. Corrosion 59, 659–683.
King, M.B., Mubarak, A., Kim, J.D., Bott, T.R., 1992. The mutual solubilities of waterwith supercritical and liquid carbon dioxide. The Journal of Supercritical Fluids5, 296–302.
Kongshaug, K.O., Seiersten, M., 2004. Baseline experiments for the modelling of cor-rosion at high CO2 pressure, CORROSION/2004. NACE, Houston, TX, Paper No.04630.
Kruse, H., Tekiela, M., 1996. Calculating the consequences of a CO2-pipeline rupture.Energy Conversion and Management 37, 1013–1018.
McGrail, B.P., Schaef, H.T., Glezakou, V.-A., Dang, L.X., Owen, A.T., 2009. Water reac-tivity in the liquid and supercritical CO2 phase: has half the story been neglected?Energy Procedia 1, 3415–3419.
Meyssami, B., Balaban, M.O., Teixeira, A.A., 1992. Prediction of pH in model systemspressurized with carbon dioxide. Biotechnology Progress 8, 149–154.
Nesic, S., 2007. Key issues related to modelling of internal corrosion of oil and gaspipelines – a review. Corrosion Science 49, 4308–4338.
Nordsveen, M., Nesic, S., Nyborg, R., Stangeland, A., 2003. A mechanistic modelfor carbon dioxide corrosion of mild steel in the presence of protective ironcarbonate films – part 1: theory and verification. Corrosion 59, 443–456.
Prausnitz, J.M., Lichtenthaller, R.N., De Azedevo, E.G., 1986. Molecular Thermody-namics of Fluid Phase Equilibria. Prentice Hall, New York, NY.
Propp, W.A., Carleson, T.E., Wai, C.M., Taylor, P.R., Daehling, K.W., Huang, S., Abdel-Latif, M., 1996. Corrosion in Supercritical Fluids. US Department of Energy reportDE96014006, Washington DC.
Redlich, O., Kwong, J.N.S., 1949. On the thermodynamics of solutions. V. An equationof state. Fugacities of gaseous solutions. Chemical Reviews 44, 233–244.
Rubin, E., Meyer, L., Coninck, H., 2005. Carbon Dioxide Capture and Storage: TechnicalSummary. IPCC Special Report, p. 29.
Russick, E.M., Poulter, G.A., Adkins, C.L.J., Sorensen, N.R., 1996. Corrosive effects ofsupercritical carbon dioxide and cosolvents on metals. The Journal of Supercrit-ical Fluids 9, 43–50.
Seiersten, M., Kongshaug, K.O., 2005. Materials selection for capture, compression,transport and injection of CO2. In: Thomas, D.C., Benson, S.M. (Eds.), CarbonDioxide Capture for Storage in Deep Geologic Formations, vol. 2. Elsevier Ltd.,Oxford, UK, pp. 937–953.
Song, K.Y., Kobayashi, R., 1987. Water content of CO2 in equilibrium with liquidwater and/or hydrates. SPE Formation Evaluation, 500–508.
Spycher, N., Pruess, K., King, J.E., 2003. CO2–H2O mixtures in the geological seques-tration of CO2. I. Assessment and calculation of mutual solubilities from 12 to100 ◦C and up to 600 bar. Geochimica et Cosmochimica Acta 67, 3015–3031.
Stevens, S.H., Gale, J., 2000. Geologic CO2 sequestration. Oil and Gas Journal 98,40–44.
Teng, H., Yamasaki, A., 2002. Pressure-mole fraction phase diagrams for CO2–purewater system under temperatures and pressures corresponding to ocean watersat depth to 3000 m. Chemical Engineering Communications 189, 1485–1497.
Wang, S., George, K., Nesic, S., 2004. High pressure CO2 corrosion electrochemistryand the effect of acetic acid, CORROSION/2004. NACE, Houston, TX, Paper No.375.
Wiebe, R., 1941. The binary system carbon dioxide–water under pressure. ChemicalReviews 29, 475–481.