international journal of greenhouse gas controlamz/publications/2015_eid_ziolkowski... ·...
TRANSCRIPT

Sio
Ra
b
a
ARRA
KCMMTRP
1
oetm
ttt(Itmoi
h1
International Journal of Greenhouse Gas Control 43 (2015) 70–81
Contents lists available at ScienceDirect
International Journal of Greenhouse Gas Control
j ourna l ho me page: www.elsev ier .com/ locate / i jggc
eismic monitoring of CO2 plume growth, evolution and migrationn a heterogeneous reservoir: Role, impact and importancef patchy saturation
ami Eida,∗, Anton Ziolkowskia, Mark Naylora, Gillian Pickupb
University of Edinburgh, Edinburgh EH9 3FE, United KingdomHeriot-Watt University, Edinburgh EH14 4AS, United Kingdom
r t i c l e i n f o
rticle history:eceived 22 July 2015eceived in revised form 12 October 2015ccepted 20 October 2015
eywords:CSonitoringigration
ime-lapse seismic
a b s t r a c t
We combine reservoir simulation with 2D synthetic seismic reflection time-lapse data to assess theability of seismic methods to image plume growth, evolution, and migration within a heterogeneoussaline reservoir. The incorporation of reservoir heterogeneity results in a range of saturations due tothe tortuous migration around the intra-reservoir baffles. To account for the disruptive nature of theinjected CO2, and the uncertainties regarding the fluid saturation distribution, we use two end-membermodels, uniform and patchy, to generate the widest range of seismic velocity distributions to understandthe range of velocity-saturation behaviour which could be encountered. The generated seismic sectionsshow clear differences between the two models while also providing confidence in the ability to detectCO2 plume growth and evolution in the reservoir. A free-phase migrating front of CO2 appears to be
ock physicsatchy saturation
difficult to detect, however. The ability to image a front is shown to be dependent not only on the pore-fluid saturation distribution – patchy or uniform – but also on its larger-scale spatial geometry. As thesubtle change in amplitude is directly related to the concentration of CO2 within each accumulation, itsuggests that the saturation model has important implications for CO2 detectability and for quantifyingthe volume of CO2 injected into the reservoir.
© 2015 Elsevier Ltd. All rights reserved.
. Introduction
To demonstrate successful containment of injected CO2 as partf a carbon capture and storage (CCS) project, the operator isxpected to monitor, measure and validate the injected CO2 inhe intended formation and, importantly, identify and quantify any
ovement within the reservoir.Seismic techniques are commonly used to monitor CO2 con-
ainment over the lifetime of a project (Lumley, 2010). Throughhe application of time-lapse seismic surveys, pilot CO2 seques-ration sites such as Sleipner (Arts et al., 2004, 2008), WeyburnWilson and Monea, 2004) and Ketzin (Bergmann et al., 2011;vandic et al., 2012, 2015) have successfully monitored structurallyrapped CO2, because the displacement of brine by less dense and
ore compressible CO2 results in changes in the acoustic propertiesf the reservoir (Pearce, 2005). However, the ability to accuratelymage a free-phase migrating CO2 plume during injection remains
∗ Corresponding author.E-mail address: [email protected] (R. Eid).
ttp://dx.doi.org/10.1016/j.ijggc.2015.10.019750-5836/© 2015 Elsevier Ltd. All rights reserved.
challenging due to uncertainties regarding the pore-scale dis-tribution of fluids within the reservoir, and in turn, the mostappropriate rock-physics model to simulate this. As the seismicresponse depends not only on the fluid type – liquid or gas – butalso on the fine-scale spatial distribution of the phases (White,1975; Mavko and Mukerji, 1998), end-member fluid distributionmodels are used here to predict the possible range of expectedvelocities prior to generating and interpreting the seismic response.A free-phase migrating CO2 plume is defined as CO2 which is notimmobilized by residual or structural trapping.
Fluid-flow to seismic modelling workflows are typically usedbefore, during and after CO2 injection to determine what a givensensor would measure in a given environment. This is the pro-cess through which a subsurface geological model is injected withCO2 and then transformed into a synthetic seismic record. This toolis used during initial storage-site assessment stages to determinewhether the injected CO2 will generate an interpretable change in
signature on processed reflection seismic data. Synthetic recordsgenerated during and after injection facilitate the interpretation ofthe processed data and assist in the process of history matching.Such workflows have been successfully used to history match the
R. Eid et al. / International Journal of Greenhouse Gas Control 43 (2015) 70–81 71
model the time-lapse seismic response of injected CO2.
me
sedttattUsmGPisMubiocpn
oSovtatwawimopp
2
sitTst
and evolution of the injected CO2. The zones provide obstacles tomigration, allowing for accumulations beneath each barrier andallowing for an assessment of the potential of seismic techniquesto detect them.
Fig. 1. Three-stage model-driven workflow used to
igration of the CO2 plume at Sleipner (Chadwick et al., 2006; Singht al., 2010; Boait et al., 2012).
Gassmann’s equation (Gassmann, 1951) is used almost exclu-ively for fluid substitution to estimate the effect of fluid changes onlastic properties. However, one of the main assumptions is that theistributed phases are immiscible and homogeneously distributedhroughout the pore space (uniform fluid saturation). This assump-ion is valid for virgin reservoir systems or trapped hydrocarbonccumulations which have come to equilibrium over geologicalimescales. However, the injection and migration of CO2 perturbshis equilibrium resulting in a non-uniform distribution. Patchy andniform saturation distributions represent two extreme bounds of
ub-seismic scale saturation heterogeneity, representing the bulkodulus of the fluid mixture which can then be input directly intoassmann’s equation for modelling (Mavko and Mukerji, 1998).atchy saturation represents the upper bound of seismic veloc-ties while Uniform saturation represents the lower bounds ofeismic velocities as a function of CO2 saturation (Sengupta andavko, 2003; Cairns et al., 2012). These end-member models are
sed here to generate the widest range of velocities which coulde encountered, as the exact relation between the two bounds
n the subsurface is usually unknown. Understanding the rangef pore-fluid saturation scales and the phase distributions whichould be encountered, therefore, is critical when assessing theotential for the detectability of CO2 migration using seismic tech-iques.
In this study, we compute the time-lapse seismic responsesf a heterogeneous saline reservoir in the UK sector of the Northea. The incorporation of reservoir heterogeneity results in a rangef saturations. This complexity allows for a more representativeelocity distribution. To account for the uncertainties regardinghe fluid saturation distribution, end-member models – uniformnd patchy – are used to generate the widest range of velocity dis-ributions to try to understand the velocity-saturation behaviourhich could be encountered. As the range of saturations within
pore space is constrained by limits for irreducible saturation,e have modified the patchy curve, so that it starts from a given
rreducible water saturation. The uniform and modified-patchyodels are then used to simulate time-lapse seismic responses in
rder to assess the potential for seismic methods to image CO2lume growth and evolution within a reservoir, as well as theotential to detect a free-phase migrating front of CO2.
. Methodology
To simulate a migrating plume, and investigate the range ofeismic responses due to the injected CO2, we model variations
n the time-lapse signal over a heterogeneous sandstone reservoirhrough the application of a three-stage model-driven workflow.his consists of fluid-flow modelling, rock physics modelling andeismic forward modelling, as illustrated in Fig. 1. We now describehe different stages in the modelling.Fig. 2. Bunter Sandstone Model with each dome labelled and a location map.Modified from Williams et al. (2013)
2.1. Geological model
The model used in this study is an adaptation from Williams et al.(2013), representing part of the Triassic Bunter Sandstone Forma-tion in the UK sector of the North Sea (Fig. 2). This formation hasbeen identified as having the potential to store large amounts ofCO2 within the saline reservoirs (Holloway et al., 2006, Heinemannet al., 2012). The model contains 3 dip-closed structures formed bypost-depositional halokinesis in the underlying halite-dominatedstrata of the Zechstein Group. These domes are unaffected by faul-ting and form ideal traps for injected CO2. The reservoir is overlainby mudstones of the Haisborough Group, forming an effective seal.
Williams et al. (2013) partitioned the formation into five zonesaccording to changes in depositional environment interpreted frompetrophysical analysis and a regional depositional model for theBunter Sandstone. The inferred reservoir properties within themodel were based on geophysical log analysis. The porosity isstrongly influenced by variations in lithology, and ranges from 10%to 35% (Fig. 3). Williams et al. (2013) provide a detailed descriptionof the reservoir model.
Each interpreted zone plays an important role in the growth
Fig. 3. Cross section through the reservoir highlighting the degree of heterogeneityin porosity.
72 R. Eid et al. / International Journal of Greenhouse Gas Control 43 (2015) 70–81
F on the
dbewurvtdCTltra
fbP2tbstfawTspt
F
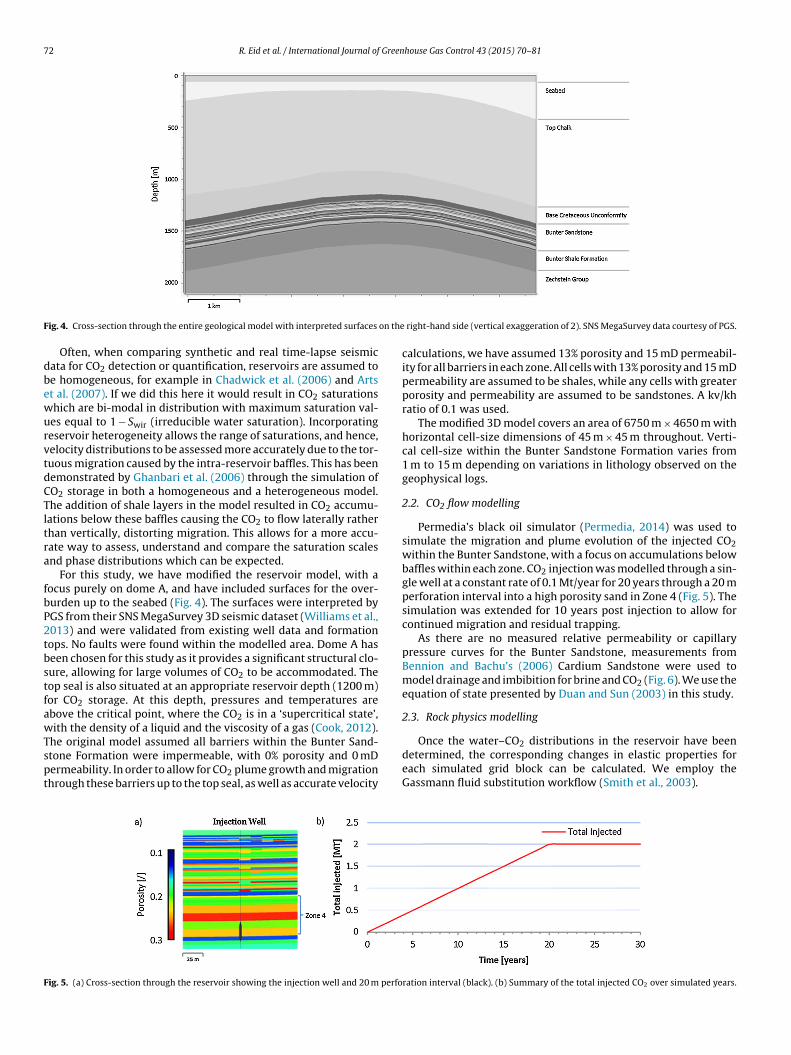
ig. 4. Cross-section through the entire geological model with interpreted surfaces
Often, when comparing synthetic and real time-lapse seismicata for CO2 detection or quantification, reservoirs are assumed toe homogeneous, for example in Chadwick et al. (2006) and Artst al. (2007). If we did this here it would result in CO2 saturationshich are bi-modal in distribution with maximum saturation val-es equal to 1 − Swir (irreducible water saturation). Incorporatingeservoir heterogeneity allows the range of saturations, and hence,elocity distributions to be assessed more accurately due to the tor-uous migration caused by the intra-reservoir baffles. This has beenemonstrated by Ghanbari et al. (2006) through the simulation ofO2 storage in both a homogeneous and a heterogeneous model.he addition of shale layers in the model resulted in CO2 accumu-ations below these baffles causing the CO2 to flow laterally ratherhan vertically, distorting migration. This allows for a more accu-ate way to assess, understand and compare the saturation scalesnd phase distributions which can be expected.
For this study, we have modified the reservoir model, with aocus purely on dome A, and have included surfaces for the over-urden up to the seabed (Fig. 4). The surfaces were interpreted byGS from their SNS MegaSurvey 3D seismic dataset (Williams et al.,013) and were validated from existing well data and formationops. No faults were found within the modelled area. Dome A haseen chosen for this study as it provides a significant structural clo-ure, allowing for large volumes of CO2 to be accommodated. Theop seal is also situated at an appropriate reservoir depth (1200 m)or CO2 storage. At this depth, pressures and temperatures arebove the critical point, where the CO2 is in a ‘supercritical state’,ith the density of a liquid and the viscosity of a gas (Cook, 2012).
he original model assumed all barriers within the Bunter Sand-tone Formation were impermeable, with 0% porosity and 0 mDermeability. In order to allow for CO2 plume growth and migrationhrough these barriers up to the top seal, as well as accurate velocity
ig. 5. (a) Cross-section through the reservoir showing the injection well and 20 m perfo
right-hand side (vertical exaggeration of 2). SNS MegaSurvey data courtesy of PGS.
calculations, we have assumed 13% porosity and 15 mD permeabil-ity for all barriers in each zone. All cells with 13% porosity and 15 mDpermeability are assumed to be shales, while any cells with greaterporosity and permeability are assumed to be sandstones. A kv/khratio of 0.1 was used.
The modified 3D model covers an area of 6750 m × 4650 m withhorizontal cell-size dimensions of 45 m × 45 m throughout. Verti-cal cell-size within the Bunter Sandstone Formation varies from1 m to 15 m depending on variations in lithology observed on thegeophysical logs.
2.2. CO2 flow modelling
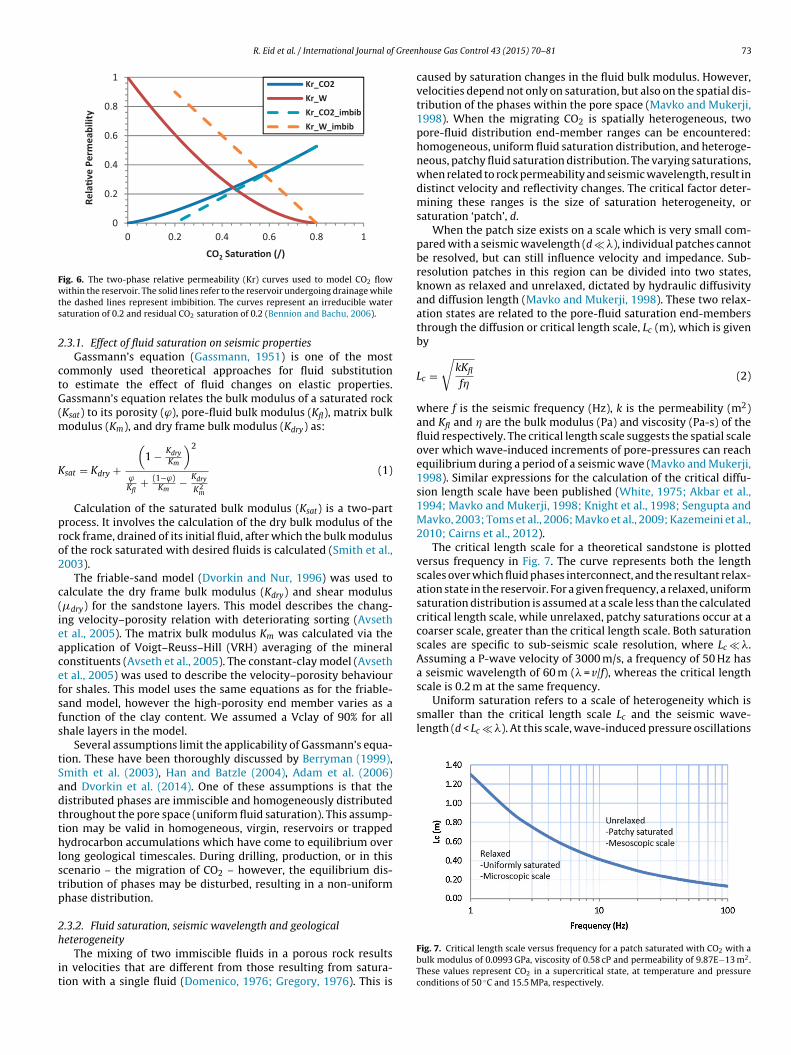
Permedia’s black oil simulator (Permedia, 2014) was used tosimulate the migration and plume evolution of the injected CO2within the Bunter Sandstone, with a focus on accumulations belowbaffles within each zone. CO2 injection was modelled through a sin-gle well at a constant rate of 0.1 Mt/year for 20 years through a 20 mperforation interval into a high porosity sand in Zone 4 (Fig. 5). Thesimulation was extended for 10 years post injection to allow forcontinued migration and residual trapping.
As there are no measured relative permeability or capillarypressure curves for the Bunter Sandstone, measurements fromBennion and Bachu’s (2006) Cardium Sandstone were used tomodel drainage and imbibition for brine and CO2 (Fig. 6). We use theequation of state presented by Duan and Sun (2003) in this study.
2.3. Rock physics modelling
Once the water–CO2 distributions in the reservoir have beendetermined, the corresponding changes in elastic properties for
each simulated grid block can be calculated. We employ theGassmann fluid substitution workflow (Smith et al., 2003).ration interval (black). (b) Summary of the total injected CO2 over simulated years.
R. Eid et al. / International Journal of Green
0
0.2
0.4
0.6
0.8
1
0 0.2 0.4 0.6 0.8 1
Rela
�ve
Perm
eabi
lity
CO2 Satura�on (/)
Kr_CO2Kr_WKr_CO2_i mbi bKr_W_ imbib
Fig. 6. The two-phase relative permeability (Kr) curves used to model CO2 flowwts
2
ctG(m
K
pro2
c(ieacefsfs
tSadtthlstp
2h
it
scale is 0.2 m at the same frequency.Uniform saturation refers to a scale of heterogeneity which is
smaller than the critical length scale Lc and the seismic wave-length (d < Lc � �). At this scale, wave-induced pressure oscillations
ithin the reservoir. The solid lines refer to the reservoir undergoing drainage whilehe dashed lines represent imbibition. The curves represent an irreducible wateraturation of 0.2 and residual CO2 saturation of 0.2 (Bennion and Bachu, 2006).
.3.1. Effect of fluid saturation on seismic propertiesGassmann’s equation (Gassmann, 1951) is one of the most
ommonly used theoretical approaches for fluid substitutiono estimate the effect of fluid changes on elastic properties.assmann’s equation relates the bulk modulus of a saturated rock
Ksat) to its porosity (ϕ), pore-fluid bulk modulus (Kfl), matrix bulkodulus (Km), and dry frame bulk modulus (Kdry) as:
sat = Kdry +
(1 − Kdry
Km
)2
ϕKfl
+ (1−ϕ)Km
− Kdry
K2m
(1)
Calculation of the saturated bulk modulus (Ksat) is a two-partrocess. It involves the calculation of the dry bulk modulus of theock frame, drained of its initial fluid, after which the bulk modulusf the rock saturated with desired fluids is calculated (Smith et al.,003).
The friable-sand model (Dvorkin and Nur, 1996) was used toalculate the dry frame bulk modulus (Kdry) and shear modulus�dry) for the sandstone layers. This model describes the chang-ng velocity–porosity relation with deteriorating sorting (Avsetht al., 2005). The matrix bulk modulus Km was calculated via thepplication of Voigt–Reuss–Hill (VRH) averaging of the mineralonstituents (Avseth et al., 2005). The constant-clay model (Avsetht al., 2005) was used to describe the velocity–porosity behaviouror shales. This model uses the same equations as for the friable-and model, however the high-porosity end member varies as aunction of the clay content. We assumed a Vclay of 90% for allhale layers in the model.
Several assumptions limit the applicability of Gassmann’s equa-ion. These have been thoroughly discussed by Berryman (1999),mith et al. (2003), Han and Batzle (2004), Adam et al. (2006)nd Dvorkin et al. (2014). One of these assumptions is that theistributed phases are immiscible and homogeneously distributedhroughout the pore space (uniform fluid saturation). This assump-ion may be valid in homogeneous, virgin, reservoirs or trappedydrocarbon accumulations which have come to equilibrium over
ong geological timescales. During drilling, production, or in thiscenario – the migration of CO2 – however, the equilibrium dis-ribution of phases may be disturbed, resulting in a non-uniformhase distribution.
.3.2. Fluid saturation, seismic wavelength and geological
eterogeneityThe mixing of two immiscible fluids in a porous rock resultsn velocities that are different from those resulting from satura-ion with a single fluid (Domenico, 1976; Gregory, 1976). This is
house Gas Control 43 (2015) 70–81 73
caused by saturation changes in the fluid bulk modulus. However,velocities depend not only on saturation, but also on the spatial dis-tribution of the phases within the pore space (Mavko and Mukerji,1998). When the migrating CO2 is spatially heterogeneous, twopore-fluid distribution end-member ranges can be encountered:homogeneous, uniform fluid saturation distribution, and heteroge-neous, patchy fluid saturation distribution. The varying saturations,when related to rock permeability and seismic wavelength, result indistinct velocity and reflectivity changes. The critical factor deter-mining these ranges is the size of saturation heterogeneity, orsaturation ‘patch’, d.
When the patch size exists on a scale which is very small com-pared with a seismic wavelength (d � �), individual patches cannotbe resolved, but can still influence velocity and impedance. Sub-resolution patches in this region can be divided into two states,known as relaxed and unrelaxed, dictated by hydraulic diffusivityand diffusion length (Mavko and Mukerji, 1998). These two relax-ation states are related to the pore-fluid saturation end-membersthrough the diffusion or critical length scale, Lc (m), which is givenby
Lc =√
kKfl
f�(2)
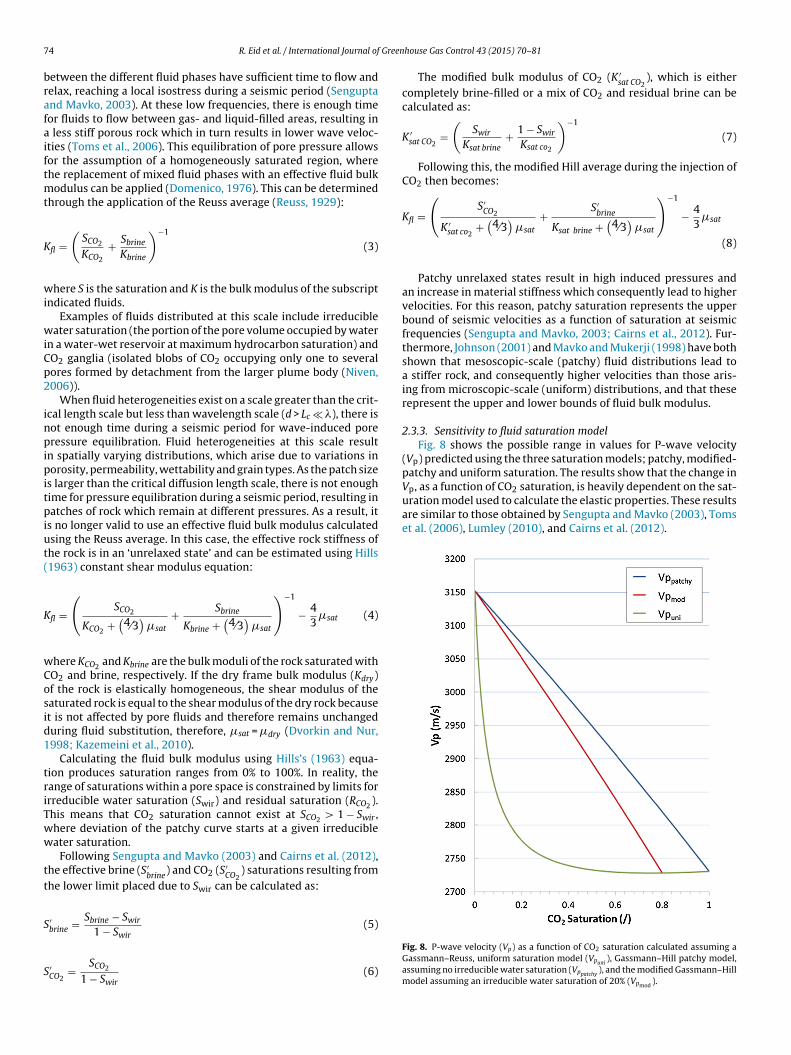
where f is the seismic frequency (Hz), k is the permeability (m2)and Kfl and � are the bulk modulus (Pa) and viscosity (Pa-s) of thefluid respectively. The critical length scale suggests the spatial scaleover which wave-induced increments of pore-pressures can reachequilibrium during a period of a seismic wave (Mavko and Mukerji,1998). Similar expressions for the calculation of the critical diffu-sion length scale have been published (White, 1975; Akbar et al.,1994; Mavko and Mukerji, 1998; Knight et al., 1998; Sengupta andMavko, 2003; Toms et al., 2006; Mavko et al., 2009; Kazemeini et al.,2010; Cairns et al., 2012).
The critical length scale for a theoretical sandstone is plottedversus frequency in Fig. 7. The curve represents both the lengthscales over which fluid phases interconnect, and the resultant relax-ation state in the reservoir. For a given frequency, a relaxed, uniformsaturation distribution is assumed at a scale less than the calculatedcritical length scale, while unrelaxed, patchy saturations occur at acoarser scale, greater than the critical length scale. Both saturationscales are specific to sub-seismic scale resolution, where Lc � �.Assuming a P-wave velocity of 3000 m/s, a frequency of 50 Hz hasa seismic wavelength of 60 m (� = v/f), whereas the critical length
Fig. 7. Critical length scale versus frequency for a patch saturated with CO2 with abulk modulus of 0.0993 GPa, viscosity of 0.58 cP and permeability of 9.87E−13 m2.These values represent CO2 in a supercritical state, at temperature and pressureconditions of 50 ◦C and 15.5 MPa, respectively.
7 Green
brafaiftmt
K
wi
wiCp2
inpipitpiut(
K
wCosid1
triTww
tt
S
S
Vp, as a function of CO2 saturation, is heavily dependent on the sat-uration model used to calculate the elastic properties. These resultsare similar to those obtained by Sengupta and Mavko (2003), Tomset al. (2006), Lumley (2010), and Cairns et al. (2012).
4 R. Eid et al. / International Journal of
etween the different fluid phases have sufficient time to flow andelax, reaching a local isostress during a seismic period (Senguptand Mavko, 2003). At these low frequencies, there is enough timeor fluids to flow between gas- and liquid-filled areas, resulting in
less stiff porous rock which in turn results in lower wave veloc-ties (Toms et al., 2006). This equilibration of pore pressure allowsor the assumption of a homogeneously saturated region, wherehe replacement of mixed fluid phases with an effective fluid bulk
odulus can be applied (Domenico, 1976). This can be determinedhrough the application of the Reuss average (Reuss, 1929):
fl =(
SCO2
KCO2
+ Sbrine
Kbrine
)−1
(3)
here S is the saturation and K is the bulk modulus of the subscriptndicated fluids.
Examples of fluids distributed at this scale include irreducibleater saturation (the portion of the pore volume occupied by water
n a water-wet reservoir at maximum hydrocarbon saturation) andO2 ganglia (isolated blobs of CO2 occupying only one to severalores formed by detachment from the larger plume body (Niven,006)).
When fluid heterogeneities exist on a scale greater than the crit-cal length scale but less than wavelength scale (d > Lc � �), there isot enough time during a seismic period for wave-induced poreressure equilibration. Fluid heterogeneities at this scale result
n spatially varying distributions, which arise due to variations inorosity, permeability, wettability and grain types. As the patch size
s larger than the critical diffusion length scale, there is not enoughime for pressure equilibration during a seismic period, resulting inatches of rock which remain at different pressures. As a result, it
s no longer valid to use an effective fluid bulk modulus calculatedsing the Reuss average. In this case, the effective rock stiffness ofhe rock is in an ‘unrelaxed state’ and can be estimated using Hills1963) constant shear modulus equation:
fl =(
SCO2
KCO2 +(
4⁄3)
�sat
+ Sbrine
Kbrine +(
4⁄3)
�sat
)−1
− 43
�sat (4)
here KCO2 and Kbrine are the bulk moduli of the rock saturated withO2 and brine, respectively. If the dry frame bulk modulus (Kdry)f the rock is elastically homogeneous, the shear modulus of theaturated rock is equal to the shear modulus of the dry rock becauset is not affected by pore fluids and therefore remains unchangeduring fluid substitution, therefore, �sat = �dry (Dvorkin and Nur,998; Kazemeini et al., 2010).
Calculating the fluid bulk modulus using Hills’s (1963) equa-ion produces saturation ranges from 0% to 100%. In reality, theange of saturations within a pore space is constrained by limits forrreducible water saturation (Swir) and residual saturation (RCO2 ).his means that CO2 saturation cannot exist at SCO2 > 1 − Swir ,here deviation of the patchy curve starts at a given irreducibleater saturation.
Following Sengupta and Mavko (2003) and Cairns et al. (2012),he effective brine (S′
brine) and CO2 (S′
CO2) saturations resulting from
he lower limit placed due to Swir can be calculated as:
′brine = Sbrine − Swir (5)
1 − Swir
′CO2
= SCO2
1 − Swir(6)
house Gas Control 43 (2015) 70–81
The modified bulk modulus of CO2 (K ′sat CO2
), which is eithercompletely brine-filled or a mix of CO2 and residual brine can becalculated as:
K ′sat CO2
=(
Swir
Ksat brine+ 1 − Swir
Ksat co2
)−1
(7)
Following this, the modified Hill average during the injection ofCO2 then becomes:
Kfl =(
S′CO2
K ′sat co2
+(
4⁄3)
�sat
+ S′brine
Ksat brine +(
4⁄3)
�sat
)−1
− 43
�sat
(8)
Patchy unrelaxed states result in high induced pressures andan increase in material stiffness which consequently lead to highervelocities. For this reason, patchy saturation represents the upperbound of seismic velocities as a function of saturation at seismicfrequencies (Sengupta and Mavko, 2003; Cairns et al., 2012). Fur-thermore, Johnson (2001) and Mavko and Mukerji (1998) have bothshown that mesoscopic-scale (patchy) fluid distributions lead toa stiffer rock, and consequently higher velocities than those aris-ing from microscopic-scale (uniform) distributions, and that theserepresent the upper and lower bounds of fluid bulk modulus.
2.3.3. Sensitivity to fluid saturation modelFig. 8 shows the possible range in values for P-wave velocity
(Vp) predicted using the three saturation models; patchy, modified-patchy and uniform saturation. The results show that the change in
Fig. 8. P-wave velocity (Vp) as a function of CO2 saturation calculated assuming aGassmann–Reuss, uniform saturation model (Vpuni
), Gassmann–Hill patchy model,assuming no irreducible water saturation (Vppatchy
), and the modified Gassmann–Hillmodel assuming an irreducible water saturation of 20% (Vpmod ).

Greenhouse Gas Control 43 (2015) 70–81 75
r0sdibotmFflirtAt
mvwuflflesgstanwosus
msvrcwHtma2
Table 1Synthetic seismic modelling acquisition parameters.
Acquisition parameters
Receiver spacing (m) 25Source spacing (m) 25Cable length (m) 5500
Fa
R. Eid et al. / International Journal of
The Gassmann–Reuss (uniform saturation) model predicts aapid change of about −12% in Vp as CO2 saturation increases from% to ∼20%, while showing very little further change at higheraturations. However, patchy and modified patchy models pre-ict a linear Vp–saturation relationship showing a linear decrease
n velocity with increasing saturation. The large range of possi-le saturations for a given velocity demonstrates the importancef understanding and modelling the range of fluid saturation dis-ribution models (uniform/patchy) when predicting the fluid bulk
odulus prior to generating and interpreting the seismic response.urthermore, the large range of saturations has great implicationsor CO2 quantification from seismic velocities as it highlights theevel of uncertainty which could be encountered. This is evidentn Fig. 8, where an observed change in velocity of −300 m/s couldesult from either 12% CO2 assuming a uniform saturation dis-ribution or 60% CO2 assuming a patchy saturation distribution.ssuming purely a uniform saturation distribution could poten-
ially underestimate the amount of stored CO2 in the subsurface.Furthermore, the water–CO2 distributions from the CO2 flow
odelling results represent a single ‘homogeneous’ saturationalue for each grid cell. Each value is then used to compute velocity,here a choice of two models are available – modified patchy andniform – depending on the critical length scale and the size of theuid patches. As cell dimensions are typically chosen to optimizeow modelling, reservoir models are built with coarse grid-cells, asvident with the Bunter model, which has vertical cell-size dimen-ions of 1–15 m. Cell size dimensions at these scales are muchreater than the calculated critical length scales for the range ofeismic frequencies shown in Fig. 7. This indicates that the satura-ion distribution within each grid cell is not clearly modelled. Toccount for this, we assume that each cell with a single ‘homoge-eous’ saturation value represents the bulk saturation of the cell,hereas in fact each cell will, in theory, have varying saturations
f CO2 at the meso-scale. As we are dealing with sub-seismic scaleaturation distributions, we feel that this assumption is valid as sat-rations distributed at this scale are not resolvable on seismic buttill influence seismic velocity and impedance.
It should also be noted that the calculation of the end-memberodels assumes a single rock facies with homogeneous lithology
uch that Km, Kdry and ϕ are uniform in space. Spatial variations inelocities are assumed to result only from differing pore fluid satu-ations (Mavko and Mukerji, 1998). This is not valid for all reservoironditions, particularly for modelling heterogeneous reservoirsith spatially varying properties such as porosity and permeability.eterogeneous reservoirs would result in a range of velocities dis-
ributed between the patchy and uniform saturation end-memberodels determined by variations in permeability, fluid viscosity,
nd patch size (Mavko and Mukerji, 1998; Sengupta and Mavko,003; Lebedev et al., 2009; Cairns et al., 2012). Furthermore, the
ig. 9. Zero-phase Butterworth wavelet at 2.0 ms sample interval. A low and high cut fpplied.
Number of receivers 236Number of shots 220Recording length (s) 2
flow of CO2 through a volume in the subsurface would result ina transition from patchy to uniform saturation distribution withincreasing time. This transition has been demonstrated by Lebedevet al. (2009) in laboratory experiments, where the authors suggestthat it occurs as a result of the interplay between the characteristicsize and distribution of the fluid patches and the diffusion length,controlled by properties of the rock matrix, pore fluids and signalfrequency. Understanding the rate at which this transition occurs,and at what patch size and overall saturation, is still an area ofresearch which needs to be addressed.
Although we have not addressed the reasoning behind this tran-sition in this study, we have accounted for it by simulating the endmember models – uniform and modified-patchy – for each time-step in order to generate the widest range of velocities which couldbe encountered.
2.4. Seismic forward modelling
Using Nucleus+ (Taylor and Julliard, 2013), 2D elastic finite-difference wave propagation modelling was applied to simulatethe acquisition of a single line towed streamer seismic survey basedon acquisition parameters similar to real time-lapse data (Table 1).The source signature is a zero-phase Butterworth wavelet of 2.0 mssample interval, with low cut and high cut frequencies of 8 Hz and90 Hz and slopes of 18 and 72 dB/octave, respectively (Fig. 9).
Synthetic shot records were generated along a 6 km east–westsection. The modelling was performed for selected monitoringstages, for both uniform and modified-patchy saturation cases.After NMO correction, the traces were stacked and depth migratedusing the phase-shift plus interpolation (PSPI) method (Fergusonand Margrave, 2005), available through the CREWES toolkit in Mat-lab (Margrave, 2003).
3. Results
3.1. CO2 saturation distribution
Fig. 10(a–c) shows 2D sections of the 3D simulation resultsat three stages (5 years, 11 years and 20 years) of plume
requency of 8 and 90 Hz and low and high cut slope of 18 and 72 dB/octave were
76 R. Eid et al. / International Journal of Greenhouse Gas Control 43 (2015) 70–81
F lutionS
esofsttCawrti2auh
3
rttsp
Fu
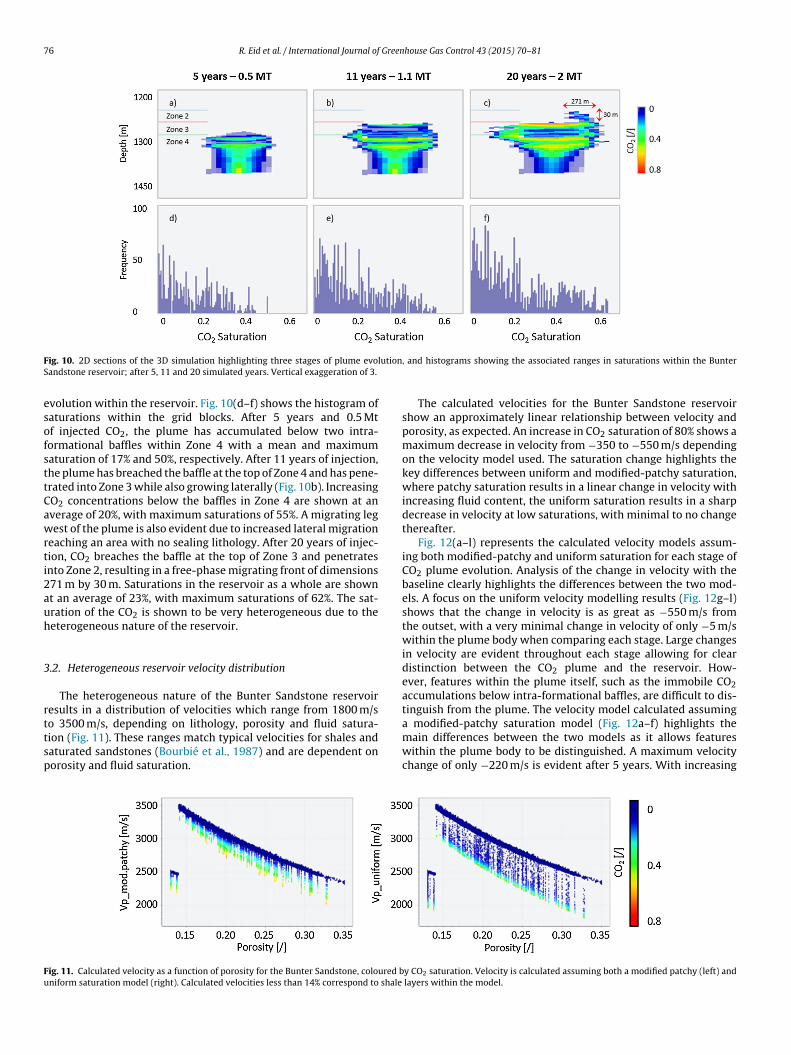
ig. 10. 2D sections of the 3D simulation highlighting three stages of plume evoandstone reservoir; after 5, 11 and 20 simulated years. Vertical exaggeration of 3.
volution within the reservoir. Fig. 10(d–f) shows the histogram ofaturations within the grid blocks. After 5 years and 0.5 Mtf injected CO2, the plume has accumulated below two intra-ormational baffles within Zone 4 with a mean and maximumaturation of 17% and 50%, respectively. After 11 years of injection,he plume has breached the baffle at the top of Zone 4 and has pene-rated into Zone 3 while also growing laterally (Fig. 10b). IncreasingO2 concentrations below the baffles in Zone 4 are shown at anverage of 20%, with maximum saturations of 55%. A migrating legest of the plume is also evident due to increased lateral migration
eaching an area with no sealing lithology. After 20 years of injec-ion, CO2 breaches the baffle at the top of Zone 3 and penetratesnto Zone 2, resulting in a free-phase migrating front of dimensions71 m by 30 m. Saturations in the reservoir as a whole are shownt an average of 23%, with maximum saturations of 62%. The sat-ration of the CO2 is shown to be very heterogeneous due to theeterogeneous nature of the reservoir.
.2. Heterogeneous reservoir velocity distribution
The heterogeneous nature of the Bunter Sandstone reservoiresults in a distribution of velocities which range from 1800 m/s
o 3500 m/s, depending on lithology, porosity and fluid satura-ion (Fig. 11). These ranges match typical velocities for shales andaturated sandstones (Bourbié et al., 1987) and are dependent onorosity and fluid saturation.ig. 11. Calculated velocity as a function of porosity for the Bunter Sandstone, coloured bniform saturation model (right). Calculated velocities less than 14% correspond to shale
, and histograms showing the associated ranges in saturations within the Bunter
The calculated velocities for the Bunter Sandstone reservoirshow an approximately linear relationship between velocity andporosity, as expected. An increase in CO2 saturation of 80% shows amaximum decrease in velocity from −350 to −550 m/s dependingon the velocity model used. The saturation change highlights thekey differences between uniform and modified-patchy saturation,where patchy saturation results in a linear change in velocity withincreasing fluid content, the uniform saturation results in a sharpdecrease in velocity at low saturations, with minimal to no changethereafter.
Fig. 12(a–l) represents the calculated velocity models assum-ing both modified-patchy and uniform saturation for each stage ofCO2 plume evolution. Analysis of the change in velocity with thebaseline clearly highlights the differences between the two mod-els. A focus on the uniform velocity modelling results (Fig. 12g–l)shows that the change in velocity is as great as −550 m/s fromthe outset, with a very minimal change in velocity of only −5 m/swithin the plume body when comparing each stage. Large changesin velocity are evident throughout each stage allowing for cleardistinction between the CO2 plume and the reservoir. How-ever, features within the plume itself, such as the immobile CO2accumulations below intra-formational baffles, are difficult to dis-tinguish from the plume. The velocity model calculated assuming
a modified-patchy saturation model (Fig. 12a–f) highlights themain differences between the two models as it allows featureswithin the plume body to be distinguished. A maximum velocitychange of only −220 m/s is evident after 5 years. With increasingy CO2 saturation. Velocity is calculated assuming both a modified patchy (left) and layers within the model.

R. Eid et al. / International Journal of Greenhouse Gas Control 43 (2015) 70–81 77
F alcula( nge inz
av−chdmivf
3
icatHl
itar
ig. 12. Results highlighting the petrophysical modelling results. (a–c) show the cg–i) calculated Vp assuming a uniform saturation model, (m–o) highlighting the chaones within the reservoir. Vertical exaggeration of 3.
ccumulations below the intra-reservoir baffles, the change inelocity is shown to be as great as −270 m/s after 11 years and450 m/s after 20 years. This change in velocity is similar to those
alculated assuming a uniform saturation distribution. At theseigh saturations, the magnitude of the velocity change is indepen-ent of the model used as the calculated velocities converge as theaximum saturation is reached. A focus on the free-phase migrat-
ng front of CO2 within Zone 2 after 20 years shows a change ofelocity of roughly −110 m/s for the patchy model and −400 m/sor the uniform model.
.3. Time-lapse seismic response
The depth-migrated seismic section, juxtaposed with the veloc-ty model, is shown in Fig. 13. Strong amplitude reflections arelearly evident at interfaces where the seismic velocity changesbruptly. Within the Bunter reservoir, reflectivity is increased dueo increased heterogeneity, producing lateral changes in velocity.igh amplitude reflectors within the reservoir correspond to the
ow porosity sands.The introduction of CO2 into the reservoir results in an increase
n reflectivity and a prominent time-shift. The time-lapse sec-ions (Fig. 14d–i) show clear differences between the uniformnd modified-patchy saturation models. The synthetic seismicesults calculated using the uniform velocity model show a clear
ted Vp assuming a modified-patchy model, (d–f) highlighting the change with Vp , Vp with baseline. The coloured line represent the locations of the three interpreted
change in amplitude, as well as a prominent time-shift belowthe plume. The synthetics calculated using the modified-patchymodel are very different, with lower amplitude reflectors, oftencorresponding to zones of highly saturated, structurally trappedCO2.
4. Discussion
4.1. Monitorability of plume growth within a reservoir
A comparison of the three modelled stages provides confi-dence in the ability of seismic techniques to image plume growthand evolution within the reservoir, as the top-most reflector ineach seismic section corresponds to the top-most accumulation ofCO2.
Furthermore, a detailed look at the plume after 20 years (Fig. 15)shows negative seismic impedance contrasts corresponding to thestructurally trapped CO2. Interpretation of the modified-patchymodel shows three primary reflectors, which can be attributed tothe three main CO2 accumulations. The amplitude of the reflectoris also shown to be strongest at the centre, gradually becom-
ing weaker farther out in both directions, as highlighted in theenlarged box in Fig. 15. Although this can also be interpreted in theuniform seismic section, it proves more difficult as each reflectorshows a large change in amplitude throughout. As the subtle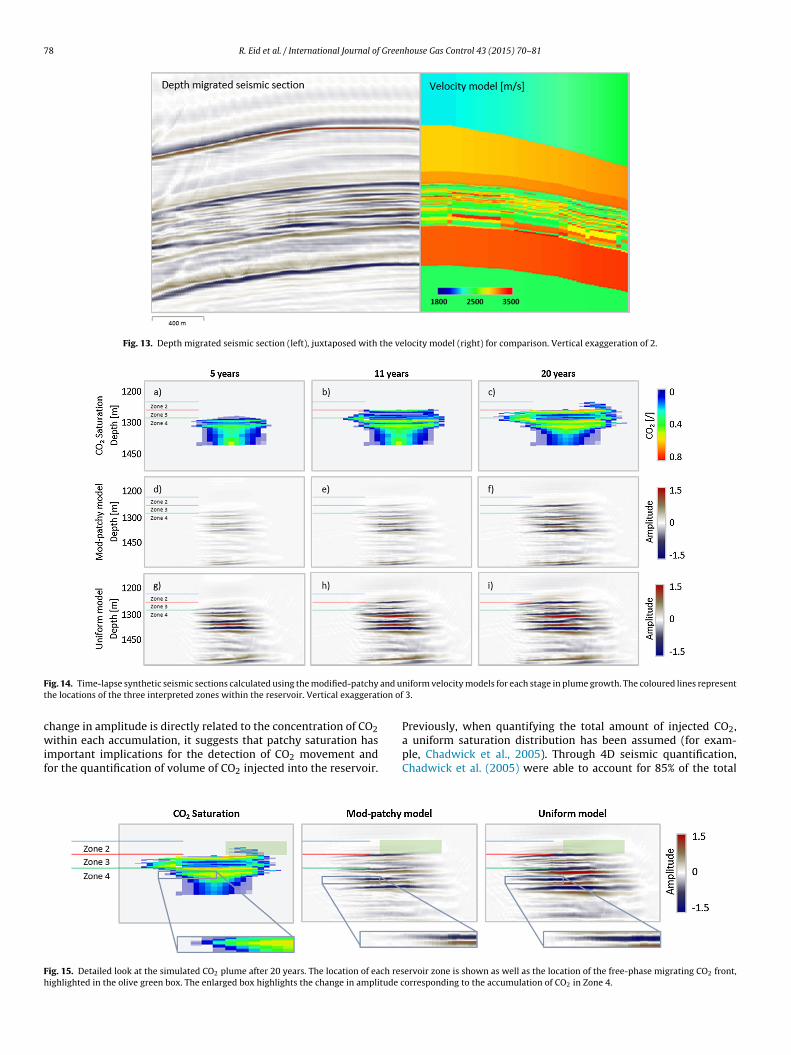
78 R. Eid et al. / International Journal of Greenhouse Gas Control 43 (2015) 70–81
Fig. 13. Depth migrated seismic section (left), juxtaposed with the velocity model (right) for comparison. Vertical exaggeration of 2.
F and ut ion of
cwif
Fh
ig. 14. Time-lapse synthetic seismic sections calculated using the modified-patchyhe locations of the three interpreted zones within the reservoir. Vertical exaggerat
hange in amplitude is directly related to the concentration of CO2
ithin each accumulation, it suggests that patchy saturation hasmportant implications for the detection of CO2 movement andor the quantification of volume of CO2 injected into the reservoir.
ig. 15. Detailed look at the simulated CO2 plume after 20 years. The location of each resighlighted in the olive green box. The enlarged box highlights the change in amplitude c
niform velocity models for each stage in plume growth. The coloured lines represent 3.
Previously, when quantifying the total amount of injected CO2,
a uniform saturation distribution has been assumed (for exam-ple, Chadwick et al., 2005). Through 4D seismic quantification,Chadwick et al. (2005) were able to account for 85% of the totalervoir zone is shown as well as the location of the free-phase migrating CO2 front,orresponding to the accumulation of CO2 in Zone 4.

R. Eid et al. / International Journal of Greenhouse Gas Control 43 (2015) 70–81 79
F ) highw unifor
aptns
hcmfbaaalmi
4
copao
ig. 16. Comparison of the simulated results after 20 and 30 simulated years. (a–dhile (e–h) highlight the change in velocity assuming both a modified-patchy and
mount of injected CO2 in the Utsira Formation. By assuming aatchy saturation distribution, a more appropriate account forhe injected CO2 might be possible. However, this is an issue ofon-uniqueness due to the transition from patchy to uniformaturation with increasing time.
A focus on the free-phase migrating front of CO2 in Zone 2,ighlighted by the olive green box in Fig. 15, shows very littlehange in amplitude in the synthetic seismic sections for both theodified-patchy and uniform models. This shows that a migrating
ront of CO2 appears to be difficult to detect. However, it shoulde noted that the estimated saturations within the CO2 plume,nd of the migrating front in particular, play a key role whenssessing detectability, namely through the relative permeabilitynd capillary pressure functions entered into the reservoir simu-ator. Therefore this is a site-specific issue, where different curves
ay predict a greater range of CO2 saturation, to which the changen velocity is particularly sensitive.
.2. Implications for the detection of a migrating front
The ability to detect CO2 migration within a reservoir is criti-al to the successful demonstration of containment. The detection
f movement within the reservoir, in particular if outside therimary storage reservoir or storage complex, could provide oper-tors with an early warning system, should a loss of containmentccur.light the change in lateral distribution and CO2 saturation of the migrating frontm saturation distribution. Vertical exaggeration of 3.
Interestingly, results from the modelling undertaken in thisstudy, when focused on the detection of a migrating front of CO2,show that neither the modified-patchy nor the uniform modelsresults in an interpretable change in amplitude. This highlights thefact that the detection of a free-phase migrating front of CO2 ispredominantly dependent on its spatial geometry. Once the size ofthe front crosses a particular detectability threshold, the pore-fluidsaturation distribution models – patchy or uniform – will play animportant role.
To test the importance of spatial geometry on the detection of amigrating front of CO2, we applied the same workflow to a furtherstage in the simulation – after 30 years – and compared the mod-elled results with the results after 20 years. When focused on themigrating front alone (Fig. 16) the models show that the front hasincreased in size – from 271 m to 584 m (Fig. 16a and b) – as well asin saturation – from an average of 10% to 20% CO2 (Fig. 16c and d).This results in a maximum calculated change in velocity from −135to −297 m/s assuming a modified-patchy distribution and −466 to−527 m/s assuming a uniform distribution (Fig. 16e–h).
A comparison of the generated synthetic seismic sections showsa clear interpretable amplitude change within Zone 2 when assum-ing a uniform distribution after 30 simulated years (Fig. 17f). Themodified-patchy results also show a change in amplitude at this
time, although this is less obvious (Fig. 17e). This provides confi-dence in the ability of seismic techniques to detect a migrating frontonly when a particular threshold in the lateral size of the plume hasbeen reached. We should emphasize the point that these synthetics
80 R. Eid et al. / International Journal of Greenhouse Gas Control 43 (2015) 70–81
F er 20
u
rcb
5
stvaembfwmm
oavhsCmashiwtitase
ettttiott
ig. 17. Comparison of the seismic time-lapse modelling of the migrating front aftniform distribution (c and f). Vertical exaggeration of 3.
epresent noise-free time-lapse responses. It is always possible ofourse that the presence of noise could result in the migrating frontecoming undetectable.
. Conclusions
The key contribution of this study is to account for, and under-tand, the saturation scales and the phase distributions withinhe reservoir which could be encountered, therefore affecting theelocity changes resulting from the injected CO2. Through thepplication of a three-stage model-driven workflow, we have mod-lled two end-member fluid distribution models, uniform andodified-patchy, to generate the widest range of velocity distri-
utions for each chosen time-step. This has been done to accountor the transition from patchy to uniform saturation distributionith increasing CO2 in order to assess the potential of seismiconitoring techniques to image the plume growth, evolution, andigration of injected CO2 in the subsurface.The presence of reservoir heterogeneity added another layer
f complexity to both the CO2 flow and rock physics modellings it resulted in a range of CO2 saturations and distribution ofelocities. Traditionally, simulated CO2 flow modelling using aomogeneous model would result in saturations which are eithertructurally trapped (immobile) or mobile. This would result inO2 concentrations which are ‘uniform’ in accumulation, withaximum saturation values of 1 − Swir. Rock physics modelling
pplied to such a model would result in velocities which are veryimilar for patchy and uniform cases as both curves converge atigh saturations (as shown in Fig. 8). For such a scenario, veloc-
ties calculated assuming either a patchy or a uniform modelould not matter as they would return similar values. The addi-
ion of reservoir heterogeneity corrected for this as it resultedn a range of saturations within the reservoir due to the tor-uous migration from the intra-reservoir baffles, allowing for
more accurate way to assess, understand and compare theaturation scales and the phase distributions which could bexpected.
Through the application of a heterogeneous model, the gen-rated synthetic seismic sections show clear differences betweenhe modified-patchy and uniform saturation models. In both caseshe CO2 growth within each zone can be detected, where theop-most reflector corresponds to the top-most accumulation inhe simulation. Furthermore, each accumulation of CO2 below the
ntra-formational baffles in each zone can be interpreted regardlessf the assumed fluid saturation model. This provides confidence inhe ability of seismic methods to detect plume growth and evolu-ion within a saline reservoir.(a–c) and 30 (d–f) simulated years assuming both a modified-patchy (b and e) and
A comparison of the modified-patchy and uniform syntheticseismic sections shows a clear difference in amplitude andtime-shift. Although the uniform model shows high changes inamplitude and large velocity push-down effects below the plume,it proves difficult to distinguish the different CO2 accumulationswithin each zone. The modified-patchy model results in a moresubtle change in amplitude. As the subtle change in amplitude isdirectly related to the concentration of CO2 within each accumula-tion, it suggests that this difference has important implications forCO2 detectability and for quantifying the volume of CO2 injectedinto the reservoir.
A free-phase migrating front of CO2 was shown to be more dif-ficult to detect as the ability to image this is dependent not onlyon the fluid saturation distribution, but also on the spatial geome-try of the front. It required an increase in lateral size for the frontto become detectable. This provides confidence in the ability ofseismic techniques to detect a migrating front only when a partic-ular threshold in plume-geometry has been reached. This howeverwas imaged through noise-free synthetic time-lapse responses. Itis possible that the presence of noise could result in the migratingfront becoming undetectable.
Finally, it should be noted that the saturation and distribu-tion of the CO2 in this study play a key role when assessingdetectability, namely through the relative permeability and cap-illary pressure functions entered into the reservoir simulator. Thisis a site-specific issue, where different curves may predict differ-ent ranges of CO2 saturation, to which the changes in velocityare particularly sensitive. Assessing these site-specific variations,through the application of the workflow presented in this study,during initial storage-site assessment stages, could provide valu-able information regarding the ability to image CO2 plume growth,and importantly, migration.
Acknowledgements
The authors thank E.ON and Energy Technology Partnership(ETP) for sponsoring this work, and Petroleum Geo-Services (PGS)and British Geological Survey (BGS) for allowing the use and publi-cation of the Bunter model. We also thank Silke Bude at PGS for hergreat help and guidance in using Nucleus+. We are also grateful forCREWES for allowing the use of their seismic modelling software.
References
Adam, L., Batzle, M., Brevik, I., 2006. Gassmann’s fluid substitution and shearmodulus variability in carbonates at laboratory seismic and ultrasonicfrequencies. Geophysics 71, F173–F183.

Green
A
A
A
A
A
B
B
B
B
B
C
C
C
CD
D
D
D
D
F
G
G
G
H
H
R. Eid et al. / International Journal of
kbar, N., Mavko, G., Nur, A., Dvorkin, J., 1994. Seismic signatures of reservoirtransport properties and pore fluid distribution. Geophysics 59, 1222–1236.
rts, R., Eiken, O., Chadwick, A., Zweigel, P., Van Der Meer, L., Zinszner, B., 2004.Monitoring of CO2 injected at Sleipner using time-lapse seismic data. Energy29, 1383–1392.
rts, R., Chadwick, R., Eiken, O., Trani, M., Dortland, S., 2007. Synthetic versus realtime-lapse seismic data at the Sleipner CO2 injection site. In: 2007 SEG AnnualMeeting, Society of Exploration Geophysicists.
rts, R., Chadwick, A., Eiken, O., Thibeau, S., Nooner, S., 2008. Ten years’ experienceof monitoring CO2 injection in the Utsira Sand at Sleipner, offshore Norway.First break 26.
vseth, P., Mukerji, T., Mavko, G., 2005. Quantitative seismic interpretation.Cambridge University Press, Cambridge, UK, 376 pp., ISBN: 0521816017.
ennion, D., Bachu, S., 2006. Dependence on temperature, pressure, and salinity ofthe IFT and relative permeability displacement characteristics of CO2 injectedin deep saline aquifers. In: SPE Annual Technical Conference and Exhibition.
ergmann, P., Yang, C., Lüth, S., Juhlin, C., Cosma, C., 2011. Time-lapse processing of2D seismic profiles with testing of static correction methods at the CO2
injection site Ketzin (Germany). J. Appl. Geophys. 75, 124–139.erryman, J.G., 1999. Origin of Gassmann’s equations. Geophysics 64,
1627–1629.oait, F.C., White, N.J., Bickle, M.J., Chadwick, R.A., Neufeld, J.A., Huppert, H.E., 2012.
Spatial and temporal evolution of injected CO2 at the Sleipner Field, North Sea.J. Geophys. Res. Solid Earth 117.
ourbié, T., Coussy, O., Zinszner, B., 1987. Acoustics of porous media. EditionsTechnip, Paris, France.
airns, G., Jakubowicz, H., Lonergan, L., Muggeridge, A., 2012. Using time-lapseseismic monitoring to identify trapping mechanisms during CO2 sequestration.Int. J. Greenh. Gas Control 11, 316–325.
hadwick, R., Arts, R., Eiken, O., 2005. 4D seismic quantification of a growing CO2
plume at Sleipner, North Sea. Geological Society, London, Petroleum GeologyConference series, 6., pp. 1385–1399.
hadwick, A., Arts, R., Eiken, O., Williamson, P., Williams, G., 2006. Geophysicalmonitoring of the CO2 plume at Sleipner, North Sea. Adv. Geol. Storage CarbonDioxide, 303–314.
ook, P., 2012. Clean Energy, Climate and Carbon. CSIRO Publishing, Melbourne.omenico, S., 1976. Effect of brine-gas mixture on velocity in an unconsolidated
sand reservoir. Geophysics 41, 882–894.uan, Z., Sun, R., 2003. An improved model calculating CO2 solubility in pure water
and aqueous NaCl solutions from 273 to 533 K and from 0 to 2000 bar. Chem.Geol. 193, 257–271.
vorkin, J., Nur, A., 1996. Elasticity of high-porosity sandstones: theory for twoNorth Sea data sets. Geophysics 61, 1363–1370.
vorkin, J., Nur, A., 1998. Acoustic signatures of patchy saturation. Int. J. SolidsStruct. 35, 4803–4810.
vorkin, J., Gutierrez, M.A., Grana, D., 2014. Seismic Reflections of Rock Properties.Cambridge University Press, Cambridge.
erguson, R.J., Margrave, G.F., 2005. Planned seismic imaging using explicitone-way operators. Geophysics 70, S101–S109.
assmann, F., 1951. Über die elastizität poröser medien. Inst. für Geophysik an derETH.
hanbari, S., Al-Zaabi, Y., Pickup, G., Mackay, E., Gozalpour, F., Todd, A., 2006.Simulation of CO2 storage in saline aquifers. Chem. Eng. Res. Des. 84,764–775.
regory, A., 1976. Fluid saturation effects on dynamic elastic properties ofsedimentary rocks. Geophysics 41, 895–921.
an, D.-H., Batzle, M.L., 2004. Gassmann’s equation and fluid-saturation effects onseismic velocities. Geophysics 69, 398–405.
einemann, N., Wilkinson, M., Pickup, G.E., Haszeldine, R.S., Cutler, N.A., 2012. CO2
storage in the offshore UK Bunter Sandstone Formation. Int. J. Greenh. GasControl 6, 210–219.
house Gas Control 43 (2015) 70–81 81
Hill, R., 1963. Elastic properties of reinforced solids: some theoretical principles. J.Mech. Phys. Solids 11, 357–372.
Holloway, S., Vincent, C.J., Bentham, M.S., Kirk, K.L., 2006. Top-down andbottom-up estimates of CO2 storage capacity in the United Kingdom sector ofthe southern North Sea basin. Environ. Geosci. 13, 71–84.
Ivandic, M., Yang, C., Lüth, S., Cosma, C., Juhlin, C., 2012. Time-lapse analysis ofsparse 3D seismic data from the CO2 storage pilot site at Ketzin, Germany. J.Appl. Geophys. 84, 14–28.
Ivandic, M., Juhlin, C., Lüth, S., Bergmann, P., Kashubin, A., Sopher, D., Ivanova, A.,Baumann, G., Henninges, J., 2015. Geophysical monitoring at the Ketzin pilotsite for CO2 storage: new insights into the plume evolution. Int. J. Greenh. GasControl 32, 90–105.
Johnson, D.L., 2001. Theory of frequency dependent acoustics in patchy-saturatedporous media. J. Acoust. Soc. Am. 110, 682–694.
Kazemeini, S.H., Juhlin, C., Fomel, S., 2010. Monitoring CO2 response on surfaceseismic data; a rock physics and seismic modeling feasibility study at the CO2
sequestration site, Ketzin, Germany. J. Appl. Geophys. 71, 109–124.Knight, R., Dvorkin, J., Nur, A., 1998. Acoustic signatures of partial saturation.
Geophysics 63, 132–138.Lebedev, M., Toms-Stewart, J., Clennell, B., Pervukhina, M., Shulakova, V., Paterson,
L., Müller, T.M., Gurevich, B., Wenzlau, F., 2009. Direct laboratory observationof patchy saturation and its effects on ultrasonic velocities. Lead. Edge 28,24–27.
Lumley, D., 2010. 4D seismic monitoring of CO2 sequestration. Lead. Edge 29,150–155.
Margrave, G.F., 2003. Numerical Methods of Exploration Seismology withAlgorithms in MATLAB. Department of Geology and Geophysics, The Universityof Calgary, Calgary.
Mavko, G., Mukerji, T., 1998. Bounds on low-frequency seismic velocities inpartially saturated rocks. Geophysics 63, 918–924.
Mavko, G., Mukerji, T., Dvorkin, J., 2009. The Rock Physics Handbook: Tools forSeismic Analysis of Porous Media. Cambridge University Press.
Niven, R.K., 2006. Force stability of pore-scale fluid bridges and ganglia inaxisymmetric and non-axisymmetric configurations. J. Petrol. Sci. Eng. 52,1–18.
Pearce, J., 2005. Technology Status Review: Monitoring Technologies for theGeological Storage of CO2. Technology Status Review Report DTI/Pub URN05/1032. UK Department of Trade and Industry, London.
Permedia, 2014. BOS, Version 5.1. Halliburton, Ottawa, Ontario.Reuss, A., 1929. Berechnung der Fließgrenze von Mischkristallen auf Grund der
Plastizitätsbedingung für Einkristalle. ZAMM – J. Appl. Math. Mech./Z. Angew.Math. Mech. 9, 49–58.
Sengupta, M., Mavko, G., 2003. Impact of flow-simulation parameters onsaturation scales and seismic velocity. Geophysics 68, 1267–1280.
Singh, V.P., Cavanagh, A., Hansen, H., Nazarian, B., Iding, M., Ringrose, P.S., 2010.Reservoir modeling of CO2 plume behavior calibrated against monitoring datafrom Sleipner, Norway, SPE 134891, 2010.
Smith, T.M., Sondergeld, C.H., Rai, C.S., 2003. Gassmann fluid substitutions: atutorial. Geophysics 68, 430–440.
Taylor, C., Julliard, F., 2013. An Introduction to Source Modelling and WaveletAnalysis Nucleus+, Petroleum Geo-Services (PGS) Internal Company Report.
Toms, J., Müller, T., Ciz, R., Gurevich, B., 2006. Comparative review of theoreticalmodels for elastic wave attenuation and dispersion in partially saturated rocks.Soil Dyn. Earthq. Eng. 26, 548–565.
White, J., 1975. Computed seismic speeds and attenuation in rocks with partial gassaturation. Geophysics 40, 224–232.
Williams, J.D.O., Jin, M., Bentham, M., Pickup, G.E., Hannis, S.D., Mackay, E.J., 2013.Modelling carbon dioxide storage within closed structures in the UK BunterSandstone Formation. Int. J. Greenh. Gas Control 18, 38–50.
Wilson, M., Monea, M., 2004. IEA GHG Weyburn CO2 monitoring & storage project.Summary report 2000–2004.