international journal of greenhouse gas control - lanl.gov · n. yoshida et al. / international...
TRANSCRIPT

Ia
Na
b
c
a
ARRA
KCRRS
1
brAhaea(cpmUpf
j
h1
International Journal of Greenhouse Gas Control 49 (2016) 161–178
Contents lists available at ScienceDirect
International Journal of Greenhouse Gas Control
journa l homepage: www.e lsev ier .com/ locate / i jggc
nvestigation of uncertainty in CO2 reservoir models: A sensitivitynalysis of relative permeability parameter values
ozomu Yoshida a,b, Jonathan S. Levine c, Philip H. Stauffer a,∗
Earth and Environmental Sciences Division, Los Alamos National Laboratory, Los Alamos, NM 87545, USADepartment of Petroleum Engineering, Texas A&M University, College Station, TX 77843, USAU.S. Department of Energy, National Energy Technology Laboratory, Pittsburgh, PA 15236, USA
r t i c l e i n f o
rticle history:eceived 20 October 2015eceived in revised form 11 February 2016ccepted 7 March 2016
eywords:arbon sequestrationeservoir modelingelative permeabilityensitivity analysis
a b s t r a c t
Numerical reservoir models of CO2 injection in saline formations rely on parameterization of laboratory-measured pore-scale processes. We performed a parameter sensitivity study and Monte Carlo simulationsto determine the normalized change in total CO2 injected using the finite element heat and mass-transfercode (FEHM) numerical reservoir simulator. Experimentally measured relative permeability parametervalues were used to generate distribution functions for parameter sampling. The parameter sensitivitystudy analyzed five different levels for each of the relative permeability model parameters. All but one ofthe parameters changed the CO2 injectivity by <10%, less than the geostatistical uncertainty that appliesto all large subsurface systems due to natural geophysical variability and inherently small sample sizes.The exception was the end-point CO2 relative permeability, k0
r,CO2, the maximum attainable effective CO2
permeability during CO2 invasion, which changed CO2 injectivity by as much as 80%. Similarly, MonteCarlo simulation using 1000 realizations of relative permeability parameters showed no relationshipbetween CO2 injectivity and any of the parameters but k0
r,CO2, which had a very strong (R2 = 0.9685)power law relationship with total CO2 injected. Model sensitivity to k0
r,CO2 points to the importance ofaccurate core flood and wettability measurements.
© 2016 Elsevier Ltd. All rights reserved.
. Introduction
Geological carbon sequestration (GCS), the injection of car-on dioxide into the deep subsurface, requires accurate numericaleservoir models to predict CO2 injection rates and quantities.ccurate reservoir modeling has importance to a variety of stake-olders, each having their own information needs. At the nationalnd state scales, policy makers require accurate storage resourcestimates to have confidence that sufficient pore space is avail-ble for GCS to address national or state greenhouse gas emissionsGoodman et al., 2011). At the field and reservoir scales, commer-ial operators need accurate reservoir models to predict operationalarameters such as number of injection wells, pore space require-ents, leakage risks, and areas of review (Dai et al., 2014). The
nited States Department of Energy (DOE) has a stated goal to “sup-ort industry’s ability to predict CO2 storage capacity in geologicormations to within ±30%” (US-DOE NETL, 2012). Improvements
∗ Corresponding author.E-mail addresses: [email protected] (N. Yoshida),
[email protected] (J.S. Levine), [email protected] (P.H. Stauffer).
ttp://dx.doi.org/10.1016/j.ijggc.2016.03.008750-5836/© 2016 Elsevier Ltd. All rights reserved.
in our understanding of the relative importance of physical param-eters will help reduce uncertainty in storage capacity estimates byallowing resources to be focused on making the most cost-effectivemeasurements.
The relative permeabilities of brine and CO2 are key parametersthat set the injectivity of CO2 into deep saline aquifers. Relative per-meability is a multiphase rock-fluid property accounting for thefractional reduction in fluid conductivity due to blockage of fluidpaths by the presence of one or more additional fluid phases. Rela-tive permeability values therefore range between 0 and 1. Relativepermeability is a strong function of the phase saturation as wellas a function of rock properties such as pore size distribution andwettability (Lake, 2010).
The wetting state, e.g., as measured by the contact angle, of afluid-fluid-rock system can predict the relative permeability curve.More specifically, the relative permeability of each fluid phase isdetermined by pore- and sub-pore- scale fluid distributions of eachcontinuous fluid phase, e.g., (Willhite, 1986; Anderson, 1987). At
the sub-pore scale, fluids aim to minimize surface energy; thusrock-wetting fluids maximize rock surface contact area and occupythe smallest pores and coat rock surfaces. By comparison, non-wetting fluids will have minimized contact with rock surfaces and
1 f Gree
tTnartatflTtisipei
oacar
ascswuiCsmBcdps
ttwr(etaflsmat
isitsCretsA
62 N. Yoshida et al. / International Journal o
herefore will occupy the largest pores and the center of pores.he resulting capillarity-controlled fluid distributions produce sig-ificantly different relative permeabilities when measured at corend reservoir scales, with nonwetting fluids having much higherelative permeabilities than wetting fluids for the same satura-ion values. E.g., the end-point relative permeability, the maximumchievable relative permeability of an invading phase, is related tohe wetting state, with values below 0.2 typical of strongly wettinguids and values greater than 0.7 for strongly nonwetting fluids.he end-point relative permeability can therefore be used to predicthe wetting state. This connection between rock surface chem-stry, rock-fluid and fluid-fluid surface energies, capillarity, porecale fluid occupancy, fluid saturations, and relative permeabilitys the theoretical core of pore- and reservoir-scale multiphase fluidroperties and petrophysics. Additional details and a complete lit-rature review on this subject with application to GCS can be foundn Levine (2011) and Levine et al. (2014).
Iglauer et al. (2015) provided an excellent and thorough reviewf the problematic and entirely unresolved state of GCS contactngle experiments and thus wettability. As a result, theoreti-al wettability-derived relative permeability curves cannot bessigned, and instead GCS models rely on experimentally measuredelative permeability values.
To quantify the relative permeability relationship between brinend CO2 for different types of formations, experimental mea-urements have been conducted under extensive experimentalonditions. In an early work, Dria et al. (1993) conducted steady-tate three-phase CO2/oil/brine relative permeability experimentsith a carbonate core. Bennion and Bachu (2005) published
nsteady-state experimental results of supercritical CO2 injectionnto cores from sandstone and carbonate formations in westernanada. More extensive experimental results were presented in aeries of publications: Bennion and Bachu (2008), carbonate for-ations in Bennion and Bachu (2010) and sandstone formations in
achu (2013). Perrin et al. (2009) conducted steady-state CO2-brineore flooding experiments using X-ray CT to determine saturationistribution. These experimental results show low values of end-oint CO2 relative permeability and high values of residual wateraturation under drainage condition.
Levine (2011) and Levine et al. (2014) report experimen-al measurements of end-point CO2 relative permeability usinghe method proposed by Ramakrishnan and Cappiello (1991),hich does not require the achievement of a uniform satu-
ation within the core. Both Levine (2011) and Levine et al.2014) contain reviews of experimental artifacts in CO2 core floodxperiments, including insufficiently elevated capillary pressureso achieve endpoint relative permeability, capillary end effects,nd gravitational/buoyancy-induced segregation in horizontal coreood experiments. Unlike previous experiments, this dataset wasolely focused on measuring end-point drainage CO2 relative per-eability, with particular attention paid to avoiding experimental
rtifacts. CO2 end-point permeabilities in this dataset were clus-ered around 0.35–0.4.
Krevor et al. (2012) suggested that residual saturations persistrrespective of significant heterogeneities and in the absence ofignificant gravity segregation. They also reported that the max-mum observed saturations in their experiment were limited byhe maximum capillary pressure possible given the experimentaletup. Pini and Benson (2013) further argued that the low end-pointO2 relative permeability was caused by the low viscosity of CO2elative to water rather than by the rock heterogeneity. Most of thexperimental core flood data sets suggest that the end-point rela-
ive permeability to CO2 is low (<0.5) and that the residual wateraturation is high (>0.4), though further investigation is required.dditional CO2 relative permeability experiments have since beennhouse Gas Control 49 (2016) 161–178
reported but were not available in time for the initiation of thepresent effort.
Relative permeability depends on a variety of parameters.Pressure, temperature and brine salinity are treated as primaryindependent variables, while the viscosity ratio and interfacial ten-sion (IFT) are secondary variables (Bachu and Bennion, 2008, 2009).Multiphase interference is indicated by the curvature of the rel-ative permeability curve, and less-concave relative permeabilitycurves are obtained in experiments with lower IFT (Bennion andBachu, 2006) or higher porosity and permeability due to highermedian pore size (Bennion and Bachu, 2010). Middleton et al.(2012) showed that IFT variation can impact estimates of reservoircapacity by about 10%. In carbonate reservoirs, higher permeabilityunits caused by channeling and bypassing of tighter portions of thepore system can contribute to increased macro porosity and reduc-tion of the irreducible CO2 saturation (Bennion and Bachu, 2010).Drainage/imbibition hysteresis also affects the shape of the relativepermeability function and is related to interfacial areas betweenfluids (Juanes et al., 2006; Bennion and Bachu, 2008; Porter et al.,2010).
Compared to CO2 injection for enhanced oil recovery, GCS sitesoften have less detailed information about reservoirs where CO2will be injected (Stauffer et al., 2009; Dai et al., 2014). For thesecases, uncertainty quantification on CO2 injectivity and storagecapacity has been performed on parameters related to geologicheterogeneity (Deng et al., 2012; Heath et al., 2012). Burton et al.(2009) investigated the importance of uncertainty in relative per-meability on CO2 injectivity and found a four-fold variation ininjectivity with different relative permeability curves. Burton et al.(2009) also report that the end-point CO2 relative permeabil-ity and the curvature of the aqueous phase relative permeabilitycurve can change the injection rate by 20%. Kopp et al. (2009a)performed dimensional analysis using the capillary and gravitynumbers to investigate CO2 storage capacity in saline aquifers.They found that the relative permeability-saturation relationshipssignificantly influence plume evolution, velocity, and average CO2saturation, with a still larger influence on storage capacity. Fur-ther investigation by Kopp et al. (2009b) indicated that the CO2relative permeability associated with the residual brine saturationis a major influence on the average CO2 saturation in reservoirs,whereas the brine relative permeability has a major influence onthe geometric capacity coefficient. Kopp et al. (2009b) concludedthat relative permeability relationships influence the capacity esti-mates to a similar extent as the entire range of reservoir propertiessuch as geothermal gradient and depth.
Mathias et al. (2013) investigated the uncertainty of the rela-tive permeability data on the estimation of CO2 injectivity for brineaquifers with 25 published relative permeability datasets. Theirwork employed a semi-analytical solution that assumes negligiblecapillary pressure, constant fluid properties, and vertical pres-sure equilibrium. They showed that for the 25 samples examined,there is no clear relation between the relative permeability dataand porosity, permeability, IFT or lithology. They evaluated CO2injectivity through the assessment of the maximum constant CO2injection rate that can be sustained for 30 years without exceedinghydrofracture pressure. Finally, they concluded that while uncer-tainty in relative permeability relations can have a substantial effecton injectivity estimation for open aquifers, for closed aquifers,the effects associated with formation compressibility play a moreimportant role. In a related work, González-Nicolás et al. (2015) useanother semi-analytical model (with similar limiting assumptions)to explore global sensitivity of CO2 injection and leakage to changes
in a set of parameters that include brine residual saturation andCO2 end-point relative permeability. Their findings showed sec-ond order effects for brine residual saturation (and the functionallylinked CO2 end-point relative permeability). However, the global
N. Yoshida et al. / International Journal of Greenhouse Gas Control 49 (2016) 161–178 163
Table 1Summary of formation unit, source of the data, lithology, porosity, and experimental conditions (pressure, temperature and IFT) from the published literature.
Formation unit Source Lithology Porosity (%) Pressure (MPa) Temperature (◦C) IFT (mN/m)
Otway Perrin and Benson (2010) Sandstone 18.2 12.40 63 30.0Berea #1 Perrin and Benson (2010) Sandstone 20.3 12.40 50 30.0Berea #2 Krevor et al. (2012) Sandstone 22.1 9.00 50 32.0Paaratte Krevor et al. (2012) Sandstone 28.3 9.00 50 32.0Mt. Simon Krevor et al. (2012) Sandstone 24.4 9.00 50 32.0Tuscaloosa Krevor et al. (2012) Sandstone 23.6 9.00 50 32.0Cardium #1 Bennion and Bachu (2008) Sandstone 15.3 20.00 43 19.8Cardium #2 Bennion and Bachu (2008) Sandstone 16.1 20.00 43 19.8Viking #1 Bennion and Bachu (2008) Sandstone 12.5 8.60 35 32.1Viking #2 Bennion and Bachu (2008) Sandstone 19.5 8.60 35 32.1Viking #3 Bachu (2013) Sandstone 17.2 8.60 35 32.1Ellerslie #1 Bennion and Bachu (2008) Sandstone 12.6 10.90 40 32.5Ellerslie #2 Bachu (2013) Sandstone 29.0 10.90 40 32.5Basal Cambrian #1 Bennion and Bachu (2008) Sandstone 11.7 27.00 75 27.0Basal Cambrian #2 Bachu (2013) Sandstone 11.6 27.00 75 35.6Basal Cambrian #3 Bachu (2013) Sandstone 11.9 18.00 58 29.5Basal Cambrian #4 Bachu (2013) Sandstone 11.9 20.33 60 30.2Basal Cambrian #5 Bachu (2013) Sandstone 12.5 27.00 75 35.6Clearwater Bachu (2013) Sandstone 33.1 2.00 20 56.3Rock Creek Bachu (2013) Sandstone 14.5 15.40 75 32.9Halfway Bachu (2013) Sandstone 17.7 21.80 74 34.6Belloy Bachu (2013) Sandstone 23.6 13.50 56 33.1Graminia Bachu (2013) Sandstone 31.6 9.60 39 35.1Gilwood Bachu (2013) Sandstone 11.5 16.80 46 35.7Deadwood #1 Bachu (2013) Sandstone 17.6 15.24 47 36.1Deadwood #2 Bachu (2013) Sandstone 16.2 23.61 65 30.3Deadwood #3 Bachu (2013) Sandstone 19.3 22.30 61 31.9Granite Wash Bachu (2013) Sandstone 14.8 14.66 54 37.0
Webamun #1 Bennion and Bachu (2008) Carbonate 7.9 11.90 41 29.5Webamun #2 Bennion and Bachu (2008) Carbonate 14.8 11.90 41 29.5Webamun #3 Bennion and Bachu (2010) Carbonate 15.4 11.90 41 29.5Nisku #1 Bennion and Bachu (2008) Carbonate 9.7 17.40 56 34.6Nisku #2 Bennion and Bachu (2010) Carbonate 10.4 17.40 56 34.6Nisku #3 Bennion and Bachu (2010) Carbonate 10.9 17.40 56 34.6Grosmont Bennion and Bachu (2010) Carbonate 11.8 11.90 41 34.2Morinville Leduc Bennion and Bachu (2010) Carbonate 11.6 11.40 40 33.1Redwater Leduc Bennion and Bachu (2010) Carbonate 16.8 9.20 36 35.1Cooking Lake #1 Bennion and Bachu (2008) Carbonate 9.9 15.40 55 35.7
16.7
9.9
14.8
prfipas
rispdiertiofesvrcfiZ
Cooking Lake #2 Bennion and Bachu (2010) Carbonate
Slave point Bennion and Bachu (2010) Carbonate
Winnipegosis Bennion and Bachu (2010) Carbonate
arameter set includes degrees of freedom that are unrelated to theelative permeability functions, thus making it potentially more dif-cult to extract information on individual impacts of the relativeermeability functions alone. For these reasons, relative perme-bility remains a source of considerable uncertainty in numericalimulations of geologic CO2 sequestration.
The objective of this work is to evaluate the importance ofelative permeability relationships on geologic CO2 sequestrationnjectivity in more detail than previous studies, including a robusttatistical analysis of the sensitivity of injectivity to each relativeermeability model parameter for simulations with full thermo-ynamic coupling of the mass and energy equations, including
mpacts of capillary pressure, variable fluid properties, and non-quilibrium vertical pressure gradients. After a brief review of aelative permeability model and available published experimen-al datasets, we present numerical simulations to investigate themportance of each parameter in the relative permeability modeln CO2 injectivity. This study focuses on uncertainty resultingrom a select set of parameters (e.g., relative permeability param-ters). While there are many other uncertain parameters in a GCSystem that can be varied such as intrinsic permeability, and reser-oir heterogeneity, we focus on exploring uncertainty in the fluidetention parameters. To this end, we consider the case of super-
ritical CO2 injection into a 2D cylindrical saline reservoir using thenite-element heat- and mass-transfer code (FEHM) developed byyvoloski et al. (2011). A parameter sensitivity study is performed15.50 55 35.718.80 43 29.58.73 36 45.3
with a relative permeability model based on the distribution ofexperimental data. Further investigation is conducted using aMonte Carlo simulation method with statistically-estimated prop-erties of each relative permeability parameter.
2. Methods
2.1. Relative permeability for CO2–brine
The multiphase Darcy equation used in FEHM is:
vl = −kkr,l�l
(∇pl − �lg) (1)
where vl is the volumetric flux of phase l (l = CO2 or brine), k ispermeability, kr ,l is the relative permeability of phase l, �l is theviscosity of phase l, pl is phase pressure, and g represents theacceleration due to gravity (Zyvoloski et al., 2011). The relative per-meability model (Lake, 2010) used in this work is a variation of theCorey equations:
kr,CO2 = k0r,CO2
(SCO2 − SCO2,ir
1 − SCO2,ir − Sbrine,ir
)m
(2)
and
kr,brine = k0r,brine
(Sbrine − Sbrine,ir
1 − SCO2,ir − Sbrine,ir
)n
(3)

164 N. Yoshida et al. / International Journal of Greenhouse Gas Control 49 (2016) 161–178
Table 2Summary of experimental results with regression analysis for the power law relative permeability model.
Formation unit Lithology Permeability (md) Sbrine,ir k0r,CO2 m n
Otway Sandstone 45 0.4370 0.6594 6.5 2.5Berea #1 Sandstone 430 0.5890 0.0700 1.3 2.5Berea #2 Sandstone 914 0.4438 0.3948 2.6 3.2Paaratte Sandstone 1156 0.3894 0.3284 3 4.6Mt. Simon Sandstone 7.5 0.4371 0.4929 1.6 6Tuscaloosa Sandstone 220 0.7030 0.0767 3.2 4.7Cardium #1 Sandstone 0.356 0.1970 0.5260 1.7 1.3Cardium #2 Sandstone 21.17 0.4250 0.1290 1.3 1.2Viking #1 Sandstone 2.7 0.5580 0.3319 3.2 2.9Viking #2 Sandstone 21.72 0.4230 0.2638 2.8 1.7Viking #3 Sandstone 1558.65 0.6010 0.0973 4.34 1.33Ellerslie #1 Sandstone 0.376 0.6590 0.1156 2.2 2.1Ellerslie #2 Sandstone 3812.36 0.3820 0.5735 4.79 1.18Basal Cambrian #1 Sandstone 0.081 0.2940 0.5446 5 1.8Basal Cambrian #2 Sandstone 0.0057 0.5690 0.2105 3.89 1.45Basal Cambrian #3 Sandstone 252.50 0.4900 0.1562 1.35 1.63Basal Cambrian #4 Sandstone 157.80 0.6510 0.2100 3.74 4.54Basal Cambrian #5 Sandstone 0.030 0.2750 0.3255 5.48 1.21Clearwater Sandstone 0.0164 0.3430 0.4939 1.60 1.24Rock Creek Sandstone 65.03 0.4790 0.0434 1.90 2.19Halfway Sandstone 54.23 0.4660 0.2733 3.48 3.12Belloy Sandstone 536.60 0.6530 0.0762 5.22 1.67Graminia Sandstone 133.90 0.4420 0.1461 4.98 1.42Gilwood Sandstone 0.749 0.5655 0.5454 3.73 1.75Deadwood #1 Sandstone 103.66 0.4897 0.1062 7.00 1.80Deadwood #2 Sandstone 69.11 0.5959 0.0941 4.00 1.50Deadwood #3 Sandstone 137.90 0.6540 0.2597 6.57 1.20Granite Wash Sandstone 70.13 0.5789 0.4050 1.81 1.15
Webamun #1 Carbonate 0.018 0.5950 0.5289 5.6 1.4Webamun #2 Carbonate 66.98 0.5690 0.1883 2.1 1.4Webamun #3 Carbonate 54.3 0.8520 0.1015 5.78 2.76Nisku #1 Carbonate 45.92 0.3300 0.1768 1.1 2.8Nisku #2 Carbonate 21.02 0.4920 0.0999 4.6 2.7Nisku #3 Carbonate 74.4 0.3970 0.1078 2.93 2.27Grosmont Carbonate 153.9 0.5200 0.1101 5.19 1.73Morinville Leduc Carbonate 371.9 0.5300 0.0746 3.67 1.82Redwater Leduc Carbonate 353.6 0.6650 0.0476 4.78 1.57Cooking Lake #1 Carbonate 65.3 0.4760 0.0685 5.6 1.4Cooking Lake #2 Carbonate 4.87 0.5963 0.0940 5.44 1.83Slave Point Carbonate 0.217 0.5460 0.5037 1.16 1.56Winnipegosis Carbonate 3.09 0.2108 0.6117 4.5 2.4
0.502 0.260 3.676 2.1590.1367 0.1908 1.697 1.1090.0187 0.0364 2.881 1.231
wsprfr
k
k
mFmitaBC
Table 3Reservoir parameters used in this work.
Parameter Value
Cap/bed rock permeability (m2) 10−19
Saline reservoir permeability (m2) 10−13
Porosity (−) 0.1Rock bulk density (kg/m3) 2563Rock bulk compressibility (1/MPa) 1.0 × 10⁻⁹
Rock specific heat (J/(kg K)) 1010Rock thermal conductivity (W/(m K)) 1.0Wellbore diameter (m) 0.275Initial reservoir pressure (MPa) 11
◦
Mean – 268.0
Standard deviation – 655.3
Variance – 4.294 × 10⁵
here k0r,l
is the end-point relative permeability of phase l, Sl is theaturation of phase l, Sl,ir is the residual or irreducible saturation ofhase l, and m and n are the curvature exponents of CO2 and brine,espectively. This work only considers the drainage process, there-ore k0
r,brineand SCO2,ir are set to 1 and 0, respectively. Therefore, the
elative permeability model is simplified as:
r,CO2 = k0r,CO2
(SCO2
1 − Sbrine,ir
)m
= k0r,CO2
(1 − Sbrine
1 − Sbrine,ir
)m
(4)
and
r,brine =(Sbrine − Sbrine,ir
1 − Sbrine,ir
)n
(5)
The remaining parameters, k0r,CO2, Sbrine,ir , m and n, are deter-
ined by regression analysis with measured experimental data.ormation unit, source of the data, lithology, porosity, and experi-ental conditions (pressure, temperature and IFT) are summarized
n Table 1 and the corresponding experimental results and their sta-
istical parameter values are summarized in Table 2. These tablesre a summary of the published experimental results. Bennion andachu (2008, 2010) and Bachu (2013) used the variation of theorey equations for fitting their experimental data. Mathias et al.Initial reservoir temperature ( C) 36Reservoir thickness (m) 20
(2013) conducted least-square fittings of the Perrin and Benson(2010) and Krevor et al. (2012) data to aid comparison with Bennionand Bachu (2008, 2010). We use the estimated relative permeabil-ity parameters in Mathias et al. (2013) for the data of Perrin andBenson (2010) and Krevor et al. (2012). The relative permeabilitycurves given by the experimental work are shown in Fig. 1 as well.
Fig. 2 shows histograms of log permeability and relative per-meability parameters (Sbrine,ir , k0
r,CO2, m and n), and scatter plotsgenerated from the published experimental data. The green and

N. Yoshida et al. / International Journal of Greenhouse Gas Control 49 (2016) 161–178 165
(a) (b )
(c) (d )
(e)
0.0
0.2
0.4
0.6
0.8
1.0
0.0 0.2 0.4 0.6 0.8 1.0
Rel
ativ
e pe
rmea
bilit
y (–
)
Brine saturation (–)
OtwayBerea #1Berea #2Paa ratteMt. SimonTuscaloosa
0.0
0.2
0.4
0.6
0.8
1.0
0.0 0.2 0.4 0.6 0.8 1.0
Rel
ativ
e pe
rmea
bilit
y (–
)
Brine saturation (–)
Cardium #1 Cardium #2
Viking #1 Viking #2
Viking #3
0.0
0.2
0.4
0.6
0.8
1.0
0.0 0.2 0.4 0.6 0.8 1.0
Rel
ativ
e pe
rmea
bilit
y (–
)
Brine saturation (–)
Basal Cambrian #1Basal Cambrian #2Basal Cambrian #3Basal Cambrian #4Basal Cambrian #5
0.0
0.2
0.4
0.6
0.8
1.0
0.0 0.2 0.4 0.6 0.8 1.0
Rel
ativ
e pe
rmea
bilit
y (–
)
Brine saturation (–)
Ellerslie #1Ellerslie #2Dea dwood #1Dea dwood #2Dea dwood #3
0.0
0.2
0.4
0.6
0.8
1.0
0.0 0.2 0.4 0.6 0.8 1.0
Rel
ativ
e pe
rmea
bilit
y (–
)
Brine sa turation (–)
Halfway BelloyGraminia Gil woodClearwater Rock Creek
(f)
(g) (h)
0.0
0.2
0.4
0.6
0.8
1.0
0.0 0.2 0.4 0.6 0.8 1.0
Rel
ativ
e pe
rmea
bilit
y ( –
)
Brine sa turation (–)
Web amun #1Web amun #2Web amun #3Cooking La ke #1Cooking La ke #2
0.0
0.2
0.4
0.6
0.8
1.0
0.0 0.2 0.4 0.6 0.8 1.0
Rela
tive
perm
eabi
lity
(–) Nisk u #1
Nisk u #2Nisk u #3Morinvill e Ledu c
0.0
0.2
0.4
0.6
0.8
1.0
0.0 0.2 0.4 0.6 0.8 1.0
Rela
tive
perm
eabi
lity
(–) Red water Ledu c
Slave PointWinnipego sisGrosmont
otes b
rbr
Brine saturation (–)
Fig. 1. Relative permeability curves from the available literature (solid line den
ed data points denote the results given by the sandstone and car-onate samples, respectively. These scatter plots show no obviouselations between the variables, though the dataset generates some
Brine saturation (–)
rine relative permeability and dashed line denotes CO2 relative permeability).
clusters and Sbrine,ir and k0r,CO2, seem to correlate slightly; it is also
noted that the sandstone and carbonate results do not show a clear

166 N. Yoshida et al. / International Journal of Greenhouse Gas Control 49 (2016) 161–178
perm
d(avsvf
2
lb2sriCiiodu(
Fig. 2. Scatter plots and histograms of intrinsic permeability and relative
ifference, in agreement with observations made by Mathias et al.2013). In the following sections, we assume the intrinsic perme-bility and the relative permeability parameters as independentariables based on these observations. It is noted that assumingtatistical independence may lead to overestimating the interval ofariability of CO2 mass storage, an impact that is more pronouncedor strongly correlated variables.
.2. Numerical simulation model
We employ a fully coupled heat and mass conservation formu-ation in our simulations to preserve conservation of the full energyalance including changes in gravitational potential (Stauffer et al.,014). In this work, a 2-D cylindrical, homogeneous and isotropicaline reservoir is considered. The reservoir is overlain by a capock and underlain by a bed rock formation with low permeabil-ty (10−19 m2). FEHM is used to simulate injection of supercriticalO2 into the reservoir under non-isothermal conditions. Supercrit-
cal CO2 is injected into the reservoir for 4 years with a constantnjection pressure and temperature (16.5 MPa, 36 ◦C) at the bottom
f the wellbore. Because the simulation is fully coupled, viscosity,ensity, and pressures continue to change throughout the sim-lations resulting in a variable injection rate. As in Levine et al.2013), the modeled processes are essentially time independent(a) Reservoir Geometry (Cylindr ical reservoir)
z
100 mr
20,000 m
Fig. 3. Schematics of re
eability model parameters generated from published experimental data.
meaning that the results scale with the CO2 mass injected. Thewellbore diameter is 0.275 m, and the well is perforated across theentire 20 m thick permeable injection reservoir. The reservoir flu-ids are assumed to be mutually saturated, i.e., dissolution betweenthe CO2 and water phases is ignored. The CO2 and water thermo-physical properties of density, viscosity and enthalpy are estimatedbased on data from the NIST chemistry webbook (Lemmon et al.,2005). Other parameters used in the simulation are summarized inTable 3, and schematics of the model geometry are shown in Fig. 3.The reservoir outer radius and thicknesses of the caprock, reser-voir and bedrock are 20 km, 40 m, 20 m and 40 m, respectively. Thereservoir is discretized into 40401 nodes with a logarithmically-spaced grid in the r-direction and uniform spacing (0.5 m) in thez-direction. Constant pressure and temperature conditions wereset for the top and bottom boundaries of the model: pressure is ini-tial hydrostatic equilibrium with the reservoir and upper and lowerboundary temperatures of 36 ◦C and 37 ◦C, respectively. Pressureand temperature are set to an initial hydrostatic constant at thereservoir’s 20 km radial boundary to simulate an open connectionto an infinite aquifer.
The capillary pressure model used in this work is the van
Genuchten model (1980):Pc = P0
[(S∗)− 1
� − 1]1−�
(6)
(b) Cro ss section of the reservoir0 20,000
r (m)
6040
0
100
Saline reservoir
Bed rock
Cap rock
z (m)
servoir geometry.

N. Yoshida et al. / International Journal of Greenhouse Gas Control 49 (2016) 161–178 167
Fig. 4. Normalized frequency and probability density function for the parameters estimated using published experimental data.
Table 4Input parameters for capillary pressure model.
Parameter Value
P0, kPa 19.61
wb
S
a(t
2
pwiTipvnettiFn
efb
Table 5p-Values estimated using the two-sample Kolmogorov–Smirnov Test on experimen-tal data sets and fitted distributions.
Parameter p-Value
Sbrine,ir 0.978k0r,CO2 0.492
Sbrine,ir , − 0�, − 0.457
here � is the pore size distribution index, and the normalizedrine saturation, S*, is given by:
∗ = Sbrine − Sbrine,ir1 − Sbrine,ir
(7)
Input parameter values of this model are summarized in Table 4nd are taken from benchmarking problem #3 in Pruess et al.2002). The capillary pressure curve is fixed in this work to focus onhe effects by the parameters of the relative permeability model.
.3. Setup for parameter sensitivity study and stochastic analysis
The relative permeability model used in this work has fourarameters, k0
r,CO2, Sbrine,ir , m and n. Values of these parametersere estimated by statistical fitting of the data from the 41 exper-
ments in Table 2 to a truncated normal/lognormal distribution.he influence on CO2 injectivity of each of these parameters is
nvestigated in this sensitivity study. P50 values of the cumulativerobability distribution functions (CDF) are chosen for the base casealues of each parameter, and total injected CO2 is calculated from aumerical reservoir model simulation run. Then, one of the param-ters is changed from the base case value, and the change of theotal injected CO2 is used to determine the sensitivity of injectivityo that parameter. The relative permeability parameters are var-ed independently because they were shown to be uncorrelated inig. 2. This process is repeated for all of the parameters to determineormalized sensitivities.
Histograms of the normalized frequencies of each parameter’sxperimental data overlain with the fitted probability distributionunction (PDF) and fitting parameters are contained in Fig. 4 andottom of Table 2, respectively. Sbrine,ir and the k0
r,CO2 are physical
CO2 exponent (m) 0.936Brine exponent (n) 0.327
parameters bound between 0 and 1. The CO2 and brine curvatureexponents (m and n) are bounded between 1 and 10, correspond-ing to a linear drainage relative permeability curve and the upperbound of the experimental data, respectively. A truncated normaldistribution is fitted to the experimental data of Sbrine,ir and m, anda truncated lognormal distribution is fitted to that of k0
r,CO2 andn due to asymmetric shapes of their histograms. Fig. 5shows thecomparisons of the CDFs of each parameter given by those exper-imental results and fitted distributions. Fig. 6 shows Q-Q plots ofthe experimental results and the fitted distributions. These plotsshow reasonable fitting of the distributions against experimentaldata. In addition, the two-sample Kolmogorov-Smirnov test wasperformed on the experimental data sets and the samples drawnfrom the fitted CDFs via a rejection sampling method (100,000samples of each parameter are used to construct the theoreticalCDF). Table 5 shows p-values given by the two-sample Kolmogorov-Smirnov test, and they are larger than 0.05 (5% of significance level).The Kolmogorov-Smirnov tests were performed after the data setswere standardized.
Parameter values at a 10% cumulative probability, P10, as well asthe P30, P50, P70, and P90 values are also shown, and are reportedin Table 6. Fig. 7 shows the relative permeability curves generatedfrom these values. In this sensitivity study, numerical simulationsare run for 17 relative permeability curves: the base case using P50values, and four non-P50 percentiles for each of the four parame-ters.
The relative permeability parameter sensitivity study was per-formed to clarify the relative effect of each parameter on CO2injectivity. While the parameter values used in the sensitivity

168 N. Yoshida et al. / International Journal of Greenhouse Gas Control 49 (2016) 161–178
(a) Brine residual saturation (b) End-point CO2 relative permeabili ty
(c) CO2 exponen t (m) (d ) Brine expone nt (n)
0.0
0.1
0.2
0.3
0.4
0.5
0.6
0.7
0.8
0.9
1.0
0.0 0.2 0.4 0.6 0.8 1.0
CD
F (–
)
Sbrine,i r (–)
Empirical CDFTheo retical CDF
0.0
0.1
0.2
0.3
0.4
0.5
0.6
0.7
0.8
0.9
1.0
0.0 0.2 0.4 0.6 0.8 1.0
CD
F (–
)
k0O2 (–)
Empirical CDFTheoretical CDF
0.0
0.1
0.2
0.3
0.4
0.5
0.6
0.7
0.8
0.9
1.0
1.0 3.0 5.0 7.0 9.0
CD
F (–
)
m (–)
Empirical CDF
Theo retical CD F0.0
0.1
0.2
0.3
0.4
0.5
0.6
0.7
0.8
0.9
1.0
1.0 3.0 5.0 7.0 9.0
CD
F (–
)
n (–)
Empirica l CDF
Theo retical CDF
Fig. 5. Cumulative distribution function by experimental data (empirical CDF) and fitted distribution (theoretical CDF).
Fig. 6. Q-Q plots of the experimental data and the fitted distributions.

N. Yoshida et al. / International Journal of Greenhouse Gas Control 49 (2016) 161–178 169
Fig. 7. Relative permeability curves for
Table 6Selected CDF percentiles estimated using the experimental data and truncated nor-mal distributions as PDFs.
Parameter CDF percentiles
P10 P30 P50 P70 P90
Sbrine,ir 0.3266 0.4301 0.5017 0.5733 0.6770k0r,CO2 0.0684 0.1252 0.1897 0.2858 0.5016
sppftipSedwumuf
fluid conditions. It is observed in Fig. 8 that total injected CO2 is
CO2 exponent (m) 1.929 2.977 3.799 4.650 5.908Brine exponent (n) 1.263 1.642 2.017 2.497 3.421
tudy are estimated from experimental data, values of individualarameters and their combinations still have uncertainty. Thesearameters depend on a variety of reservoir conditions, and, even
or the same formation, e.g., the Basal Cambrian shown in Fig. 1(c),hey vary significantly between samples. Monte Carlo simulations performed to account for the uncertainty in each individualarameter as well as combinations of parameters. Latin Hypercubeampling (LHS) is used to reduce the number of realizations in anfficient but rigorous manner (McKay et al., 1979). LHS divides theistribution into many intervals, each with the same probability,ith the number of intervals corresponding to the number of sim-
lations. Samples are then randomly selected for each reservoirodel parameter with each interval sampled only once. The contin-
ous CDFs in Fig. 5 were used in this work. The CDFs were computedrom sample means and variances, creating as an artifact very small
the parameter sensitivity study.
and very large values not measured in experiments. We consider1000 realizations of the relative permeability curves with LHS. Toassess the reliability of the estimated uncertainty (variance) of thetotal injected CO2 from the 1000 realizations, the stabilities of theestimated mean and variance are checked against cases of 100 and500 realizations following the work of Ballio and Guadagnini (2004)on convergence assessment for numerical Monte Carlo simulations.When these values are similar between different realization sizes,the number of realizations can be considered to be sufficient forreliable estimation of the uncertainty.
3. Results
3.1. Parameter sensitivity study
Seventeen simulations were conducted with the relative per-meability curves shown in Fig. 7 under constant injection pressurefor 4 years to clarify the influence of each individual parameter onCO2 injectivity. Fig. 8 shows the simulation results of injected CO2with time. The amount of injected CO2 shows a linear relationshipwith time; the slope, however, depends on the reservoir rock and
highly sensitive to k0r,CO2 compared to the other parameters. Higher
k0r,CO2 values produce higher injection rates. It is also noted that
Sbrine,ir and k0r,CO2 show positive correlations to the total injected

170 N. Yoshida et al. / International Journal of Greenhouse Gas Control 49 (2016) 161–178
(a) Brine residual s aturation (b ) End-point CO2 relative permeabil ity
Time (year)
Tota
lInj
ecte
dC
O2
( Mt)
0 0.5 1 1.5 2 2.5 3 3.5 40
0.2
0.4
0.6
0.8
P10 (Sbrine,ir = 0.3266)P30 (Sbrine,ir = 0.4301)P50 (Sbrine,ir = 0.5017)P70 (Sbrine,ir = 0.5733)P90 (Sbrine,ir = 0.6770)
Time (year)
Tota
lInj
ecte
dC
O2
( Mt)
0 0.5 1 1.5 2 2.5 3 3.5 40
0.2
0.4
0.6
0.8P10 (k0
r,CO2 = 0.0684)P30 (k0
r,CO2 = 0.1252)P50 (k0
r,CO2 = 0.1897)P70 (k0
r,CO2 = 0.2858)P90 (k0
r,CO2 = 0.5016)
Time (year)
Tota
lInj
e cte
dC
O2
(Mt)
0 0.5 1 1.5 2 2.5 3 3.5 40
0.2
0.4
0.6
0.8
P10 (m = 1.929)P30 (m = 2.977)P50 (m = 3.799)P70 (m = 4.650)P90 (m = 5.908)
Time (year)
Tota
lInj
ecte
dC
O2
(Mt)
0 0.5 1 1.5 2 2.5 3 3.5 40
0.2
0.4
0.6
0.8
P10 (n = 1.263)P30 (n = 1.642)P50 (n = 2.017)P70 (n = 2.497)P90 (n = 3.421)
resu
CSr
ituddftttmaTmpTg
(c) CO2 exponen t (m)
Fig. 8. Total injected CO2 history
O2, while m and n have negative correlations; i.e., increases inbrine,ir and k0
r,CO2 increase injectivity, while increases in m and neduce injectivity.
Fig. 9 shows the saturation distribution of the supercritical CO2,.e., the spread of the CO2 plume, after 4 years of injection forhe minimum, base, and maximum cases (P10, P50, and P90 val-es) for each parameter. For the mutually-saturated CO2–brineisplacement simulated here (which is equivalent to immiscibleisplacement), the shape of the CO2 plume depends on the shock
ront of the supercritical CO2. Berg and Ott (2012) investigatedhe stability of CO2–brine immiscible displacement consideringhe shock-front mobility ratio and two dimensionless numbers:he capillary number and the gravity number. The shock-front
obility ratio is the product of the viscosity ratio, �CO2/�brine,nd the relative permeability ratio, kr,CO2(Sshock)/kr,CO2(Sbrine = 1).he macroscopic capillary number defined as the ratio of the
acroscopic viscous force (pressure drop) to macroscopic capillaryressure is used in the description of the stability of the shock front.he gravity number is defined as the ratio of the viscous force to theravity force, e.g., Hilfer and Øren (1996). Berg and Ott (2012) and
(d) Brine expone nt (n)lting from this sensitivity study.
Ott and Berg (2013) pointed out that in a gravity-dominated sys-tem where the gravity number is much higher than 1, the simple 1DBuckley-Leverett shock-front argument is no longer valid, and thegravity effect should be included in the calculation of the capillarynumber and shock-front mobility ratio. Kopp et al. (2009b) dis-cussed the effect of these parameters on CO2 storage capacity andthat a low ratio of gravitational to viscous forces or a high ratio ofcapillary to viscous forces can lead to higher CO2 storage capacities.
Fig. 9 shows similar changes in the CO2 plume shape fromchanges in Sbrine,ir and k0
r,CO2; the CO2 plume spreads more as the
values of Sbrine,ir and k0r,CO2 increase. In this work, the capillary
pressure curve is fixed and does not change with the change ofparameters used in the sensitivity study. Similarly, the gravity num-ber is nearly unchanged between sensitivity study cases becausefluid density differences are indirectly and negligibly affected bychanges to relative permeability parameters. The two dimension-
less numbers are therefore principally affected by the convectiveforce, which is described by the characteristic velocity defined asthe saturation front propagation velocity in Kopp et al. (2009b).
N. Yoshida et al. / International Journal of Greenhouse Gas Control 49 (2016) 161–178 171
Fig. 9. CO2 plume after 4 years injection with different parameter values.

172 N. Yoshida et al. / International Journal of Greenhouse Gas Control 49 (2016) 161–178
Fi
Ts
v
wamCipdswe
icico+avwat1oot
hCitcit(catr
Fig. 11. Changes in the radial extent of CO2 (SCO2 ≥ 0.01) after four years injectiondue to normalized changes in parameter values from the base case.
Table 7Changes of statistical properties of the Monte Carlo simulation results with differentnumbers of realizations (100, 500 and 1000).
Number of realizations Mean (Mt) Standarddeviation (Mt)
Coefficient ofvariation (−)
100 0.726 0.360 0.496
ig. 10. Changes in the total injected CO2 after four years of injection from changesn parameter values from the base case.
he characteristic velocity is approximated by the Buckley-Leveretthock-front velocity expressed as:
SCO2= qtA�
dfCO2
dSCO2|SCO2
(8)
here qt is the total volumetric flow rate, A is the cross-sectionalrea in the flow direction, ϕ is porosity, fCO2 is the fraction of volu-etric flow that is the CO2 phase, and SCO2 is the saturation of the
O2 phase (Dake, 1995). As shown in Fig. 8(b), increases in k0r,CO2
ncrease the flow rate, resulting in the advancement of the CO2lume shown in Fig. 9 (b). By comparison, changes in injection rateue to changes in Sbrine,ir are relatively small (Fig. 8). Figs. 8 and 9how negative correlations of CO2 injectivity and plume spreadith the curvature exponents, i.e., increased multiphase interfer-
nce effects decrease both injectivity and plume spread.In Fig. 10, we show absolute and normalized changes to the total
njected CO2 with changes in the parameter values from the basease including both positive/negative correlations and differencesn magnitudes of changes between parameters. While normalizedhanges of injected CO2 are within a ±10% range for the entire rangef Sbrine,ir , m, and n values, changes due to variations in k0
r,CO2 are80/−60%. The absolute and normalized radial CO2 extents (chosens SCO2 ≥ 0.01) after four years injection are shown in Fig. 11. Again,ariations in k0
r,CO2 cause comparatively large changes, +60%/-45%,hile the curvature exponents cause similarly small changes, with
ll but the P10 value of the CO2 curvature exponent causing changeshat are within ±10% of the base case. However, Sbrine,ir causes +35/-5% changes in the plume extent due to volumetric rearrangementf similar amounts of injected CO2; i.e., a voxel at Sbrine,ir or anyther normalized saturation will have more (or less) CO2, requiringhe plume to contract (or expand) proportionally.
The parameter sensitivity study quantitatively shows that k0r,CO2
as the dominant role in determining the total mass of injectedO2 compared to the other parameters. The magnitude of the total
njected CO2 is impacted most strongly by k0r,CO2 (50–60%), while
he other relative permeability model parameters cause smallerhanges, at most ±10%. It is noted that the parameter range of k0
r,CO2s wider than that of the other parameters in Fig. 10; the experimen-al value of k0
r,CO2 has higher uncertainty compared to the otherscompare the ratios of P10 and P90 values in Table 6). In addition,hanges to Sbrine,ir and k0
r,CO2 also affect the curvature of the rel-
tive permeability curve (Fig. 7). The sensitivity study highlightshe need for more rigorous analysis to generalize our observationselated to uncertainty in the experimental measurements.500 0.730 0.375 0.5141000 0.730 0.370 0.507
3.2. Monte Carlo Simulation
In this section we present a comprehensive investigation of therelative permeability parameters to more fully explore the uncer-tainty in the experimental measurements. The continuous CDFs inFig. 5, which assume a truncated normal/lognormal distribution oneach parameter in the relative permeability model, are used forLatin Hypercube Sampling. LHS reduces the number of realizationsto achieve a reasonable but accurate random distribution as appliedto retention curve uncertainty analysis in the work by Stauffer andLu (2012). In the current study, 1000 realizations of the relativepermeability model are generated. These realizations are plotted inFig. 12. As noted by Mathias et al. (2013) there is no clear relationbetween the relative permeability data and porosity, permeabil-ity, IFT or lithology in the measured data. Thus, our approach ofspanning the parameter space with the observations should yieldmeaningful behavior expected from a wide range of reservoir rocks.
We conducted 1000 numerical reservoir simulations for the pre-viously described 2D cylindrical reservoir case (Fig. 3 and Table 3)using FEHM. Fig. 13 shows total injected CO2 mass as a function oftime for 1000 realizations (gray lines). This figure also shows sixcurves representing the median (blue), mean (red) and confidenceintervals. The green and orange solid curves show the mean ± 1�(68% probability), and the green and orange dotted curves showthe mean ± 2� (95% probability). The mean value of total injectedCO2 amount at four years injection is 0.730 Mt, and the standarddeviation is 0.370 Mt, which is 50.7% of the mean value.
The reliabilities of the estimated mean and standard deviationwere checked by comparing these values against the cases of 100and 500 realizations. Table 7 summarizes the estimated mean, stan-dard deviation, and coefficient of variation of the total injectedCO2 mass after 4 years of injection for different numbers of MonteCarlo realizations. While the mean value has a negligible change
between the cases, the standard deviation and coefficient of varia-tion changed between 100 and 500 realizations and the change getssmaller between 500 and 1000 realization. Therefore, 1000 real-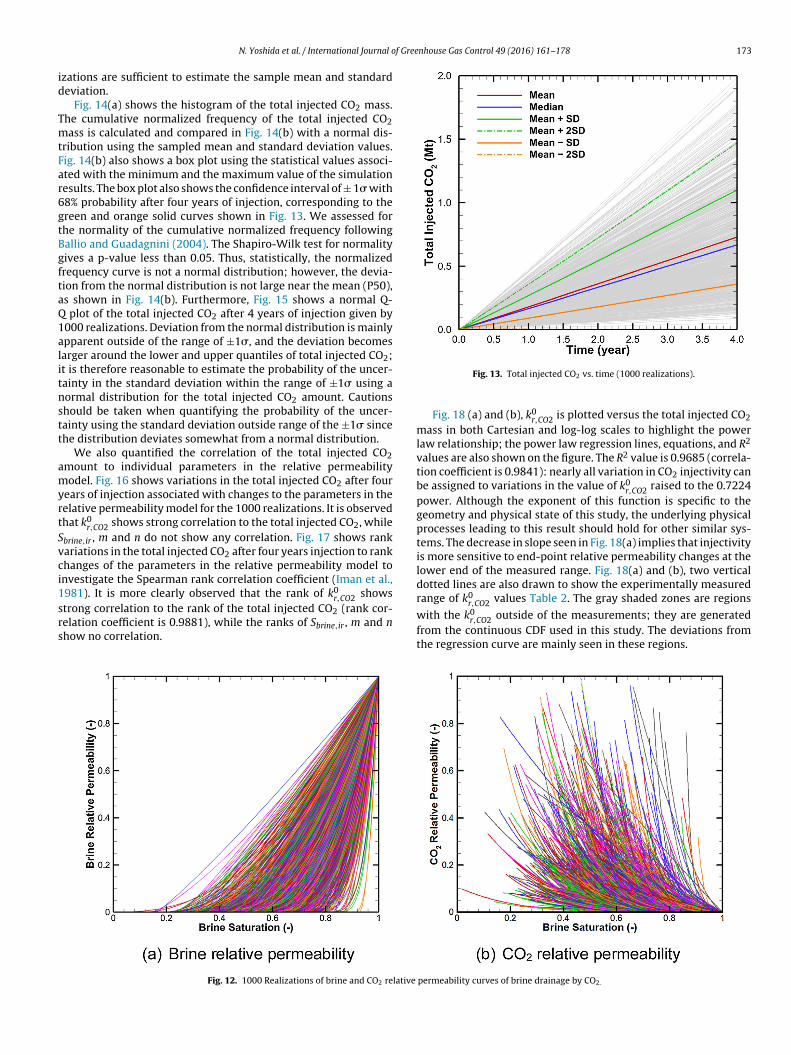
f Greenhouse Gas Control 49 (2016) 161–178 173
id
TmtFar6gtBgftaQ1alitnstt
amyrtSvci1srs
N. Yoshida et al. / International Journal o
zations are sufficient to estimate the sample mean and standardeviation.
Fig. 14(a) shows the histogram of the total injected CO2 mass.he cumulative normalized frequency of the total injected CO2ass is calculated and compared in Fig. 14(b) with a normal dis-
ribution using the sampled mean and standard deviation values.ig. 14(b) also shows a box plot using the statistical values associ-ted with the minimum and the maximum value of the simulationesults. The box plot also shows the confidence interval of ± 1� with8% probability after four years of injection, corresponding to thereen and orange solid curves shown in Fig. 13. We assessed forhe normality of the cumulative normalized frequency followingallio and Guadagnini (2004). The Shapiro-Wilk test for normalityives a p-value less than 0.05. Thus, statistically, the normalizedrequency curve is not a normal distribution; however, the devia-ion from the normal distribution is not large near the mean (P50),s shown in Fig. 14(b). Furthermore, Fig. 15 shows a normal Q-
plot of the total injected CO2 after 4 years of injection given by000 realizations. Deviation from the normal distribution is mainlypparent outside of the range of ±1�, and the deviation becomesarger around the lower and upper quantiles of total injected CO2;t is therefore reasonable to estimate the probability of the uncer-ainty in the standard deviation within the range of ±1� using aormal distribution for the total injected CO2 amount. Cautionshould be taken when quantifying the probability of the uncer-ainty using the standard deviation outside range of the ±1� sincehe distribution deviates somewhat from a normal distribution.
We also quantified the correlation of the total injected CO2mount to individual parameters in the relative permeabilityodel. Fig. 16 shows variations in the total injected CO2 after four
ears of injection associated with changes to the parameters in theelative permeability model for the 1000 realizations. It is observedhat k0
r,CO2 shows strong correlation to the total injected CO2, while
brine,ir , m and n do not show any correlation. Fig. 17 shows rankariations in the total injected CO2 after four years injection to rankhanges of the parameters in the relative permeability model tonvestigate the Spearman rank correlation coefficient (Iman et al.,981). It is more clearly observed that the rank of k0 shows
r,CO2trong correlation to the rank of the total injected CO2 (rank cor-elation coefficient is 0.9881), while the ranks of Sbrine,ir , m and nhow no correlation.Fig. 12. 1000 Realizations of brine and CO2 relative
Fig. 13. Total injected CO2 vs. time (1000 realizations).
Fig. 18 (a) and (b), k0r,CO2 is plotted versus the total injected CO2
mass in both Cartesian and log-log scales to highlight the powerlaw relationship; the power law regression lines, equations, and R2
values are also shown on the figure. The R2 value is 0.9685 (correla-tion coefficient is 0.9841): nearly all variation in CO2 injectivity canbe assigned to variations in the value of k0
r,CO2 raised to the 0.7224power. Although the exponent of this function is specific to thegeometry and physical state of this study, the underlying physicalprocesses leading to this result should hold for other similar sys-tems. The decrease in slope seen in Fig. 18(a) implies that injectivityis more sensitive to end-point relative permeability changes at thelower end of the measured range. Fig. 18(a) and (b), two verticaldotted lines are also drawn to show the experimentally measuredrange of k0
r,CO2 values Table 2. The gray shaded zones are regions
with the k0r,CO2 outside of the measurements; they are generated
from the continuous CDF used in this study. The deviations fromthe regression curve are mainly seen in these regions.
permeability curves of brine drainage by CO2.

174 N. Yoshida et al. / International Journal of Greenhouse Gas Control 49 (2016) 161–178
(a) Histogr am
0
20
40
60
80
100
120
140
0.0
0.1
0.2
0.3
0.4
0.5
0.6
0.7
0.8
0.9
1.0
1.1
1.2
1.3
1.4
1.5
1.6
1.7
1.8
1.9
2.0
Freq
uenc
y
Total injec ted CO2 (Mt)
0.0
0.1
0.2
0.3
0.4
0.5
0.6
0.7
0.8
0.9
1.0
0.0 0.5 1.0 1.5 2.0
Prob
abili
ty
Total injec ted CO2 (Mt)
Normali zed Frequ ency
Normal Distribution
0.0
0.2
0.4
0.6
0.8
1.0
1.2
1.4
1.6
1.8
2.0
Tota
l CO
2 in
ject
ed, k
gTo
tal i
njec
ted
CO2
(Mt)
Fig. 14. Statistical distribution of total
-3 -2 -1 0 1 2 3
0.0
0.5
1.0
1.5
2.0
Theore tical Quantiles
Sam
ple
Qua
ntile
s
emk
(rpdorooWtorv
in residual brine saturation and either CO2 or brine curvature
Fig. 15. Normal Q-Q plot of total injected CO2 given by 1000 realizations.
The model regression fit to the Monte Carlo simulations isxplained by only one parameter, k0
r,CO2, but provides excellent esti-ation. In Fig. 19(a) and (b), total injected CO2 is plotted against
0r,CO2 including the regression line and several error-envelopes±10%, ±20% and ±30%). As shown in Fig. 19(a), the simulationesults are largely within the ±20% range. Fig. 19(b) shows the samelot with a log-log scale (excluding the data with k0
r,CO2 < 0.01). Asiscussed in Fig. 18, the results given by Fig. 18 outside the rangef experimental measurement show significant deviation from theegression line. However, these values of k0
r,CO2 are created by usef the LHS with continuous CDFs. In terms of practical site-selectionf CO2 sequestration, we can ignore the deviation in these regions.ithin experimentally measured range, results are clustered along
he regression line and are distributed within the ±30% range, with
nly five exceptions out of 1000 realizations; i.e., 99.5% of modeluns were within ±30% of a regression line relying solely on oneariable: end-point CO2 relative permeability.(b) Cumulative distribution function
injected CO2 (1000 realizations).
These results support the conclusion of the sensitivity studythat k0
r,CO2 has the dominant role in the determination of the totalinjected CO2 mass when compared to other parameters in the rela-tive permeability model. This conclusion highlights the importanceof the work done by Levine (2011) to measure end-point CO2 rel-ative permeability and quantifies similar assertions made thereinregarding the sensitivity of injectivity and storage capacity to end-point CO2 relative permeability. Quantification of reservoir modelsensitivity plays an important role in informing where limitedexperimental resources can achieve the most cost-effective result.Because end-point relative permeability is a function of wettingstate, accurate determination of CO2-brine wetting state throughcontact angle and core flooding experiments is necessary to helpachieve the DOE’s stated goal to “support industry’s ability to pre-dict CO2 storage capacity in geologic formations to within ± 30%”.
4. Summary and conclusion
Numerical reservoir models rely on functions that areparameterized to avoid numerical instabilities and to achieve com-putational efficiency. Relative permeability between brine andcarbon dioxide (CO2) is a crucial parameter for determining CO2injectivity in CO2 reservoir models. In this work, the FEHM reservoirsimulator was used to determine the sensitivity of CO2 injectivityto relative permeability model parameters.
A numerical sensitivity study uses a truncated nor-mal/lognormal distribution fit to published experimental resultsto set a base case and relative permeability model parameter vari-ation range. The sensitivity study probes the effect of variations inthe values of individual relative permeability model parameters at10%, 30%, 70% and 90% cumulative probability values in comparisonto a base case using 50% values for all the parameters. Variationsin experimentally measured end-point CO2 relative permeabilityfrom the base case cause +80/−60% changes in the total mass ofCO2 injected over 4 years and +60/−45% changes in the radialextent of the injected CO2 (with a CO2 saturation cutoff of 0.01).Variations in residual brine saturation cause +35/−15% changesto the CO2 radial extent, but otherwise changes due to variations
exponents are within 10% of the base case, less than variations dueto geological uncertainty, and in agreement with results obtainedin previous semi-analytical studies.

N. Yoshida et al. / International Journal of Greenhouse Gas Control 49 (2016) 161–178 175
the re
diHMsaiitoCtot
Cpetoa2w
Fig. 16. Total injected CO2 to the parameters of
A more robust Monte Carlo simulation method was used toetermine the statistical sensitivity of CO2 injectivity to changes
n individual parameters while varying all model parameters. Latinypercube Sampling was used to efficiently but reliably performonte Carlo analysis using 1000 FEHM simulations. The results
how that the total injected CO2 mass varies by ±50.7% within 1�nd ±101.4% within 2� for a range of shapes of relative permeabil-ty curves. The Monte Carlo simulation results show that total CO2njected is statistically correlated to only the end-point CO2 rela-ive permeability, with no correlation to residual brine saturationr the CO2 or brine curvature exponents (m and n). Total injectedO2 and end-point CO2 relative permeability have a power law rela-ionship with an exponent of 0.7224 and the relationship had an R2
f 0.9685, i.e., nearly complete predictive power. Deviation fromhe regression line is within ±30% for 99.5% of the model runs.
Both the individual parameter sensitivity study and the Montearlo simulations show the importance of end-point CO2 relativeermeability measurements for accurate reservoir modeling. How-ver, the results are only as good as the experimental data usedo create the parameter distribution functions and the majority
f reported measurements of end-point CO2 relative permeabilityre known to suffer from significant experimental artifacts (Levine,011). The end-point relative permeability and fluid-fluid-rocketting state are directly related by well-studied petrophysicallative permeability model (1000 Realizations).
processes. Unfortunately, a recent review (Iglauer et al., 2015)highlighted the significant uncertainty in CO2-brine contact angleexperimental measurements of the wetting state in GCS systems,with a nearly-complete lack of reproducibility between laborato-ries. In the absence of in-situ injection tests that can be used toestimate field properties, numerical modeling of geological carbonsequestration reservoirs relies on laboratory scale experimentalmeasurements. High pressure CO2-brine contact angle and coreflooding experiments are difficult and expensive, but comprehen-sive and reliable datasets are needed. Models can only ever be asgood as the input assumptions as determined by laboratory exper-imental measurement.
Our work focuses on uncertainty resulting from relative per-meability parameters with experimentally determined parameterranges. The parameter uncertainty is modeled using statistics ofrelative permeability data obtained from several disparate forma-tions. This might lead to an over estimation of the variability CO2storage capacity, but this is a practical approach to estimate range ofuncertainty in the absence of field data. Once field data are availableat a given site, history matching and model calibration can reduce
model uncertainty and increase the predictive power of site spe-cific models. In such efforts, core-scale relative permeability modelsare up-scaled to field-scale relative permeability models (Lomelandet al., 2012), but non-unique relationships between intrinsic and
176 N. Yoshida et al. / International Journal of Greenhouse Gas Control 49 (2016) 161–178
Fig. 17. Rank of total injected CO2 to rank of the parameters of the relative permeability model (1000 Realizations).
Fig. 18. Total injected CO2 mass versus end-point CO2 relative permeability with a regression line showing the power law relationship.

N. Yoshida et al. / International Journal of Greenhouse Gas Control 49 (2016) 161–178 177
e perm
rturuv
A
itbaRoa
A
i0
R
A
B
B
B
B
B
B
Fig. 19. Total injected CO2 mass versus end-point CO2 relativ
elative permeability models may result from such model calibra-ion (Mishra et al., 2014). In addition, the 2D homogeneous modelsed in this work represents average intrinsic permeability of theeservoir, but heterogeneity in intrinsic permeability may atten-ate the effects of relative permeability uncertainty reducing theariance of the CO2 storage capacity.
cknowledgement
This work is part of the Big Sky CO2-EOR/Storage Project thats supported by the U.S. Department of Energy and managed byhe National Energy Technology Laboratory under contract num-er DE-FC26-05NT42587. This research was supported in part byn appointment to the National Energy Technology Laboratoryesearch Participation Program, sponsored by the U.S. Departmentf Energy and administered by the Oak Ridge Institute for Sciencend Education.
ppendix A. Supplementary data
Supplementary data associated with this article can be found,n the online version, at http://dx.doi.org/10.1016/j.ijggc.2016.03.08.
eferences
nderson, W.G., 1987. Wettability literature survey part 5: the effects ofwettability on relative permeability. J. Petrol. Technol. 39 (11), 1453–1468,http://dx.doi.org/10.2118/16323-PA.
achu, S., 2013. Drainage and imbibition CO2/brine relative permeability curves atin situ conditions for sandstone formations in Western Canada. EnergyProcedia 37 (0), 4428–4436, http://dx.doi.org/10.1016/j.egypro.2013.07.001.
achu, S., Bennion, D.B., 2008. Effects of in-situ conditions on relative permeabilitycharacteristics of CO2-brine systems. Environ. Geol. 54 (8), 1707–1722, http://dx.doi.org/10.1007/s00254-007-0946-9.
achu, S., Bennion, D.B., 2009. Interfacial tension between CO2, freshwater, andbrine in the range of pressure from (2 to 27) MPa temperature from (20 to125)◦C, and water salinity from (0 to 334 000) mg L−1. J. Chem. Eng. Data 54(3), 765–775, http://dx.doi.org/10.1021/je800529x.
allio, F., Guadagnini, A., 2004. Convergence assessment of numerical monte carlosimulations in goundwater hydrogy. Water Resour. Res. 40 (4), 729–774,http://dx.doi.org/10.1029/2003WR002876.
ennion, D.B., Bachu, S., 2005. Relative permeability characteristics forsupercritical CO2 displacing water in a variety of potential sequestration zones.
In: Paper SPE-95547-MS Presented at SPE Annual Technical Conference andExhibition, 9–12 October, Dallas, Texas, http://dx.doi.org/10.2118/95547-MS.ennion, D.B., Bachu, S., 2006. Dependence on temperature, pressure, and salinityof the IFT and Relative permeability displacement characteristics of CO2
injected in deep saline aquifers. In: Paper SPE-102138-MS Presented at SPE
eability including error envelopes from the regression line.
Annual Technical Conference and Exhibition, 24–27 September, San Antonio,Texas, USA, http://dx.doi.org/10.2118/102138-MS.
Bennion, D.B., Bachu, S., 2008. Drainage and imbibition relative permeabilityrelationships for supercritical CO2/brine and H2S/brine systems inintergranular sandstone, carbonate, shale, and anhydrite rocks. SPE Reserv.Eval. Eng. 11 (03), 487–496, http://dx.doi.org/10.2118/99326-PA.
Bennion, D.B., Bachu, S., 2010. Drainage and imbibition CO2/brine relativepermeability curves at reservoir conditions for carbonate fromations. In: PaperSPE-134028-MS Presented at SPE Annual Technical Conference and Exhibition,19–22 September, Florence, Italy, http://dx.doi.org/10.2118/134028-MS.
Berg, S., Ott, H., 2012. Stability of CO2–brine immiscible displacement. Int. J.Greenh. Gas Control 11 (0), 188–203, http://dx.doi.org/10.1016/j.ijggc.2012.07.001.
Burton, M., Kumar, N., Bryant, S.L., 2009. CO2 injectivity into brine aquifers: whyrelative permeability matters as much as absolute permeability. EnergyProcedia 1 (1), 3091–3098, http://dx.doi.org/10.1016/j.egypro.2009.02.089.
Dai, Z., Stauffer, P.H., Carey, J.W., Middleton, R.S., Lu, Z., Jacobs, J.F.,Hnottavange-Telleen, K., Spangler, L.H., 2014. Pre-site characterization riskassessment for commercial-scale carbon sequestration. Environ. Sci. Technol.48 (7), 3908–3915, http://dx.doi.org/10.1021/es405468p.
Dake, L.P., 1995. Fundamentals of Reservoir Engineering. Elsevier Science B.V.(Reprint).
Deng, H., Stauffer, P.H., Dai, Z., Jiao, Z., Surdam, R.C., 2012. Simulation ofindustrial-scale CO2 storage: multi-scale heterogeneity and its impacts onstorage capacity, injectivity and leakage. Int. J. Greenh. Gas Control 10 (0),397–418, http://dx.doi.org/10.1016/j.ijggc.2012.07.003.
Dria, D.E., Pope, G.A., Sepehrnoori, K., 1993. Three-phase gas/oil/brine relativepermeabilities measured under CO2 flooding conditions. SPE Reserv. Eng. 8 (2),143–150, http://dx.doi.org/10.2118/20184-PA.
González-Nicolás, A., Baù, D., Cody, B.M., Alzraiee, A., 2015. Stochastic and globalsensitivity analyses of uncertain parameters affecting the safety of geologicalcarbon storage in saline aquifers of the Michigan Basin. Int. J. Greenh. GasControl 37, 99–114, http://dx.doi.org/10.1016/j.ijggc.2015.03.008.
Goodman, A., Hakala, A., Bromhal, G., Deel, D., Rodosta, T., Frailey, S., Small, M.,Allen, D., Romanov, V., Fazio, J., Huerta, N., McIntyre, D., Kutchko, B., Guthrie,G., 2011. U.S. DOE methodology for the development of geologic storagepotential for carbon dioxide at the national and regional scale. Int. J. Greenh.Gas Control 5 (4), 952–965, http://dx.doi.org/10.1016/j.ijggc.2011.03.010.
Heath, J.E., Kobos, P.H., Roach, J.D., Dewers, T., McKenna, S.A., 2012. Geologicheterogeneity and economic uncertainty of subsurface carbon dioxide storage.SPE Econ. Manag. 4 (01), 32–41, http://dx.doi.org/10.2118/158241-PA.
Hilfer, R., Øren, P.E., 1996. Dimensional analysis of pore scale and field scaleimmiscible displacement. Transp. Porous Media 22 (1), 53–72, http://dx.doi.org/10.1007/BF00974311.
Iglauer, S., Pentland, C.H., Busch, A., 2015. CO2 wettability of seal and reservoirrocks and the implications for carbon geo-sequestration. Water Resour. Res. 51(1), 729–774, http://dx.doi.org/10.1002/2014WR015553.
Iman, R.L., Helton, J.C., Campbell, J.E., 1981. An approach to sensitivity analysis ofcomputer models, part 1—introduction, input variable selection andpreliminary variable assessment. J. Qual. Technol. 13 (3), 174–183.
Juanes, R., Spiteri, E.J., Orr, F.M., Blunt, M.J., 2006. Impact of relative permeabilityhysteresis on geological CO2 storage. Water Resour. Res. 42 (12), W12418,http://dx.doi.org/10.1029/2005WR004806.
Kopp, A., Class, H., Helmig, R., 2009a. Investigations on CO2 storage capacity insaline aquifers: part 1. Dimensional analysis of flow processes and reservoircharacteristics. Int. J. Greenh. Gas Control 3 (3), 263–276, http://dx.doi.org/10.1016/j.ijggc.2008.10.002.

1 f Gree
K
K
L
L
L
L
L
L
M
M
M
M
78 N. Yoshida et al. / International Journal o
opp, A., Class, H., Helmig, R., 2009b. Investigations on CO2 storage capacity insaline aquifers—Part 2: estimation of storage capacity coefficients. Int. J.Greenh. Gas Control 3 (3), 277–287, http://dx.doi.org/10.1016/j.ijggc.2008.10.001.
revor, S.C.M., Pini, R., Zuo, L., Benson, S.M., 2012. Relative permeability andtrapping of CO2 and water in sandstone rocks at reservoir conditions. WaterResour. Res. 48 (2), W02532, http://dx.doi.org/10.1029/2011WR010859.
ake, L.W., 2010. Enhanced Oil Recovery. Society of Petroleum Engineers (Reprint),Richardson, Texas.
emmon, E.W., McLinden, M.O., Friend, D.G., 2005. In: Linstrom, P.J., Mallard, W.G.(Eds.), Thermophysical Properties of Fluid Systems in NIST ChemistryWebBook, NIST Standard Reference Database Number 69. National Institute ofStandards and Technology, Gaithersburg, MD, 20899 http://webbook.nist.gov.
evine, J., 2011. Relative permeability experiments of carbon dioxide displacingbrine & their implications for carbon sequestration. In: PhD Dissertation.Columbia University.
evine, J.S., Kelkar, S., Stauffer, P.H., 2013. Hydraulically induced shear failureduring CO2 injection into deep ocean sediments. In 47th US RockMechanics/Geomechanics Symposium.
evine, J.S., Goldberg, D.S., Lackner, K.S., Matter, J.M., Supp, M.G., Ramakrishnan,T.S., 2014. Relative permeability experiments of carbon dioxide displacingbrine and their implications for carbon sequestration. Environ. Sci. Technol. 48(1), 811–818, http://dx.doi.org/10.1021/es401549e.
omeland, F., Hasanov, B., Ebeltoft, E., Berge, M., 2012. A versatile representation ofupscaled relative permeability for field applications. In: Presented at the SPEEuropec/EAGE Annual Conference, 4–7 June, Copenhagen, Denmark.SPE-154487-MS, http://dx.doi.org/10.2118/154487-MS.
athias, S.A., Gluyas, J.G., González Martínez de Miguel, G.J., Bryant, S.L., Wilson,D., 2013. On relative permeability data uncertainty and CO2 injectivityestimation for brine aquifers. Int. J. Greenh. Gas Control 12 (0), 200–212,http://dx.doi.org/10.1016/j.ijggc.2012.09.017.
cKay, M.D., Beckman, R.J., Conover, W.J., 1979. A comparison of three methods forselecting values of input variables in the analysis of output from a computercode. Technometrics 21 (2), 239–245, http://dx.doi.org/10.2307/1268522.
iddleton, R.S., Keating, G., Stauffer, P.H., Jordan, A., Viswanathan, H., Kang, Q.,Carey, B., Mulkey, M., Sullivan, J., Chu, S.P., Esposito, R., 2012. The mulitscalescience of CO2 capture and storage: from the pore scale to the regional scale.
Energy Environ. Sci. 5, 7328, http://dx.doi.org/10.1039/C2EE03227A.ishra, S., Oruganti, Y.D., Gupta, N., Ganesh, P.R., McNeil, C., Bhattacharya, I.,Spitznogle, G., 2014. Modeling CO2 plume migration based on calibration ofinjection and post-injection pressure response at the AEP mountaineer project.Greenh. Gas Sci. Technol. 4, 331–356, http://dx.doi.org/10.1002/ghg.1434.
nhouse Gas Control 49 (2016) 161–178
National Energy Technology Laboratory, 2012. United States Carbon Utilizationand Storage Atlas (Atlas IV). (DOE/NETL-2012/1589).
Ott, H., Berg, S., 2013. Stability of CO2-brine primary drainage. Energy Procedia 37(0), 4568–4574, http://dx.doi.org/10.1016/j.egypro.2013.06.364.
Perrin, J.-C., Benson, S., 2010. An experimental study on the influence of sub-corescale heterogeneities on CO2 distribution in reservoir rocks. Transp. PorousMedia 82 (1), 93–109, http://dx.doi.org/10.1007/s11242-009-9426-x.
Perrin, J.-C., Krause, M., Kuo, C.-W., Miljkovic, L., Charoba, E., Benson, S.M., 2009.Core-scale experimental study of relative permeability properties of CO2 andbrine in reservoir rocks. Energy Procedia 1 (1), 3515–3522, http://dx.doi.org/10.1016/j.egypro.2009.02.144.
Pini, R., Benson, S.M., 2013. Simultaneous determination of capillary pressure andrelative permeability curves from core-flooding experiments with various fluidpairs. Water Resour. Res. 49 (6), 3516–3530, http://dx.doi.org/10.1002/wrcr.20274.
Porter, M.L., Wildenschild, D., Grant, G., Gerhard, J.I., 2010. Measurement andprediction of the relationship between capillary pressure, saturation, andinterfacial area in a NAPL-water-glass bead system. Water Resour. Res. 46 (8).
Pruess, K., Garcia, J., Kovscek, T., Oldenburg, C., Rutqvist, J., Steefel, C., Xu, T., 2002.Intercomparison of numerical simulation codes for geologic disposal of CO2.Tech. Rep., Lawrence Berkley National Laboratory, Earth Science Devision.LBNL-51813.
Ramakrishnan, T.S., Cappiello, A., 1991. A new technique to measure static anddynamic properties of a partially saturated porous medium. Chem. Eng. Sci. 46(4), 1157–1163, http://dx.doi.org/10.1016/0009-2509(91)85109-B.
Stauffer, P.H., Lu, A., 2012. Quantifying transport uncertainty in unsaturated rockusing Monte Carlo sampling of retention curves. Vadose Zone J. 11 (4), http://dx.doi.org/10.2136/vzj2011.0171.
Stauffer, P.H., Viswanathan, H.S., Pawar, R.J., Guthrie, G.D., 2009. A system modelfor geologic sequestration of carbon dioxide. Environ. Sci. Technol. 43 (3),565–570.
Stauffer, P.H., Lewis, K.C., Stein, J.S., Travis, B.J., Lichtner, P., Zyvoloski, G., 2014.Joule–Thomson effects on the flow of liquid water. Transp. Porous Media 105(3), 471–485, http://dx.doi.org/10.1007/s11242-014-0379-3.
van Genuchten, M.T., 1980. A closed-form equation for predicting the hydraulicconductivity of unsaturated soils1. Soil Sci. Soc. Am. J. 44 (5), 892–898, http://dx.doi.org/10.2136/sssaj1980.03615995004400050002x.
Willhite, G.Paul, 1986. Waterflooding. Society of Petroleum Engineers, Richardson,
Texas, USA.Zyvoloski, G.A., Robinson, B.A., Dash, Z.V., Trease, L.L., 2011. Summary of theModels and Methods for the (FEHM) Application—A Finite-Element Heat- andMass-Transfer Code. LA-13306-MS, Los Alamos National Laboratory, LosAlamos, New Mexico.