international journal of greenhouse gas control · 172 n. wei et al. / international journal of...
TRANSCRIPT

International Journal of Greenhouse Gas Control 37 (2015) 170–181
Contents lists available at ScienceDirect
International Journal of Greenhouse Gas Control
journa l homepage: www.e lsev ier .com/ locate / i jggc
Economic evaluation on CO2-EOR of onshore oil fields in China
Ning Weia,∗, Xiaochun Lia,∗, Robert T. Dahowskib, Casie L. Davidsonb,Shengnan Liua, Yongjin Zhac
a State Key Laboratory for Geo-Mechanics and Geo-Technical Engineering, Institute of Rock and Soil Mechanics,Chinese Academy of Sciences, Wuhan 430071, Chinab Pacific Northwest National Laboratory, Richland, WA, USAc Drilling Research Institute, China National Petroleum Corporation, Beijing 100195, China
a r t i c l e i n f o
Article history:Received 28 September 2014Received in revised form 22 January 2015Accepted 26 January 2015Available online 25 March 2015
Keywords:CO2-EORPerformance modelCost modelCO2 storage resourceOnshore oil fields
a b s t r a c t
Carbon dioxide enhanced oil recovery (CO2-EOR) and sequestration in depleted oil reservoirs is a plau-sible option for utilizing anthropogenic CO2 to increase oil production while storing CO2 underground.Evaluation of the storage resources and cost of potential CO2-EOR projects is an essential step before thecommencement of large-scale deployment of such activities. In this paper, a hybrid techno-economicevaluation method, including a performance model and cost model for onshore CO2-EOR projects, hasbeen developed based on previous studies. Total 296 onshore oil fields, accounting for about 70% of totalmature onshore oil fields in China, were evaluated by the techno-economic method. The key findings ofthis study are summarized as follows: (1) deterministic analysis shows there are approximately 1.1 bil-lion tons (7.7 billion barrels) of incremental crude oil and 2.2 billion tons CO2 storage resource for onshoreCO2-EOR at net positive revenue within the Chinese oil fields reviewed under the given operating strat-egy and economic assumptions. (2) Sensitivity study highlights that the cumulative oil production andcumulative CO2 storage resource are very sensitive to crude oil price, CO2 cost, project lifetime, discountrate and tax policy. High oil price, short project lifetime, low discount rate, low CO2 cost, and low taxpolicy can greatly increase the net income of the oil enterprise, incremental oil recovery and CO2 storageresource. (3) From this techno-economic evaluation, the major barriers to large-scale deployment of CO2-EOR include complex geological conditions, low API of crude oil, high tax policy, and lack of incentivesfor the CO2-EOR project.
© 2015 The Authors. Published by Elsevier Ltd. This is an open access article under the CC BY-NC-NDlicense (http://creativecommons.org/licenses/by-nc-nd/4.0/).
1. Introduction
Carbon dioxide enhanced oil recovery (CO2-EOR) has receivedincreased attention for CO2 utilization, mitigation, and economicbenefit resulting from stimulating declining oil field production(Godec et al., 2011; Holt et al., 2005; Jing, 2003). CO2-EOR technol-ogy has been applied for decades in the oil industry; more than 169CO2-EOR projects have been undertaken worldwide with both nat-ural and anthropogenic CO2, most of which are in the United Statesand Canada (Al Adasani and Bai, 2011). This history of projectsprovides a significant experiential knowledge base regarding thetechnical and commercial viability of CO2-EOR practices as well asthe potential for CO2 capture and geological sequestration (CCS).
After many years of secondary production, most existing oil-fields in China have entered mature stages of their lifecycles, and
∗ Corresponding authors. Tel.: +86 139 95659295; fax: +86 027 87198967.E-mail addresses: [email protected] (N. Wei), [email protected] (X. Li).
many are beginning to experience production decline. Therefore,there is an urgent need to find ways for stabilizing and even increas-ing oil production in China’s oil fields (Zhang, 2012). Meanwhile,CO2 capture and geological storage (CCS) technologies are particu-larly important to China due to its large and rapidly rising emissionsand high dependence on fossil fuel, and large remaining coalreserves. CO2-EOR technology can beneficially use anthropogenicCO2 to stimulate additional crude oil production, and is consideredas an important option for diffusion and scaling-up to commer-cial CCS projects. Therefore, CO2-EOR technology may provide animportant option for both oil recovery and CO2 mitigation.
Assessment of the oil recovery, CO2 storage resource and eco-nomic factors of CO2-EOR projects is the first step in the strategicdeployment of CO2-EOR activities. Many researchers have devel-oped various techno-economic models for assessing the potentialof CO2-EOR and for providing support for the strategy of car-bon emission reduction (Bock et al., 2003; Dahowski et al., 2005;Davidson et al., 2011; Hall, 2012; Holt et al., 2005, 2009; Holtz et al.,1999, 2001; Khorshidi et al., 2011; King et al., 2011; Klins, 1984;
http://dx.doi.org/10.1016/j.ijggc.2015.01.0141750-5836/© 2015 The Authors. Published by Elsevier Ltd. This is an open access article under the CC BY-NC-ND license (http://creativecommons.org/licenses/by-nc-nd/4.0/).
N. Wei et al. / International Journal of Greenhouse Gas Control 37 (2015) 170–181 171
Nomenclature
OOIP original oil in place, calculated by standard oil indus-try method [m3]
A area of oil field [m2]hn net thickness of oil pay zone [m]ϕe average effective porosity of pay zone [−]Swi initial water saturation, expressed as a fraction [−]Er overall recovery efficiency, Er = Em · Ea · Ev · Ed [−]Em mobility efficiency [−]Ea areal sweep efficiency [−]Ev vertical sweep efficiency [−]Ed displacement efficiency; the iterative method fol-
lows the method presented by McCoy (2008) [−](Fi)BT hydrocarbon pore volume (HCPV) of CO2 injected at
the point where CO2 breaks through the productionwells [−]
Fi HCPV fraction of injected CO2 [−]Bo initial oil formation volume factor [−]�CO2res CO2 density at reservoir temperature and pressure
conditions [t/m3]Roil/CO2
net displacement ratio between oil and CO2 [t/bbl]Clease cost of leasing equipment [USD]D well depth [m]CD&C drilling and completion capital cost of new wells
[USD]Nwell number of wells [−]Nwell,IE the total number of injection wells [−]Nwell,pattern the total number of well patterns [−]Nwell,sub number of wells [−]; sub means the type of well,
such as new, production, or injection wella1 and a2 regression coefficients for production/injection
equipment and lease equipmentCpattern cost for well pattern equipment [USD]CPE cost of production equipment [USD]CIE cost of injection equipment [USD]CWO capital cost of well workover [USD]CFL capital cost of flowlines and field connections [USD]Cannual annual investment cost for EOR [USD/a]CRF capital recovery factor [−/a]r discount rate [−]T lifetime of single phase CO2-EOR project [−]O & Mannual annual operation and maintenance cost [USD/a]O & Mdaily daily expenditures in operation and maintenance
[USD/a]O & Mcons consumables’ cost in operation and maintenance
[USD/a]O & Msur surface operation and maintenance cost in opera-
tion and maintenance [USD/a]O & Msubsur subsurface maintenance cost in operation and
maintenance [USD/a]mt
CO2annual CO2 flow amount in year t [t/a]
MCO2 total CO2 stored [t]EOR total incremental oil production [bbl]Crecycling levelized cost of CO2 recycling [USD/t]CM&V total monitoring and verification cost [USD]Q annual mass flow rate of CO2 in CO2 recycling pro-
cess [t/a]Costt annual total cost for CO2-EOR project in year t
[USD/a]Ct
oiloil revenue in year t [USD]
O&Mtannual
the total cost of operating expenses (OPEX) in yeart [USD]
CF capacity efficient [−]
CCO2 CO2 purchase cost-related [USD/t]Taxt
annualannual royalties for CO2-EOR project [USD/a]
t evaluation year for economic evaluation [−]Ct annual income from crude oil sale [USD/a]NPV net present value [USD]RLev net income or CO2 mitigation cost [USD/bbl or
USD/t]CostLev levelized cost of CO2 or crude oil [USD/t or USD/bbl]
McCollum and Ogden, 2006; McCoy, 2008; McCoy and Rubin, 2009;Rubin et al., 2013; van Bergen et al., 2004). The techno-economicevaluation is data dependent. With more data, the evaluation canbe performed more reliably and with higher resolution. The CO2storage resource in some mature oil reservoirs in China have beenassessed using various methods (Dahowski et al., 2012; Li et al.,2009; Liang et al., 2009; Shen et al., 2009; Zhang et al., 2011), andthe economics of CO2-EOR in China have also been evaluated usingthe first-order economic method (Dahowski et al., 2012). However,further economics assessment need to be conducted to enhance theunderstanding of CO2-EOR in China using more detailed geologicaldata and economic coefficients.
This study aims to develop an improved techno-economicmodel for estimating the CO2 storage resource and economicsof CO2-EOR based on limited site-specific reservoir data, providepreliminary techno-economic insight regarding the potential foronshore CO2-EOR in China, and identify the major technical-economic barriers to deployment of CO2-EOR in China.
2. Methodology for techno-economic evaluation
The evaluation of the techno-economic aspects of onshore CO2-EOR can be accomplished using a technical-economic model withinput from available oil fields data, and guided by the CO2-EOR pro-cess workflow according to typical operating strategy (Holt et al.,2009; McCoy and Rubin, 2009).
2.1. Operating strategy of CO2-EOR
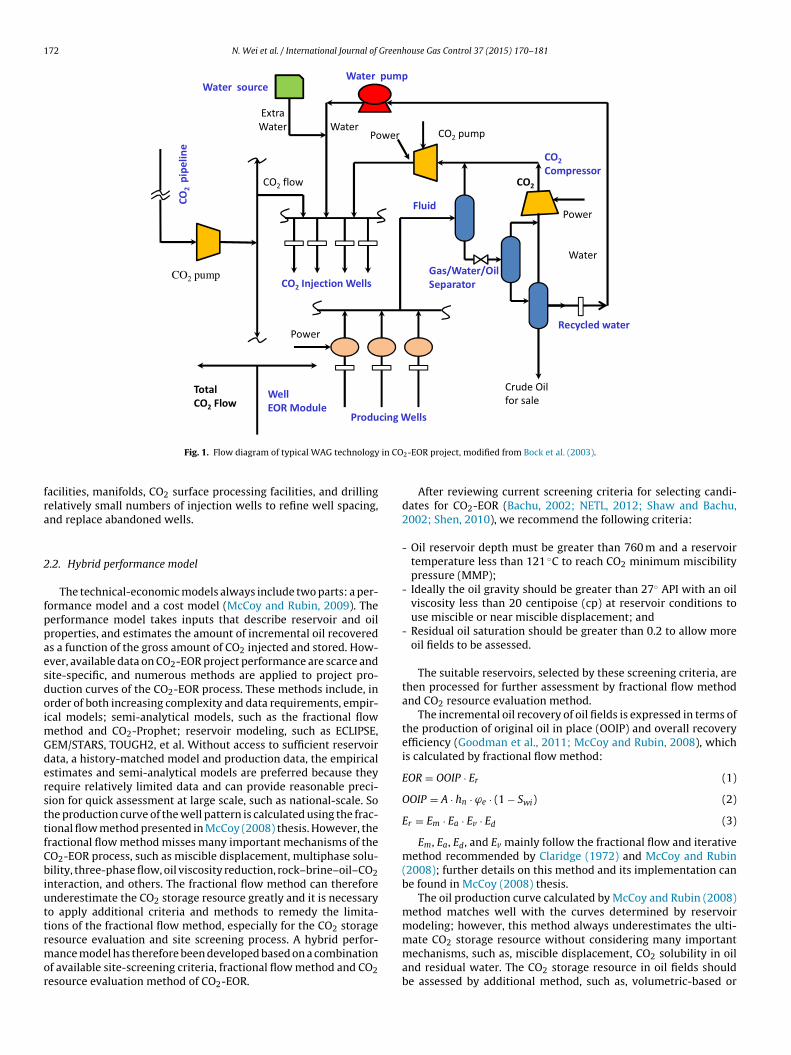
CO2-EOR technologies currently include gravity stabilizing gasinjection (GSGI), continuous injection (miscible/immiscible flood-ing), water alternating gas (WAG), and several next-generationCO2-EOR technologies reviewed by Kuuskraa et al. (2009). Cur-rently, the CO2-EOR industry continues to use WAG as the maintechnology for controlling CO2 mobility and flood performanceby increasing microscopic/macroscopic displacement efficiency(Christensen et al., 2001; IEA-GHG, 2000). Fig. 1 shows a typicalflow diagram of WAG technology used in a CO2-EOR project, inwhich CO2 is transported, compressed, and injected, alternativelywith water, into the injection wells of an oil field. In the reservoir,CO2 mobilizes oil by miscible or immiscible displacement. Part ofthe CO2 is stored in immobile oil, residue water and empty pores,and the rest is produced at production wells with oil, water, and nat-ural gas. The CO2 from production wells is separated, compressed,and re-injected with new CO2 into the reservoir.
In the CO2-EOR design, we assume that the field has undergoneprimary and secondary flooding and that the CO2 flood uses WAGinjection (Bock et al., 2003). Because reworking an existing wellfield is much cheaper than drilling new wells for CO2-EOR (McCoy,2008), it is reasonable to assume that the CO2-EOR projects arebased on current well fields with significant infrastructure alreadyin place. Costs therefore consider conversion of water injectionwells to CO2 injection wells, reworking of injection and productionwells, upgrades to production facilities, establishment of surface
172 N. Wei et al. / International Journal of Greenhouse Gas Control 37 (2015) 170–181
Fig. 1. Flow diagram of typical WAG technology in CO2-EOR project, modified from Bock et al. (2003).
facilities, manifolds, CO2 surface processing facilities, and drillingrelatively small numbers of injection wells to refine well spacing,and replace abandoned wells.
2.2. Hybrid performance model
The technical-economic models always include two parts: a per-formance model and a cost model (McCoy and Rubin, 2009). Theperformance model takes inputs that describe reservoir and oilproperties, and estimates the amount of incremental oil recoveredas a function of the gross amount of CO2 injected and stored. How-ever, available data on CO2-EOR project performance are scarce andsite-specific, and numerous methods are applied to project pro-duction curves of the CO2-EOR process. These methods include, inorder of both increasing complexity and data requirements, empir-ical models; semi-analytical models, such as the fractional flowmethod and CO2-Prophet; reservoir modeling, such as ECLIPSE,GEM/STARS, TOUGH2, et al. Without access to sufficient reservoirdata, a history-matched model and production data, the empiricalestimates and semi-analytical models are preferred because theyrequire relatively limited data and can provide reasonable preci-sion for quick assessment at large scale, such as national-scale. Sothe production curve of the well pattern is calculated using the frac-tional flow method presented in McCoy (2008) thesis. However, thefractional flow method misses many important mechanisms of theCO2-EOR process, such as miscible displacement, multiphase solu-bility, three-phase flow, oil viscosity reduction, rock–brine–oil–CO2interaction, and others. The fractional flow method can thereforeunderestimate the CO2 storage resource greatly and it is necessaryto apply additional criteria and methods to remedy the limita-tions of the fractional flow method, especially for the CO2 storageresource evaluation and site screening process. A hybrid perfor-mance model has therefore been developed based on a combinationof available site-screening criteria, fractional flow method and CO2resource evaluation method of CO2-EOR.
After reviewing current screening criteria for selecting candi-dates for CO2-EOR (Bachu, 2002; NETL, 2012; Shaw and Bachu,2002; Shen, 2010), we recommend the following criteria:
- Oil reservoir depth must be greater than 760 m and a reservoirtemperature less than 121 ◦C to reach CO2 minimum miscibilitypressure (MMP);
- Ideally the oil gravity should be greater than 27◦ API with an oilviscosity less than 20 centipoise (cp) at reservoir conditions touse miscible or near miscible displacement; and
- Residual oil saturation should be greater than 0.2 to allow moreoil fields to be assessed.
The suitable reservoirs, selected by these screening criteria, arethen processed for further assessment by fractional flow methodand CO2 resource evaluation method.
The incremental oil recovery of oil fields is expressed in terms ofthe production of original oil in place (OOIP) and overall recoveryefficiency (Goodman et al., 2011; McCoy and Rubin, 2008), whichis calculated by fractional flow method:
EOR = OOIP · Er (1)
OOIP = A · hn · ϕe · (1 − Swi) (2)
Er = Em · Ea · Ev · Ed (3)
Em, Ea, Ed, and Ev mainly follow the fractional flow and iterativemethod recommended by Claridge (1972) and McCoy and Rubin(2008); further details on this method and its implementation canbe found in McCoy (2008) thesis.
The oil production curve calculated by McCoy and Rubin (2008)method matches well with the curves determined by reservoirmodeling; however, this method always underestimates the ulti-mate CO2 storage resource without considering many importantmechanisms, such as, miscible displacement, CO2 solubility in oiland residual water. The CO2 storage resource in oil fields shouldbe assessed by additional method, such as, volumetric-based or

N. Wei et al. / International Journal of Greenhouse Gas Control 37 (2015) 170–181 173
Table 1Spreadsheet of the economic model including key parameters (see text for citations).
Items Equation for evaluation Cost unit
1. Capital cost1.1 Site characterization Csite = 30, 000 USD/km2 (6) USD/km2
1.2 Well pattern capital costCsub = Nwell,sub · a1 · ea2 or Csub = Nwell,sub · a1 · ea2
sub is the representative of IE, PE, lease and others cost components(7) USD/pattern
1.3 Workover cost CWO = Nwell,sub · (0.48 · CD&C + 0.50 · CPE) (8) USD/well1.4 Well drilling and completion capital cost CD&C = 1, 000, 000 · 0.1271 e0.0008z + 530.7 (9) USD/well1.5 Flow lines cost CFL = Nwell · 43, 600 · (7389/(280 · Nwell))
0.5 (10) USD1.6 Other cost for CO2-related equipment 10% of the total well pattern capital cost (11) USD
Amortized capital costCtotal = Csite + Clease + CIE + CPE + Cpattern + CD&C + CWO + CFL
Cannual = Ctotal · CRF and CRF = 1 − (1/(1 + r)T )/r(12) USD
2. Operation and maintenance cost (O&M) USD/a
2.1 O&M cost of well fields
O&Mdaily = Nwell · 7596
O&Mcons = Nwell · 20, 295
O&Msur = Nwell · 15420 · [(m/(280 × Nwell))0.5 + 5000]
O&Msubsur = Nwell · [5669 · (d/1219)]
(13) USD/a
2.2 CO2 compression cost Average cost is set as 13 USD/t CO2 for 1Bar CO2 and 1 USD/t for high pressureCO2 from pipeline terminal.
USD/t CO2
2.3 CO2 recycling cost Crecycling = 23.66 · Q (14) USD/t CO2
2.4 Purchased/new CO2 cost CCO2 × MCO2 (15) USD2.5 Fluid pumping 1 USD/STB for water and oil pumping in production well USD/STB2.6 Water compression 1 USD/m3 for WAG process regardless of difference pressure2.7 Monitoring and verification cost CM&V = 0.1 · MCO2 (16) USD
Total annual O&M cost O&Mtannual
= O&Mtdaily
+ O&Mtcons + O&Mt
sur + O&Mtsubsur
+ Ctrecycling
+ CtCO2
+ CtM&V
(17)USD/a
3. Revenue from crude oil sale Ctoil
= first purchase price of crude oil × annual oil production4. Annual tax for crude oil production Taxt
annualis calculated by tax model, which shown in Table3 (18) USD/bbl
Annual cost for CO2-EOR Costt = Ctannual
+ O&Mtannual
(19) USD
Net present value of the CO2-EOR NPV =∑T
t=1(Ct
oil− Costt − Taxt
annual)/(1 + r)t (20) USD
Net income or CO2 mitigation cost (USD/bbl orUSD/t CO2)
RLev = NPV/EOR or RLev = NPV/MCO2 (21) USD/t CO2 USD/bbl
Levelized cost CostLev =∑T
t=1Costt/MCO2 or CostLev =
∑T
t=1Costt/EOR (22)
production-based resource methods. If good production data areunavailable, volumetric-based CO2 storage resource may be pre-ferred (Goodman et al., 2011). The methods suggested by Bachuet al. (2004) were used to estimate CO2 storage resource for a seriesof assumed slug sizes (hydrocarbon pore volume, HCPV) under afive-spot WAG strategy. This method predicted the fraction of oilproduced, as well as the actual fraction of pore volumes of solventor CO2 injected at breakthrough and at any other fraction of HCPV.Assuming that 40% of the injected CO2 is recovered at the surfaceand re-injected into the reservoir (Dahowski and Bachu, 2007), theCO2 storage amount for any injected CO2 is calculated as Eqs. (4)and (5). The major coefficients are also calculated by McCoy andRubin (2006) method and McCoy (2008) thesis. The utilization rateis the net CO2 injection versus oil production (Roil/CO2
= EOR/MCO2 ).
at breakthrough (BT) : MCO2 = �CO2res · (Fi)BT · OOIP · B0 (4)
at any HCPV injection : MCO2
= �CO2res · [(Fi)BT + 0.6 · (Fi–(Fi)BT )] · OOIP · B0 (5)
2.3. Economic model for CO2-EOR
Cost models include amortized capital costs, operating andmaintenance costs, and other costs. There are many methods toassess CO2-EOR project costs, including, in order of increasing com-plexity and data requirement, empirical model, budget model, andfinal accounts. Investment decisions on CO2-flooding projects relyon budget models, which depend on project design and marketprice. However, without a detailed project design and market price,
the empirical model and statistics data are preferred for quick costassessments. An example of the economic model applied to one oilfield evaluated in this study is shown in Table 1. The major cost com-ponents comprising the economic evaluation will now be discussedfurther.
2.3.1. Capital costsThe capital cost of each project is estimated based on the
requirements of conversion of water flooding technology toCO2 flooding technology, including re-working of existing wells,field production equipment, CO2 processing equipment, pat-tern/injection/production equipment, and drilling and completion(D&C) costs of additional new wells. These capital costs are amor-tized over the lifecycle of the field by using the project discountrate (McCoy and Rubin, 2009).
Site characterization technologies include at minimum well log-ging and 3D seismic investigation. For oil fields that already haveseismic investigation data and well logging data, site characteri-zation cost will be significantly less. Although the costs for theseactivities are extremely diverse in China, it is reasonable to assumethe average cost for this study, as shown in Eq. (6) in Table 1.
Pattern equipment includes production-related equipment,such as rods, pumps, and wellheads; injection-related equipment,such as injection skids and wellheads; and lease equipment, such asmanifolds, pumps, separators, and compressors. Depleted oil fieldsmay need additional wells to reduce well spacing and improve pat-tern uniformity, besides optimizing the displacement profiles andeconomic benefits (Bock et al., 2003). The lease cost of well patternequipment, production equipment, and injection equipment is inpower or exponential form as Eq. (7). The regression coefficients, a1

174 N. Wei et al. / International Journal of Greenhouse Gas Control 37 (2015) 170–181
Table 2Associated regression coefficient estimates for capital cost categories of the model.
Region or country Drilling and completion equipment Production well Lease equipment Injection well equipment
Exponential Power Power Exponential
a1 a2 a1 a2 a1 a 2 a1 a2
China USD100,100 8.00 × 10⁻⁴ USD3200 9.75 × 10⁻¹ USD32,000 2.99 × 10⁻² USD29,000 2.81 × 10⁻⁴
and a2, for production/injection equipment and lease equipment inChina are shown in Table 2.
For wells that are already in place and require only a wellworkover, such as tubing and down-hole equipment replacement,which is prior to CO2-flooding, the cost is expressed as a fraction ofproduction/injection equipment cost, shown as Eq. (8) in Table 1,depending on whether the well is a producer or injector. The welldrilling and completion cost of new wells is shown in Eq. (9).
The costs associated with flow lines and connections to moveCO2 and any derivative hydrocarbon around the field were esti-mated using Eq. (10) given by Dahowski et al. (2012). The othercost for CO2-related equipment, such as the three-phase separator,manifolds, and brine pump, is assumed as a fraction of total wellpattern capital cost.
2.3.2. Operation and maintenance cost (O&M)Operation and maintenance cost of well fields includes the
normal daily expenses (O&Mtdaily
), consumables (O&Mtcons), surface
equipment maintenance (O&Mtsur), and subsurface maintenance
(O&Mtsubsur
), which are shown in Eq. (13). The equations are basedon McCollum and Ogden (2006) cost model for annual O&M,which include the same parameters. The costs associated withthe re-compression of CO2 recovered from production wells wereassessed using McCollum and Ogden (2006) method. This approachassumes a combination of five-stage compression and one-stagepumping for CO2 from the recycling process and one stage pumpingfor high-pressure CO2 from the terminals of the pipeline to afinal injection pressure (about 1.25–1.80 times the initial reservoirpressure). These equations form the basis for estimating CO2 com-pression costs, including capital cost and O&M cost on a levelizedUSD/t CO2 basis.
A cost estimate for CO2 compression from atmospheric pressureto injection pressure ranges from 7.20 to 19.50 USD/t CO2 in Chinabecause electricity rates vary greatly among industry sectors andregions (Dahowski et al., 2012). An average cost of 13 USD/t CO2is used for compressing recycled CO2, and an average compressioncost of 1.0 USD/t CO2 is used for compressing CO2 at pipeline out-lets to injection wellheads. The estimation of costs associated withwater pumping during WAG processing is much smaller than thatof CO2 compression; thus, the cost of water pumping was set as1.0 USD/m3 in this evaluation. The unit cost of lifting liquids to thesurface follows ARI estimates, which are 0.25 USD per stock tankbarrel (STB) of fluid for lifting (McCoy, 2008).
After CO2 breakthrough, the CO2 from the production well isthen purified and recycled with purchased CO2 into the injectionwells. Therefore, for a given well pattern, the total amount of pur-chased CO2 to the field is reduced over time. The recycling plantshould be sized to the maximum annual CO2 recycling rate of wellpattern or EOR phase, and annual O&M cost was assumed to be 16%of the capital costs (Dahowski et al., 2012). The resulting estimatesfor the recycling cost for CO2-EOR projects evaluated in this studyis shown in Eq. (14).
Under an assumption of sufficient CO2 from industrialprocessing and high-purity CO2 sources, the capture, compressionand transportation costs can reach in some instances as low as30 USD/t CO2, which is similar to or only moderately higher than theprice of 25–30 USD/t CO2 reported for recent CO2-EOR projects in
Songliao Basin of China (Shen, 2010). Therefore, it is reasonable toassume that the price of CO2 for CO2-EOR will generally range from30 USD/t to 70 USD/t, which is the maximum cost of CCS assessedby Dahowski et al. (2012). The lowest cost sources are CO2 sourcesfrom depleted gas fields and high-purity CO2 sources represent-ing a mix of small hydrogen, ammonia oxide, and coal chemicalfactories, and other high-purity CO2 sources (Li et al., 2011).
Monitoring and verification (M&V) requirements of CO2-EORprojects are still unclear, and the M&V technology suites employedat each project are highly site-specific. However, Benson et al.(2005) estimated the cost for an enhanced monitoring package at0.05–0.10 USD/t CO2. The enhanced package included all elementsof the basic package, in addition to periodic well logging, 3D seismicinvestigation, surface CO2 flux monitoring, and other monitoringtechnologies. This case has the highest cost and is most inclusiveof monitoring approaches assumed for the current analysis. There-fore, 0.10 USD/t CO2 was applied as a constant levelized M&V costfor commercial scale CO2-EOR projects.
2.3.3. Revenue from crude oil productionWith the annual oil production estimates, annual revenues can
be estimated. In the Annual Energy Outlook (AEO) 2013 referencecase, the Brent spot oil price increased from USD111 per barrel (in2011 dollars) in 2011 to USD163 per barrel in 2040 (EIA, 2012).However, the crude oil price drops dramatically for several rea-sons, so the low price 30 USD/bbl should be the low limitation forcrude oil price. To estimate the economics, 90 USD/bbl, which isaverage crude oil price between 2015 and 2040, at 2010 was usedas for deterministic analysis, and 30–150 USD/bbl, which reflectsthe price fluctuation of crude oil, for sensitivity analysis as the firstpurchase price without consideration of oil quality.
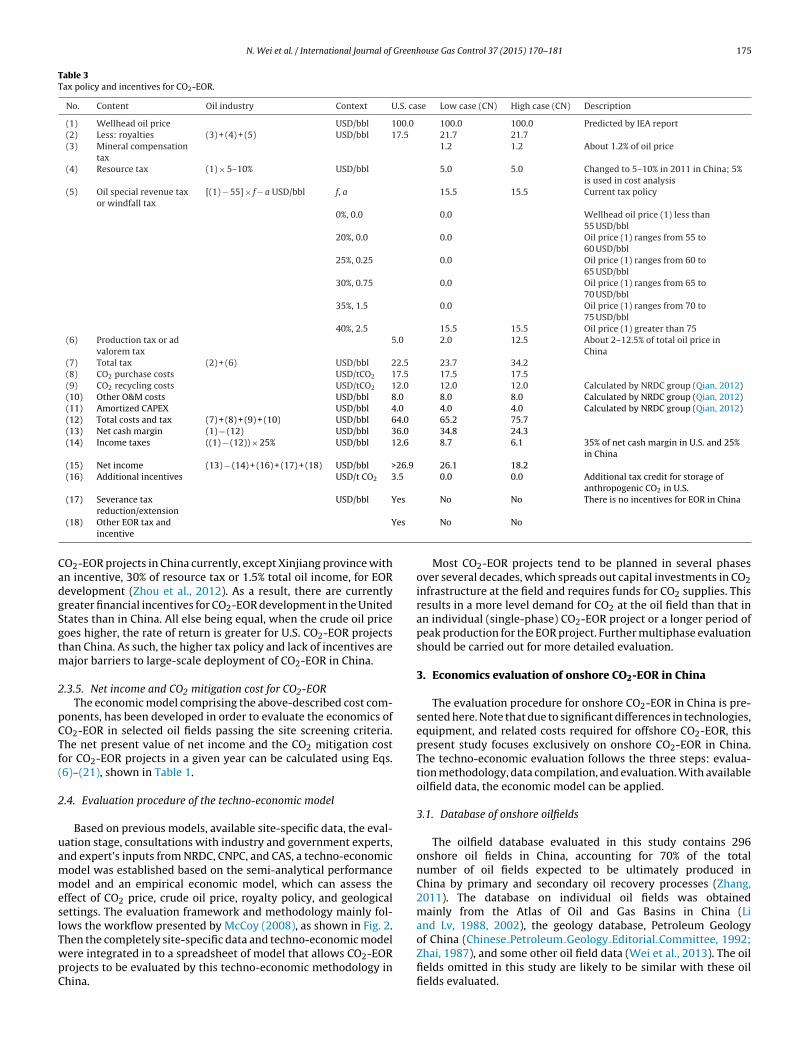
2.3.4. Tax for CO2-EORThe tax policy regarding crude oil in China is very complex
and tax rates are relatively high. Table 3 shows the overt hightax case and low tax case in China. The tax components includemining resource compensation fees, resource tax, oil special rev-enue tax (windfall tax), site investigation taxes, and income taxes(Wang, 2012; Zhou et al., 2012). Most enterprises pay the aver-age tax ratio in China, which ranges from 35 to 40% of total crudeoil incomes. The experts at the Natural Resources Defense Council(NRDC) provided the typical U.S. oil production taxes as an exam-ple in Table 3 for comparison (Qian, 2012). The basic tax scenariosin the United States incorporate royalties, 17.5%; production andad valorem taxes, 4%; and federal and state income taxes, 35%. Thetotal tax rate is about 22% of total crude oil incomes under a noincentive policy scenario.
However, the federal government in United States also enactedan additional tax credit for CO2 sequestration, providing USD10per ton for CO2 stored in the process of CO2-EOR by Section 45Qtax credit (Dooley et al., 2010), 15% tax-credit applies to all costsassociated with installing the CO2-flood, CO2 purchase cost, andCO2 operating costs for injection (NEORI, 2012). The federal govern-ment in U.S. also provides severance tax reduction and/or extensionof existing severance tax reduction for oil produced with CO2 fromanthropogenic sources (e.g., in North Dakota, Wyoming and Okla-homa) (ADB, 2014). There is no similar tax incentive policy for
N. Wei et al. / International Journal of Greenhouse Gas Control 37 (2015) 170–181 175
Table 3Tax policy and incentives for CO2-EOR.
No. Content Oil industry Context U.S. case Low case (CN) High case (CN) Description
(1) Wellhead oil price USD/bbl 100.0 100.0 100.0 Predicted by IEA report(2) Less: royalties (3) + (4) + (5) USD/bbl 17.5 21.7 21.7(3) Mineral compensation
tax1.2 1.2 About 1.2% of oil price
(4) Resource tax (1) × 5–10% USD/bbl 5.0 5.0 Changed to 5–10% in 2011 in China; 5%is used in cost analysis
(5) Oil special revenue taxor windfall tax
[(1) − 55] × f − a USD/bbl f, a 15.5 15.5 Current tax policy
0%, 0.0 0.0 Wellhead oil price (1) less than55 USD/bbl
20%, 0.0 0.0 Oil price (1) ranges from 55 to60 USD/bbl
25%, 0.25 0.0 Oil price (1) ranges from 60 to65 USD/bbl
30%, 0.75 0.0 Oil price (1) ranges from 65 to70 USD/bbl
35%, 1.5 0.0 Oil price (1) ranges from 70 to75 USD/bbl
40%, 2.5 15.5 15.5 Oil price (1) greater than 75(6) Production tax or ad
valorem tax5.0 2.0 12.5 About 2–12.5% of total oil price in
China(7) Total tax (2) + (6) USD/bbl 22.5 23.7 34.2(8) CO2 purchase costs USD/tCO2 17.5 17.5 17.5(9) CO2 recycling costs USD/tCO2 12.0 12.0 12.0 Calculated by NRDC group (Qian, 2012)(10) Other O&M costs USD/bbl 8.0 8.0 8.0 Calculated by NRDC group (Qian, 2012)(11) Amortized CAPEX USD/bbl 4.0 4.0 4.0 Calculated by NRDC group (Qian, 2012)(12) Total costs and tax (7) + (8) + (9) + (10) USD/bbl 64.0 65.2 75.7(13) Net cash margin (1) − (12) USD/bbl 36.0 34.8 24.3(14) Income taxes ((1) − (12)) × 25% USD/bbl 12.6 8.7 6.1 35% of net cash margin in U.S. and 25%
in China(15) Net income (13) − (14) + (16) + (17) + (18) USD/bbl >26.9 26.1 18.2(16) Additional incentives USD/t CO2 3.5 0.0 0.0 Additional tax credit for storage of
anthropogenic CO2 in U.S.(17) Severance tax
reduction/extensionUSD/bbl Yes No No There is no incentives for EOR in China
(18) Other EOR tax andincentive
Yes No No
CO2-EOR projects in China currently, except Xinjiang province withan incentive, 30% of resource tax or 1.5% total oil income, for EORdevelopment (Zhou et al., 2012). As a result, there are currentlygreater financial incentives for CO2-EOR development in the UnitedStates than in China. All else being equal, when the crude oil pricegoes higher, the rate of return is greater for U.S. CO2-EOR projectsthan China. As such, the higher tax policy and lack of incentives aremajor barriers to large-scale deployment of CO2-EOR in China.
2.3.5. Net income and CO2 mitigation cost for CO2-EORThe economic model comprising the above-described cost com-
ponents, has been developed in order to evaluate the economics ofCO2-EOR in selected oil fields passing the site screening criteria.The net present value of net income and the CO2 mitigation costfor CO2-EOR projects in a given year can be calculated using Eqs.(6)–(21), shown in Table 1.
2.4. Evaluation procedure of the techno-economic model
Based on previous models, available site-specific data, the eval-uation stage, consultations with industry and government experts,and expert’s inputs from NRDC, CNPC, and CAS, a techno-economicmodel was established based on the semi-analytical performancemodel and an empirical economic model, which can assess theeffect of CO2 price, crude oil price, royalty policy, and geologicalsettings. The evaluation framework and methodology mainly fol-lows the workflow presented by McCoy (2008), as shown in Fig. 2.Then the completely site-specific data and techno-economic modelwere integrated in to a spreadsheet of model that allows CO2-EORprojects to be evaluated by this techno-economic methodology inChina.
Most CO2-EOR projects tend to be planned in several phasesover several decades, which spreads out capital investments in CO2infrastructure at the field and requires funds for CO2 supplies. Thisresults in a more level demand for CO2 at the oil field than that inan individual (single-phase) CO2-EOR project or a longer period ofpeak production for the EOR project. Further multiphase evaluationshould be carried out for more detailed evaluation.
3. Economics evaluation of onshore CO2-EOR in China
The evaluation procedure for onshore CO2-EOR in China is pre-sented here. Note that due to significant differences in technologies,equipment, and related costs required for offshore CO2-EOR, thispresent study focuses exclusively on onshore CO2-EOR in China.The techno-economic evaluation follows the three steps: evalua-tion methodology, data compilation, and evaluation. With availableoilfield data, the economic model can be applied.
3.1. Database of onshore oilfields
The oilfield database evaluated in this study contains 296onshore oil fields in China, accounting for 70% of the totalnumber of oil fields expected to be ultimately produced inChina by primary and secondary oil recovery processes (Zhang,2011). The database on individual oil fields was obtainedmainly from the Atlas of Oil and Gas Basins in China (Liand Lv, 1988, 2002), the geology database, Petroleum Geologyof China (Chinese Petroleum Geology Editorial Committee, 1992;Zhai, 1987), and some other oil field data (Wei et al., 2013). The oilfields omitted in this study are likely to be similar with these oilfields evaluated.

176 N. Wei et al. / International Journal of Greenhouse Gas Control 37 (2015) 170–181
Fig. 2. Workflow for technical-economic evaluation of CO2-EOR patterns.
3.2. Basic features of onshore oil fields in China
These petroliferous provinces are polycyclic superimposed andcomposite basins, with complex traps of various origins and mega-structural oil-gas belts (Li, 1996; Liu, 2007). Most oil fields inChina belong to the river-deltaic sedimentary system with veryhigh historical tectonic activity. All formations exhibit appar-ent multi-cyclicity and fractures. Compared with marine depositbasins (the origin of many oilfields in the U.S. and elsewherein the world), sedimentary basins with continental facies exhibitunique characteristics of reservoirs and hydrocarbons, such ashigh heterogeneity, thin pay zone, high density of fractures,high viscosity, and high wax resin content (Zhang et al., 2011).Therefore, CO2-EOR activities in China face many technical chal-lenges, including miscible states, low sweep efficiency, low oilrecovery rate, and low CO2 storage efficiency (Zhao and Liao,2011).
Shen (2010) also stated that an average of only 20–40% of in situoil is recovered with primary or secondary production methodsin China, and suggest an average recovery of 33% can be usedfor national scale evaluation. Therefore, it was assumed that 35%of the original oil in place (OOIP) has been recovered prior tothe CO2-EOR process. For well patterns benefitting incrementaloil recovery slightly at the same CO2 injection rates (Evans andFischer, 2012), the five-spot pattern is assumed as the basic wellpattern in this evaluation. Well spacing, the distance betweenwells and the acreage they cover, shows a distribution range of22,500–122,500 m2/production well for most oil fields in China(Han et al., 1999). Given a certain oil block, well pattern type andwell spacing, the well pattern number and well number can becalculated for techno-economic evaluation.
Fig. 3. Net income of crude oil production changes with cumulative oil production.
3.3. Deterministic evaluation of CO2-EOR
CO2-EOR systems that have been presented apply to the fortyyears. In this study, an attempt is made to estimate costs in termsof what projects may face in China. The major parameters in theabove economic model of CO2-EOR projects, listed in Table 4, wereused for economic evaluation of onshore oil fields in China.
In the past, operators used small-volume CO2 injections (0.4–0.5HCPV) to maximize profitability. With higher oil prices, CO2-EOReconomics increasingly favor the use of considerably higher CO2volumes. Although the evolution toward this change is illustratedby oil production experience (IEA-GHG, 2000), the same 0.5 HCPV(including new and recycled CO2) as that reported by Dahowski

N. Wei et al. / International Journal of Greenhouse Gas Control 37 (2015) 170–181 177
-100
-80
-60
-40
-20
0
20
40
60
80
100
0 500 1000 1500 2000 2500 3000
CO
2M
itig
atio
n co
st (
USD
/bbl
)
Cumulative CO2 storage capacity (Mt)
Fig. 4. CO2 storage cost curve for onshore CO2-EOR projects in oil fields.
Table 4Major parameters for deterministic economic evaluation.
Project parameter Deterministic value
First purchase oil price (USD/STB) 90.0CO2 purchase price (USD/t) 50.0CO2 recycling costs (USD/t) 23.66Discount rate (%) 12Ratio of new wells to original wells (%) 15EOR project lifetime (year) 12CO2 injected (HCPV) 0.5Ratio of CO2 to water 1:1Closure cost (USD) 0Tax model Low case in Table 3Escalation factor 0
and Bachu (2007) was assumed to estimate incremental oil recov-ery and CO2 storage due to CO2-EOR for comparison of previousresearch and the present study. In addition, according to the hybridSWAG technologies, the ratio of CO2 to water is set as 1:1. Othercost coefficients are from cost parameter of feasibility study inSinopec report by Zhou et al. (2012), and revised by consultantsfrom National Petroleum Corporation (CNPC).
3.3.1. Net oil recovery cost and CO2 storage costsAfter site suitability screening by multi-criteria method, there
are 165 out of 296 onshore oil fields remain as priorities forfurther techno-economic evaluation. The economics of potentialCO2-EOR projects in onshore oil fields were assessed by the eco-nomic method described in Table 1 under the low tax policy case ofTable 3. The net income of crude oil production changes with cumu-lative oil production as shown in Fig. 3. The cost effective amountof incremental oil production is about 1.1 billion tons (7.7 billionbarrels). The net income of oil production ranges from 25 USD/tto 0 USD/t. The economic amount of CO2 stored in the oil reser-voirs is approximately about 2.2 billion tons, as shown in Fig. 4.The net CO2 storage costs range from −100 USD/t to higher than0 USD/t. Prospects on the low end of this range are mostly oil fieldswith promising oil recovery rates, low oil viscosity, thick payzone,high residue oil saturation, and other favorable characteristics. Con-versely, the high cost end of the curve includes small and deep fieldswith thin pay zones, low residue oil saturation, low-recovery rates,and very high CO2 cost and recycling costs.
Overall, the deterministic results show a great potential fordeploying CO2-EOR projects in onshore oil fields in China; the netincome distribution of these projects is shown in Fig. 5. Under
Fig. 5. Distribution of net income for onshore CO2-EOR projects.

178 N. Wei et al. / International Journal of Greenhouse Gas Control 37 (2015) 170–181
-60
-40
-20
0
20
40
60
(USD/bbl) (USD/bbl) (USD/bbl) (USD/bbl) (USD/tone)
Total Cost Gross Income Royalties Net Income CO2 Mitigation Cost
Cos
t or
Rev
enue
Components of Economic Evaluation
Daqing OilfieldGaosheng OilfieldZhaoyuan OilfieldTahe Oilfield
Fig. 6. Cost distribution for typical oil fields with low tax policy by deterministicanalysis.
the method and assumptions employed in this evaluation, manyCO2-EOR projects appear technically and economically feasiblein oil fields throughout China. These oil fields include Daqing,Zhongyuan, Jianghan, Kelamayi, Liaohe, Jilin, Jiangsu, Dagang, andYumen oil fields, among others.
3.3.2. Cost distribution for case studyFig. 6 shows the royalties and cost distribution for four example
oil fields with low tax policy. The four examples were selected torepresent different sedimentary basins, and having the potential todeploy large-scale CO2-EOR projects, with each having proved OOIPgreater than 700 million barrels and exhibiting some of the highestestimated net CO2-EOR incomes. These oil fields have the potentialto deploy large-scale CO2-EOR projects. The results show the cost,accounting for the largest part of the CO2-EOR project, in additionto the royalties and income, accounting for the smallest part of theCO2-EOR process. The main factors which may negatively impactthe benefits of EOR projects are low recovery rate, the high cost ofCO2-EOR projects, and high tax policy in China.
Complex properties of reservoir, which are characteristic of EORprojects on the low end of this range, include thin pay-zone, deepreservoir, low residual oil saturation, high viscosity of crude oil, andlow permeability. The complex properties of oil reservoirs increasecost by requiring more well-reworking, underground equipment,and surface equipment to inject CO2 and produce crude oil. Thesecomplexities also result in lower oil recovery rates by WAG tech-nologies. The very high tax rate certainly decreases the net incomeof enterprises dramatically as well as the motivation of enterprisesto carry out CO2-EOR projects in China.
Many CO2-EOR projects show early opportunities for CO2-EORdeployment, which is very important for diffusion and scaling-upof CO2-EOR projects. The cost distribution also provides us withsome way to solve the net income problem of CO2-EOR projects:i.e. how can tax policies and new technologies make the economicsof CO2-EOR more attractive.
3.4. Sensitivity evaluation of CO2-EOR
The economic oil recovery and storage potential for CO2-EORcan be affected significantly by differences in CO2 and oil prices andtax policy (NETL, 2012). Sensitivity analyses have been conductedfor the scenario where the oil price and CO2 price for enhanced oilrecovery are varied.
The sensitivity study shows that the cumulative economic oilproduction and related cumulative CO2 storage resource are verysensitive to the crude oil price. The cumulative amount of incre-mental oil production varies between 0.3 and 1.1 billion tons withnet income ranging from 35 USD/bbl to 0 USD/bbl, for the various oilprices (shown in Fig. 7). The amount of CO2 stored in the oil reser-voirs varies between 0.6 and 2.4 billion tons with incomes from CO2mitigation, for the various oil prices (shown in Fig. 8).
-50
-40
-30
-20
-10
0
10
20
30
40
0 200 400 600 800 1000 1200
Net
Inc
ome
(USD
/bbl
)
Cumulative Oil Production (Mt)
30USD/bbl
60USD/bbl
90USD/bbl
120USD/bbl150USD/bbl
Fig. 7. Net income changes with cumulative oil production and crude oil price foronshore CO2-EOR in China.
-200
-160
-120
-80
-40
0
40
80
0 500 1000 1500 2000 2500
Mit
igat
ion
cost
(U
SD/b
bl)
Cumulative CO2 storage capacity (Mt)
30USD/bbl
60USD/bbl
90USD/bbl
120USD/bbl
150USD/bbl
Fig. 8. Mitigation cost changes with cumulative CO2 storage resource and crude oilprice.
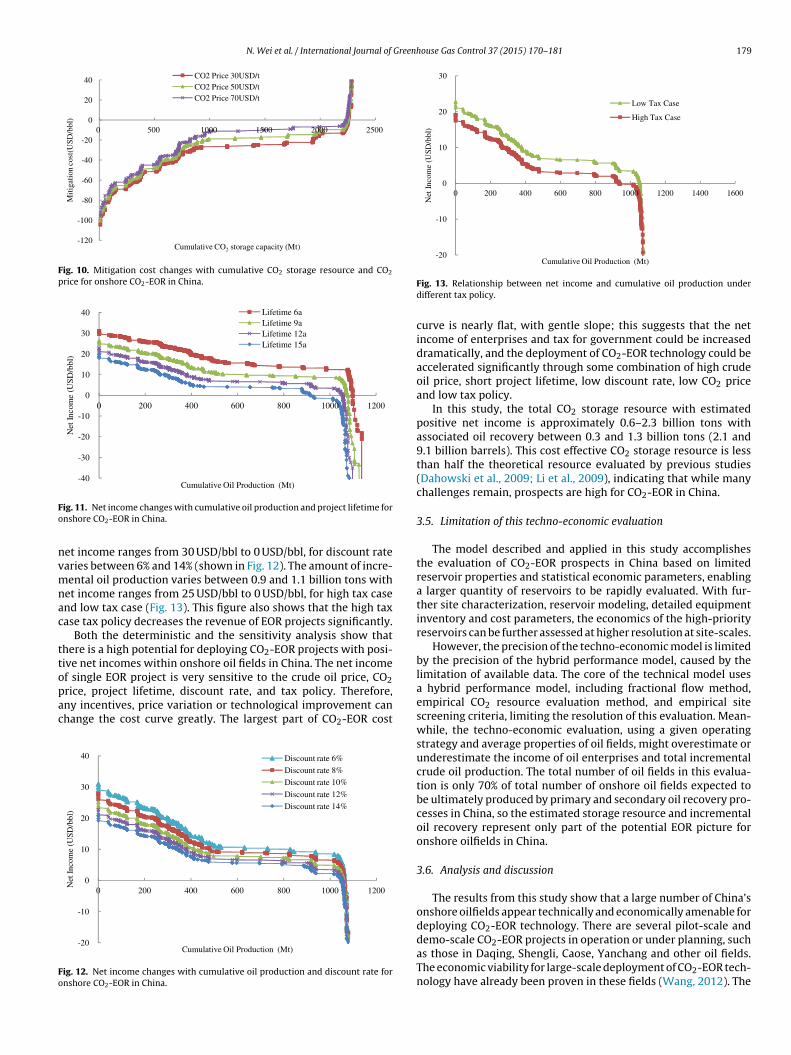
The sensitivity study shows that the cumulative economic oilproduction and cumulative economic CO2 storage resource are alsosensitive to the CO2 price. The cumulative amount of incremen-tal oil production varies between 1.0 and 1.1 billion tons with netincome ranges from 25 USD/bbl to 0 USD/bbl, for CO2 prices variesbetween 30 USD/t and 70 USD/t (shown in Fig. 9). The cumulativeamount of CO2 stored in the oil reservoirs varies between 2.2 and2.3 billion tons with CO2 mitigation cost from−110 USD/t to 0 USD/t(shown in Fig. 10).
The sensitivity study shows that the cumulative economic oilproduction is also sensitive to project lifetime, discount rate andtax policy. The cumulative amount of incremental oil productionvaries between 0.9 and 1.1 billion tons with net income ranges from30 USD/bbl to 0 USD/bbl, for project lifetime varies between 6 yearsand 15 years (shown in Fig. 11). The cumulative amount of incre-mental oil production varies between 1.0 and 1.1 billion tons with
-20
-15
-10
-5
0
5
10
15
20
25
30
0 200 400 600 800 1000 1200
Net
Inco
me
(USD
/bbl
)
Cumulative Oil Production (Mt)
CO2 Price 30USD/t
CO2 Price 50USD/t
CO2 Price 70USD/t
Fig. 9. Net income changes with cumulative oil production and CO2 price foronshore CO2-EOR in China.
N. Wei et al. / International Journal of Greenhouse Gas Control 37 (2015) 170–181 179
-120
-100
-80
-60
-40
-20
0
20
40
0 500 1000 1500 2000 2500
Mit
igat
ion
cost
(USD
/bbl
)
Cumulative CO2 storage capacity (Mt)
CO2 Price 30USD/t CO2 Price 50USD/t CO2 Price 70USD/t
Fig. 10. Mitigation cost changes with cumulative CO2 storage resource and CO2
price for onshore CO2-EOR in China.
-40
-30
-20
-10
0
10
20
30
40
0 200 400 600 800 1000 1200
Net
Inco
me
(USD
/bbl
)
Cumulative Oil Production (Mt)
Lifetime 6aLifetime 9aLifetime 12aLifetime 15a
Fig. 11. Net income changes with cumulative oil production and project lifetime foronshore CO2-EOR in China.
net income ranges from 30 USD/bbl to 0 USD/bbl, for discount ratevaries between 6% and 14% (shown in Fig. 12). The amount of incre-mental oil production varies between 0.9 and 1.1 billion tons withnet income ranges from 25 USD/bbl to 0 USD/bbl, for high tax caseand low tax case (Fig. 13). This figure also shows that the high taxcase tax policy decreases the revenue of EOR projects significantly.
Both the deterministic and the sensitivity analysis show thatthere is a high potential for deploying CO2-EOR projects with posi-tive net incomes within onshore oil fields in China. The net incomeof single EOR project is very sensitive to the crude oil price, CO2price, project lifetime, discount rate, and tax policy. Therefore,any incentives, price variation or technological improvement canchange the cost curve greatly. The largest part of CO2-EOR cost
-20
-10
0
10
20
30
40
0 200 400 600 800 1000 1200
Net
Inco
me
(USD
/bbl
)
Cumulative Oil Production (Mt)
Discount rate 6%
Discount rate 8%
Discount rate 10%
Discount rate 12%
Discount rate 14%
Fig. 12. Net income changes with cumulative oil production and discount rate foronshore CO2-EOR in China.
-20
-10
0
10
20
30
0 200 400 600 800 1000 1200 1400 1600
Net
Inco
me
(USD
/bbl
)
Cumulative Oil Production (Mt)
Low Tax Case
High Tax Case
Fig. 13. Relationship between net income and cumulative oil production underdifferent tax policy.
curve is nearly flat, with gentle slope; this suggests that the netincome of enterprises and tax for government could be increaseddramatically, and the deployment of CO2-EOR technology could beaccelerated significantly through some combination of high crudeoil price, short project lifetime, low discount rate, low CO2 priceand low tax policy.
In this study, the total CO2 storage resource with estimatedpositive net income is approximately 0.6–2.3 billion tons withassociated oil recovery between 0.3 and 1.3 billion tons (2.1 and9.1 billion barrels). This cost effective CO2 storage resource is lessthan half the theoretical resource evaluated by previous studies(Dahowski et al., 2009; Li et al., 2009), indicating that while manychallenges remain, prospects are high for CO2-EOR in China.
3.5. Limitation of this techno-economic evaluation
The model described and applied in this study accomplishesthe evaluation of CO2-EOR prospects in China based on limitedreservoir properties and statistical economic parameters, enablinga larger quantity of reservoirs to be rapidly evaluated. With fur-ther site characterization, reservoir modeling, detailed equipmentinventory and cost parameters, the economics of the high-priorityreservoirs can be further assessed at higher resolution at site-scales.
However, the precision of the techno-economic model is limitedby the precision of the hybrid performance model, caused by thelimitation of available data. The core of the technical model usesa hybrid performance model, including fractional flow method,empirical CO2 resource evaluation method, and empirical sitescreening criteria, limiting the resolution of this evaluation. Mean-while, the techno-economic evaluation, using a given operatingstrategy and average properties of oil fields, might overestimate orunderestimate the income of oil enterprises and total incrementalcrude oil production. The total number of oil fields in this evalua-tion is only 70% of total number of onshore oil fields expected tobe ultimately produced by primary and secondary oil recovery pro-cesses in China, so the estimated storage resource and incrementaloil recovery represent only part of the potential EOR picture foronshore oilfields in China.
3.6. Analysis and discussion
The results from this study show that a large number of China’sonshore oilfields appear technically and economically amenable fordeploying CO2-EOR technology. There are several pilot-scale anddemo-scale CO2-EOR projects in operation or under planning, suchas those in Daqing, Shengli, Caose, Yanchang and other oil fields.The economic viability for large-scale deployment of CO2-EOR tech-nology have already been proven in these fields (Wang, 2012). The
180 N. Wei et al. / International Journal of Greenhouse Gas Control 37 (2015) 170–181
question is why the CO2-EOR technology has not been more widelyapplied in China. Our investigation reconfirms that the major bar-riers to large-scale deployment of CO2-EOR in China are basicallycost related:
1) The high cost and non-availability of adequate volumes of CO2near suitable oil fields is a major barrier to large-scale CO2-EORdeployment (Zhao and Liao, 2011). There is a need for lower-ing CO2 prices and having low-cost CO2 pipeline transportationinfrastructure.
2) The high total costs of CO2-EOR projects can be addressedthrough refining technologies and practices geared toward thechallenging characteristics of Chinese oilfields. The economicaspect of CO2-EOR technologies can be improved by offering alower recycling ratio, higher sweep-efficient CO2-EOR technolo-gies, higher recovery ratio of OOIP and CO2 storage with moreincentives (Enick and Olsen, 2011; Kuuskraa et al., 2011).
3) The high capital investment in the early phase of a CO2-EOR project presents another main barrier. CO2-EOR is highlydependent on capital investment in the early phases of a CO2-EOR project. Financial incentives and support, such as taxreduction, low-interest loans, and grants, are important to helpscale up CO2-EOR projects. Because the internal rate returns areset as 13% in SINOPEC, such support is even necessary for thoseoil fields with high net income potential.
4. Conclusion
Evaluation of the resource and cost potential of CO2-EOR is anessential step before the commencement of large-scale deploymentof such activities. In this study, a techno-economic method with ahybrid performance model and a statistical cost model has beendeveloped based on a previous techno-economic model for CO2-EOR projects and consultation from experts. 296 onshore oilfieldsin China were evaluated using our technical-economic model witha given operational strategy. The preliminary results are indicatedas follows:
1) Our deterministic analysis shows that approximately 1.1 bil-lion tons (7.7 billion barrels) of incremental crude oil can bepotentially recovered through CO2-EOR from China’s availableoilfields under the modeled given operating strategy and eco-nomic assumptions. The corresponding CO2 storage resourcecould reach 2.2 billion tons.
2) Sensitivity studies show that the cumulative oil production,cumulative CO2 storage resource, and net income of enterprisesare very sensitive to crude oil prices, CO2 costs and tax policy.Higher prices of crude oil, lower prices of CO2, and lower taxrates can greatly increase the total crude oil recovery potential,along with CO2 storage resource and net income for enterprises.The cumulative cost effective oil production varied between 0.3and 1.3 billion tons (2.1 and 9.1 billion barrels) and correspond-ing CO2 storage resource varied between 0.6 and 2.3 billiontons under varying crude oil price, project lifetimes, discountrates, CO2 prices, and tax ratio. High oil price, short project life-time, low discount rate, low CO2 cost, and low tax policy cangreatly increase the net income of EOR processes and encourageenterprises to deploy CO2-EOR projects; consequently, this willincrease the incremental oil recovery and CO2 storage resourceduring CO2-EOR process.
3) The main factors negatively impacting the economics of onshoreCO2-EOR include complex geological properties, high viscosityof crude oil, high royalty rates, technology limitations, and thelack of incentives for CO2-EOR projects.
This research provides an improved overview of the techno-economic potential of onshore CO2-EOR in China and answers someinitial techno-economic questions regarding the future of large-scale deployment of onshore CO2-EOR projects. Further researchshould be carried out to refine the work and related findings.
Acknowledgements
The authors gratefully acknowledge the financial support to thisstudy by the Chinese Academy of Sciences through its Strategic Pri-ority Research Program (Grant no. XDA07040300: Demonstration ofKey Technologies for Clean and Efficient Utilization of Low-Rank Coal,Research and Demonstration on Key Technologies of CO2 GeologicalStorage) and by the Energy Foundation China (Grant no. G-1211-17275: Economic Evaluation on CO2-EOR Deployment in China), aswell as the collaborative project between the Chinese Academyof Science, Pacific Northwest National Laboratory, and NationalEnergy Technology Laboratory under the framework of US–ChinaFossil Energy Protocol, Annex VI-Advanced Coal-Based Energy Sys-tems Research. We also kindly acknowledge the assistance andencouragement from the Natural Resources Defense Council, aswell as the reviewers for their thoughtful and helpful comments.
References
ADB, 2014. Promoting Early Stage Commercial-Scale Carbon Capture, Utilizationand Storage Demonstration Projects in People’s Republic China Through CO2-Ehanced Oil Recovery. Asian Development Bank.
Al Adasani, A., Bai, B., 2011. Analysis of EOR projects and updated screening criteria.J. Pet. Sci. Eng. 79, 10–24.
Bachu, S., 2002. Sequestration of CO2 in geological media in response to climatechange: road map for site selection using the transform of the geological spaceinto the CO2 phase space. Energy Convers. Manag. 43, 87–102.
Bachu, S., Shaw, J.C., Pearson, R.M., 2004. Estimation of Oil Recovery and CO2
Storage Capacity in CO2-EOR Incorporating the Effect of Underlying Aquifers,Symposium on Improved Oil Recovery. Society of Petroleum Engineers, Tulsa,Oklahoma, pp. 1–13.
Benson, S.M., Hoversten, M., Gasperikova, E., Haines, M., Rubin, E.S., Keith, D.W.,Gilboy, C.F., Wilson, M., Morris, T., Gale, J., Thambimuthu, K., 2005. Moni-toring Protocols and Life-Cycle Costs for Geologic Storage of Carbon Dioxide,Greenhouse Gas Control Technologies, vol. 7. Elsevier Science Ltd., Oxford, pp.1259–1264.
Bock, B., Rhudy, R., Herzog, H., Klett, M., Davison, J., Ugarte, D.G.D.L.T., Simbeck, D.,2003. Economic Evaluation of CO2 Storage and Sink Enhancement Options. TVAPublic Power Institute, Washington, DC, pp. 462.
Chinese Petroleum Geology Editorial Committee, 1992. Petroleum Geology ofChina. Chinese Petroleum Industry Press, Beijing.
Christensen, J.R., Stenby, E.H., Skauge, A., 2001. Review of WAG field experience. SPEReserv. Eval. Eng. 4, 97–106.
Claridge, E.L., 1972. Prediction of recovery in unstable miscible flooding. SPE J. 12,143–155.
Dahowski, R., Bachu, S., 2007. Assessing the Effect of Timing of Availability for CarbonDioxide Storage in the Largest Oil and Gas Pools in the Alberta Basin: Descrip-tion of Data and Methodology. Pacific Northwest National Laboratory, Richland,Washington, DC, pp. 99352.
Dahowski, R., Dooley, J., Davidson, C., Bachu, S., Gupta, N., 2005. Building the CostCurves for CO2 Storage. IEA Greenhouse Gas R&D Programme, North America.
Dahowski, R., Li, X., Davidson, C., Wei, N., Dooley, J., Gentile, R., 2009. A preliminarycost curve assessment of carbon dioxide capture and storage potential in China.Energy Procedia 1, 2849–2856.
Dahowski, R.T., Davidson, C.L., Li, X.C., Wei, N., 2012. A $70/tCO2 greenhouse gasmitigation backstop for China’s industrial and electric power sectors: insightsfrom a comprehensive CCS cost curve. Int. J. Greenh. Gas Control 11, 73–85.
Davidson, C.L., Dahowski, R.T., Dooley, J.J., 2011. A quantitative comparison of thecost of employing EOR-coupled CCS supplemented with secondary DSF storagefor two large CO2 point sources. Energy Procedia 4, 2361–2368.
Dooley, J.J., Robert, T.D., Casie, L.D., 2010. CO2-Driven Enhanced Oil Recovery as aStepping Stone to What? Pacific Northwest National Laboratory, P.O. Box 62,Oak Ridge, pp. 32.
EIA, 2012. Annual Energy Outlook 2013 Early Release Overview. U.S. Energy Infor-mation Administration.
Enick, R.M., Olsen, D.K., 2011. Mobility and Conformance Control for Carbon DioxideEnhanced Oil Recovery (CO2-EOR) via Thickeners Foams, and Gels – A DetailedLiterature Review of 40 Years of Research. National Energy Technology Labora-tory.
Evans, M.A., Fischer, M.P., 2012. On the distribution of fluids in folds: a review ofcontrolling factors and processes. J. Struct. Geol. 44, 2–24.

N. Wei et al. / International Journal of Greenhouse Gas Control 37 (2015) 170–181 181
Godec, M., Kuuskraa, V., Van Leeuwen, T., Stephen Melzer, L., Wildgust, N., 2011.CO2 storage in depleted oil fields: the worldwide potential for carbon dioxideenhanced oil recovery. Energy Procedia 4, 2162–2169.
Goodman, A., Hakala, A., Bromhal, G., Deel, D., Rodosta, T., Frailey, S., Small, M., Allen,D., Romanov, V., Fazio, J., Huerta, N., McIntyre, D., Kutchko, B., Guthrie, G., 2011.U.S. DOE methodology for the development of geologic storage potential forcarbon dioxide at the national and regional scale. Int. J. Greenh. Gas Control 5,952–965.
Hall, K.A., 2012. An Analysis of the Distribution and Economics of Oil Fields forEnhanced Oil Recovery-Carbon Capture and Storage, Earth and Ocean Sciences.Duke University.
Han, D.-K., Yang, C.-Z., Zhang, Z.-Q., Lou, Z.-H., Chang, Y.-I., 1999. Recent developmentof enhanced oil recovery in China. J. Pet. Sci. Eng. 22, 181–188.
Holt, T., Lindeberg, E., Vassenden, F., Wessel-Berg, D., 2005. A large-scale infrastruc-ture model for CO2 disposal and EOR: economic and capacity potential in theNorth Sea. In: Rubin, E.S., Keith, D.W., Gilboy, C.F., Wilson, M., Morris, T., Gale, J.,ThambimuthuA2, D.W.K.C.F.G.M.W.T.M.J.G., Rubin, E.S., Thambimuthu, K. (Eds.),Greenhouse Gas Control Technologies, vol. 7. Elsevier Science Ltd., Oxford, pp.391–399.
Holt, T., Lindeberg, E., Wessel-Berg, D., 2009. EOR and CO2 disposal – economic andcapacity potential in the North Sea. Energy Procedia 1, 4159–4166.
Holtz, M.H., Nance, P.K., Finley, R.J., 1999. Reduction of Greenhouse Gas Emissionsthrough Underground CO2 Sequestration in Texas Oil and Gas Reservoirs, FinalReport Prepared for the Electrical Power Research Institute (EPRI). The Univer-sity of Texas at Austin, Bureau of Economic Geology.
Holtz, M.H., Nance, P.K., Finley, R.J., 2001. Reduction of greenhouse gas emissionsthrough CO2 EOR in Texas. Environ. Geosci. 8, 187–199.
IEA-GHG, 2000. Barriers to Overcome in Implementation of CO2 Capture and Storage(1). Storage in Disused Oil and Gas Fields. International Energy Agency Green-house Gas R&D Programme, Cheltenham.
Jing, L., 2003. A review of techniques, advances and outstanding issues in numericalmodelling for rock mechanics and rock engineering. Int. J. Rock Mech. Min. Sci.40, 283–353.
Khorshidi, Z., Soltanieh, M., Saboohi, Y., Arab, M., 2011. Economic feasibility of CO2
capture from oxy-fuel power plants considering enhanced oil recovery revenues.Energy Procedia 4, 1886–1892.
King, C., Coleman, S., Cohen, S., Gülen, G., 2011. The economics of an integrated CO2
capture and sequestration system: Texas Gulf Coast case study. Energy Procedia4, 2588–2595.
Klins, M., 1984. CO2 – heavy oil flooding – economic design. In: Okandan, E. (Ed.),Heavy Crude Oil Recovery. Springer, Netherlands, pp. 211–272.
Kuuskraa, V., Ferguson, R., Leeuwen, T.V., 2009. In: Nichols, C. (Ed.), Storing CO2 WithNext-Generation CO2-EOR Technology. National Energy Technology Laboratory,Pittsburgh, PA, USA.
Kuuskraa, V., Leewen, T.V., Wallace, M., 2011. Improving Domestic Energy Securityand Lowering CO2 Emissions with Next Generation CO2-Enhanced Oil Recovery(CO2-EOR). National Energy Technology Laboratory, Pittsburgh, PA, USA.
Li, D., 1996. Basic characteristics of oil and gas basins in China. J. Southeast AsianEarth Sci. 13, 299–304.
Li, G., Lv, M., 1988. Atlas of Oil and Gas Basins in China, 1st ed. Petroleum IndustryPress, Beijing.
Li, G., Lv, M., 2002. Atlas of Oil and Gas Basins in China, 2nd ed. Petroleum IndustryPress, Beijing.
Li, X., Wei, N., Fang, Z., Li, Q., Dahowski, R., Davidson, C., 2011. Early opportunities ofcarbon capture and storage in China. Energy Procedia 4, 6029–6036.
Li, X., Wei, N., Liu, Y., Fang, Z., Dahowski, R.T., Davidson, C.L., 2009. CO2 point emissionand geological storage capacity in China. Energy Procedia 1, 2793–2800.
Liang, Z., Shu, W., Li, Z., Shaoran, R., Qing, G., 2009. Assessment of CO2-EOR andits geo-storage potential in mature oil reservoirs, Shengli Oilfield, China. Pet.Explor. Dev. 36, 737–742.
Liu, G., 2007. Geodynamical evolution and tectonic framework of China. Earth Sci.Front. 14, 39–46.
McCollum, D.L., Ogden, J.M., 2006. Techno-Economic Models for Carbon DioxideCompression, Transport, and Storage and Correlations for Estimating CarbonDioxide Density and Viscosity. Institute of Transportation Studies, Davis, CA,USA, pp. 9561.
McCoy, S.T., 2008. The Economics of Carbon Dioxide Transport by Pipeline and Stor-age in Saline Aquifers and Oil Reservoirs Energy. Carnegie Mellon University.
McCoy, S.T., Rubin, E.S., 2006. A model of CO2-flood enhanced oil recovery withapplications to oil price influence on CO2 storage costs. In: Proceedings of 8thInternational Conference on Greenhouse Gas Control Technologies (GHGT-8),Trondheim, Norway, June 2006.
McCoy, S.T., Rubin, E.S., 2008. An engineering-economic model of pipeline transportof CO2 with application to carbon capture and storage. Int. J. Greenh. Gas Control2, 219–229.
McCoy, S.T., Rubin, E.S., 2009. The effect of high oil prices on EOR project economics.Energy Procedia 1, 4143–4150.
NEORI, 2012. Carbon Dioxide Enhanced Oil Recovery: A Critical Domestic Energy,Economic, and Environmental Opportunity. National Enhanced Oil RecoveryInitiative, USA.
NETL, 2012. Carbon Dioxide Enhanced Oil Recovery: Untapped Domestic EnergySupply and Long Term Carbon Storage Solution. National Energy TechnologyLaboratory, Pittsburgh, PA, USA.
Qian, J., 2012. Methodology for Estimating CO2-EOR Production and Value Creationover Time.
Rubin, E.S., Short, C., Booras, G., Davison, J., Ekstrom, C., Matuszewski, M., McCoy, S.,2013. A proposed methodology for CO2 capture and storage cost estimates. Int.J. Greenh. Gas Control 17, 488–503.
Shaw, J., Bachu, S., 2002. Screening, evaluation, and ranking of oil reservoirs suitablefor CO2-flood EOR and carbon dioxide sequestration. J. Can. Pet. Technol. 41,51–61.
Shen, P., 2010. Enhanced Oil Recovery, Storage and Utilization of Greenhouse Gas.National Basic Research of China, 973 Program.
Shen, P., Liao, X., Liu, Q., 2009. Methodology for estimation of CO2 storage capacityin reservoirs. Pet. Explor. Dev. 36, 216–220.
van Bergen, F., Gale, J., Damen, K.J., Wildenborg, A.F.B., 2004. Worldwide selection ofearly opportunities for CO2-enhanced oil recovery and CO2-enhanced coal bedmethane production. Energy 29, 1611–1621.
Wang, Y., 2012. Research on the Tax and Fee System Reform of Oil and Gas Resourcesof China. Northeast Petroleum University, Daqing.
Wei, N., Li, X., Wang, Y., Dahowski, R.T., Davidson, C.L., Bromhal, G.S., 2013.A preliminary sub-basin scale evaluation framework of site suitability foronshore aquifer-based CO2 storage in China. Int. J. Greenh. Gas Control 12,231–246.
Zhai, G., 1987. Petroleum of Geology of China. Petroleum Industry Press, Beijing.Zhang, D., 2011. CO2 flooding enhanced oil recovery technique and its application
status. Sci. Technol. Rev. 29, 75–79.Zhang, K., 2012. Strategic replacement situation and outlook of China oil-gas pro-
duction area. Pet. Explor. Dev. 39, 547–559.Zhang, L., Ren, S., Ren, B., Zhang, W., Guo, Q., Zhang, L., 2011. Assessment of CO2 stor-
age capacity in oil reservoirs associated with large lateral/underlying aquifers:case studies from China. Int. J. Greenh. Gas Control 5, 1016–1021.
Zhao, H., Liao, X., 2011. key problems analysis on CO2 displacement and geologicalstorage in low permeability oil reservoir, China. J. Shaanxi Univ. Sci. Technol. 29,1–6.
Zhou, H., Liu, Y., Liu, L., Zhang, X., Chen, B., Zhang, J., Lu, J., Zhang, J., 2012. Parameterand Data 2012 – Sinopec Project Feasibility Study Technical Economy. Economicand Technology Research Institute, CNPC, Beijing, pp. 80–92.