international journal of civil engineering …iaeme.com/masteradmin/uploadfolder/experience on using...
TRANSCRIPT

International Journal of Civil Engineering and Technology (IJCIET), ISSN 0976 – 6308
(Print), ISSN 0976 – 6316(Online) Volume 4, Issue 3, May - June (2013), © IAEME
155
EXPERIENCE ON USING TOTAL STATION SURVEYING FOR
MAPPING AND CONTOURING
RASHEED SALEEM ABED
Remote sensing Center, University of Mosul, Iraq
ABSTRACT
Total station is a valuable source of surveying data. Yet, in large prpjects, its usage
can be cumbersome, slow and prone to errors unless well designed procedures are followed.
This paper documents the experience gained while doing planimetric and contour surveying
using total station with reflectors. The management of field and respective office work to
obtain easy, quick and more accurate results is described. Special concern is given to places
of limited access and safety issues. The order to perform various tasks is important.
Nomination of target points, creating data files, and the way various aspects of data
collection, feeding, and processing treated is explained with the example of a major
surveying work performed at the main campus of the university of Mosul.
Keywords: Total Station, Surveying, Error Reduction, Contouring.
I. INTRODUCTION
The main campus of the university of Mosul (Iraq) located in the north eastern part of
the city extends over an area of 1.5 km X 2.5 km. There are various degrees of irregularity in
topography including flat, hilly and steep slope areas. It contains spots of water ponds, drains,
marshes, canopy, open spaces, dense and scattered buildings and network of roads.
During the past few years, the campus have seen major developments which came in
two aspects. First, additional large open area have been added northwise to the main campus
presently known as the college of agriculture. The second face of development is the major
expansion in construction activities of new buildings, roads and services which are going on
at various parts of the university area including the old site. The new open areas lack much of
detailed and accurate planimetric and elevation maps. Moreover, even in the available old
campus maps, errors in locations have been noticed at many places which amounts to tens of
meters in horizontal extents.(Figure 1). Accurate heights are also not available.
INTERNATIONAL JOURNAL OF CIVIL ENGINEERING AND
TECHNOLOGY (IJCIET)
ISSN 0976 – 6308 (Print)
ISSN 0976 – 6316(Online)
Volume 4, Issue 3, May - June (2013), pp. 155-167
© IAEME: www.iaeme.com/ijciet.asp
Journal Impact Factor (2013): 5.3277 (Calculated by GISI)
www.jifactor.com
IJCIET
© IAEME

International Journal of Civil Engineering and Technology (IJCIET), ISSN 0976 – 6308
(Print), ISSN 0976 – 6316(Online) Volume 4, Issue 3, May - June (2013), © IAEME
156
Fig. 1. An old university map with location errors mainly in the north portion
These types of errors have caused much disturbance during the design and setting out
of new projects. Sometimes, it was necessary to perform detailed re-surveying of a particular
area for accurate setting out of a new building due to lack of accuracy. There was a great
need to update the existing location data and elevation maps to cope with the new
developments.
Under the directions of the university authority, the author have undertaken a major
surveying work which extends over a year period. First, it began with partial work which was
extended later to include the whole area. The aim was to map the layout of existing
constructions and adding/ updating the height information in the form of contouring.
There are many techniques that can be used for planimetric and contour surveying
suitable for this kind of mapping. Their usage is governed by the available instruments and
manpower resources, these include field leveling and taping, photogrammetric methods,
tacheometry, GPS and total station surveying etc [1]-[12]. However, in this work, it was
decided to perform total station surveying for the following reasons.
1- Speed of work, high data storage and easier field and computer use.
2- High accuracy in distance measurements suitable for better planimetric mapping.
3- Suitability for height mapping (with caution [5]).
4- Evaluation of this instrument as it is being used recently for the first time in our
laboratory.
Generally, a total station resembles a collection of the following sub items [3],[8],[7];
• EDM
• Electronic theodolite
• On-Board Micro-processor
• Data Collector (built in or separate unit)
• Data Storage (internal or memory card)
• A prisms attached to the rod is required at the other end of the measured line. (non-
prism is also possible with some models [3],[8])
Total stations record various measured data as horizontal, vertical angles, and slope
distances. It can derive horizontal distances and calculate three dimensional coordinates of
the target prism point. There are a dozen of other derived products that may differ according
to the manufacturer. Thousands of points can be saved in the internal memory for later

International Journal of Civil Engineering and Technology (IJCIET), ISSN 0976 – 6308
(Print), ISSN 0976 – 6316(Online) Volume 4, Issue 3, May - June (2013), © IAEME
157
computer downloading. The speed of field data collection can be as high as (700 to 1000
points per day )according to manpower and field conditions, [3].
Many types of total stations can reach accuracy level of ± (2mm + 2 ppm) in distance
measurements. But in vertical measurements and difference in levels, results are less accurate
than those obtained using ordinary levelling[5]. This error in elevation is generally more at
longer distances and depends much on the atmospheric turbulence in temperature, humidity
and air pressure. Total stations inherit errors from using the theodolite and the EDM. They
use methods of trigonometric leveling in height calculations.
In our local conditions, the speed of field work is critical issue. Apart from the higher
cost caused by delayed work, the hot season may give very limited suitable periods of doing
the work. Moreover, in our case, security and safety issues are critical and have to be
resolved in quicker work.
In field surveying work the main focus is to collect points at various desired locations.
Field notes provided by the surveyor will help later office work in producing the plans. Many
references in total station surveying suggest the use of a dictionary of symbols that
accompany the attribute data attached to each surveyed point. At office work, coded points
can be drawn by the drafting software to resemble surveyed features. An example of label
codes used for point identification can be seen in Table (1) [3],[4],[13].
TABLE I SAMPLE CODES USED FOR POINT IDENTIFICATION DURING FIELD SURVEYING
Coding number
Description
Survey point
01
02
03
…
15
20
….etc
BM
CM
SIB
…
CL
EP
Bench mark
Concrete Monument
Standard Iron Bar
…
Centerline
Edge of pavement
The suitable symbol is usually fed to the instrument during collecting field data
according to the type of the surveyed point. This process delays the surveying work while
selecting the appropriate symbol at each ground location. Feeding the right symbol using the
small compact keyboard interface of the total station is not quick task. Each letter can be
reached after a sequence of few strokes. At the same time, on the other side of the surveyed
line the prism holder has to collect different kinds of points at a given location before moving
to a new place. It will be difficult in general to document all symbols of different field points
at a reasonable speed. This will considerably increase the time of field work and may cause
mistakes during data input.
To overcome many of these difficulties and increase speed, safety and accuracy of the
work, the author has utilized a systematic method of surveying planimetric and elevation
details using total station. During the course of field and office work of this study, there was
continuous modification to increase productivity and reduce errors. The remaining sections of
this paper describe this methodology.

International Journal of Civil Engineering and Technology (IJCIET), ISSN 0976 – 6308
(Print), ISSN 0976 – 6316(Online) Volume 4, Issue 3, May - June (2013), © IAEME
158
II. MATERIALS USED
The following instruments were used during the course of this work.
1- Total station "TOPCON 235N" with reflectors [13]. This instrument is widely
used low cost, performs major tasks. It calculates coordinates of target points in
the form of "Easting, Northing, Elevation or E, N,Z". Thousands of points can be
stored in the internal memory of the instrument and can be exported later to the
computer for further processing. This instrument can measure a distance up to
3000 m using a single prism. The reported distance accuracy of this model is
±(2mm + 2ppm X D) m.s.e. with angle measurement accuracy of 5". [13].
2- Kern "GKO-A" Automatic level used for measuring elevations separately for
comparisons and bench mark fixing.
3- Steel tapes used for measurements and checking purposes at various stages.
4- Various software as AutoCAD, Surfer, Excel, Text editors, etc.[14],[15].
III. FIELD WORK
Prior to work with the total station, several control points have been carefully
selected, marked, referenced, and named. These are selected to have the most accessibility
and visibility to the most corners of nearby buildings and other control points. They are
chosen at more stable and safe places out of the reach of humans and traffic. At many places,
dense buildings limit the selection of ideal points on the ground. Hence, roof tops were
chosen to setup instruments. These points should be observable from more than a single
instrument location in order to fix the triangulation skeleton and reduce the errors before
commencement into the details of hundreds of terrain points.
At each setup of the instrument, the user performs centering and leveling. He feeds
essential startup data, i.e. heights of instrument and prism, coordinates of the occupied point,
name of the file to store data and ID of the first target point. Arbitrary coordinates can be fed
first in the field which will be transformed and corrected later to any desired shifting or
rotation using computer software. Air temperature and pressure are fed for calculating
corrected outputs that are done internally by the instrument.
The user takes a back sight reading towards any known control or any distinct mark
that is visible from other locations. This will be used later to link to other locations while
proceeding the work. In many working days, two or three prisms were used simultaneously to
enhance the productive speed of work especially when planimetric and contouring are to be
collected in the same run of work. Care was taken to use the same geometric configuration to
all prisms within a single instrument setup. To improve the output results of elevation "Z
coordinate", levels of points at key locations were measured using Kern instrument to
compare results with those obtained using the total station.
For each location of the instrument, the surveyor opens a new data file having the
same name of the occupied point where all data captured will be stored. Then he feeds the
coordinates of the instrument ground location. It is possible to feed arbitrary ground
coordinates as this will be easily corrected during office work as will be explained later. He
then feeds the ID number of the first target point. This ID will be successively increased
automatically while doing more measurements. At each prism location, the instrument saves
the following sample line of information about that specific point, referring to Point ID, N,
E, Z .

International Journal of Civil Engineering and Technology (IJCIET), ISSN 0976 – 6308
(Print), ISSN 0976 – 6316(Online) Volume 4, Issue 3, May - June (2013), © IAEME
159
84,3098.098,3211.456,211.987
During the list of measurements within a single setup of the instrument, the surveyor
keeps brief notes about key observed points showing the point ID and small description of the
ground point being observed see Figure 2. His notes will be helpful in drafting the details. For
each setup, at least two common points have to be observed that will be observable from
another instrument location(s). These (control) points will be used later to link different parts
of the work.
Fig. 2. Field notes describing a surveyed point
Usually there are two types of observable target points. First, points that are used only
for planimetric details, i.e building corners. In this case the prism height above ground point
is not required. According to the ground obstacles at the target, the prism holder can raise or
lower or even hold the prism rod leaning out of vertical as far as keeping the horizontal
location of the prism in the right place, see Figure (3a and 3b). In the second type of
observable points where ground contouring is required, the prism man have to hold the prism
pole vertically over the desired point that represents the actual terrain at the spot as in Figure
3c.. In many cases, according to the ground configuration at the spot, it is possible to use the
same point for planimetric and elevation details if the prism is held vertically over the right
surveyed point.
a b c
Fig. 3. Positioning the reflector. (a, b) Applicable only for planimetric mapping. (c)
Applicable only for contouring
North
Fence
No. 84
South corner of fence
No. 85

International Journal of Civil Engineering and Technology (IJCIET), ISSN 0976 – 6308
(Print), ISSN 0976 – 6316(Online) Volume 4, Issue 3, May - June (2013), © IAEME
160
Apart from total station surveying, the author performed a major leveling survey that
extends over the whole area comprising 29 elevation control points. A leveling network was
created and solved using least squares methods to obtain the minimum error distribution [16],
(Figure 4). Difference in elevation between two points at the ends of any leveling line have
been given a weight that is inversely proportional to the distance between the points. It was
necessary at many network lines to repeat measurements to obtain consistency in the results.
The total length of the network lines was more than 10 Km. The locations of network points
were note optimized due to limited accessibility. Adjusted elevation values have been used
during stages of data analysis to check the validity of total station elevation results and fix
new bench marks.
Fig. 4. Network of leveling
IV. OFFICE WORK
After completing field data collection in the form of saved files as many as the
number of occupied instrument stations, files are exported to the computer using the
appropriate hardware and software links. Each data file representing the details obtained from
a single instrument location was treated as explained in the following sequence of steps.
1- Open the file using Excel program and add location information of the instrument
in the form explained in the following example as the first line of data file.
V,689.086,5432.905,234.567
Where the text V represents the name of instrument location, with its N,E,Z
coordinates. Use the coordinates already entered in the field.
2- If the instrument point elevation Z was also fed arbitrarily in the field (see field
work steps), correct the column of Z coordinates of all points in the file based on its true
elevation values. For all points that are not suitable for contouring (see Figure 3a,b),
International Journal of Civil Engineering and Technology (IJCIET), ISSN 0976 – 6308
(Print), ISSN 0976 – 6316(Online) Volume 4, Issue 3, May - June (2013), © IAEME
161
modify point IDs by adding a special symbol. For example: If point V rests on high
sidewalk of a building it will not represent actual ground contouring point, symbolize
the ID "V" into "V>>>>", to be as follows in the coordinate line.
V>>>>,689.086,5432.905,234.567
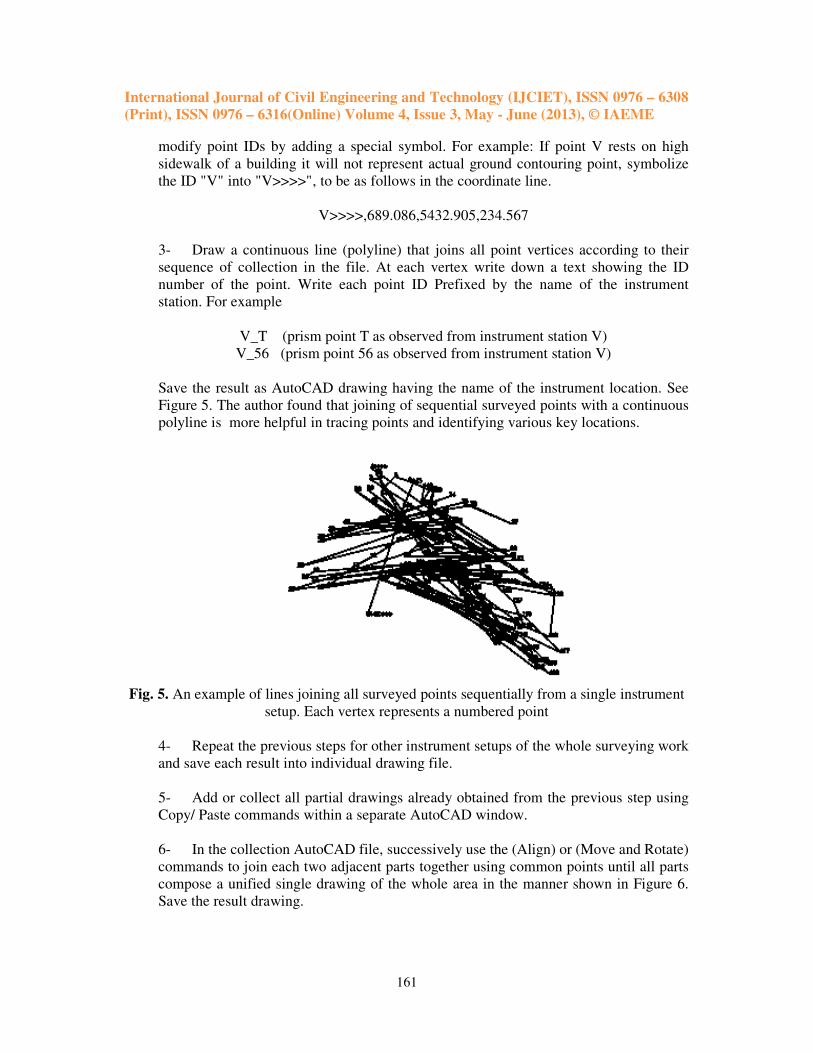
3- Draw a continuous line (polyline) that joins all point vertices according to their
sequence of collection in the file. At each vertex write down a text showing the ID
number of the point. Write each point ID Prefixed by the name of the instrument
station. For example
V_T (prism point T as observed from instrument station V)
V_56 (prism point 56 as observed from instrument station V)
Save the result as AutoCAD drawing having the name of the instrument location. See
Figure 5. The author found that joining of sequential surveyed points with a continuous
polyline is more helpful in tracing points and identifying various key locations.
Fig. 5. An example of lines joining all surveyed points sequentially from a single instrument
setup. Each vertex represents a numbered point
4- Repeat the previous steps for other instrument setups of the whole surveying work
and save each result into individual drawing file.
5- Add or collect all partial drawings already obtained from the previous step using
Copy/ Paste commands within a separate AutoCAD window.
6- In the collection AutoCAD file, successively use the (Align) or (Move and Rotate)
commands to join each two adjacent parts together using common points until all parts
compose a unified single drawing of the whole area in the manner shown in Figure 6.
Save the result drawing.

International Journal of Civil Engineering and Technology (IJCIET), ISSN 0976 – 6308
(Print), ISSN 0976 – 6316(Online) Volume 4, Issue 3, May - June (2013), © IAEME
162
Fig. 6. Translation and rotation to align all adjacent parts and unify the drawing
7- At this stage shift and re-align the whole drawing to a desired location according
to known world coordinates (or as required) of at least two points using Move /Rotate
commands. See the result of this stage in figure 7.
Fig. 7. The whole collection of surveyed details linked and realigned into a unified
world coordinates

International Journal of Civil Engineering and Technology (IJCIET), ISSN 0976 – 6308
(Print), ISSN 0976 – 6316(Online) Volume 4, Issue 3, May - June (2013), © IAEME
163
8- It will be helpful to insert an aerial photograph of the area or to overlay the
Google earth image and adjust its location and scale on the drawing. This can guide
drawing details of landmarks and probably discover any errors or observe discontinuity
of the data.
9- Field notes about each point ID are used at this stage to draw lines that join points
of interest of individual map components (see Figure 2.). Road and drain sides, fences,
and building corners are gradually constructed. Incomplete data as those of unsurveyed
features and boundaries are left for later field verification and can be completed using
steel tape measurements later. The result is a plan drawing of the area that can be
trimmed and annotated as required as shown in Figures 8 and 9.
b_110
v1_77
v1_92
v1_94v1_91
n2_215>>>>
v1_72v1_79
v1_87
v1_73
v1_70
v1_89
n2_214>>>>
v1_85
v1_86
v1_78
v1_80
n2_213>>>>
v1_75
v1_74
m1
_1
60
m1_
15
8
v1_76
b_106
b_104
v1_53
v1_95>>>>
v1_97>>>>
v1_98
b_49
b_105
b_43
b_46
v1_56
v1_81
v1_99
v1_101
n2_213>>>>
v1_82
Fig. 8. Corners of a fence and small building before and after joining vertices according to
field notes
Fig. 9. Part of the final planimetric map
10- To prepare for leveling and contouring, refer to the output of step 7. Delete all
lines from the drawing, and also delete all lines that contain the text symbol of ">>>>"
as these points are not usable for contouring calculations. It is favorable at this stage to
view the continuity of samples and the locations of sparse data to decide whether or not
to add or correct field work of the surveyed points. See Figure 10.
International Journal of Civil Engineering and Technology (IJCIET), ISSN 0976 – 6308
(Print), ISSN 0976 – 6316(Online) Volume 4, Issue 3, May - June (2013), © IAEME
164
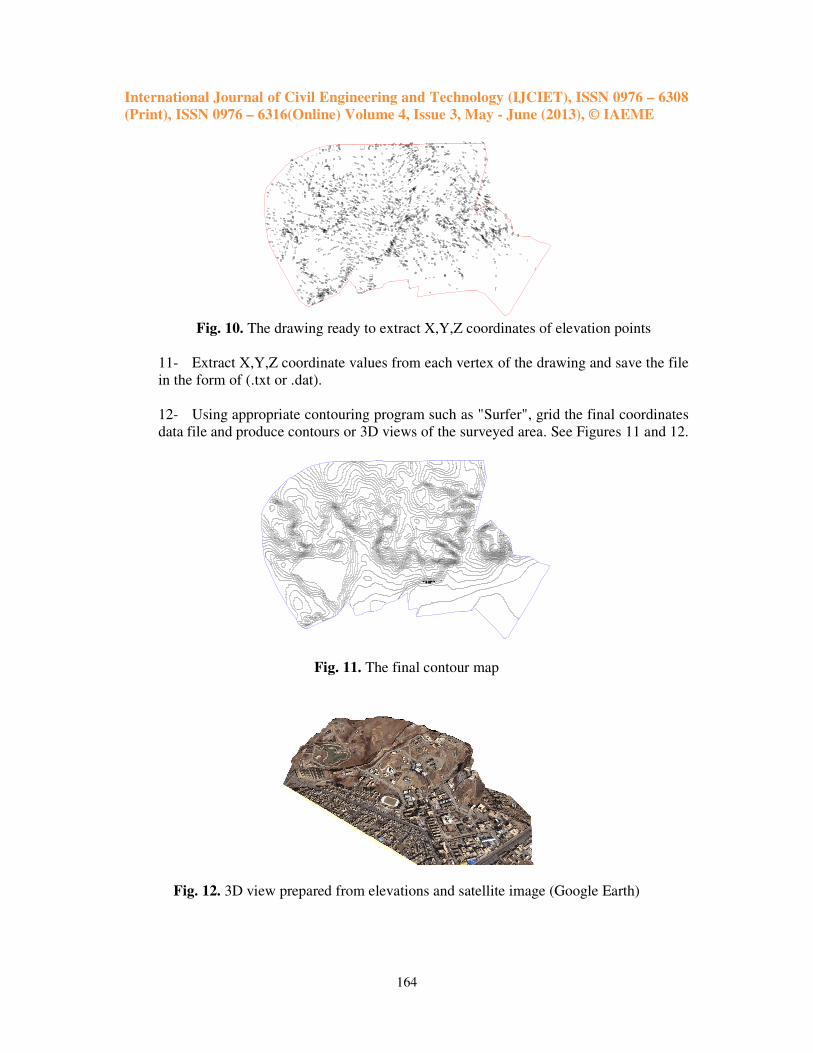
Fig. 10. The drawing ready to extract X,Y,Z coordinates of elevation points
11- Extract X,Y,Z coordinate values from each vertex of the drawing and save the file
in the form of (.txt or .dat).
12- Using appropriate contouring program such as "Surfer", grid the final coordinates
data file and produce contours or 3D views of the surveyed area. See Figures 11 and 12.
240
2
4
0
245
2
3
5
240
235 2
30
2
5
0
250
245
24
0
2
4
0
2
4
0
2
3
5
245
250
225
24
0
240
230
225
235
240
2
3
5
230
2
2
5
235
245
245
250
245
2
4
0
2
3
0
245
2
3
5
245
240
245
250
240
Fig. 11. The final contour map
Fig. 12. 3D view prepared from elevations and satellite image (Google Earth)

International Journal of Civil Engineering and Technology (IJCIET), ISSN 0976 – 6308
(Print), ISSN 0976 – 6316(Online) Volume 4, Issue 3, May - June (2013), © IAEME
165
TABLE II TARGET DISTANCE AND THE MEASURED AND MODELED ELEVATION ERRORS
Distance away from the
total station m.
Original
error in
elevation m.
Modeled error using
regression formula
399.94 0.012 0.023695
129.7825 0.016 0.002083
158.313 -0.000 0.004365
557.3546 0.035 0.036288
898.4301 0.067 0.063574
907.5783 0.062 0.064306
903.5818 0.074 0.063987
V. A NEW METHOD TO IMPROVE MEASURED ELEVATION ACCURACY
It is reported that elevations obtained using total station surveying are prone to errors
[5]. The major causes are related to uncertain measurements of atmospheric temperature,
pressure, humidity etc along surveyed lines. These may cause the line of sight to depart from
the straightness due to refraction and other errors. In this work, the author presents a new
method to reduce measured elevation errors.
Comparing elevation differences as obtained from ordinary leveling with those
obtained from total station surveying is shown in Figure 13. Ordinate values represent error
in elevation, while abscissa is the distance of surveyed point away from the instrument
location. Data from one instrument location is shown. It is noticed that in general, the error
increases with the increase in distance. The error was modeled in the form of inclined line
using regression analysis. Accordingly, elevation correction can be made at any specific
target location using its distance from instrument. For this specific instrument setup the
following formulae (1,2) can be applied to reduce errors.
Y= 8E-05 * X - 0.0083 ………………..1
Ei = E ± Y ………………..2
Where Y denotes modeled elevation error at distance X meters from instrument.
Ei, E denotes improved and original measured elevations respectively.
y = 8E-05x - 0.0083
-0.01
0
0.01
0.02
0.03
0.04
0.05
0.06
0.07
0.08
0 200 400 600 800 1000
Distance m
Ele
vati
n e
rro
r m
Fig. 13. Elevation error Vs. distance collected from an instrument location

International Journal of Civil Engineering and Technology (IJCIET), ISSN 0976 – 6308
(Print), ISSN 0976 – 6316(Online) Volume 4, Issue 3, May - June (2013), © IAEME
166
Applying the resulting regression formula to the original measurements from the
specified station location yields Table 2. All total station measured elevations of this specific
instrument location can be corrected using this formula by applying equations 1 and 2.
VI. CONCLUSIONS
In this work the author presents a systematic methodology in collecting and reducing
field data to obtain planimetric and contour maps simultaneously. This method should reduce
error and time of field work. A formula is derived to be used for correcting errors in elevation
results.
The contour map produced by this work shows high degree of fidelity. The 3D
version was produced by draping the satellite photographs obtained from Google Earth onto
the elevation data of the selected region. It shows a great deal of details and improves the
appearance of contour map.
It should be emphasized that recently there are new developments in technologies of
total stations that may improve performance. These are ranging from reflectorless, robotic to
smart stations. However, their prices are considerably higher.
REFERENCES
[1] Wolf, P. R (2002), “Surveying and mapping: History, current status and future
projections.” J. Surv. Eng., 128,3, 79–106.
[2] T.R. Blachut, Chrzanowski, A. and Saastmoionen, J. H., (1979), "Urban Surveying and
Mapping ", Springer-Verlag, New York Inc.
[3] Kavanagh F. Barry, (2010), "Surveying With Construction Applications", 7th
Ed.
Prentice Hall.
[4] Charles D. Ghilani, P. Wolf, (2008), "Elementary Surveying An Introduction to
Geomatics", 12th
ed. Printice Hall.
[5] Ayhan Ceylan, Cevat Inal and Ismail Sanlioglu, (2005), “Modern Height Determination
Techniques and Comparison of Accuracies”, Proceedings. From Pharaohs to
Geoinformatics, FIG Working Week 2005 and GSDI-8., pp. 16-21. April.
[6] F.Yildiz, H.Karabork, M.Yakar, C. Altuntas, L.Karasaka, A. Goktepeb, (2007),
"Modeling by Advanced Total Station', XXI International CIPA Symposium, pp. 01-06.
[7] Lerma, J. L., and Scherer, M., (2009) "From the Conventional Total Station to the
Prospective Image Assisted Photogrammetric Scanning Total Station: Comprehensive
Review", J. Surv. Eng. Vol. 135,4, pp. 173-178.
[8] Sami H. Al-Ali, (2011), "The Practical Applications of the Electronic Total Station and
Computerized System in Engineering Surveying." European Journal of Scientific
Research. Vol.55 No.1, pp.125-153.
[9] Nathanson J. A., Lanzafama, M. T., and Kissam, P., (2006), "Surveying Fundamentals
and Practices ", Pearson, Prentice Hall, New Jersey.
[10] A.L. Allan., (1993), "Practical Surveying and Computations ", Butterworth-Heinemann
Ltd. , second edition, London.
[11] T.B. Afeni, F.T. Cawood . (2013)," Slope Monitoring using Total Station: What are the
Challenges and How Should These be Mitigated?". South African Journal of Geomatics,
Vol. 2, No. 1, February 2013.
[12] Kontogianni V, Kornarou S, Stiros S.,(2007)."Monitoring with electronic total stations:
Performance and accuracy of prismatic and non-prismatic reflectors". Geotech News
2007;25(1):30–3.

International Journal of Civil Engineering and Technology (IJCIET), ISSN 0976 – 6308
(Print), ISSN 0976 – 6316(Online) Volume 4, Issue 3, May - June (2013), © IAEME
167
[13] Topcon Corporation, (2009), “Topcon GTS-235 Total Station Guide”
[14] E. Finkelstein, (2005), "AutoCAD 2005 and AutoCAD LT", Wiley Publishing, Inc.,
USA.
[15] Golden Software. (2009), "Surfer Software - 9, Surface Mapping System, Instruction
Manual", Golden Software, Inc., Colorado.
[16] Ghilani, Charles D., Paul R. Wolf.(2006),"Adjustment computations : spatial data
analysis'' 4th
ed. John Wiley & Sons.
[17] Manish H. Sharma and Dr. C.H. Solanki, “Liquefaction Hazard Mapping”, International
Journal of Civil Engineering & Technology (IJCIET), Volume 4, Issue 1, 2013,
pp. 52 - 70, ISSN Print: 0976 – 6308, ISSN Online: 0976 – 6316.