innovations in environmental synthesis, communication, reporting … 7-8... · innovations in...
TRANSCRIPT

Innovations in environmental
synthesis, communication,
reporting and governance
29 August 2011
EMECS 9
Baltimore, Maryland
Bill Dennison
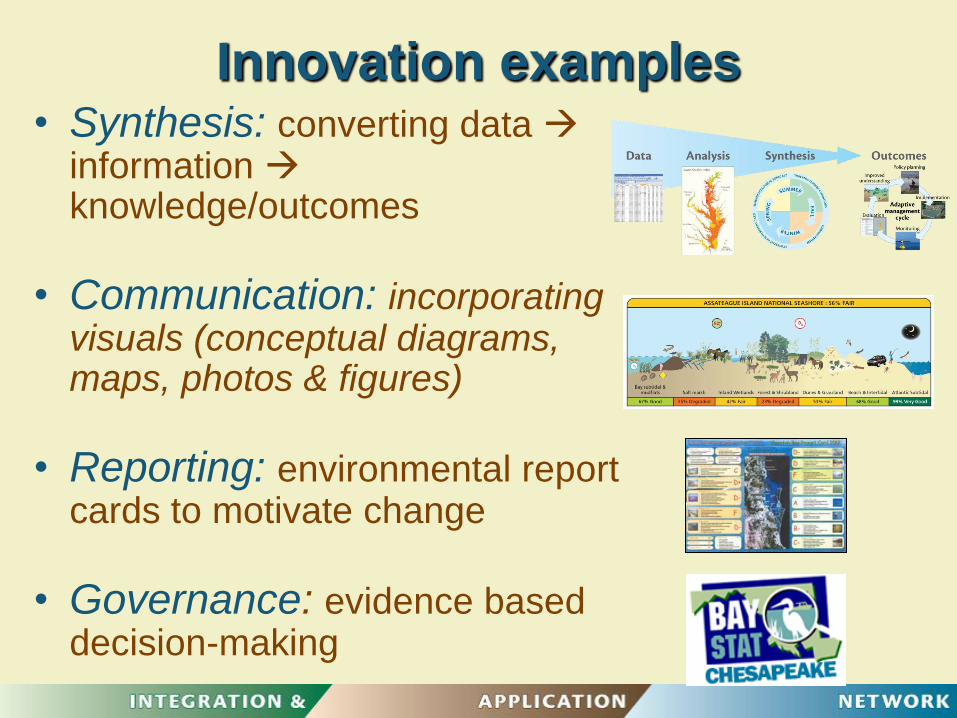
Innovation examples• Synthesis: converting data
information knowledge/outcomes
• Communication: incorporating visuals (conceptual diagrams, maps, photos & figures)
• Reporting: environmental report cards to motivate change
• Governance: evidence based decision-making
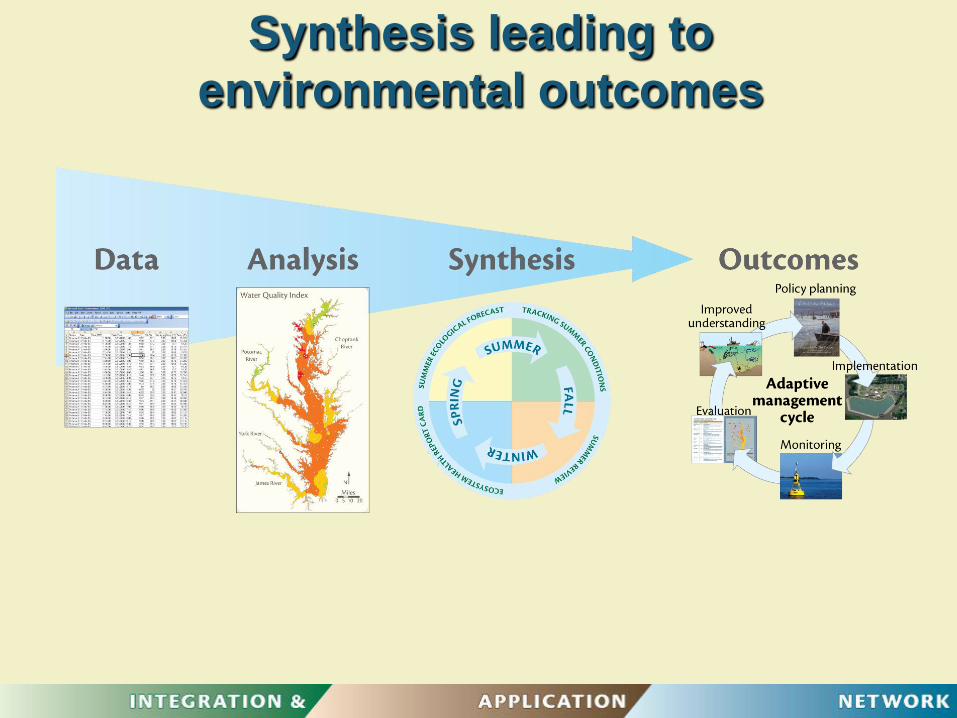
Synthesis leading to
environmental outcomes
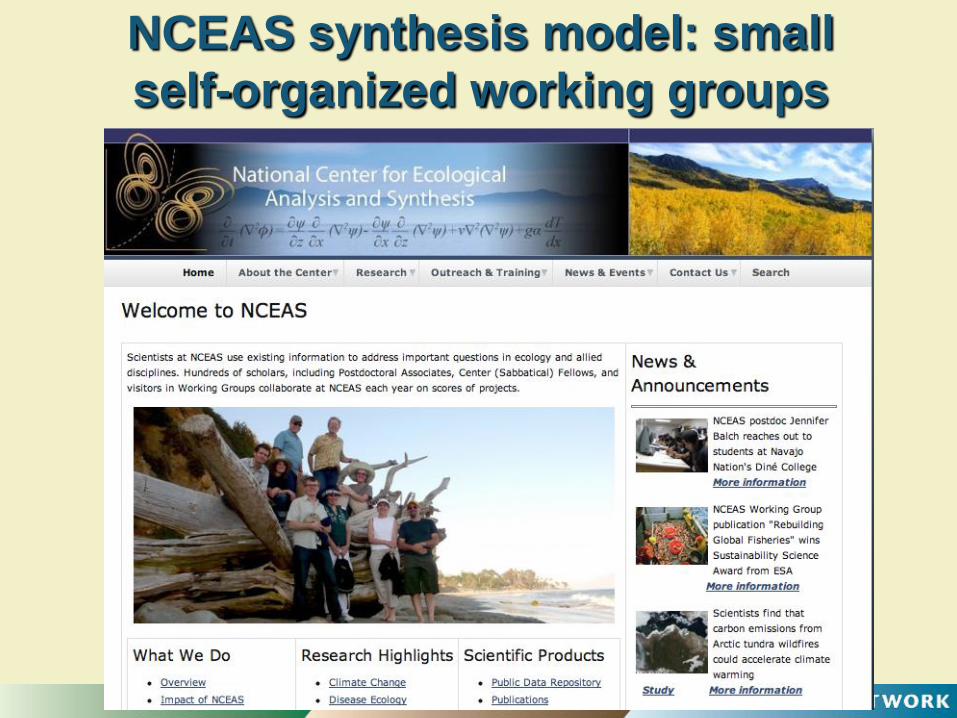
NCEAS synthesis model: small
self-organized working groups
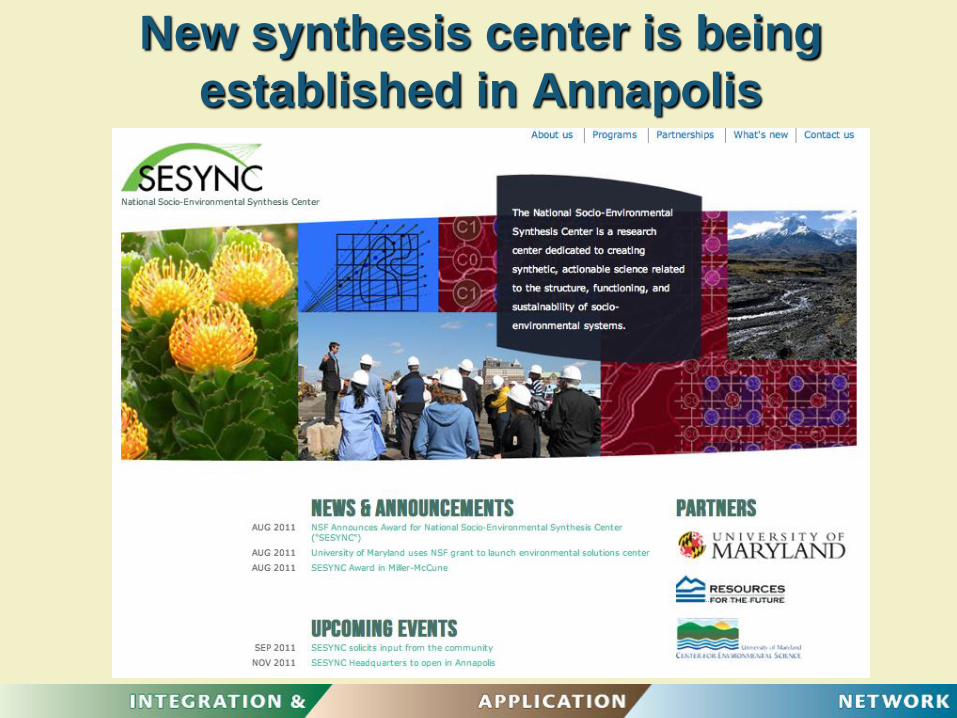
New synthesis center is being
established in Annapolis
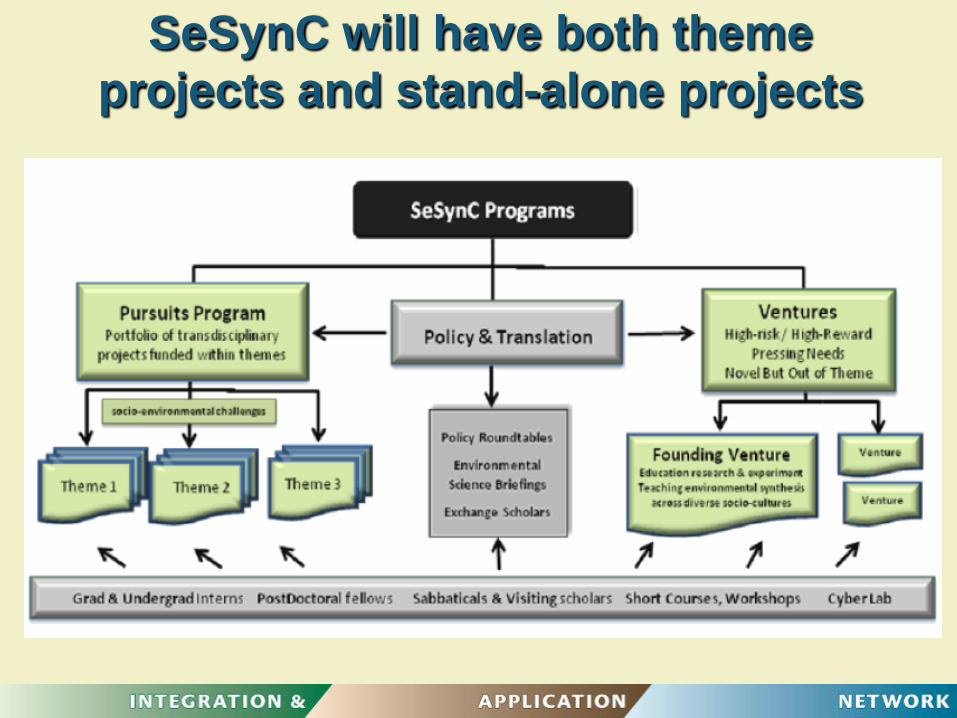
SeSynC will have both theme
projects and stand-alone projects
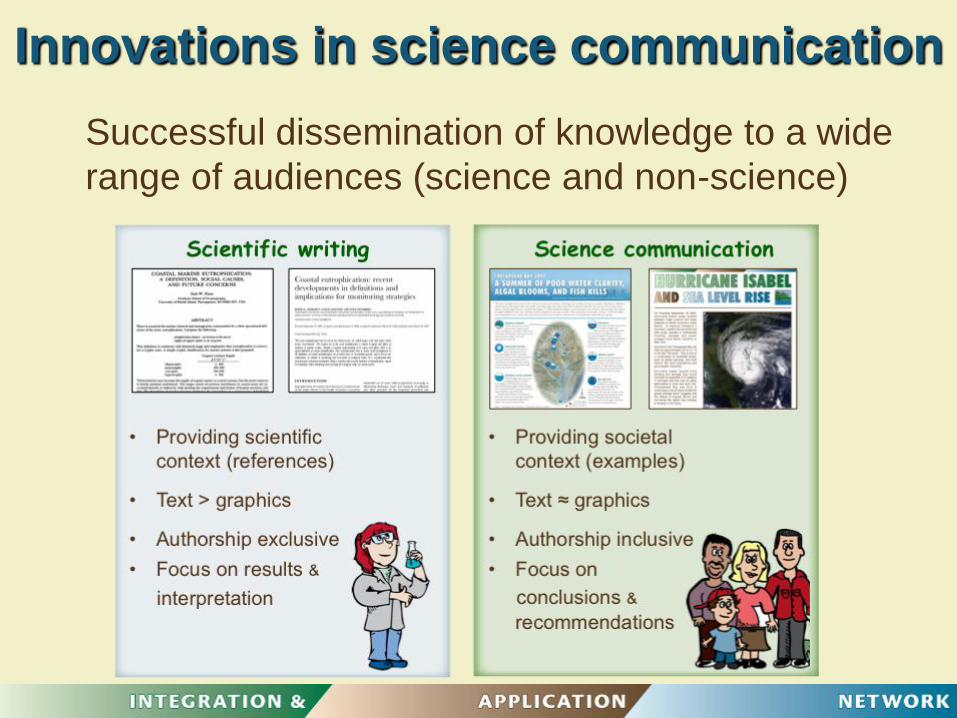
Innovations in science communication
Successful dissemination of knowledge to a wide
range of audiences (science and non-science)
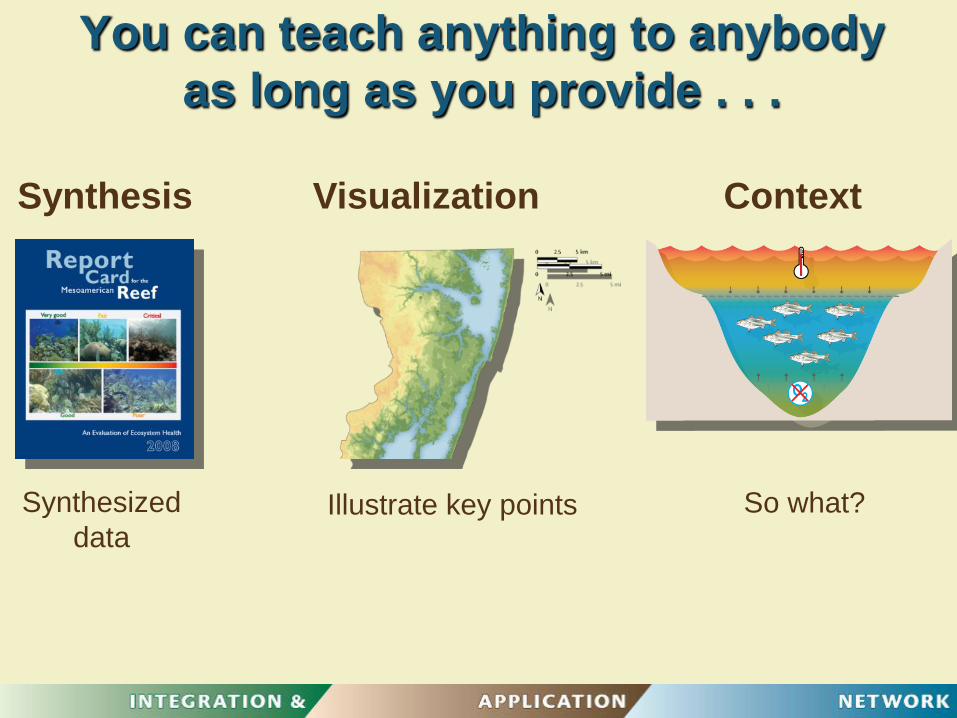
You can teach anything to anybody
as long as you provide . . .
Visualization ContextSynthesis
Synthesized
dataIllustrate key points So what?
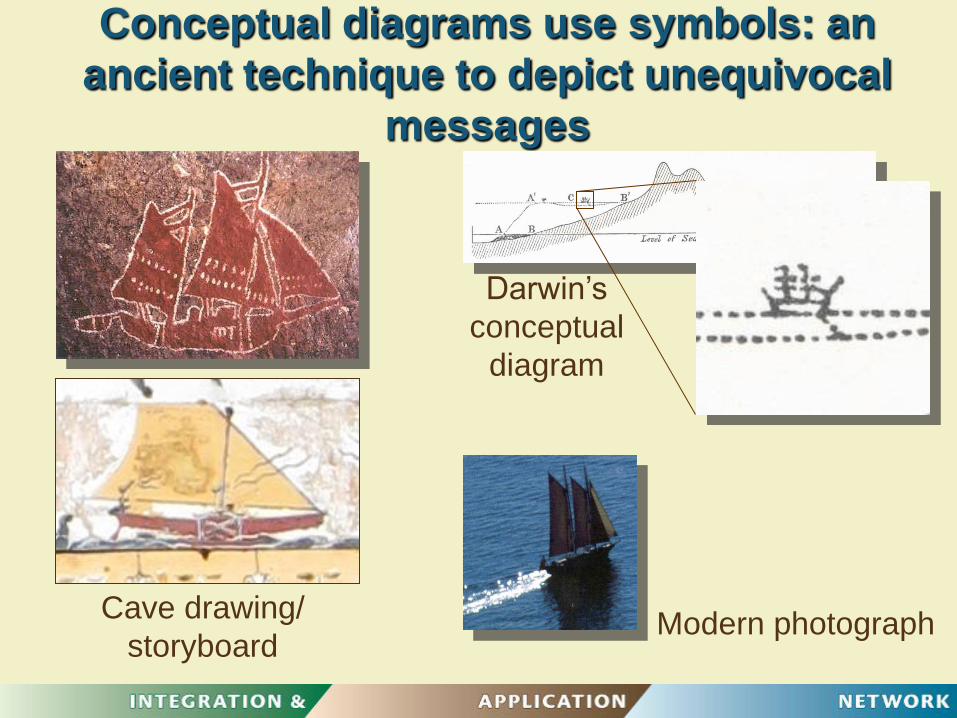
Conceptual diagrams use symbols: an
ancient technique to depict unequivocal
messages
Cave drawing/
storyboard
Darwin’s
conceptual
diagram
Modern photograph
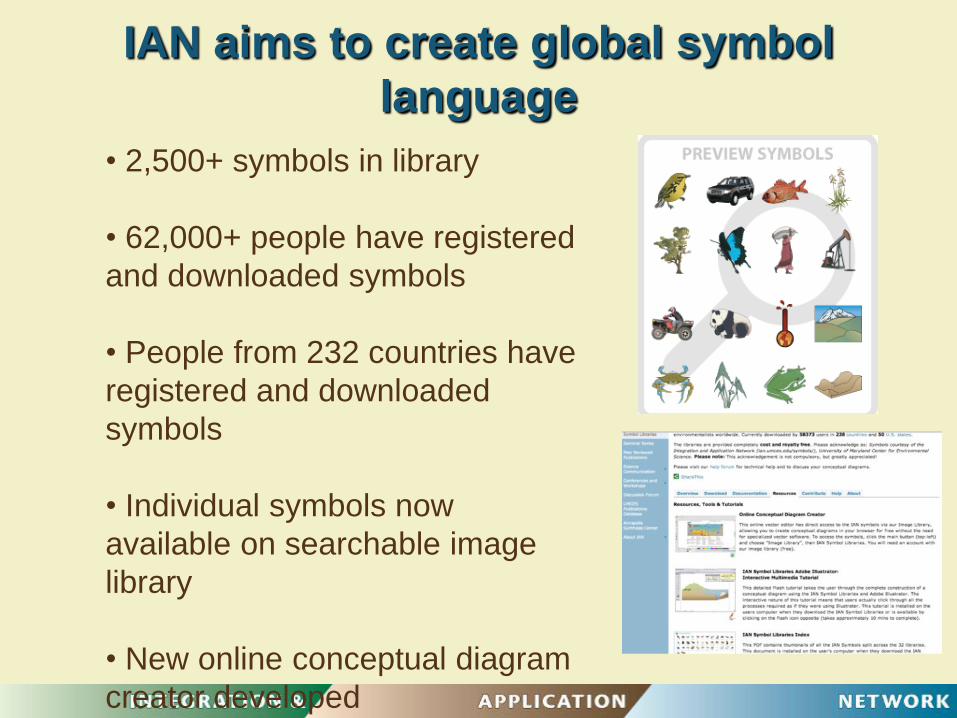
IAN aims to create global symbol
language
• 2,500+ symbols in library
• 62,000+ people have registered
and downloaded symbols
• People from 232 countries have
registered and downloaded
symbols
• Individual symbols now
available on searchable image
library
• New online conceptual diagram
creator developed
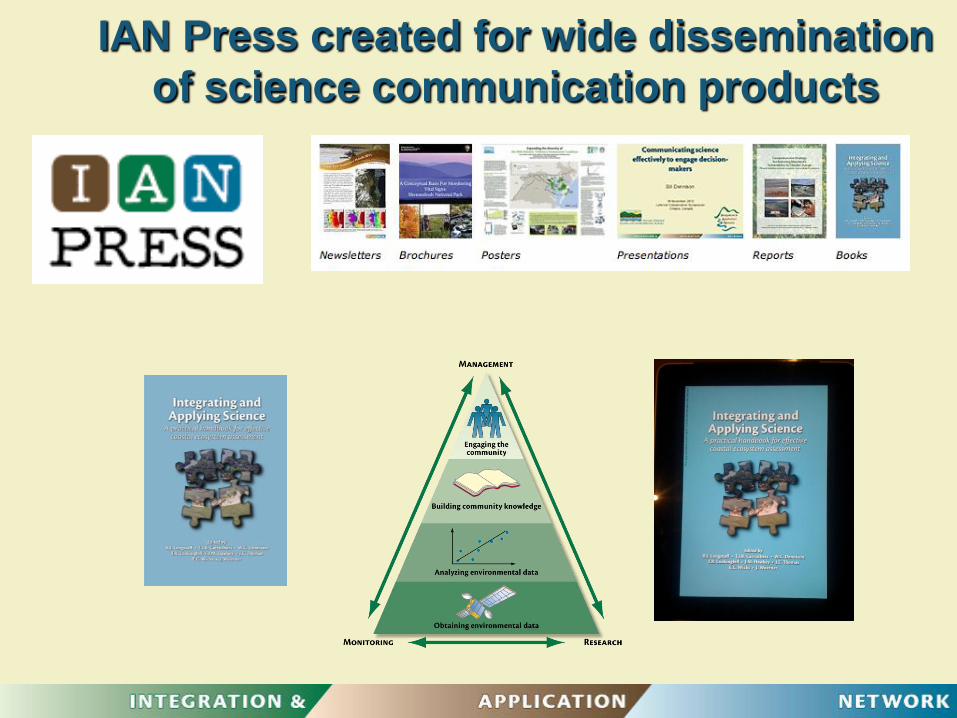
IAN Press created for wide dissemination
of science communication products
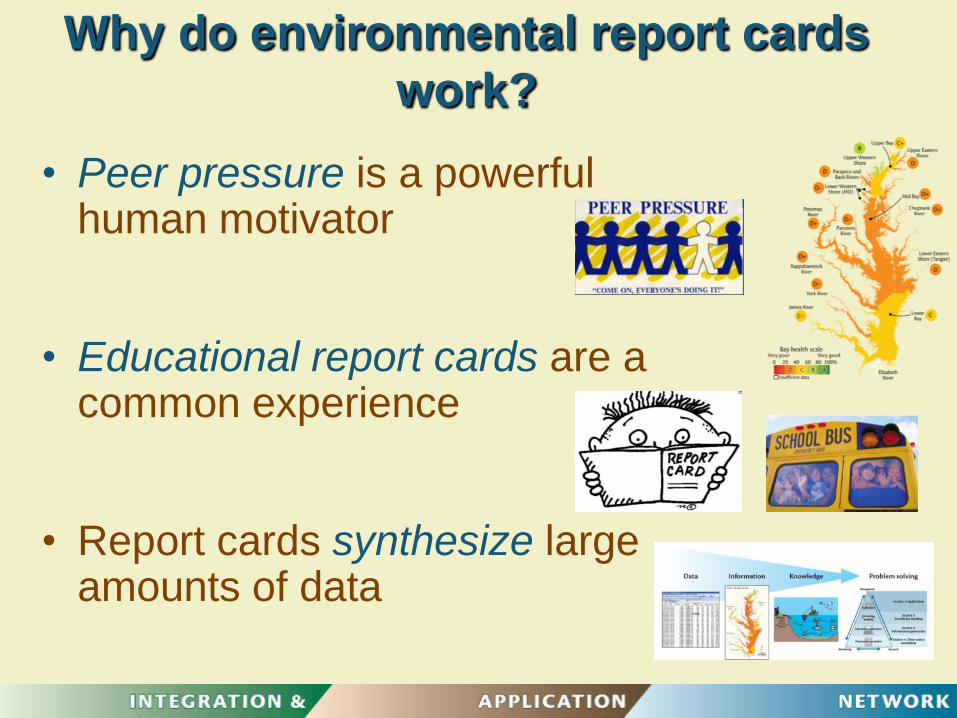
Why do environmental report cards
work?
• Peer pressure is a powerful human motivator
• Educational report cards are a common experience
• Report cards synthesize large amounts of data
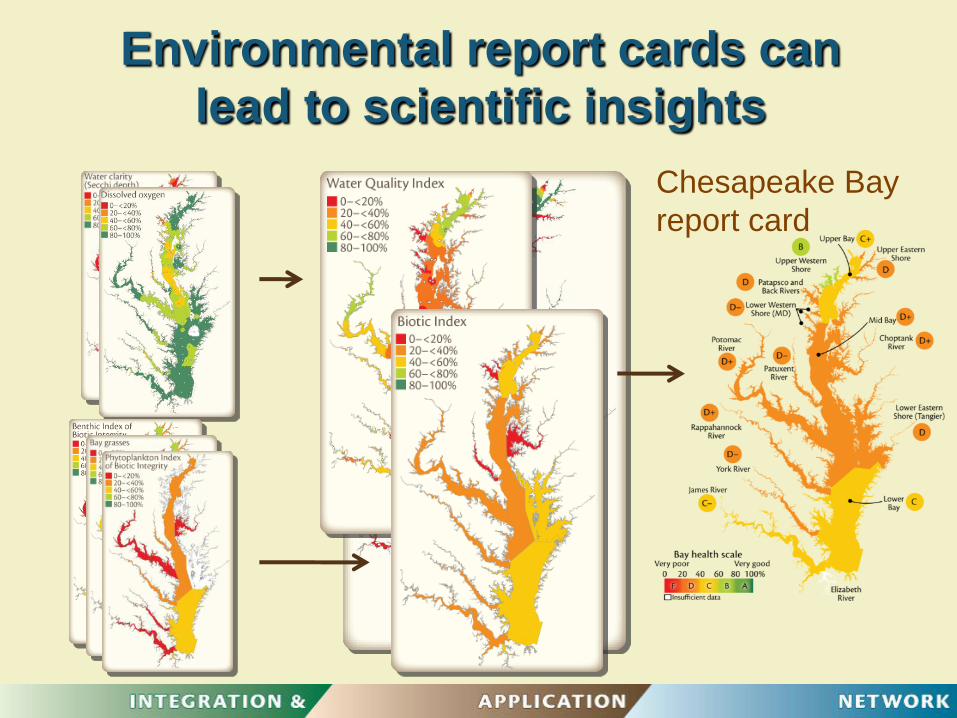
Environmental report cards can
lead to scientific insights
Chesapeake Bay
report card

We need to resolve reasons for
positive and negative trajectories
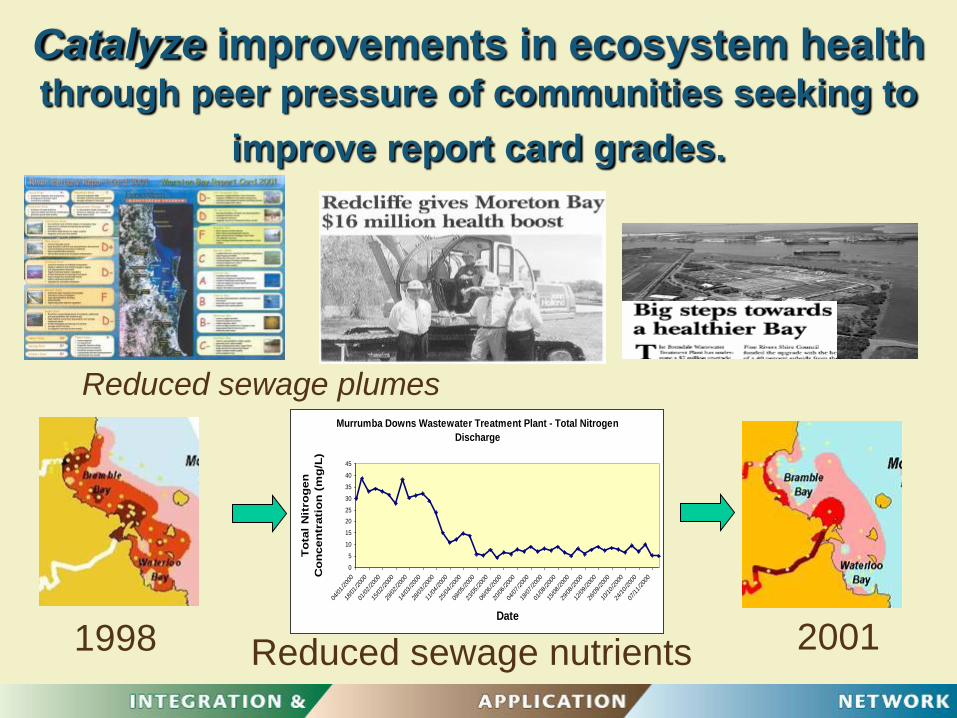
Catalyze improvements in ecosystem healththrough peer pressure of communities seeking to
improve report card grades.
Murrumba Downs Wastewater Treatment Plant - Total Nitrogen
Discharge
0
5
10
15
20
25
30
35
40
45
04/01/200
0
18/01/200
0
01/02/200
0
15/02/200
0
29/02/200
0
14/03/200
0
28/03/200
0
11/04/200
0
25/04/200
0
09/05/200
0
23/05/200
0
06/06/200
0
20/06/200
0
04/07/200
0
18/07/200
0
01/08/200
0
15/08/200
0
29/08/200
0
12/09/200
0
26/09/200
0
10/10/200
0
24/10/200
0
07/11/200
0
Date
To
tal
Nit
ro
gen
Co
ncen
trati
on
(m
g/L
)
Reduced sewage plumes
1998 2001Reduced sewage nutrients
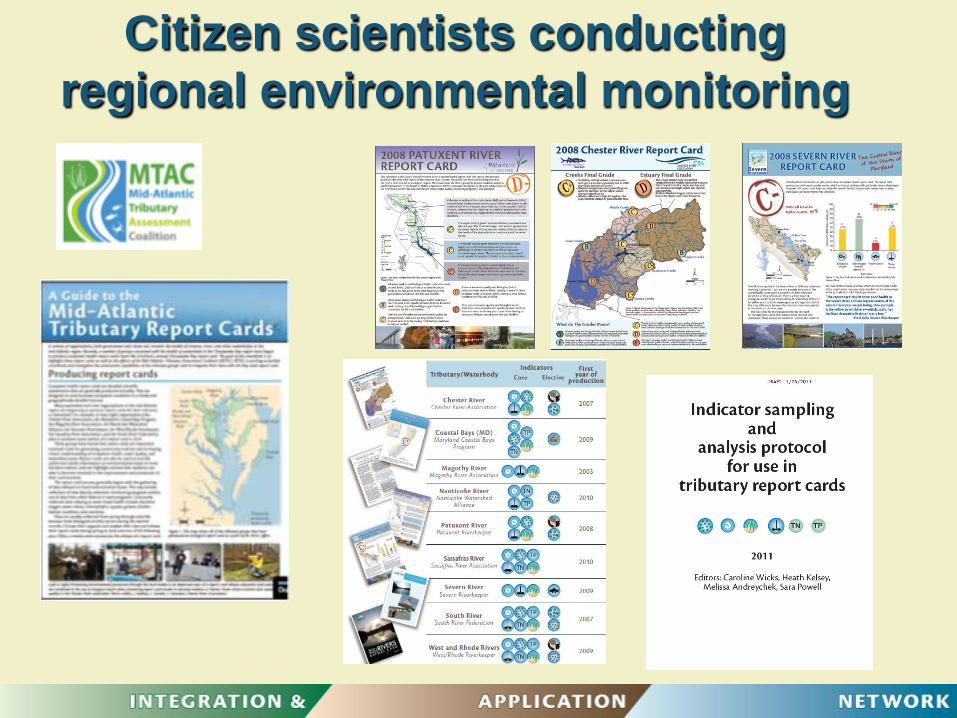
Citizen scientists conducting
regional environmental monitoring
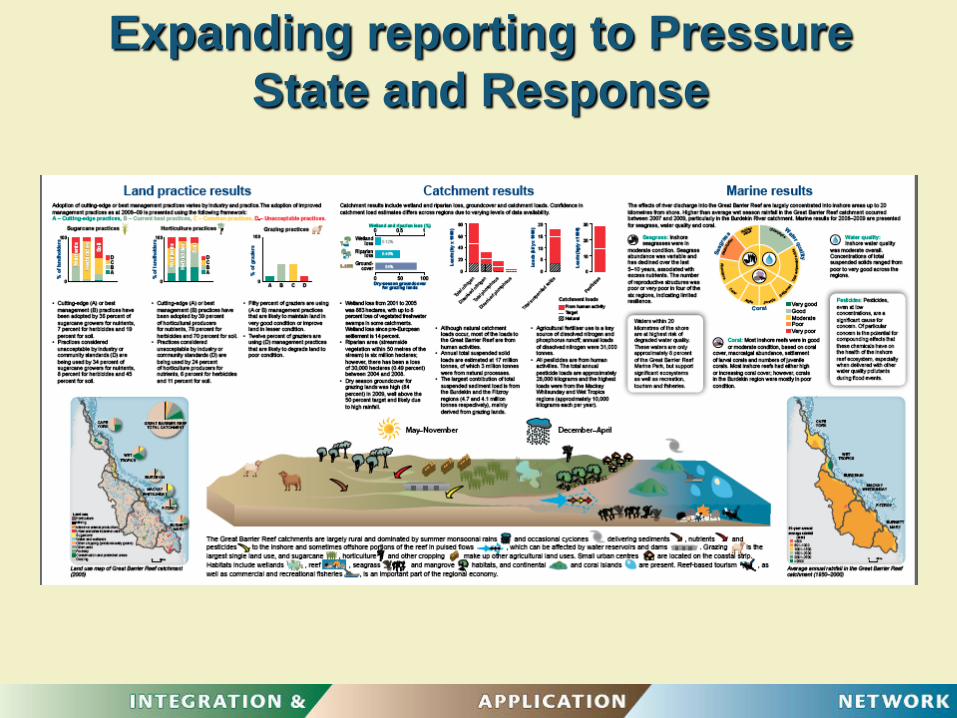
Expanding reporting to Pressure
State and Response
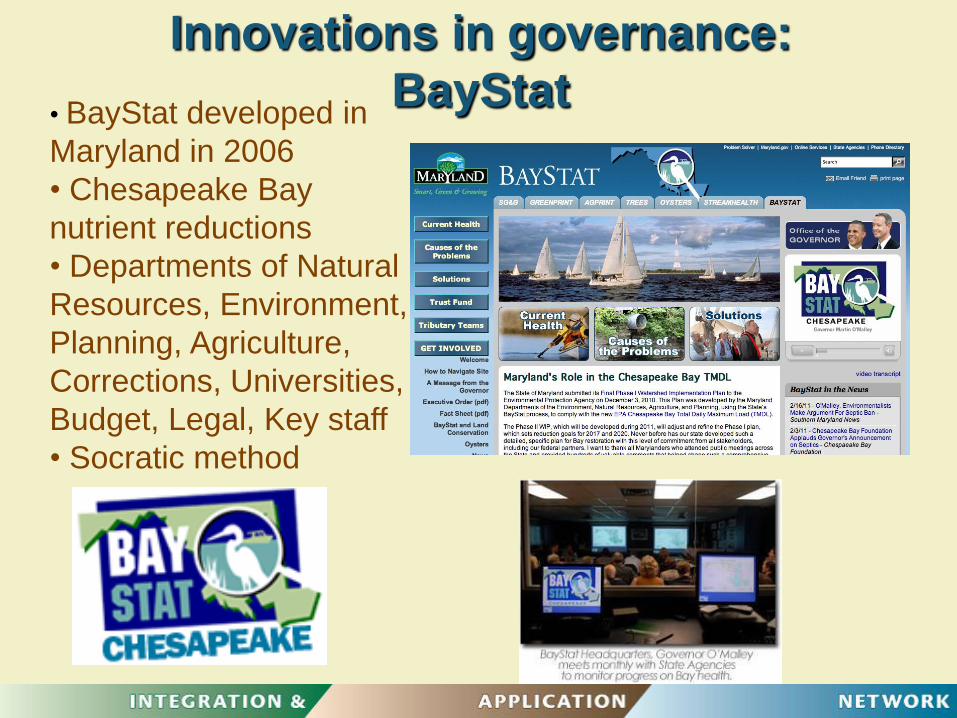
Innovations in governance:
BayStat• BayStat developed in
Maryland in 2006
• Chesapeake Bay
nutrient reductions
• Departments of Natural
Resources, Environment,
Planning, Agriculture,
Corrections, Universities,
Budget, Legal, Key staff
• Socratic method
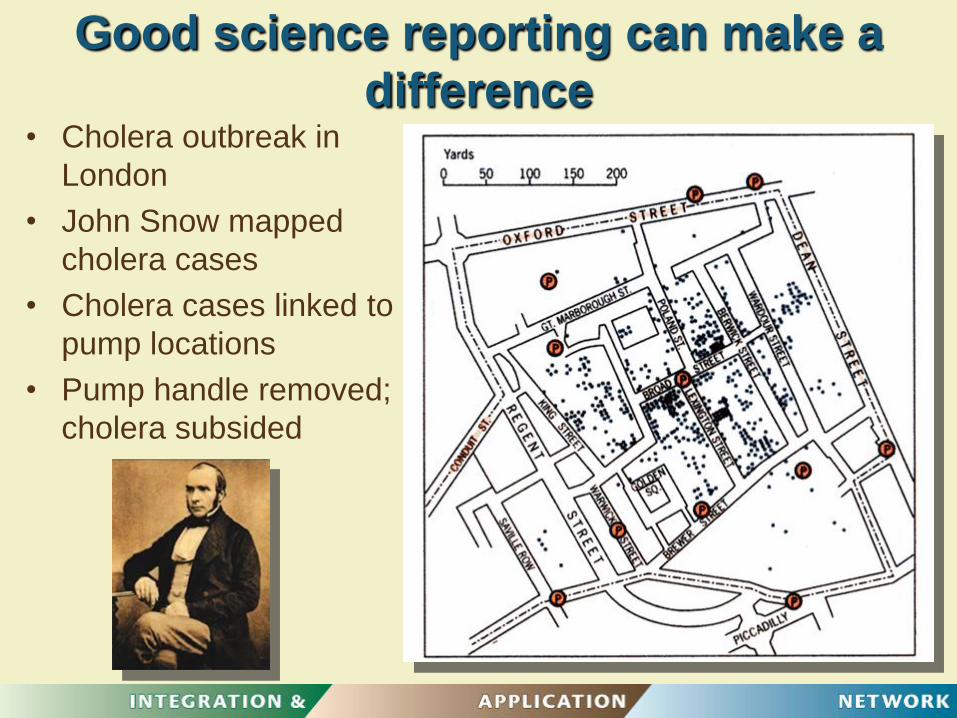
• Cholera outbreak in
London
• John Snow mapped
cholera cases
• Cholera cases linked to
pump locations
• Pump handle removed;
cholera subsided
Good science reporting can make a
difference
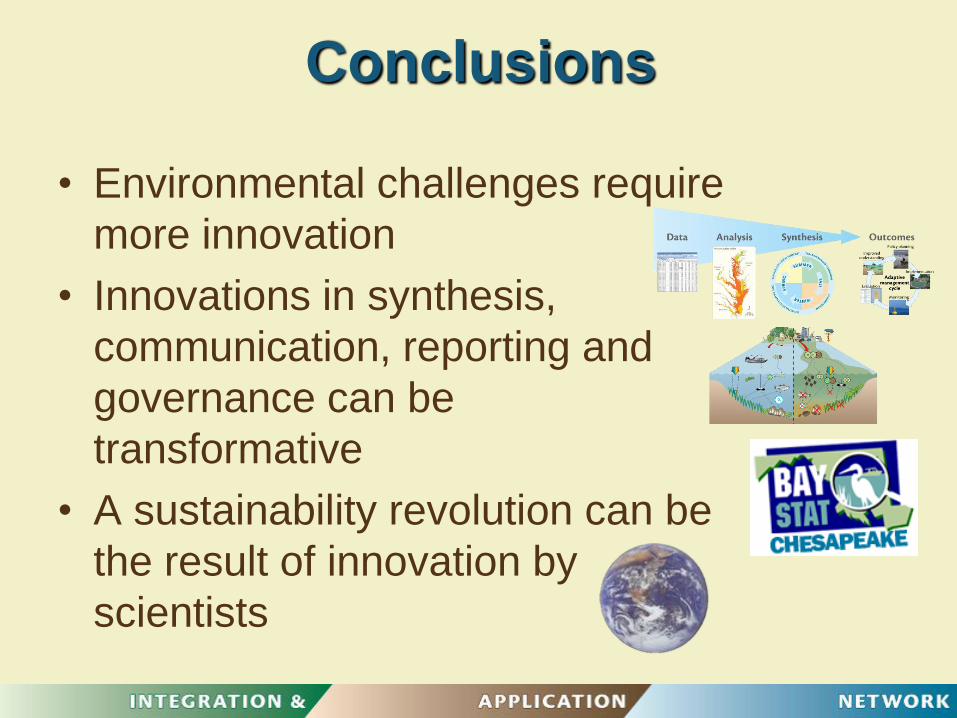
Conclusions
• Environmental challenges require
more innovation
• Innovations in synthesis,
communication, reporting and
governance can be
transformative
• A sustainability revolution can be
the result of innovation by
scientists
www.ian.umces.edu