organisational innovations, social innovations and ...€¦ · organisational innovations, social...
TRANSCRIPT
Organisational innovations, social innovations and societal
acceptability in the context of sustainability
Katrin Ostertag, Miriam Bodenheimer, Peter Neuhäusler, Patricia Helmich,
Rainer Walz
Studien zum deutschen Innovationssystem
Nr. 8-2018
Fraunhofer Institute for Systems and Innovation Research ISI
February 2018
This study was conducted on behalf of the Expertenkommission Forschung und Innovation (EFI). The results and inter-
pretations are the sole responsibility of the institute conducting the study. The EFI exercised no influence on the writing
of this report.
Studien zum deutschen Innovationssystem
Nr. 8-2018
ISSN 1613-4338
Editor:
Expertenkommission Forschung und Innovation (EFI)
Geschäftsstelle
c/o Stifterverband für die Deutsche Wissenschaft
Pariser Platz 6
10117 Berlin
http://www.e-fi.de/
All rights, in particular the right to copy and distribute as well as to translate this study, are reserved. No part of the work may be reproduced in any form (by means of photocopy, microfilm or any other process), or using electronic systems be saved, processed, duplicated or distributed, without the written permission of the EFI or of the Institute.
Contact and further informations:
Dr. Katrin Ostertag
Fraunhofer-Institut für System- und Innovationsforschung ISI
Competence Center Nachhaltigkeit und Infrastruktursysteme
Breslauer Strasse 48
76139 Karlsruhe
Phone: +49-721-6809-116
Fax: +49-721-6809-135
E-Mail: [email protected]
Contents
I
Content
0 Summary ....................................................................................................................... 6
1 Background and objectives .......................................................................................... 9
2 Selection of case studies.............................................................................................. 11
3 Analysis of public attention ....................................................................................... 14
3.1 LexisNexis ................................................................................................. 14
3.1.1 Data source ................................................................................................ 14
3.1.2 Advantages and disadvantages of LexisNexis........................................... 15
3.1.3 Results from LexisNexis ........................................................................... 17
3.1.4 Conclusions and feasibility ........................................................................ 20
3.2 Google Trends ........................................................................................... 20
3.2.1 Data source ................................................................................................ 21
3.2.2 Advantages and disadvantages of Google Trends ..................................... 23
3.2.3 Results of the Google Trends searches ...................................................... 24
3.2.4 Conclusions and feasibility for future studies ........................................... 29
3.3 Plausibility of LexisNexis and Google Trends results .............................. 30
4 Attitudes towards sustainability and resource efficiency ....................................... 33
4.1 Data sources ............................................................................................... 33
4.2 Relevant questionnaires and their coverage .............................................. 34
4.3 Results ....................................................................................................... 40
4.4 Conclusions and feasibility for future studies ........................................... 49
5 Activities of firms ........................................................................................................ 50
5.1 Method ....................................................................................................... 50
5.2 Differentiation of the text analysis from NACE code classification ......... 52
5.3 Analysis of the retrieved firms .................................................................. 52
5.3.1 Analysis of countries and sectors .............................................................. 52
5.3.2 Analysis of selected NACE codes ............................................................. 55
5.3.3 Analysis of individual keywords ............................................................... 57
5.4 Summary .................................................................................................... 59

Contents
II
6 Synopsis of evidence and first preliminary conclusions .......................................... 60
7 References .................................................................................................................... 65
Annex 1: Overview of media sources available in LexisNexis for selected
countries .............................................................................................................................. 70
Contents
III
List of Figures
Figure 1: Typology of environmental strategies .............................................................. 12
Figure 2: Number of global media reports per year and search string ............................. 18
Figure 3: Number of German media reports by year and search string ........................... 19
Figure 4: Comparison of number of global and German media reports per year ............ 19
Figure 5: Number of Google searches for new models of repair and maintenance services, worldwide, 2004-2017 ....................................................................... 25
Figure 6: Number of Google searches for new models of repair and maintenance services, Germany, 2004-2017 ......................................................................... 25
Figure 7: Country Comparisons - Maker movement vs. new models of repair and maintenance services, 2016 ....................................................................... 26
Figure 8: Number of Google searches for established models of repair- and maintenance services, worldwide (English keywords), 2004-2017 ................. 28
Figure 9: Number of Google searches for established models of repair and maintenance services, Germany (German keywords), 2004-2017 ................... 29
Figure 10: Number of open workshops and open creative labs in Germany in 2016 .................................................................................................................. 30
Figure 11: Comparison of the number of global attendees at Maker Faires with the number of global media reports and Google searches on Maker Faires................................................................................................................. 31
Figure 12: Comparison of the number of global repair café initiatives, the number of countries with repair cafés, the amount of global media attention to the topic and the average number of annual Google Trends searches .............. 32
Figure 13: ENVI - Country Comparisons .......................................................................... 42
Figure 14: EFFI - Country Comparisons ........................................................................... 43
Figure 15: INNO - Country Comparisons .......................................................................... 44
Figure 16: WVS - Country Comparisons ........................................................................... 45
Figure 17: Shares of firms with “repair services”, identified through keyword-based analysis of all firms for each country. .................................................... 53
Figure 18: Shares of firms with “repair services”, identified through keyword-based analysis of all firms in each sector worldwide. ...................................... 54
Figure 19: Shares of German firms with “repair services”, identified through keyword-based analysis in each sector. ............................................................ 55
Figure 20: Shares of firms with “repair services”, identified through keyword-based analysis for some selected sub- sectors. ................................................. 57
Figure 21: Firms retrieved through a keyword as a share of all firms retrieved based on the keyword set. ................................................................................. 58
Contents
IV
Figure 22: Firms retrieved through a keyword in a sector as a shares of all firms retrieved through the respective keyword ......................................................... 59
Contents
V
List of Tables
Table 1: Search strings used in LexisNexis .................................................................... 14
Table 2: Search strings used in Google Trends .............................................................. 22
Table 3: Coverage of "Attitudes of European citizens towards the environment" (ENVI) .............................................................................................................. 36
Table 4: Coverage of "Attitudes of European citizens towards waste management and resource efficiency" .............................................................. 37
Table 5: Coverage of "Attitudes of European entrepreneurs towards eco-innovation"........................................................................................................ 38
Table 6: Coverage of the WVS variables ....................................................................... 39
Table 7: Summary Statistics Eurobarometer .................................................................. 41
Table 8: Summary Statistics WVS ................................................................................. 42
Table 9: Factor Analysis - Eurobarometer ...................................................................... 47
Table 10: Factor Analysis WVS ....................................................................................... 48
Table 11: Synopsis of key case study results for Germany .............................................. 61
Table 12: Potential of selected data sources for analysing soft innovations ..................... 63
Table 13: Overview of media sources available in LexisNexis for selected countries ............................................................................................................ 70
Table 14: Overview of sub-sectors used in the analysis of firm activities ....................... 71
Summary
6
0 Summary
Background and goal of study
The innovation literature has recently emphasized the importance of various forms of non-
technical innovations, in particular organizational and social innovations. A somewhat dif-
fuse picture emerges of what organizational and social innovations encompass. Therefore,
we use the term “soft” innovations to characterize this kind of innovations. Environmental
sustainability is one area in which soft innovations have received a particularly high level
of attention. Thus, we use two cases from this field – the maker movement and repair cafés
– to investigate from a bottom-up perspective the possibilities to build additional indicators
for soft innovations.
Organizational and social innovations are multi-faceted, and cannot be taken into account
by a single indicator. Novel configurations of social practices, including collaborative ac-
tions, require social acceptability and changing behavioral patterns of the actors involved.
Public attention and attitudes fostering sustainability and resource efficiency can be at-
tributed to various factors influencing acceptability and behavior and give an indication for
processes taking place in the formation of “soft” innovations. Looking at the number of
institutions active in performing these “soft” innovations gives an analogue to the indica-
tors for market activities used in traditional indicator systems. Thus, we look into the feasi-
bility of building indicators in the three areas of attention, attitudes and activity for the two
case studies selected.
Media Analyses
A first element of this feasibility study is the evaluation of public attention for soft innova-
tions using a LexisNexis-based media coverage analysis on the repair café and maker
movements. In terms of feasibility, we find that the advantages of this methodology out-
weigh the disadvantages resulting from certain source- and language biases. The types of
topics that can be examined is almost limitless, the range of sources is extensive and the
geographic coverage is considerable. The data are suitable for analyses over time (here
1990 - 2016) as well as for crosscutting analyses comparing different countries or regions
(here: Germany vs. global level).
The results show that media coverage, and consequently public awareness, to both the
maker and repair movements has grown significantly and on a global scale since 2011. It is
clear that these soft innovations are currently on the rise, although both are certainly still
niche phenomena. Based on the media data alone, no prediction is possible to date as to
whether this increase in media coverage is a temporary hype associated with the novelty of
the movements, or whether public interest in these innovations will continue to stay high
over a longer period. Comparing Germany to the rest of the world reveals that, in the Ger-
man media, attention payed to the maker movement is much lower than at global level.
Summary
7
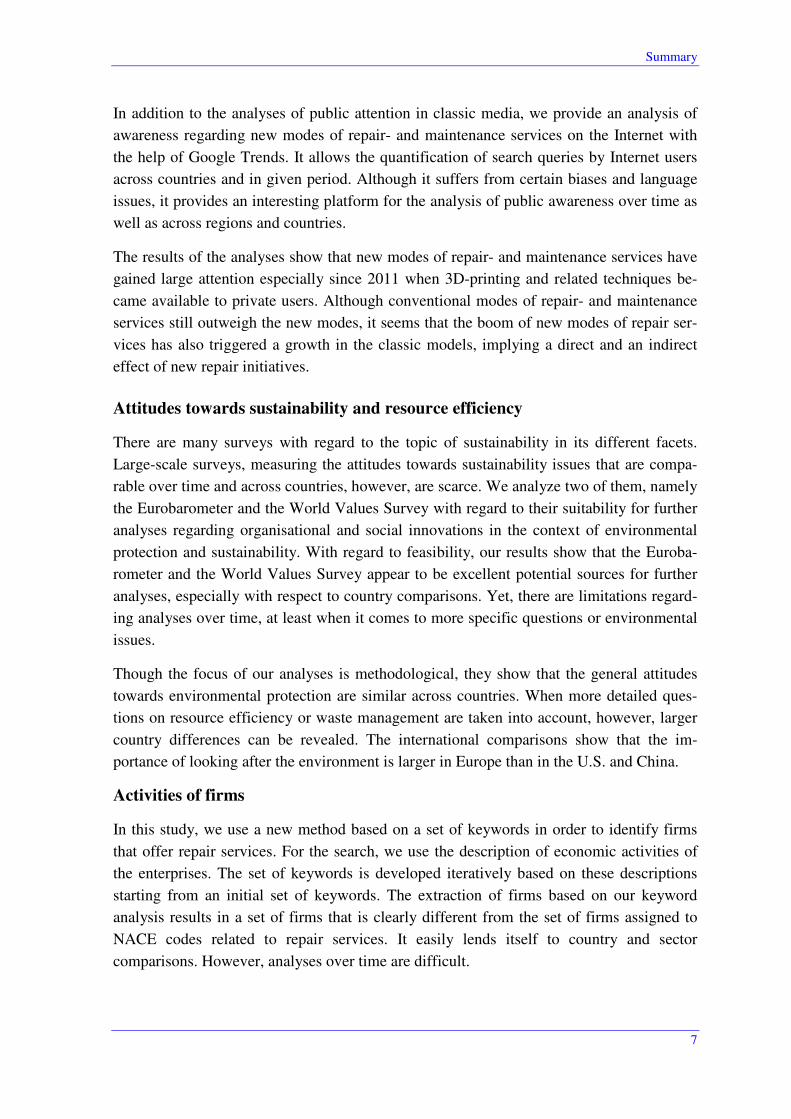
In addition to the analyses of public attention in classic media, we provide an analysis of
awareness regarding new modes of repair- and maintenance services on the Internet with
the help of Google Trends. It allows the quantification of search queries by Internet users
across countries and in given period. Although it suffers from certain biases and language
issues, it provides an interesting platform for the analysis of public awareness over time as
well as across regions and countries.
The results of the analyses show that new modes of repair- and maintenance services have
gained large attention especially since 2011 when 3D-printing and related techniques be-
came available to private users. Although conventional modes of repair- and maintenance
services still outweigh the new modes, it seems that the boom of new modes of repair ser-
vices has also triggered a growth in the classic models, implying a direct and an indirect
effect of new repair initiatives.
Attitudes towards sustainability and resource efficiency
There are many surveys with regard to the topic of sustainability in its different facets.
Large-scale surveys, measuring the attitudes towards sustainability issues that are compa-
rable over time and across countries, however, are scarce. We analyze two of them, namely
the Eurobarometer and the World Values Survey with regard to their suitability for further
analyses regarding organisational and social innovations in the context of environmental
protection and sustainability. With regard to feasibility, our results show that the Euroba-
rometer and the World Values Survey appear to be excellent potential sources for further
analyses, especially with respect to country comparisons. Yet, there are limitations regard-
ing analyses over time, at least when it comes to more specific questions or environmental
issues.
Though the focus of our analyses is methodological, they show that the general attitudes
towards environmental protection are similar across countries. When more detailed ques-
tions on resource efficiency or waste management are taken into account, however, larger
country differences can be revealed. The international comparisons show that the im-
portance of looking after the environment is larger in Europe than in the U.S. and China.
Activities of firms
In this study, we use a new method based on a set of keywords in order to identify firms
that offer repair services. For the search, we use the description of economic activities of
the enterprises. The set of keywords is developed iteratively based on these descriptions
starting from an initial set of keywords. The extraction of firms based on our keyword
analysis results in a set of firms that is clearly different from the set of firms assigned to
NACE codes related to repair services. It easily lends itself to country and sector
comparisons. However, analyses over time are difficult.

Summary
8
Concluding, we can say that the text analysis provides valuable information about repair
services offered by companies in addition to a NACE code-based analysis. With a share of
1 %, the proportion of firms worldwide is small but visible. We can identify differences
between the company profiles in different countries and find that some countries show a
significantly higher share such as China, Finland and India. The major part of firms
offering repair services can be found in the area of manufacturing.
Outlook
The study has shown the feasibility of building indicators, which represent attention, atti-
tudes, and activities: The indicators for attention show diffusion of ideas, and level of in-
terest of individuals to take a look into new ideas, whereas the indicators for activities
show the level of activities taking place. Both types of indicators can be matched to each
other based on the classification used. On the other side, the indicators for attitude indicate
that the increase in development of activities might not just be a temporary hype, but might
be rooted in deeper developments taking place over the longer run. However, the aggrega-
tion level of the issues is much higher so that the indicators on attitude cannot be easily
matched to the observations on attention and activity.
From a strategic point of view, it remains open how to assess soft innovations as an aggre-
gate. Such an approach would increase the generality of results and could also serve as a
benchmark for assessing the performance of sub-fields. A bottom-up approach, which con-
sists of aggregating numerous case studies, might look feasible from the point of view of
retrieving data for attention and activity data. However, this would require developing a
pre-defined list of soft innovation cases, which is representative for soft innovations as
such and continuously updated to newly emerging soft innovations. Future research should
develop the perspective on the aggregate of ‘soft innovations for sustainability’ further
with a view to incorporating an updating representative cases of soft innovations while
ensuring that, for all soft innovations on the list, indicators can be derived from a common
set of data sources. Furthermore, the role of indicators for attitudes has to be further re-
fined. A possible role might be to look at attitudes related to soft innovations per se, re-
gardless in which area or for which specific case they apply. This would require finding a
common set of attitudes, which are related to all forms of soft innovations.
Background and objectives
9
1 Background and objectives
Innovation indicator systems have gone through a long period of development. Various
indicator types have been used to describe innovations related to technological develop-
ment and to account for the capabilities necessary to perform them. At the same time,
however, there has also been a trend emphasizing the importance of various forms of non-
technical innovations, which are generally harder to measure.
Organizational innovations, which themselves comprise a wide array, are among these. In
the last years, social innovations have become another important term. Nevertheless, this
concept remains contested (see e.g. the discussion on definitions of social innovations in
Neumeier 2012). On the one hand, the key characteristic of social innovations is seen in a
positive impact on society (e.g. Moulaert et al. 2013); on the other hand, social innovations
are seen as novel configurations of social practices with the goal of fulfilling the innova-
tors' own purposes (Howaldt et al. 2010). The importance of non-technical innovations is
further pronounced by various trends such as the presence of new innovation actors, in-
cluding communal users and collaborative innovators, or grassroots innovations and com-
munity actions (Warnke et al. 2016; Seyfang, Longhurst 2015). Taken together, these
trends show a somewhat diffuse picture of what organizational and social innovations en-
compass. In this report, we also use the term “soft” innovations to characterize these kind
of innovations.
Nevertheless, environmental sustainability seems to be one area in which the different
trends occur simultaneously. Sustainability is one of the great global challenges, requiring
a multitude of innovations to support these goals and as eco-innovations are becoming in-
creasingly complex, non-technological innovations are gaining in importance. Thus, meas-
uring innovations towards sustainability increasingly requires taking organizational and
social innovations into account. Based on analyses of existing approaches and data, it can
be concluded that additional efforts are called for to develop new indicator concepts, which
address the nexus between organizational innovations and behavioural changes, and which
look at the structural conditions for transformations (see Walz 2016; Walz et al. 2017).
Sustainable products and value added concepts as well as the transformation of entire sys-
tems towards sustainability require innovations of increasing complexity and lead times. In
this context, the importance of organizational and social innovations as well as the devel-
opment of completely new business models (such as e.g. sharing concepts) rises and new
actors with new roles emerge, for example prosumers, citizen-driven initiatives such as
repair cafés, or social entrepreneurs. Those phenomena cannot be grasped with the tradi-
tional concepts of innovation indicators, because at this stage, the activities and actors are
not yet well defined. Therefore, new complementary indicators for measuring green trans-
formation processes are needed. Taking the perspective of a feasibility study, this report
explores the question of how „soft“ phenomena of green transformation processes (i.e.
organizational and social innovations) can be captured in innovation indicators. This in-
Background and objectives
10
cludes the question of adequate data sources that allow analyses over time and country
comparisons. In order to look into the feasibility of new approaches, we use two examples
of soft phenomena where we can currently observe a lot of activity: the maker movement
and repair cafés (for details see section 2).
For the same reason as existing innovation indicator systems, soft innovation indicators
should provide information on the state of innovation activity and its dynamics, and should
allow for international benchmarking. Furthermore, we start from the notion that organiza-
tional and social innovations are multi-faceted, and cannot be taken into account by a sin-
gle indicator. They should reflect the complex nature of such innovations emerging. In
traditional indicator systems, this complexity is addressed by building different kinds of
indictors, which address input and output of the innovation process and related market ac-
tivities. Generally, soft innovations are characterized by novel configurations of social
practices, including collaborative actions, which require social acceptability and changing
behavioral patterns of the actors involved. Changing behavioral patterns is in itself a com-
plex process, which – according to the integrated framework for explaining environmental
behavior - involves norm activation, motivation, and evaluation (Bamberg, Möser 2007;
Klöckner 2013). Using this framework, high public attention and attitudes fostering
sustainability and resource efficiency can be attributed to various factors influencing norm
activation and motivation. Thus, it can be argued that measuring public attention and atti-
tudes indeed give an indication for processes taking place in the formation of “soft” inno-
vations. In addition, looking at the number of institutions performing these “soft” innova-
tions gives an analogue to the indicators for market activities used in traditional indicator
systems.
Thus, our assumption is that we have to look into three elements in order to address organ-
izational and social innovations for sustainability:
• The first element of this feasibility study is the analysis of public attention. By
definition, public attention implies "at least a minimum degree of shared attention"
and communication about a certain issue" (Newig 2004, p. 158). It can be inferred
that an increase in communication about and therefore public attention to a particu-
lar soft innovation implies that the innovation is growing and spreading. This is
particularly relevant in the context of soft sustainability innovations such as the
maker movement and repair cafés, because it is only through this publicity that an
issue can become sociologically and, more importantly, politically relevant (Newig
2004).
• Following the concept of the “Great Transformation” as proposed by the German
Advisory Council on Global Change (Wissenschaftlicher Beirat der Bundesregier-
ung Globale Umweltveränderungen (WBGU) 2011), a change in people's values
counts among its necessary prerequisites. More closely related to our case exam-
ples, the acceptance of repaired products and new modes of production are also re-
lated to changes in consumer behavior, which is again related to changes in atti-
Selection of case studies
11
tudes. Therefore, the second element of our analysis is the evaluation of survey da-
ta on attitudes towards environmental issues.
• The third element is the analysis of economic activities of firms. Focusing on re-
pair services as an extension to conventional business activities, it complements the
perspective on the soft innovations analysed in the first step. Thus, our indicator
approach aims to examine to what degree the demand for repair services - evident
in the citizen-driven maker and repair initiatives - is matched by an offer from con-
ventional suppliers.
The report is organised as follows: In chapter 2, we will present the two cases that we use
as examples for organizational and social innovations, i.e. the maker movement and repair
cafés. Chapters 3-5 are devoted to present the indicator approaches developed to address
the three elements mentioned above. Chapter 6 elucidates the plausibility of our approach-
es and concludes with next steps which should be taken.
2 Selection of case studies
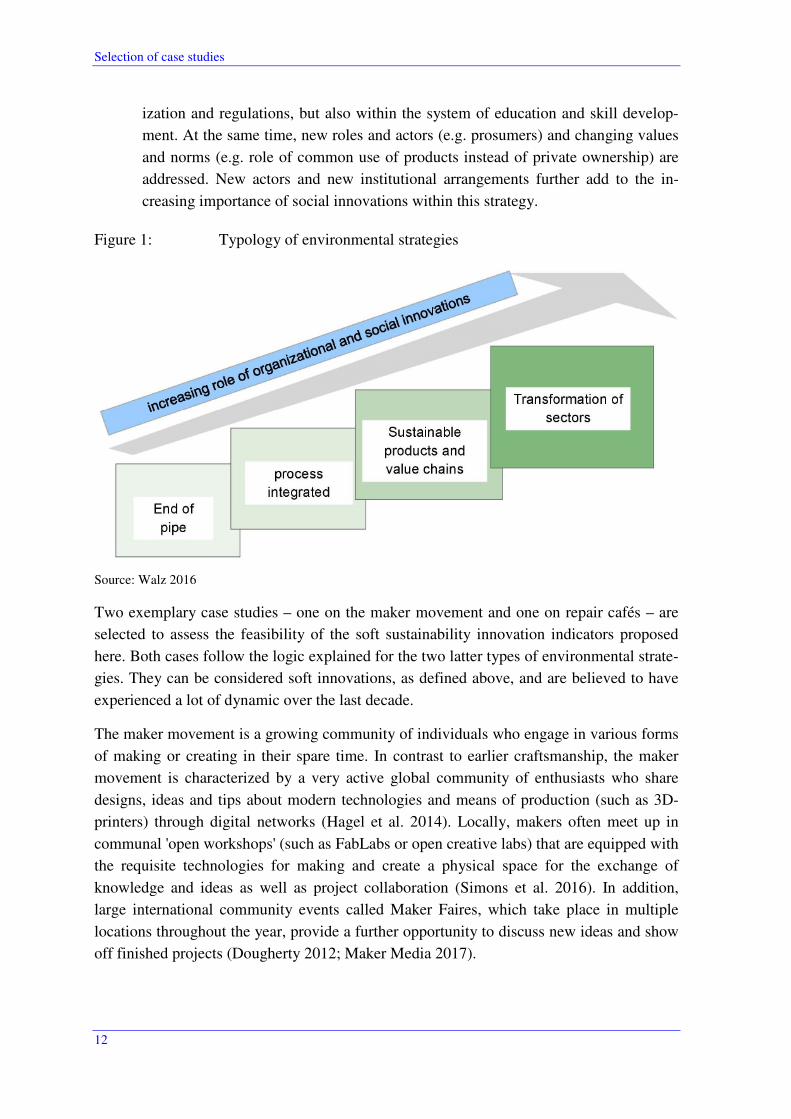
There have been several developments with regard to environmental strategies taking place
over the last two decades. These differences are most pronounced with regard to the role
innovation plays within the different strategies (Figure 1):
• At the beginning of environmental protection, mostly end-of-pipe solutions were
deployed. They do not alter the production process, but are rather add-on technolo-
gies. Thus, the core business of production was not affected by them, and key inno-
vation tasks were the lowering of costs and improvements of emission reduction.
The reduction in pollutants such as SO2-emissions can be attributed to this strategy.
• Process-integrated technologies substitute new, clean technologies for older ones.
They are a technological innovation which, however, does not change the product.
Typical for these strategies are more energy or material efficient processes, or re-
newable energy technologies which allow for substitutions of fossil fuels by renew-
able energy.
• Sustainable products and value chain concepts are characterized by changes across
the entire value chain. This requires communication among manifold actors, and
quite often the development of new business models. With changing product con-
cepts, acceptance and consumer behavior are becoming key issues for these innova-
tions. Organizational and social innovations gain in importance, compared to the
first two strategies.
• The enormous tasks of reaching sustainability have increased the awareness that a
transformation of whole sectors is necessary. Especially in the field of energy, wa-
ter, mobility and materials, there is a need to shift the resource base and to engage
in substantial structural changes of the sector. Such transformations bundle various
forms of the innovation types described above, and require substantial co-evolution
of technologies with surrounding institutions such as sector organizations, standard-
Selection of case studies
12
ization and regulations, but also within the system of education and skill develop-
ment. At the same time, new roles and actors (e.g. prosumers) and changing values
and norms (e.g. role of common use of products instead of private ownership) are
addressed. New actors and new institutional arrangements further add to the in-
creasing importance of social innovations within this strategy.
Figure 1: Typology of environmental strategies
Source: Walz 2016
Two exemplary case studies – one on the maker movement and one on repair cafés – are
selected to assess the feasibility of the soft sustainability innovation indicators proposed
here. Both cases follow the logic explained for the two latter types of environmental strate-
gies. They can be considered soft innovations, as defined above, and are believed to have
experienced a lot of dynamic over the last decade.
The maker movement is a growing community of individuals who engage in various forms
of making or creating in their spare time. In contrast to earlier craftsmanship, the maker
movement is characterized by a very active global community of enthusiasts who share
designs, ideas and tips about modern technologies and means of production (such as 3D-
printers) through digital networks (Hagel et al. 2014). Locally, makers often meet up in
communal 'open workshops' (such as FabLabs or open creative labs) that are equipped with
the requisite technologies for making and create a physical space for the exchange of
knowledge and ideas as well as project collaboration (Simons et al. 2016). In addition,
large international community events called Maker Faires, which take place in multiple
locations throughout the year, provide a further opportunity to discuss new ideas and show
off finished projects (Dougherty 2012; Maker Media 2017).
Selection of case studies
13
A number of current research projects1 examine whether and to what degree the maker
movement contributes to greater sustainability. While research is ongoing, preliminary
results show that the movement has significant potential to increase sustainability, for ex-
ample by reducing waste, producing on-demand replacement parts for repairs and encour-
aging reuse and upcycling, as well as increasing awareness and discussion of environmen-
tal sustainability issues among participants (Kohtala, Hyysalo 2015; Zirngiebl 2017; Unter-
frauner et al. 2017). However, researchers also point out that the movement is highly het-
erogeneous and not all local maker spaces or individual participants are sustainability-
minded (Kohtala, Hyysalo 2015; Unterfrauner et al. 2017). To what degree the maker
movement is able to contribute to increased sustainability therefore still remains to be seen.
The concept of repair cafés originated in 2009 in the Netherlands and describes public
meetings in which volunteers with some expertise in repairing help visitors to fix broken
objects, often including electronics, household appliances, clothing and bicycles (Stiftungs-
gemeinschaft anstiftung & erthomis gGmbH 2015; Simons et al. 2016). The aims of the
repair café movement include a reduction in waste and a change away from the "throwa-
way culture" as well as fostering a sense of community and upholding and passing along
repair skills (Simons et al. 2016). There are two large umbrella organizations that most
European repair cafés belong to, the Dutch Repair Café Foundation2, which includes 1291
repair cafés, and the German Netzwerk Reparatur-Initiative3, which lists 534 initiatives (as
of June 2017, likely some overlap). In 2015, the Repair Café Foundation began a coopera-
tion with iFixit Europe, "a free, publicly editable online repair manual with a mission to
empower people to fix their stuff" (Repair Café International Foundation 2015).
Based on wide-ranging international survey results, almost all repair café participants cite
environmental sustainability and the desire to encourage others to repair as their biggest
motivations for participation in the movement (Charter, Keiller 2016, p. 4). First attempts
have also been made to quantify the contribution of repair cafés to reducing waste. For
example, the Dutch foundation Repair Café International estimated that in 2016 alone, the
almost 1200 repair cafés known to them prevented approximately 250,000 kg of waste
(Repair Café International Foundation 2017), thus extending product lifecycles and provid-
ing a viable alternative to the 'throwaway society'.
1 See for example the projects MAKE-IT (http://make-it.io/) and COWERK (http://www.cowerk.org).
2 https://repaircafe.org/en/.
3 https://www.reparatur-initiativen.de/.
Analysis of public attention
14
3 Analysis of public attention
As already discussed in the introduction, we start from the notion that organizational and
social innovations are multi-faceted and we have to look into three elements in order to
address organizational and social innovations for sustainability. The first element is the
analysis of public attention that we will discuss in the following. In detail, we present two
separate indicators of public attention. Chapter 3.1 focuses on media coverage, while
Chapter 3.2 analyses search behavior on the Internet using Google Trends analyses.
3.1 LexisNexis
In democratic societies, the media is a primary vehicle of public communication and, as
such, agenda-setting in society. Media coverage of a topic is therefore an appropriate indi-
cator for public issue-attention and following the work of Newig (2004), we will measure
the level of media coverage as the number of articles on a specific topic per year.
3.1.1 Data source
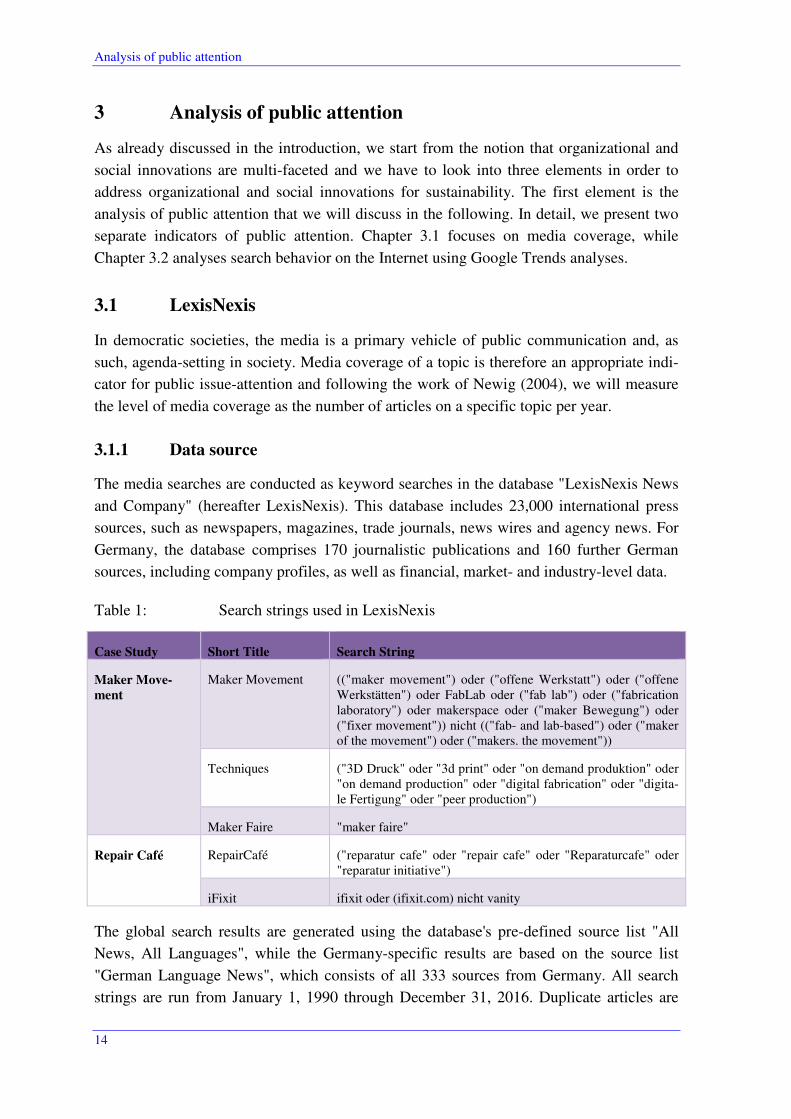
The media searches are conducted as keyword searches in the database "LexisNexis News
and Company" (hereafter LexisNexis). This database includes 23,000 international press
sources, such as newspapers, magazines, trade journals, news wires and agency news. For
Germany, the database comprises 170 journalistic publications and 160 further German
sources, including company profiles, as well as financial, market- and industry-level data.
Table 1: Search strings used in LexisNexis
Case Study Short Title Search String
Maker Move-
ment
Maker Movement (("maker movement") oder ("offene Werkstatt") oder ("offene Werkstätten") oder FabLab oder ("fab lab") oder ("fabrication laboratory") oder makerspace oder ("maker Bewegung") oder ("fixer movement")) nicht (("fab- and lab-based") oder ("maker of the movement") oder ("makers. the movement"))
Techniques ("3D Druck" oder "3d print" oder "on demand produktion" oder "on demand production" oder "digital fabrication" oder "digita-le Fertigung" oder "peer production")
Maker Faire "maker faire"
Repair Café RepairCafé ("reparatur cafe" oder "repair cafe" oder "Reparaturcafe" oder "reparatur initiative")
iFixit ifixit oder (ifixit.com) nicht vanity
The global search results are generated using the database's pre-defined source list "All
News, All Languages", while the Germany-specific results are based on the source list
"German Language News", which consists of all 333 sources from Germany. All search
strings are run from January 1, 1990 through December 31, 2016. Duplicate articles are
Analysis of public attention
15
counted multiple times, since the diffusion of a single article through multiple sources in-
creases the size of the readership and thus the potential for public awareness.
The analysis includes four search strings regarding the 'maker movement' and two search
strings about repair cafés. The search strings, shown in Table 1, are each made up of mul-
tiple keywords drawn from background research on the two case studies (see Chapter 2).
As Lacy et al. (2015) point out, the use of single-keyword searches can lead to imprecise
results and be tainted by the researcher's bias. By combining a series of literature-based
keywords into search strings, the search validity is increased.
The search strings were created in an iterative process using Boolean search operators.
Manual spot-checks were used to check for precision, i.e. the relevance of articles found
(Stryker et al. 2016). Where necessary and possible, the operator AND NOT was used to
exclude obviously irrelevant search results. However, for some plausible search terms it
was not possible to delimit the searches appropriately, either because the terms were too
general, such as "ready-to-print design" or because they had too many alternate meanings,
like "prosumer" and "mass collaboration". These terms were therefore not included in the
search strings.
3.1.2 Advantages and disadvantages of LexisNexis
The analysis of public attention using media coverage as a proxy has a series of advantages
over other methods of measurement. First, it is widely applicable to any topic of interest
and comparatively cheap and efficient. In contrast to other methods of measuring public
attention, such as polls or surveys, there are no inherent limits to the issues that can be
quickly and easily analyzed using media coverage. Search strings on any topic can be used
without the added cost and time otherwise necessary to design and carry out large-scale
data collection projects, since newspaper archives present a readily available data set of
enormous size (Newig 2004).
Second, using searches in a large database like LexisNexis, rather than searching through
the archives of individual archives is both more time- and cost-efficient and more likely to
catch innovative issues early on. Reporting on innovations may only reach major, large-
scale newspapers once they have reached a more advanced degree of diffusion, whereas
smaller local newspapers or industry-specific magazines may write about them at a much
earlier stage.
Analysis of public attention
16
Third, media analyses allow for the creation of both historical and current time series on
any issue of interest, allowing for a quickly accessible overview of the development of the
level of public attention to any topic over a broad range of time. The database LexisNexis
is updated daily, although the historical coverage of the included sources is strongly varia-
ble.4 Because the database is updated daily, another big advantage of the LexisNexis
search is that, if requested, the data can be analyzed on a daily basis. As a consequence,
daily peaks can be identified and conclusions on specific events - that might also influence
the results of the search - can be drawn. Though this is not in the focus of the current study,
it might serve as an interesting starting point for other analyses.
Finally, a comparison of public attention in different countries to a particular issue can be
created by carrying out searches using country-specific sources only, as was done exem-
plarily in this study for Germany. An overview of the number of sources available in Lex-
isNexis for selected countries can be found in Table 13 (see Annex).
The interplay of these advantages allows this methodology to be applied particularly well
to issues that are still in the early stages of development: "Polls, by contrast, most often
only cover issues already ‘established’, thereby excluding the most sensitive first stages of
attention cycles" (Newig 2004, p. 159). Yet an early identification of soft innovations is
key in the context of socially desirable sustainability innovations, since these should be
identified and fostered early on to ensure their diffusion to a larger scale.
Nevertheless, there are also a number of disadvantages to using LexisNexis as the basis for
media coverage and public attention analysis that should be taken into consideration when
interpreting the results. The most critical of these are the possible biases inherent in con-
ducting searches in any database with limited sources. While LexisNexis at present in-
cludes over 23,000 international press sources, not all of these sources provide the same
historical coverage. For example, while some sources extend quite far back in the database
(Washington Post: 1977; The New York Times: 1980; Neue Zürcher Zeitung: 1993;
Süddeutsche Zeitung: 1994), others have only been added quite recently and provide much
less coverage (such as Die Zeit: 2008; Financial Times Daily: 2013; BILD: 2017).5
4 This issue and its implications are discussed in greater detail below.
5 While it is possible to ascertain the historical coverage of each individual source, LexisNexis unfortu-nately cannot provide summary details of how many sources are available for each year in the past. Given the large number of available sources, checking each source individually to reach a total per year is not economically feasible.
Analysis of public attention
17
Similarly, while the database covers native-language publications for many European and
North American countries, its coverage is less extensive for other areas of the world, in
particular Asian languages (see Annex 1). This problem is addressed to some degree by the
inclusion of local English-language newspapers, such as the The Japan News, which is
published by the most high-circulation newspaper of the world The Yomiuri Shimbun and
includes translations of its Japanese articles. Given that most research cannot be conducted
in dozens of translations, however, the inclusion of many local English-language newspa-
pers can also be seen as an advantage, since they allow searching at least some local cover-
age for most countries.
Finally, some issues, including certain types of soft innovations, are difficult to capture
adequately in keywords. This can be the case when relevant keywords are not distinct or
unambiguous enough, such as "prosumer" and "ready-to-print design" in this case study
(see Chapter 3.1.1). Related to this are questions of recall and precision: recall is a search
string's "ability to accurately call up items of interest," while precision refers to the rele-
vance of articles found (Stryker et al. 2016, p. 413). In theory, both measures can be quan-
tified for the use in statistical analyses (see e.g. Lacy et al. 2015). However, to achieve an
accurate measure, all search results would need to be manually coded, which is a very
time-consuming and involved process that is not realistic for large numbers of search re-
sults.
3.1.3 Results from LexisNexis
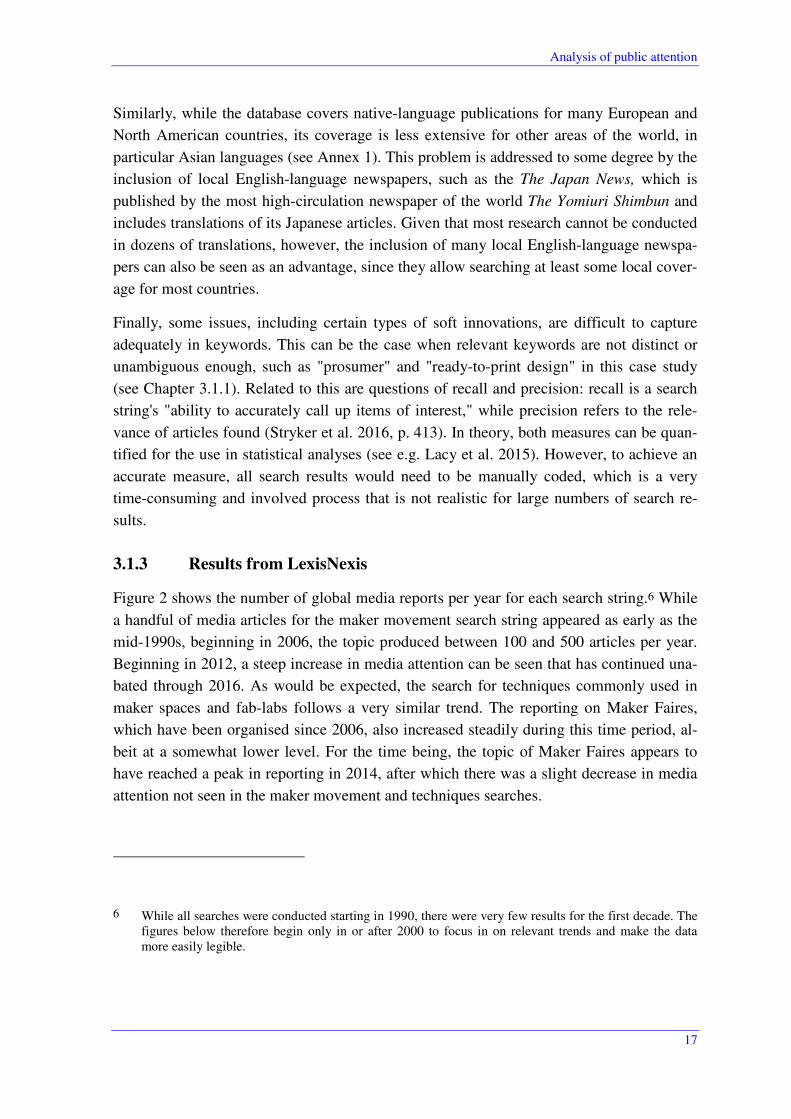
Figure 2 shows the number of global media reports per year for each search string.6 While
a handful of media articles for the maker movement search string appeared as early as the
mid-1990s, beginning in 2006, the topic produced between 100 and 500 articles per year.
Beginning in 2012, a steep increase in media attention can be seen that has continued una-
bated through 2016. As would be expected, the search for techniques commonly used in
maker spaces and fab-labs follows a very similar trend. The reporting on Maker Faires,
which have been organised since 2006, also increased steadily during this time period, al-
beit at a somewhat lower level. For the time being, the topic of Maker Faires appears to
have reached a peak in reporting in 2014, after which there was a slight decrease in media
attention not seen in the maker movement and techniques searches.
6 While all searches were conducted starting in 1990, there were very few results for the first decade. The figures below therefore begin only in or after 2000 to focus in on relevant trends and make the data more easily legible.
Analysis of public attention
18
Reporting on repair cafés increased slowly until 2012 and as steeply as that on the maker
movement and associated techniques beginning in 2013. Media attention in 2016 increased
only very slightly as compared to 2015. News on iFixit, finally, picked up beginning in
2010, but has increased much more slowly than the other topics.
Figure 2: Number of global media reports per year and search string
Source: LexisNexis, queries and calculations by Fraunhofer ISI
Looking at the two case studies as a whole, it is clear that there has been a strong increase
in media interest in both the maker and repair café movements beginning in 2011/2012. In
terms of absolute numbers, the maker movement has received more attention than the re-
pair café movement, although interest in this area also started a few years before the repair
café movement began, so that the difference in absolute numbers may result from this tem-
poral lead.
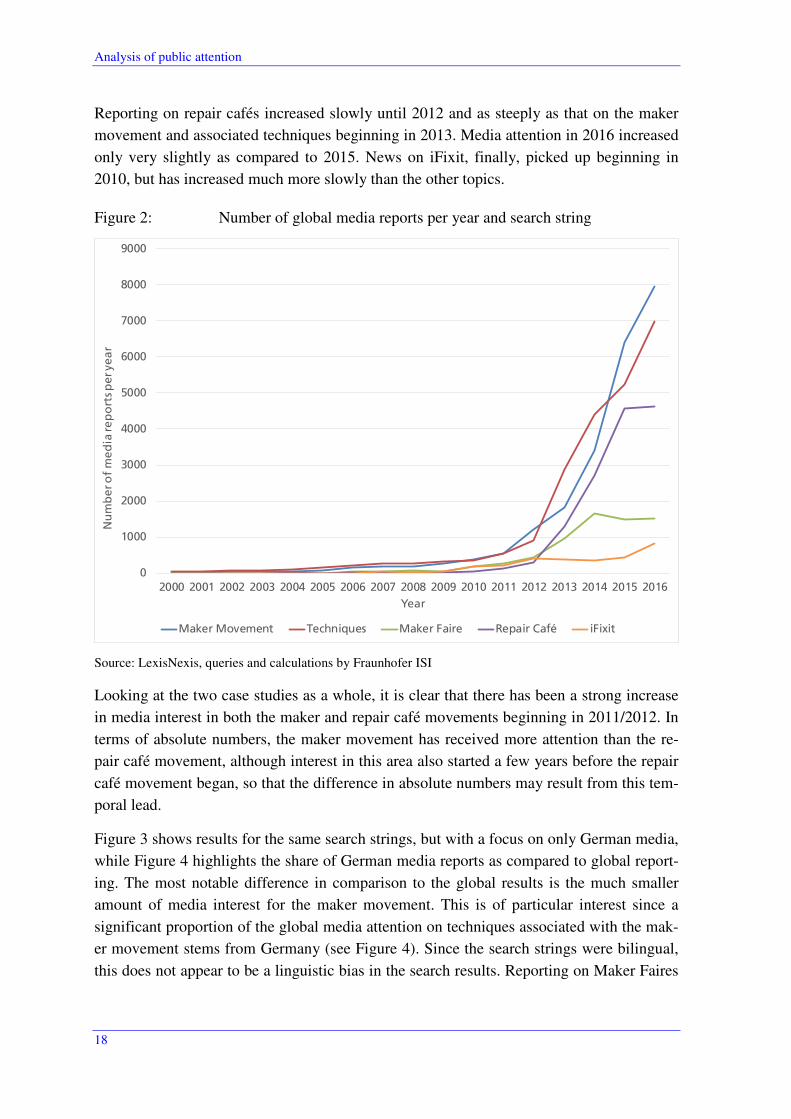
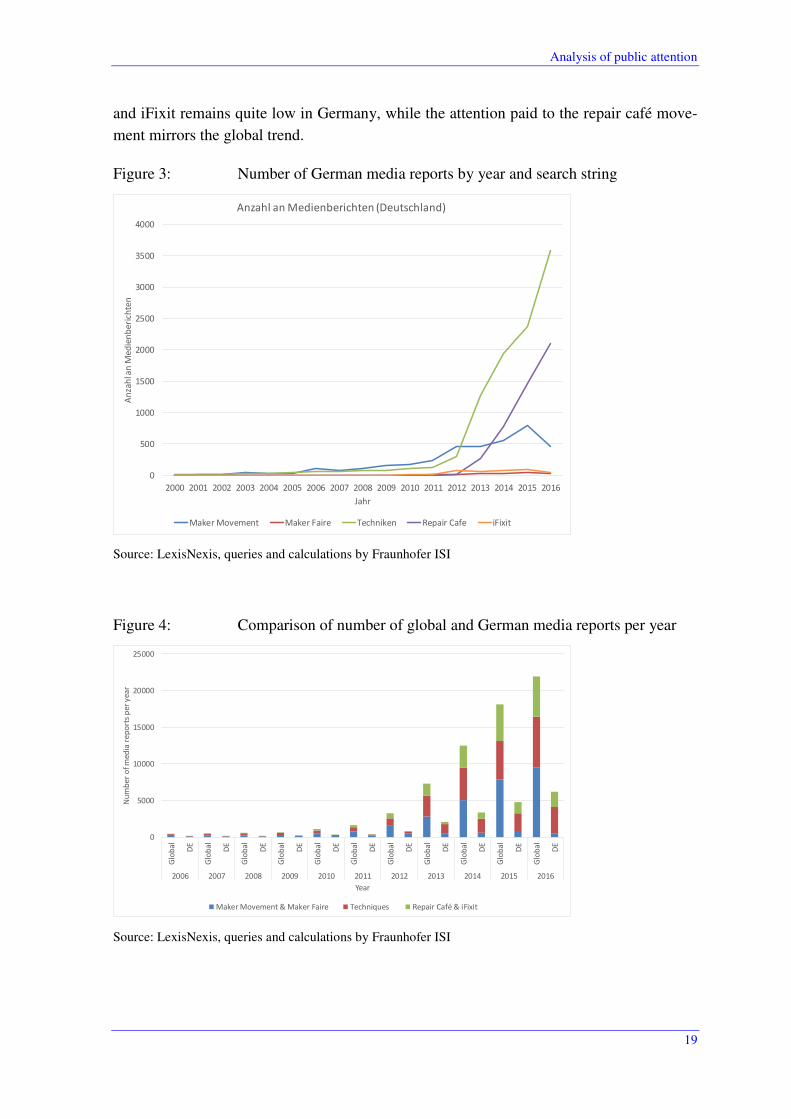
Figure 3 shows results for the same search strings, but with a focus on only German media,
while Figure 4 highlights the share of German media reports as compared to global report-
ing. The most notable difference in comparison to the global results is the much smaller
amount of media interest for the maker movement. This is of particular interest since a
significant proportion of the global media attention on techniques associated with the mak-
er movement stems from Germany (see Figure 4). Since the search strings were bilingual,
this does not appear to be a linguistic bias in the search results. Reporting on Maker Faires
0
1000
2000
3000
4000
5000
6000
7000
8000
9000
2000 2001 2002 2003 2004 2005 2006 2007 2008 2009 2010 2011 2012 2013 2014 2015 2016
Nu
mb
er o
f m
ed
ia re
po
rts p
er ye
ar
Year
Maker Movement Techniques Maker Faire Repair Café iFixit
Analysis of public attention
19
and iFixit remains quite low in Germany, while the attention paid to the repair café move-
ment mirrors the global trend.
Figure 3: Number of German media reports by year and search string
Source: LexisNexis, queries and calculations by Fraunhofer ISI
Figure 4: Comparison of number of global and German media reports per year
Source: LexisNexis, queries and calculations by Fraunhofer ISI
0
500
1000
1500
2000
2500
3000
3500
4000
2000 2001 2002 2003 2004 2005 2006 2007 2008 2009 2010 2011 2012 2013 2014 2015 2016
An
zah
l an
Me
die
nb
eri
chte
n
Jahr
Anzahl an Medienberichten (Deutschland)
Maker Movement Maker Faire Techniken Repair Cafe iFixit
0
5000
10000
15000
20000
25000
Glo
ba
l
DE
Glo
ba
l
DE
Glo
ba
l
DE
Glo
ba
l
DE
Glo
ba
l
DE
Glo
ba
l
DE
Glo
ba
l
DE
Glo
ba
l
DE
Glo
ba
l
DE
Glo
ba
l
DE
Glo
ba
l
DE
2006 2007 2008 2009 2010 2011 2012 2013 2014 2015 2016
Nu
mb
er
of
me
dia
re
po
rts
pe
r y
ea
r
Year
Maker Movement & Maker Faire Techniques Repair Café & iFixit

Analysis of public attention
20
3.1.4 Conclusions and feasibility
The results presented in Chapter 3.1.3 show that media coverage, and consequently public
awareness, to the maker and repair movements has grown significantly since 2011. Global-
ly, the coverage of the maker movement has outpaced that of the repair movement, while
in Germany, both repair cafés and techniques associated with the maker movement, but not
the maker movement itself, have been particularly dominant.
More generally, the LexisNexis results show that these soft innovations are currently on
the rise, although both are certainly still niche phenomena. To date, it is not possible to tell
whether this increase in media coverage is a temporary hype associated with the novelty of
the movements, or whether public interest in these innovations will continue to stay high
over a longer period of time. However, insofar as there is interest from a political point of
view to promote these soft innovations further in support of sustainability, it may be con-
ducive to do so while public attention to them is high.
In terms of feasibility, we find that the advantages of conducting media coverage searches
with LexisNexis as a proxy for public attention outweigh the disadvantages overall. The
range of topics that can be examined is almost limitless, the range of sources - particularly
for more recent years - is extensive and the geographic coverage is considerable. Neverthe-
less, the limits of the methodology explained in Chapter 3.1.2 need to be kept in mind
when interpreting the results.
3.2 Google Trends
In the preceding chapter, we analyzed public attention with regard to the maker movement
and repair cafés based on LexisNexis, i.e. international press sources such as newspapers
etc. were at the foreground. What was not taken into account, however, is the Internet as a
potential source for analyzing public attention with regard to a given topic. This will be the
focus of the following chapter by analyzing "Google Trends".
"Google Trends" (or Trends) is a tool set up and maintained by Google, which allows the
user to assess the number of search queries that the public has performed with regard to a
given search term at a certain point in time and at a given location (countries, partly re-
gional level). It therefore mirrors trends in Internet search activity (Ripberger 2011). In
contrast to the analysis of classic press sources via LexisNexis, where an author writes
about a certain topic that is in the interest of the public, Google Trends enables researchers
to directly assess what raised people's attention at a given point in time. Yet, this also
comes with certain limitations and drawbacks that will be discussed in section 3.2.2. Be-
fore discussing the advantages and disadvantages of the method, however, we will first of
all describe the data source and its potential. We will then provide an analysis on the public
interest regarding the maker movement and repair cafés analogously to the analysis of Lex-
isNexis. In a final step, we will discuss the feasibility of the approach for further studies.
Analysis of public attention
21
3.2.1 Data source
As already stated above, Google Trends delivers insights on the amount of searches with
regard to a given search term. The amount of searches can be analyzed over time, back to
the year 2004 (in daily windows). Google Trends also allows the user to differentiate the
analyses by country and category, which enables country comparisons and comparisons
across categories.7
Google Trends is an unbiased sample of Google search data8. Yet, only a percentage of
searches is used to compile the Trends data. There is a difference between real time data
and non-real time data (Google 2017), while we only focused on non-real time data for
comparisons over time:
• real time data is a random sample of searches from the last seven days.
• Non-real time data is a random sample of Google search data that range back until
2004 and up to 36 hours prior to the search.
After collecting the search data, Google categorizes it and removes any personal infor-
mation. Searches made by very few people9, repeated searches from the same person over
a short period of time (duplicate searches) and searches with special characters are exclud-
ed from the Trends analysis.
Afterwards, Google Trends adjusts search data proportionate to the time and location of a
query by dividing each data point by the total searches of the geography and time range it
represents, i.e. a "relative popularity" is estimated. The resulting figures are then scaled on
a range of 0 to 100 (based on a topic’s proportion to all searches on all topics). The values
thus indicate the search interest relative to the highest point in the graph for the selected
region in the specified period. The value of 100 stands for the highest popularity of this
search term. The value 50 means that the term was half as popular and the value 0 corre-
sponds to a popularity of less than 1% compared to the maximum value (Google 2017).
7 Google uses its own category system, e.g. "arts & entertainment", "autos & vehicles", "beauty and fit-ness" etc., to search by category. Unfortunately, this system does not follow other standardized classifi-cation systems. In addition, there is no further information on how these categories are formed, which sub-categories exist etc. We therefore did not apply the category system as it might limit our results to a subset that is out of our control.
8 This and the following information has been taken from the Google Trends Help Center available at: https://support.google.com/trends/?hl=en#topic=6248052, last accessed: 08/10/2017.
9 In case there are too few Google search queries for a given search term. Trends will not display any results.
Analysis of public attention
22
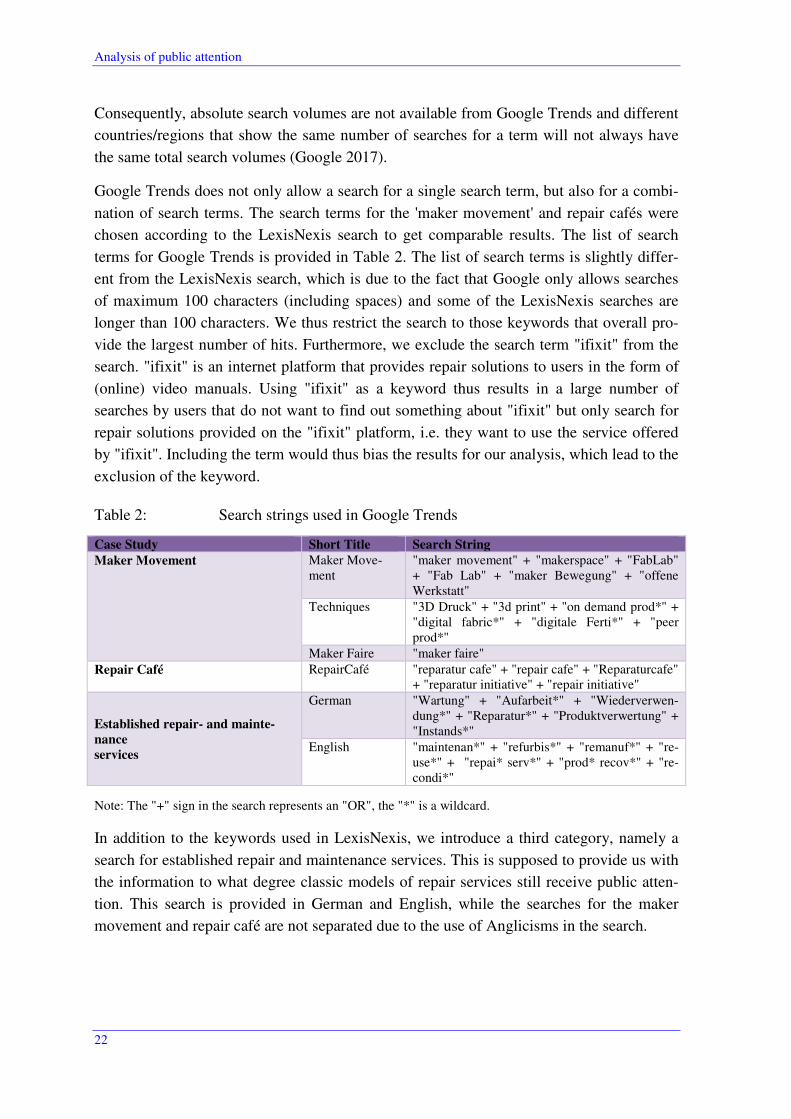
Consequently, absolute search volumes are not available from Google Trends and different
countries/regions that show the same number of searches for a term will not always have
the same total search volumes (Google 2017).
Google Trends does not only allow a search for a single search term, but also for a combi-
nation of search terms. The search terms for the 'maker movement' and repair cafés were
chosen according to the LexisNexis search to get comparable results. The list of search
terms for Google Trends is provided in Table 2. The list of search terms is slightly differ-
ent from the LexisNexis search, which is due to the fact that Google only allows searches
of maximum 100 characters (including spaces) and some of the LexisNexis searches are
longer than 100 characters. We thus restrict the search to those keywords that overall pro-
vide the largest number of hits. Furthermore, we exclude the search term "ifixit" from the
search. "ifixit" is an internet platform that provides repair solutions to users in the form of
(online) video manuals. Using "ifixit" as a keyword thus results in a large number of
searches by users that do not want to find out something about "ifixit" but only search for
repair solutions provided on the "ifixit" platform, i.e. they want to use the service offered
by "ifixit". Including the term would thus bias the results for our analysis, which lead to the
exclusion of the keyword.
Table 2: Search strings used in Google Trends
Case Study Short Title Search String
Maker Movement Maker Move-ment
"maker movement" + "makerspace" + "FabLab" + "Fab Lab" + "maker Bewegung" + "offene Werkstatt"
Techniques "3D Druck" + "3d print" + "on demand prod*" + "digital fabric*" + "digitale Ferti*" + "peer prod*"
Maker Faire "maker faire" Repair Café RepairCafé "reparatur cafe" + "repair cafe" + "Reparaturcafe"
+ "reparatur initiative" + "repair initiative"
Established repair- and mainte-
nance
services
German "Wartung" + "Aufarbeit*" + "Wiederverwen-dung*" + "Reparatur*" + "Produktverwertung" + "Instands*"
English "maintenan*" + "refurbis*" + "remanuf*" + "re-use*" + "repai* serv*" + "prod* recov*" + "re-condi*"
Note: The "+" sign in the search represents an "OR", the "*" is a wildcard.
In addition to the keywords used in LexisNexis, we introduce a third category, namely a
search for established repair and maintenance services. This is supposed to provide us with
the information to what degree classic models of repair services still receive public atten-
tion. This search is provided in German and English, while the searches for the maker
movement and repair café are not separated due to the use of Anglicisms in the search.
Analysis of public attention
23
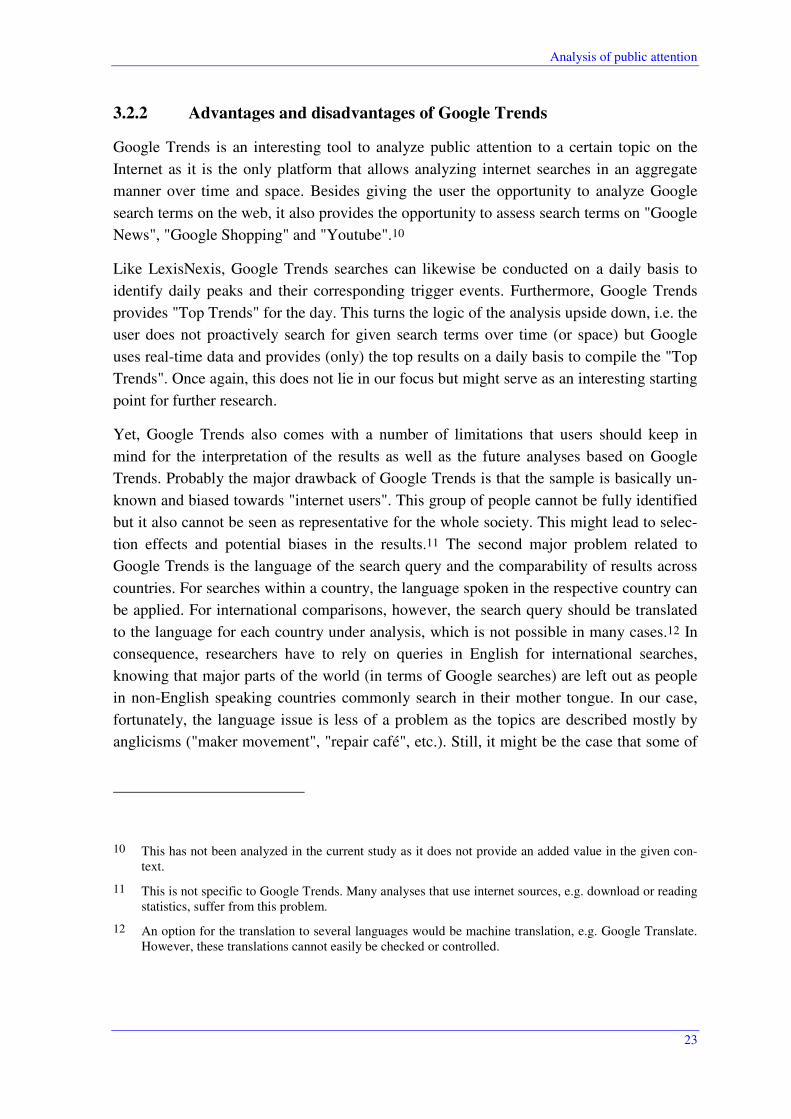
3.2.2 Advantages and disadvantages of Google Trends
Google Trends is an interesting tool to analyze public attention to a certain topic on the
Internet as it is the only platform that allows analyzing internet searches in an aggregate
manner over time and space. Besides giving the user the opportunity to analyze Google
search terms on the web, it also provides the opportunity to assess search terms on "Google
News", "Google Shopping" and "Youtube".10
Like LexisNexis, Google Trends searches can likewise be conducted on a daily basis to
identify daily peaks and their corresponding trigger events. Furthermore, Google Trends
provides "Top Trends" for the day. This turns the logic of the analysis upside down, i.e. the
user does not proactively search for given search terms over time (or space) but Google
uses real-time data and provides (only) the top results on a daily basis to compile the "Top
Trends". Once again, this does not lie in our focus but might serve as an interesting starting
point for further research.
Yet, Google Trends also comes with a number of limitations that users should keep in
mind for the interpretation of the results as well as the future analyses based on Google
Trends. Probably the major drawback of Google Trends is that the sample is basically un-
known and biased towards "internet users". This group of people cannot be fully identified
but it also cannot be seen as representative for the whole society. This might lead to selec-
tion effects and potential biases in the results.11 The second major problem related to
Google Trends is the language of the search query and the comparability of results across
countries. For searches within a country, the language spoken in the respective country can
be applied. For international comparisons, however, the search query should be translated
to the language for each country under analysis, which is not possible in many cases.12 In
consequence, researchers have to rely on queries in English for international searches,
knowing that major parts of the world (in terms of Google searches) are left out as people
in non-English speaking countries commonly search in their mother tongue. In our case,
fortunately, the language issue is less of a problem as the topics are described mostly by
anglicisms ("maker movement", "repair café", etc.). Still, it might be the case that some of
10 This has not been analyzed in the current study as it does not provide an added value in the given con-text.
11 This is not specific to Google Trends. Many analyses that use internet sources, e.g. download or reading statistics, suffer from this problem.
12 An option for the translation to several languages would be machine translation, e.g. Google Translate. However, these translations cannot easily be checked or controlled.
Analysis of public attention
24
these Anglicism are not used in English-speaking areas, which might induce another bias.
We will come back to that later with an example in the analysis. The third drawback of
Google Trends is that only Google searches are taken into account, while searches on other
platforms are neglected. This might lead to another bias as Google as a search engine
might be used more often in one country than another.
Fourth, there are a number of limitations that are directly related to the Google Trends plat-
form that has to be used for the searches. One major drawback is that the search is limited
to 100 characters. Large queries with many keywords thus cannot be performed. Second,
there is no clear information on how searches are counted and normalized. The normaliza-
tion further leads to the fact that the results of the analyses cannot be compared across
searches. Third, only single graphs (and underlying data in .csv form) can be downloaded
from the platform. Finally, the category classification that Google uses does not follow any
international standard.
In sum, Google Trends offers a unique analytical potential as it allows the analysis of
search trends on a large scale basis, which can be used to capture public attention towards
a given topic. Yet, there are biases with regard to sampling (sample of "internet users",
language, Google usage in the respective countries) that have to be kept in mind for the
interpretation of the results. Furthermore, Google Trends only offers limited potential to
adjust searches and adapt the outcome of the search and the normalization limits the ana-
lytical breadth and flexibility with regard to more detailed and comparative analyses.
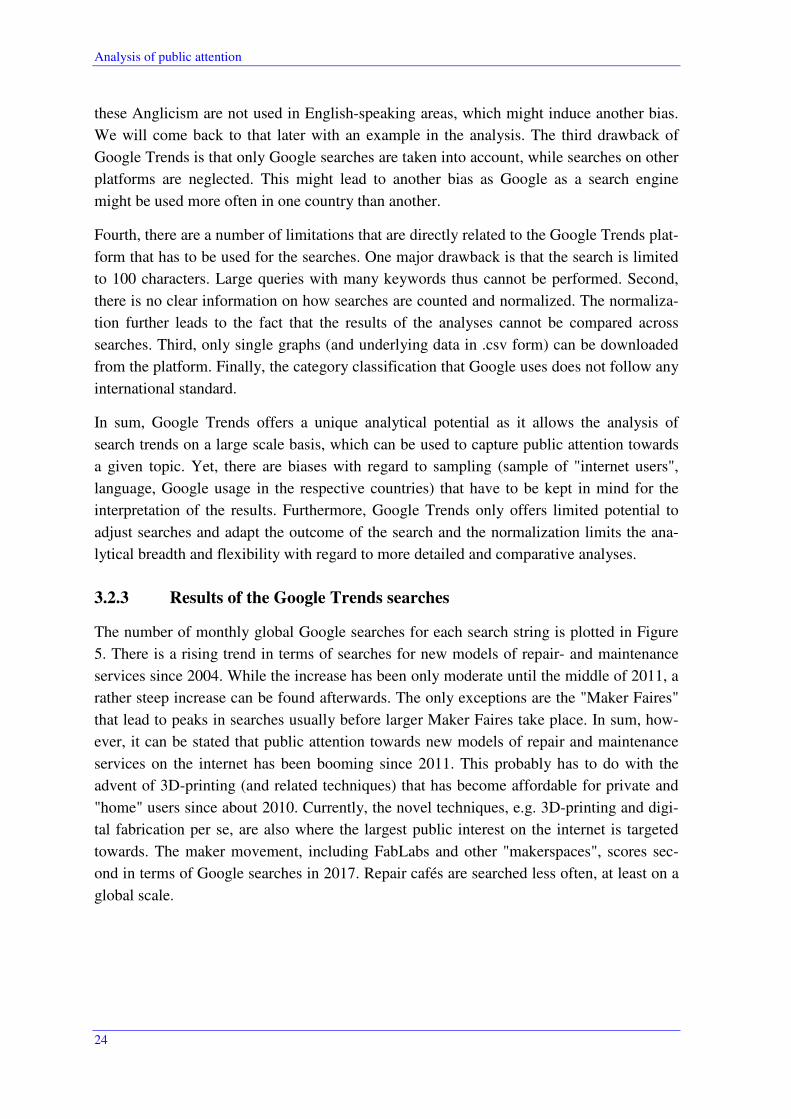
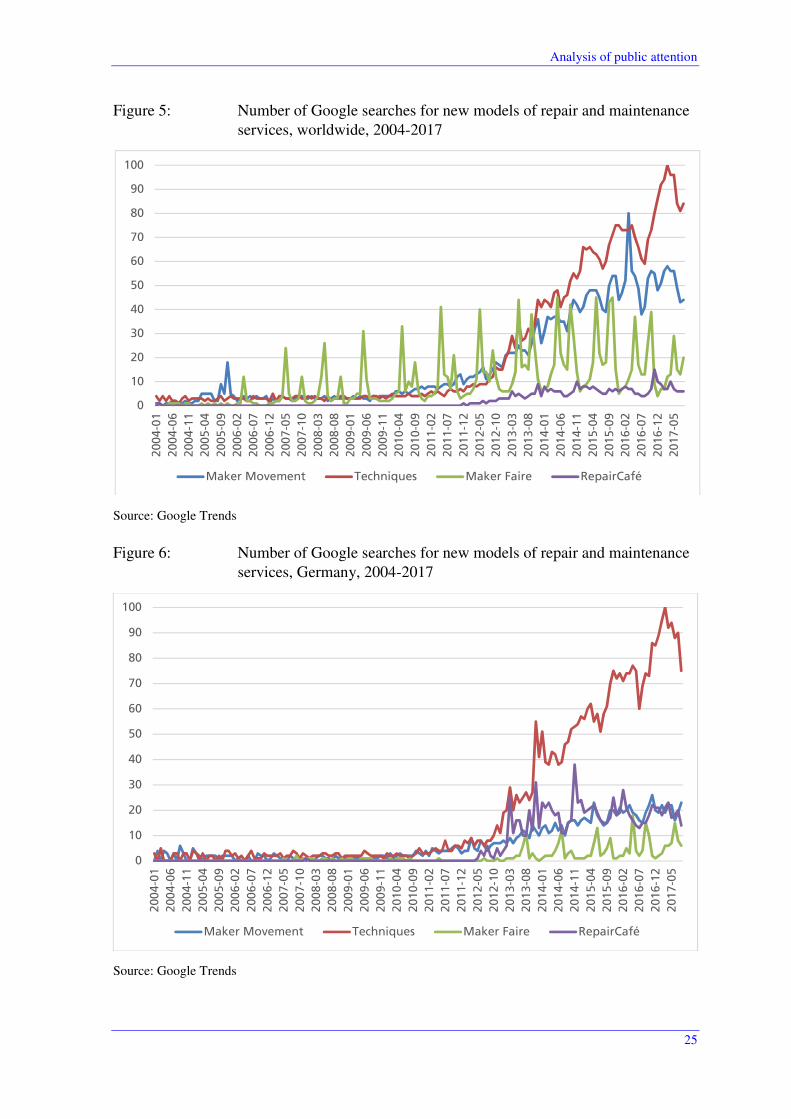
3.2.3 Results of the Google Trends searches
The number of monthly global Google searches for each search string is plotted in Figure
5. There is a rising trend in terms of searches for new models of repair- and maintenance
services since 2004. While the increase has been only moderate until the middle of 2011, a
rather steep increase can be found afterwards. The only exceptions are the "Maker Faires"
that lead to peaks in searches usually before larger Maker Faires take place. In sum, how-
ever, it can be stated that public attention towards new models of repair and maintenance
services on the internet has been booming since 2011. This probably has to do with the
advent of 3D-printing (and related techniques) that has become affordable for private and
"home" users since about 2010. Currently, the novel techniques, e.g. 3D-printing and digi-
tal fabrication per se, are also where the largest public interest on the internet is targeted
towards. The maker movement, including FabLabs and other "makerspaces", scores sec-
ond in terms of Google searches in 2017. Repair cafés are searched less often, at least on a
global scale.
Analysis of public attention
25
Figure 5: Number of Google searches for new models of repair and maintenance services, worldwide, 2004-2017
Source: Google Trends
Figure 6: Number of Google searches for new models of repair and maintenance services, Germany, 2004-2017
Source: Google Trends
0
10
20
30
40
50
60
70
80
90
1002
00
4-0
1
200
4-0
6
200
4-1
1
200
5-0
4
200
5-0
9
200
6-0
2
200
6-0
7
200
6-1
2
200
7-0
5
200
7-1
0
200
8-0
3
200
8-0
8
200
9-0
1
200
9-0
6
200
9-1
1
201
0-0
4
201
0-0
9
201
1-0
2
201
1-0
7
201
1-1
2
201
2-0
5
201
2-1
0
201
3-0
3
201
3-0
8
201
4-0
1
201
4-0
6
201
4-1
1
201
5-0
4
201
5-0
9
201
6-0
2
201
6-0
7
201
6-1
2
201
7-0
5
Maker Movement Techniques Maker Faire RepairCafé
0
10
20
30
40
50
60
70
80
90
100
200
4-0
1
200
4-0
6
200
4-1
1
200
5-0
4
200
5-0
9
200
6-0
2
200
6-0
7
200
6-1
2
200
7-0
5
200
7-1
0
200
8-0
3
200
8-0
8
200
9-0
1
200
9-0
6
200
9-1
1
201
0-0
4
201
0-0
9
201
1-0
2
201
1-0
7
201
1-1
2
201
2-0
5
201
2-1
0
201
3-0
3
201
3-0
8
201
4-0
1
201
4-0
6
201
4-1
1
201
5-0
4
201
5-0
9
201
6-0
2
201
6-0
7
201
6-1
2
201
7-0
5
Maker Movement Techniques Maker Faire RepairCafé
Analysis of public attention
26
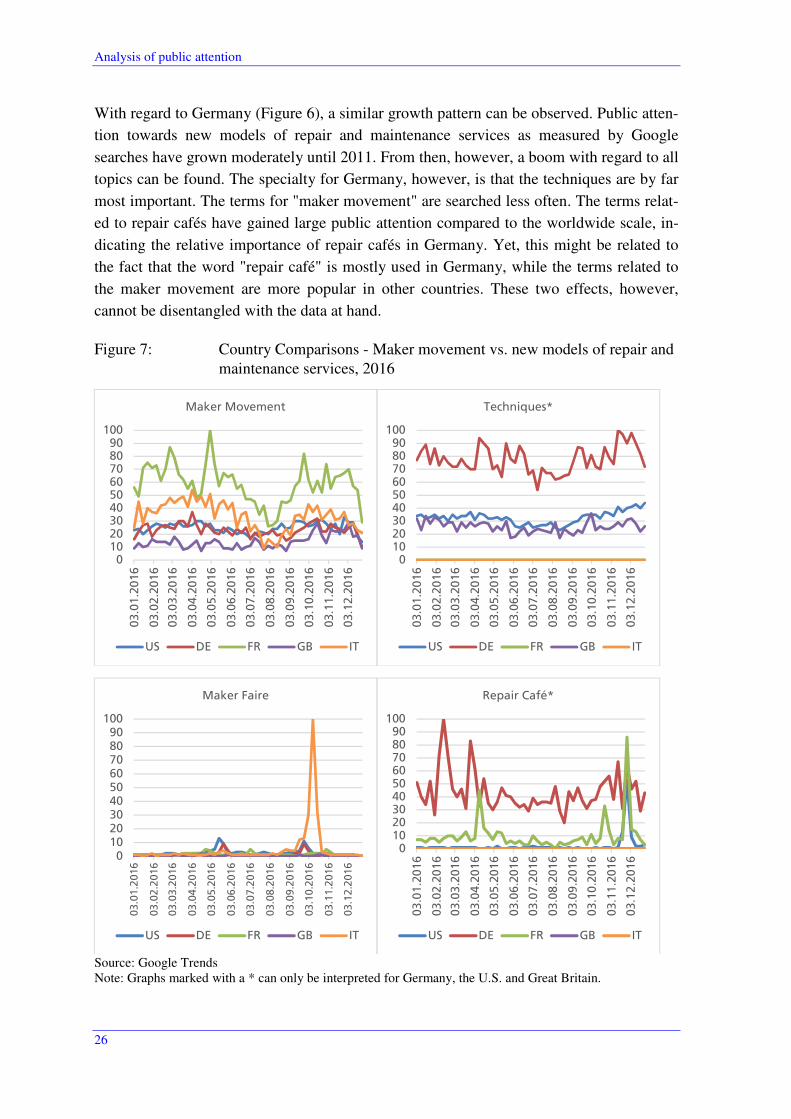
With regard to Germany (Figure 6), a similar growth pattern can be observed. Public atten-
tion towards new models of repair and maintenance services as measured by Google
searches have grown moderately until 2011. From then, however, a boom with regard to all
topics can be found. The specialty for Germany, however, is that the techniques are by far
most important. The terms for "maker movement" are searched less often. The terms relat-
ed to repair cafés have gained large public attention compared to the worldwide scale, in-
dicating the relative importance of repair cafés in Germany. Yet, this might be related to
the fact that the word "repair café" is mostly used in Germany, while the terms related to
the maker movement are more popular in other countries. These two effects, however,
cannot be disentangled with the data at hand.
Figure 7: Country Comparisons - Maker movement vs. new models of repair and maintenance services, 2016
Source: Google Trends Note: Graphs marked with a * can only be interpreted for Germany, the U.S. and Great Britain.
0102030405060708090
100
03.0
1.2
01
6
03.0
2.2
01
6
03.0
3.2
01
6
03.0
4.2
01
6
03.0
5.2
01
6
03.0
6.2
01
6
03.0
7.2
01
6
03.0
8.2
01
6
03.0
9.2
01
6
03.1
0.2
01
6
03.1
1.2
01
6
03.1
2.2
01
6
Maker Movement
US DE FR GB IT
0102030405060708090
1000
3.0
1.2
01
6
03.0
2.2
01
6
03.0
3.2
01
6
03.0
4.2
01
6
03.0
5.2
01
6
03.0
6.2
01
6
03.0
7.2
01
6
03.0
8.2
01
6
03.0
9.2
01
6
03.1
0.2
01
6
03.1
1.2
01
6
03.1
2.2
01
6
Techniques*
US DE FR GB IT
0102030405060708090
100
03.0
1.2
016
03.0
2.2
016
03.0
3.2
016
03.0
4.2
016
03.0
5.2
016
03.0
6.2
016
03.0
7.2
016
03.0
8.2
016
03.0
9.2
016
03.1
0.2
016
03.1
1.2
016
03.1
2.2
016
Maker Faire
US DE FR GB IT
0102030405060708090
100
03.0
1.2
01
6
03.0
2.2
01
6
03.0
3.2
01
6
03.0
4.2
01
6
03.0
5.2
01
6
03.0
6.2
01
6
03.0
7.2
01
6
03.0
8.2
01
6
03.0
9.2
01
6
03.1
0.2
01
6
03.1
1.2
01
6
03.1
2.2
01
6
Repair Café*
US DE FR GB IT
Analysis of public attention
27
Besides analyses over time, Google Trends also allows country comparisons. In Figure 7,
this is shown for all of the new models of repair and maintenance services for the year
2016. It has to be kept in mind for the interpretation that, due to the normalization of
Google Trends, the results cannot be compared across the analyses. A value of 100 for
Germany in one graph does not directly correspond to a value of 100 in another graph as
the relative dimensions (here differences between countries) and the absolute values differ.
However, country comparisons for the single keyword searches are possible.
With regard to the "maker movement" it can be found that the largest number of search
queries (in relation to all search queries) stem from French users, followed by Italy. The
U.S. and Germany mostly score third and fourth throughout 2016, while the keyword is
less often searched by users from Great Britain. When it comes to techniques, the results
show a very different pattern. However, this is (at least partly) due to a methodological
problem described above, namely the language bias. In our query, only English and Ger-
man keywords are used but not French or Italian ones. This is not a problem for the query
on maker movement as the keywords for maker movement mostly consist of Anglicisms
that are used all over the world. Yet, for the techniques, the words "3d-printing" or "3d-
druck" are used, but the French and Italian equivalents are left out. Therefore, only Germa-
ny, Great Britain and the U.S. can be compared in this graph.
It becomes obvious, however, that the keywords related to techniques are most often used
for searches by German users. This result has already been found in the aforementioned
analyses, pointing to the fact that public attention towards techniques is higher in Germany
than in the U.S. and in Great Britain. With regard to Maker Faires, the largest attention in
(October) 2016 came from Italian users. However, this is because the Maker Faire in Rome
(in October) is one of the largest Maker Faires worldwide, so it is not surprising that it got
a quite large attention in Italy. With regard to repair cafés, that largest attention in 2016
came from Germany. Yet, there were three peaks where also French users applied the
search term rather frequently, which might once again be related to single events.
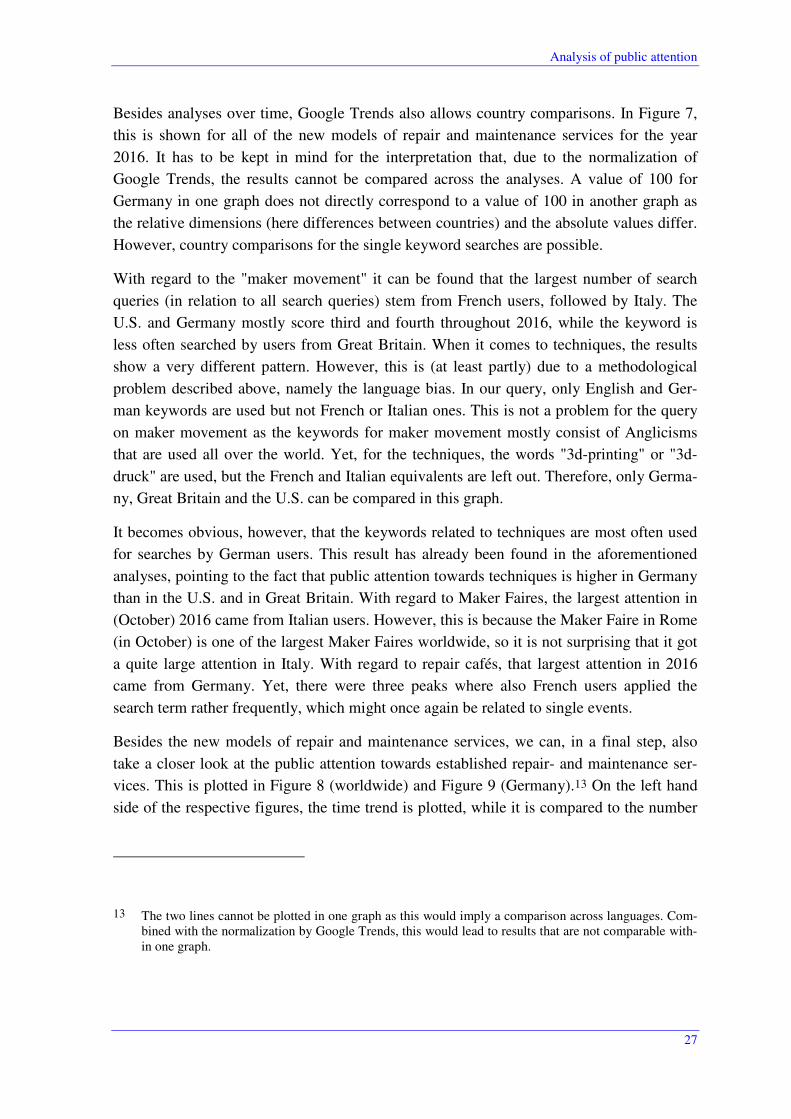
Besides the new models of repair and maintenance services, we can, in a final step, also
take a closer look at the public attention towards established repair- and maintenance ser-
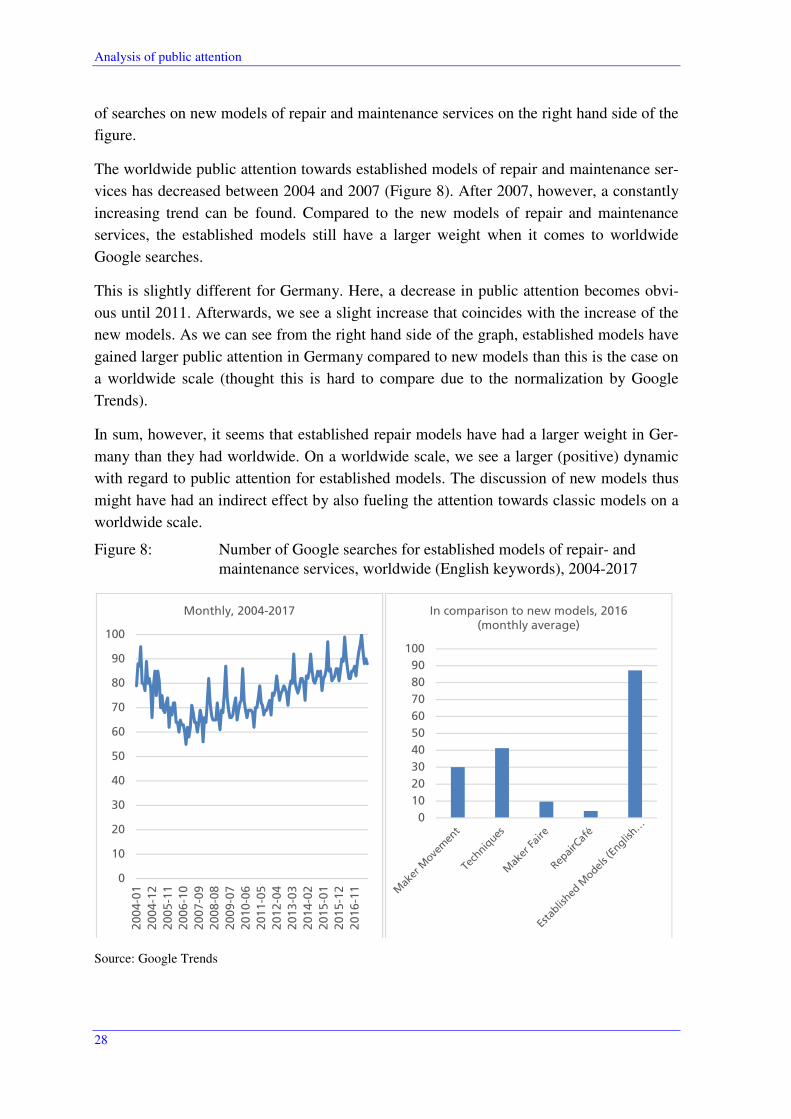
vices. This is plotted in Figure 8 (worldwide) and Figure 9 (Germany).13 On the left hand
side of the respective figures, the time trend is plotted, while it is compared to the number
13 The two lines cannot be plotted in one graph as this would imply a comparison across languages. Com-bined with the normalization by Google Trends, this would lead to results that are not comparable with-in one graph.
Analysis of public attention
28
of searches on new models of repair and maintenance services on the right hand side of the
figure.
The worldwide public attention towards established models of repair and maintenance ser-
vices has decreased between 2004 and 2007 (Figure 8). After 2007, however, a constantly
increasing trend can be found. Compared to the new models of repair and maintenance
services, the established models still have a larger weight when it comes to worldwide
Google searches.
This is slightly different for Germany. Here, a decrease in public attention becomes obvi-
ous until 2011. Afterwards, we see a slight increase that coincides with the increase of the
new models. As we can see from the right hand side of the graph, established models have
gained larger public attention in Germany compared to new models than this is the case on
a worldwide scale (thought this is hard to compare due to the normalization by Google
Trends).
In sum, however, it seems that established repair models have had a larger weight in Ger-
many than they had worldwide. On a worldwide scale, we see a larger (positive) dynamic
with regard to public attention for established models. The discussion of new models thus
might have had an indirect effect by also fueling the attention towards classic models on a
worldwide scale.
Figure 8: Number of Google searches for established models of repair- and maintenance services, worldwide (English keywords), 2004-2017
Source: Google Trends
0
10
20
30
40
50
60
70
80
90
100
200
4-0
1
200
4-1
2
200
5-1
1
200
6-1
0
200
7-0
9
200
8-0
8
200
9-0
7
201
0-0
6
201
1-0
5
201
2-0
4
201
3-0
3
201
4-0
2
201
5-0
1
201
5-1
2
201
6-1
1
Monthly, 2004-2017
0
10
20
30
40
50
60
70
80
90
100
In comparison to new models, 2016 (monthly average)
Analysis of public attention
29
Figure 9: Number of Google searches for established models of repair and maintenance services, Germany (German keywords), 2004-2017
Source: Google Trends
3.2.4 Conclusions and feasibility for future studies
In sum, the results point to the fact that new models of repair and maintenance services
have gained large attention especially since 2011 when 3D-printing and related techniques
became available to private users. This technology has enabled non-experts to create new
modes of repair and maintenance services. At least partly, a technological innovation has
thus triggered a "social innovation" in the form of maker movements, repair cafés, Fab-
Labs etc. Yet, the results show that the conventional modes of repair and maintenance ser-
vices still outweigh the new modes, at least when it comes to public attention on the inter-
net. Interestingly, especially German users seem to be most interested in the techniques
that drive the maker movement, while this is of less importance in other countries.
With regard to feasibility, it can be stated that Google Trends is an excellent tool when it
comes to generating an overview about public awareness with regard to a given topic on
the internet. It allows comparisons over time and across countries. Furthermore, a categori-
zation and a comparison across categories are possible. However, from a scientific point of
view, Google Trends has some major drawbacks as it comes with some systematic biases
that are out of control of the researcher, i.e. language issues, country biases, etc. It further-
more restricts the flexibility of the researcher regarding the use of the search and the dis-
play and analysis of the results. In sum, Google Trends should be used with caution, keep-
0
10
20
30
40
50
60
70
80
90
100
200
4-0
1
200
4-1
2
200
5-1
1
200
6-1
0
200
7-0
9
200
8-0
8
200
9-0
7
201
0-0
6
201
1-0
5
201
2-0
4
201
3-0
3
201
4-0
2
201
5-0
1
201
5-1
2
201
6-1
1
Monthly, 2004-2017
0
10
20
30
40
50
60
70
80
90
100
In comparison to new models, 2016 (monthly average)
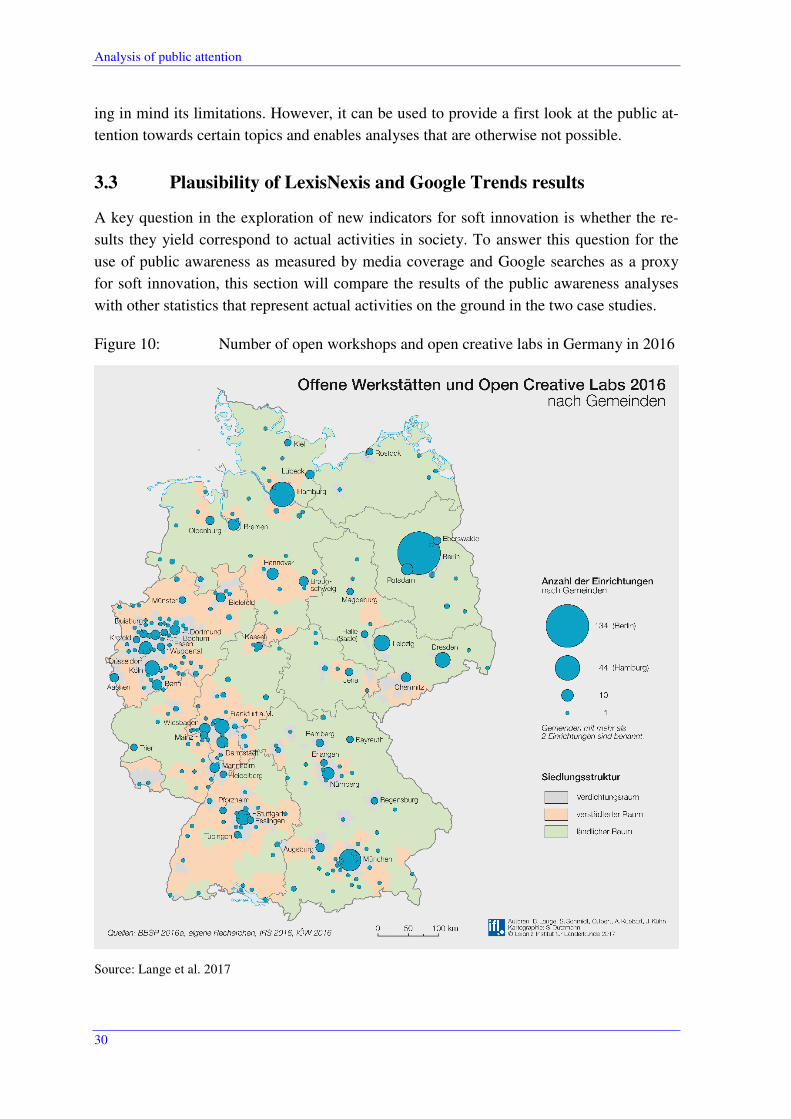
Analysis of public attention
30
ing in mind its limitations. However, it can be used to provide a first look at the public at-
tention towards certain topics and enables analyses that are otherwise not possible.
3.3 Plausibility of LexisNexis and Google Trends results
A key question in the exploration of new indicators for soft innovation is whether the re-
sults they yield correspond to actual activities in society. To answer this question for the
use of public awareness as measured by media coverage and Google searches as a proxy
for soft innovation, this section will compare the results of the public awareness analyses
with other statistics that represent actual activities on the ground in the two case studies.
Figure 10: Number of open workshops and open creative labs in Germany in 2016
Source: Lange et al. 2017
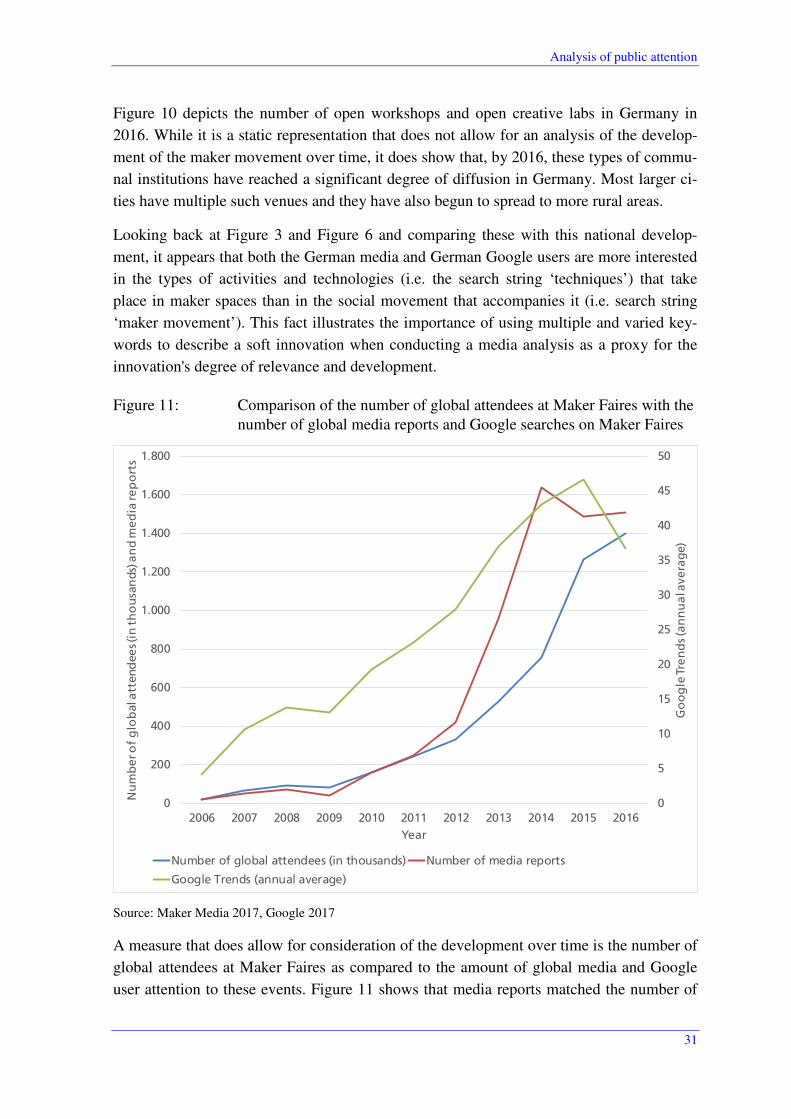
Analysis of public attention
31
Figure 10 depicts the number of open workshops and open creative labs in Germany in
2016. While it is a static representation that does not allow for an analysis of the develop-
ment of the maker movement over time, it does show that, by 2016, these types of commu-
nal institutions have reached a significant degree of diffusion in Germany. Most larger ci-
ties have multiple such venues and they have also begun to spread to more rural areas.
Looking back at Figure 3 and Figure 6 and comparing these with this national develop-
ment, it appears that both the German media and German Google users are more interested
in the types of activities and technologies (i.e. the search string ‘techniques’) that take
place in maker spaces than in the social movement that accompanies it (i.e. search string
‘maker movement’). This fact illustrates the importance of using multiple and varied key-
words to describe a soft innovation when conducting a media analysis as a proxy for the
innovation's degree of relevance and development.
Figure 11: Comparison of the number of global attendees at Maker Faires with the number of global media reports and Google searches on Maker Faires
Source: Maker Media 2017, Google 2017
A measure that does allow for consideration of the development over time is the number of
global attendees at Maker Faires as compared to the amount of global media and Google
user attention to these events. Figure 11 shows that media reports matched the number of
0
5
10
15
20
25
30
35
40
45
50
0
200
400
600
800
1.000
1.200
1.400
1.600
1.800
2006 2007 2008 2009 2010 2011 2012 2013 2014 2015 2016
Go
og
le T
ren
ds
(an
nu
al a
ve
rag
e)
Nu
mb
er o
f g
lob
al a
tten
dee
s (i
n t
ho
usa
nd
s) a
nd
me
dia
re
po
rts
Year
Number of global attendees (in thousands) Number of media reports
Google Trends (annual average)
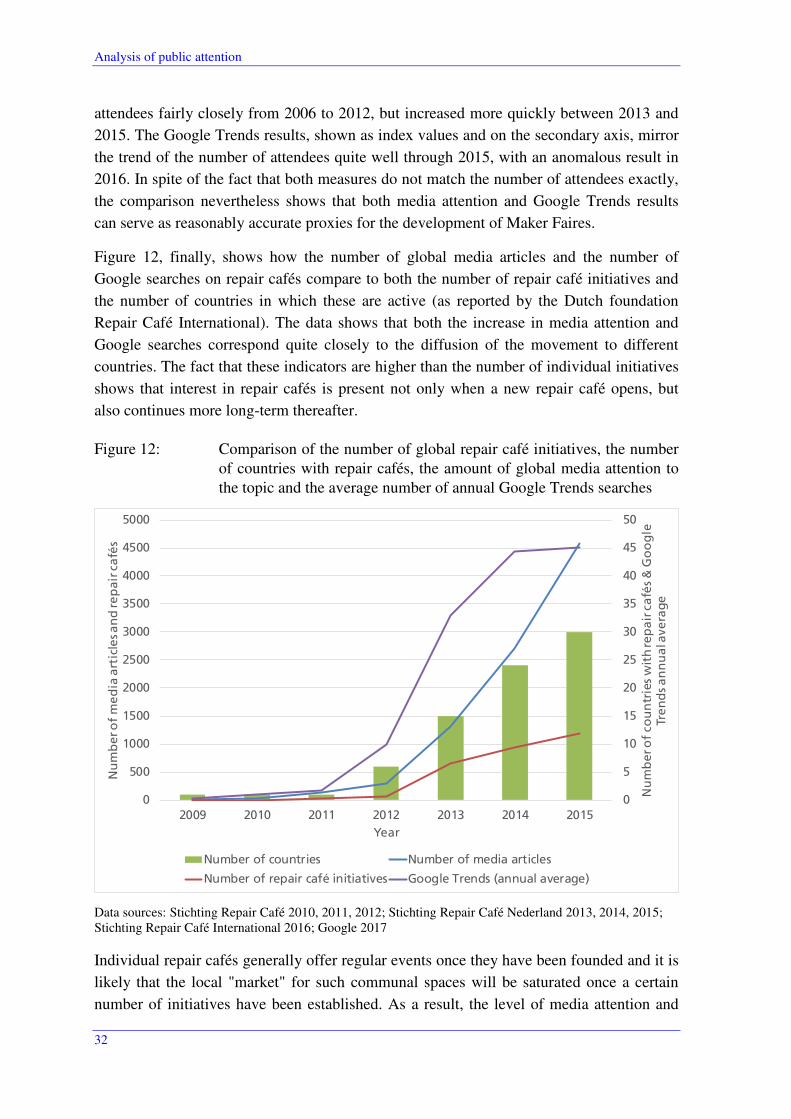
Analysis of public attention
32
attendees fairly closely from 2006 to 2012, but increased more quickly between 2013 and
2015. The Google Trends results, shown as index values and on the secondary axis, mirror
the trend of the number of attendees quite well through 2015, with an anomalous result in
2016. In spite of the fact that both measures do not match the number of attendees exactly,
the comparison nevertheless shows that both media attention and Google Trends results
can serve as reasonably accurate proxies for the development of Maker Faires.
Figure 12, finally, shows how the number of global media articles and the number of
Google searches on repair cafés compare to both the number of repair café initiatives and
the number of countries in which these are active (as reported by the Dutch foundation
Repair Café International). The data shows that both the increase in media attention and
Google searches correspond quite closely to the diffusion of the movement to different
countries. The fact that these indicators are higher than the number of individual initiatives
shows that interest in repair cafés is present not only when a new repair café opens, but
also continues more long-term thereafter.
Figure 12: Comparison of the number of global repair café initiatives, the number of countries with repair cafés, the amount of global media attention to the topic and the average number of annual Google Trends searches
Data sources: Stichting Repair Café 2010, 2011, 2012; Stichting Repair Café Nederland 2013, 2014, 2015; Stichting Repair Café International 2016; Google 2017
Individual repair cafés generally offer regular events once they have been founded and it is
likely that the local "market" for such communal spaces will be saturated once a certain
number of initiatives have been established. As a result, the level of media attention and
0
5
10
15
20
25
30
35
40
45
50
0
500
1000
1500
2000
2500
3000
3500
4000
4500
5000
2009 2010 2011 2012 2013 2014 2015
Nu
mb
er o
f co
un
trie
s w
ith
re
pa
ir c
afé
s &
Go
og
le
Tre
nd
s a
nn
ua
l ave
rag
e
Nu
mb
er o
f m
ed
ia a
rtic
les a
nd
re
pa
ir c
afé
s
Year
Number of countries Number of media articles
Number of repair café initiatives Google Trends (annual average)
Attitudes towards sustainability and resource efficiency
33
number of Google Trends results should be seen as an important complementary measure
to the total number of repair café initiatives in existence when measuring the diffusion and
development of the repair café movement as a social innovation.
4 Attitudes towards sustainability and resource efficiency
There is a big difference between public attention and public opinion (Newig 2004; Rip-
berger 2011). Public attention - and this is what we focused on in the preceding analyses
on LexisNexis and Google trends - denotes the resources that people dedicate toward
thinking about a certain issue. (Public) opinion, on the other hand, relates to (aggregated)
individual attitudes, values or predispositions that can be measured with the help of sur-
veys. There are many surveys with regard to the topic of sustainability in different facets.
However, large scale surveys measuring the attitudes towards sustainability issues that are
comparable over time and across countries are scarce. Two of them are the Eurobarometer
and the World Values Survey. Both try to capture values and attitudes of people in an in-
ternational comparison, though they are not specifically designed to indicate attitudes to-
wards sustainability. Both surveys, however, include questions that address the attitudes of
people towards sustainability issues in certain waves.
In this chapter, we will therefore take a closer look at these two sources. We will mostly
target them from a methodological viewpoint. This means we examine whether and how
they can be used to assess different facets of attitudes towards sustainability in general as
well as attitudes on more specific sustainability issues related to our case studies. Related
issues comprise mainly resource efficiency and waste reduction but also the role of select-
ed actors. Thus, we first provide an overview of the coverage of the two sources and we
will address how they can be used to answer questions related to sustainability. After that
we will provide some exemplary results including international comparisons with a focus
on Germany. In a final section, we will examine how the questions from the Eurobarome-
ter and the WVS can be integrated to form a more general measure with the help of a factor
analysis. In a final step, we will conclude and address the issue of feasibility of the two
sources for further analyses regarding sustainability.
4.1 Data sources
The mission of the Eurobarometer programme is to monitor the public opinion in the Eu-
ropean Union member and candidate countries. It is basically comprised of two instru-
ments (European Commission 2017):
• Standard & Special Eurobarometer: The Standard Eurobarometer was established
in 1974. It is set-up as a bi-annual cross-national longitudinal study and consists of
approximately 1000 face-to-face interviews per country (in each wave) with a con-
stant set of questions that has been constantly enlarged. Reports are published twice
a year. The Special Eurobarometer is repeated irregularly to investigate special top-
Attitudes towards sustainability and resource efficiency
34
ics for various services of the European Commission or other EU Institutions. The
Special Eurobarometer is integrated in the Standard Eurobarometer's waves.
• Flash Eurobarometer: Flash Eurobarometers are thematic telephone interviews
conducted at the request of any service of the European Commission. Flash surveys
are ad hoc, i.e. they are available much faster and enable the Commission to obtain
results relatively quickly and to focus on specific target groups if necessary.
The surveys are conducted on behalf of the European Commission and the responsible
Directorate-General(s), particular modules are commissioned by the European Parliament.
The survey results are regularly published in official reports by the European Commission
or by the European Parliament.
The primary data at the micro-level and the related documentation are published for re-
search and training since the 1970s. They are curated at the GESIS data archive department
(formerly Central Archive for Empirical Social Research) and at the Interuniversity Con-
sortium for Political and Social Research (ICPSR). They are made available in the long
term and worldwide for re-use in statistical analysis in the context of the European social
science data archive network (CESSDA) (GESIS 2017).
The World Values Survey (WVS) is a survey on public values and beliefs and their effects
on social and political life (World Values Survey Association 2017). It is led by an interna-
tional team of scholars, with the WVS association and secretariat headquartered in Stock-
holm, Sweden. The survey started in 1981 and consists of nationally representative surveys
conducted in almost 100 countries using a common questionnaire. It is the largest non-
commercial, cross-national, time series investigation of human beliefs and values and cur-
rently includes interviews with almost 400,000 respondents. Samples are drawn from the
entire population of 18 years and older, with the minimum sample size being 1,000. Cur-
rently, the WVS is in its 7th wave, with data for wave one to six being available for re-
searchers. For each wave, a final master questionnaire is developed in English - based on
suggestions for questions by social scientists from all over the world. This implies that the
questionnaire is not fixed, some questions are available in several waves, others are not. In
addition to the datasets for the single waves, a longitudinal dataset covering country aggre-
gates for the period 1981-2014 is available. This longitudinal dataset is used for all further
analyses.
4.2 Relevant questionnaires and their coverage
In the course of the analysis, we searched for datasets within the Eurobarometer that in-
clude questions with regard to values and public opinion towards the environment, sustain-
ability and eco-innovation in general and also towards more case study specific issues such
as waste management, resource efficiency and the role of citizens and municipalities. The
most relevant questionnaires from the Eurobarometer are:
Attitudes towards sustainability and resource efficiency
35
• ENVI14: Attitudes of European citizens towards the environment (latest wave: Spe-
cial Eurobarometer 416/Wave EB81.3 (European Union 2014b)),
• EFFI: Attitudes of European citizens towards waste management and resource effi-
ciency (latest wave: Flash Eurobarometer 388 (European Union 2014a)),
• INNO: Attitudes of European entrepreneurs towards eco-innovation (latest wave:
Flash Eurobarometer 315 (European Union 2011)).
From these questionnaires, we selected the most important questions with regard to social
innovations and societal acceptability in the context of sustainability. Some of the ques-
tions are more general in nature, i.e. most of the variables from the ENVI dataset, while
some are more specialized and target case study specific issues such as new modes of re-
pair and maintenance services or remanufacturing more specifically (EFFI). The INNO
dataset is special in that only entrepreneurs were asked with regards to specific types of
eco-innovation.
An overview of the questions we have taken into account in the Eurobarometer and the
WVS can be found in Table 3 to Table 6. We show for which years and countries the data
is available, which is stated in more detail in the respective tables. It has to be noted that
not all variables are on the same scale, i.e. there are nominal and ordinal variables. In addi-
tion, not all variables point in the same direction. These variables were reversed to make
them comparable for our analyses. After reversing the variables, large values now always
imply positive attitudes towards the environment and sustainability. The Eurobarometer as
well as the WVS further differentiate between different types of missing variables, e.g.
"not applicable", "no answer", "don't know". Since this is not important for our analyses,
we have coded all those variables to missing. For the WVS, we have dropped all questions
with regard to sustainability that are not available in any wave after 1999 as these would
only allow analyses in the longer past.
14 The abbreviations for these questionnaires are artificial and have been introduced by the authors for the use within this analysis.
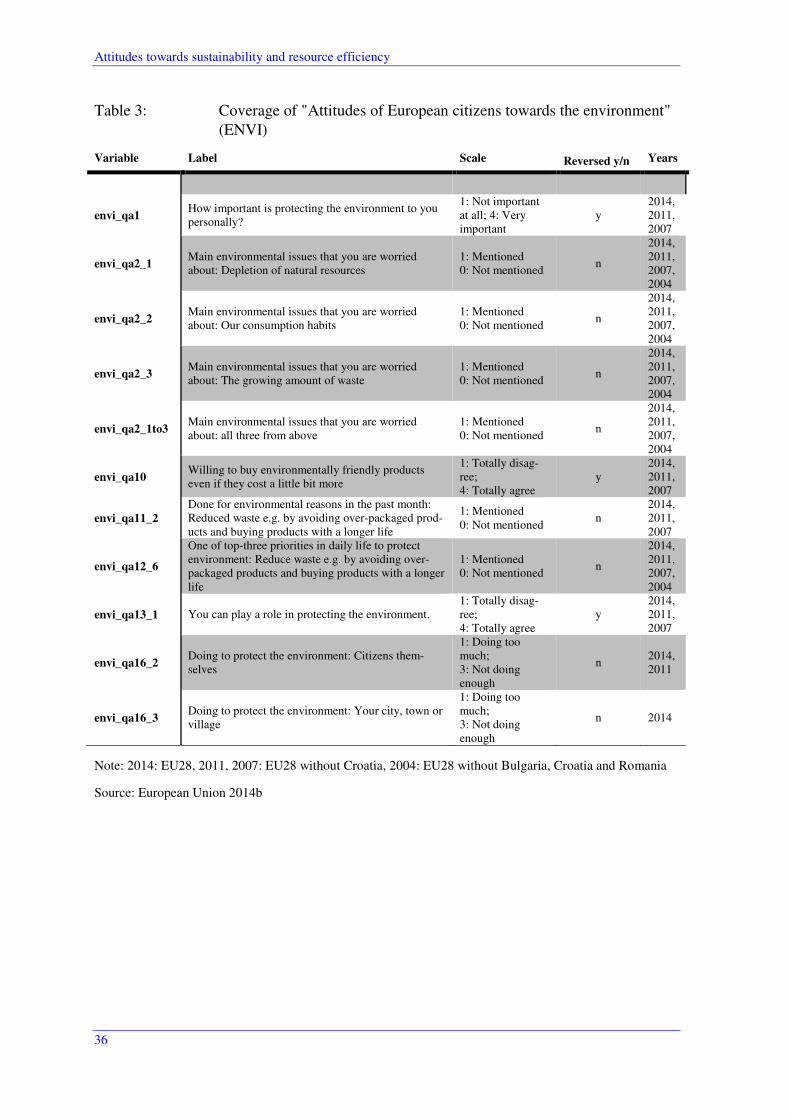
Attitudes towards sustainability and resource efficiency
36
Table 3: Coverage of "Attitudes of European citizens towards the environment" (ENVI)
Variable Label Scale Reversed y/n Years
envi_qa1 How important is protecting the environment to you personally?
1: Not important at all; 4: Very important
y 2014, 2011, 2007
envi_qa2_1 Main environmental issues that you are worried about: Depletion of natural resources
1: Mentioned 0: Not mentioned
n
2014, 2011, 2007, 2004
envi_qa2_2 Main environmental issues that you are worried about: Our consumption habits
1: Mentioned 0: Not mentioned
n
2014, 2011, 2007, 2004
envi_qa2_3 Main environmental issues that you are worried about: The growing amount of waste
1: Mentioned 0: Not mentioned
n
2014, 2011, 2007, 2004
envi_qa2_1to3 Main environmental issues that you are worried about: all three from above
1: Mentioned 0: Not mentioned
n
2014, 2011, 2007, 2004
envi_qa10 Willing to buy environmentally friendly products even if they cost a little bit more
1: Totally disag-ree; 4: Totally agree
y 2014, 2011, 2007
envi_qa11_2
Done for environmental reasons in the past month: Reduced waste e.g. by avoiding over-packaged prod-ucts and buying products with a longer life
1: Mentioned 0: Not mentioned
n 2014, 2011, 2007
envi_qa12_6
One of top-three priorities in daily life to protect environment: Reduce waste e.g. by avoiding over-packaged products and buying products with a longer life
1: Mentioned 0: Not mentioned
n
2014, 2011, 2007, 2004
envi_qa13_1 You can play a role in protecting the environment. 1: Totally disag-ree; 4: Totally agree
y 2014, 2011, 2007
envi_qa16_2 Doing to protect the environment: Citizens them-selves
1: Doing too much; 3: Not doing enough
n 2014, 2011
envi_qa16_3 Doing to protect the environment: Your city, town or village
1: Doing too much; 3: Not doing enough
n 2014
Note: 2014: EU28, 2011, 2007: EU28 without Croatia, 2004: EU28 without Bulgaria, Croatia and Romania
Source: European Union 2014b
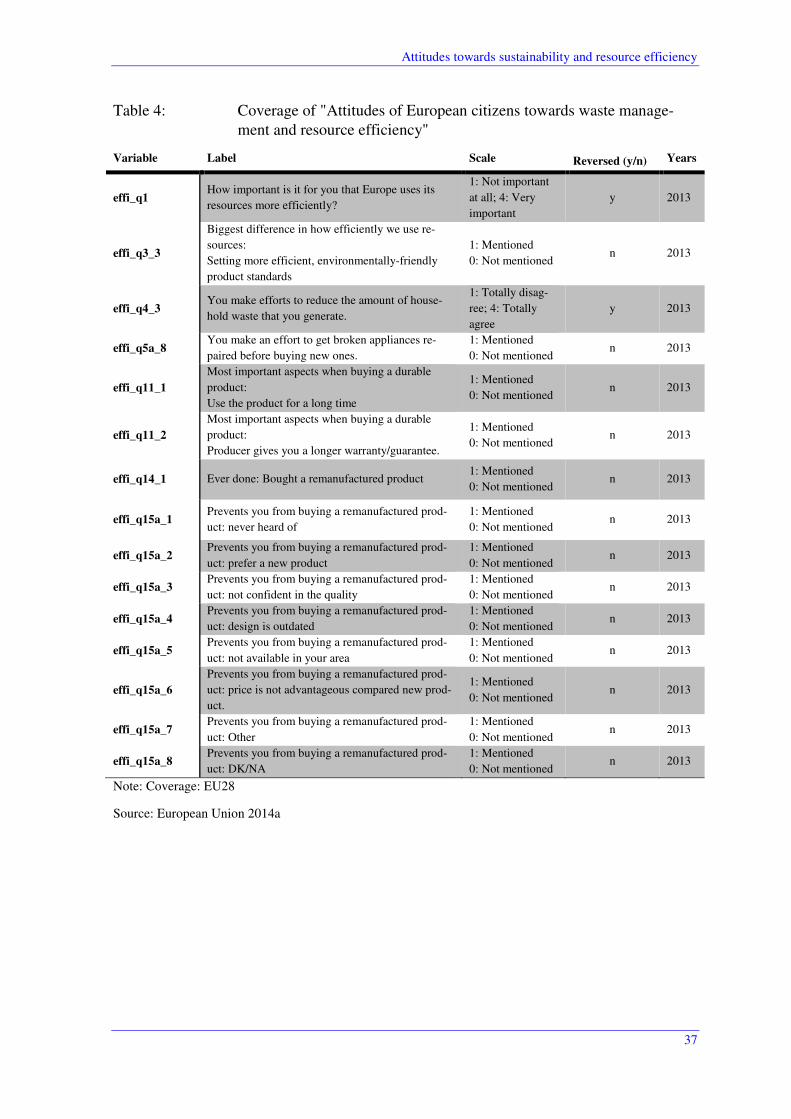
Attitudes towards sustainability and resource efficiency
37
Table 4: Coverage of "Attitudes of European citizens towards waste manage-ment and resource efficiency"
Variable Label Scale Reversed (y/n) Years
effi_q1 How important is it for you that Europe uses its
resources more efficiently?
1: Not important
at all; 4: Very
important
y 2013
effi_q3_3
Biggest difference in how efficiently we use re-
sources:
Setting more efficient, environmentally-friendly
product standards
1: Mentioned
0: Not mentioned n 2013
effi_q4_3 You make efforts to reduce the amount of house-
hold waste that you generate.
1: Totally disag-
ree; 4: Totally
agree
y 2013
effi_q5a_8 You make an effort to get broken appliances re-
paired before buying new ones.
1: Mentioned
0: Not mentioned n 2013
effi_q11_1
Most important aspects when buying a durable
product:
Use the product for a long time
1: Mentioned
0: Not mentioned n 2013
effi_q11_2
Most important aspects when buying a durable
product:
Producer gives you a longer warranty/guarantee.
1: Mentioned
0: Not mentioned n 2013
effi_q14_1 Ever done: Bought a remanufactured product 1: Mentioned
0: Not mentioned n 2013
effi_q15a_1 Prevents you from buying a remanufactured prod-
uct: never heard of
1: Mentioned
0: Not mentioned n 2013
effi_q15a_2 Prevents you from buying a remanufactured prod-
uct: prefer a new product
1: Mentioned
0: Not mentioned n 2013
effi_q15a_3 Prevents you from buying a remanufactured prod-
uct: not confident in the quality
1: Mentioned
0: Not mentioned n 2013
effi_q15a_4 Prevents you from buying a remanufactured prod-
uct: design is outdated
1: Mentioned
0: Not mentioned n 2013
effi_q15a_5 Prevents you from buying a remanufactured prod-
uct: not available in your area
1: Mentioned
0: Not mentioned n 2013
effi_q15a_6
Prevents you from buying a remanufactured prod-
uct: price is not advantageous compared new prod-
uct.
1: Mentioned
0: Not mentioned n 2013
effi_q15a_7 Prevents you from buying a remanufactured prod-
uct: Other
1: Mentioned
0: Not mentioned n 2013
effi_q15a_8 Prevents you from buying a remanufactured prod-
uct: DK/NA
1: Mentioned
0: Not mentioned n 2013
Note: Coverage: EU28
Source: European Union 2014a
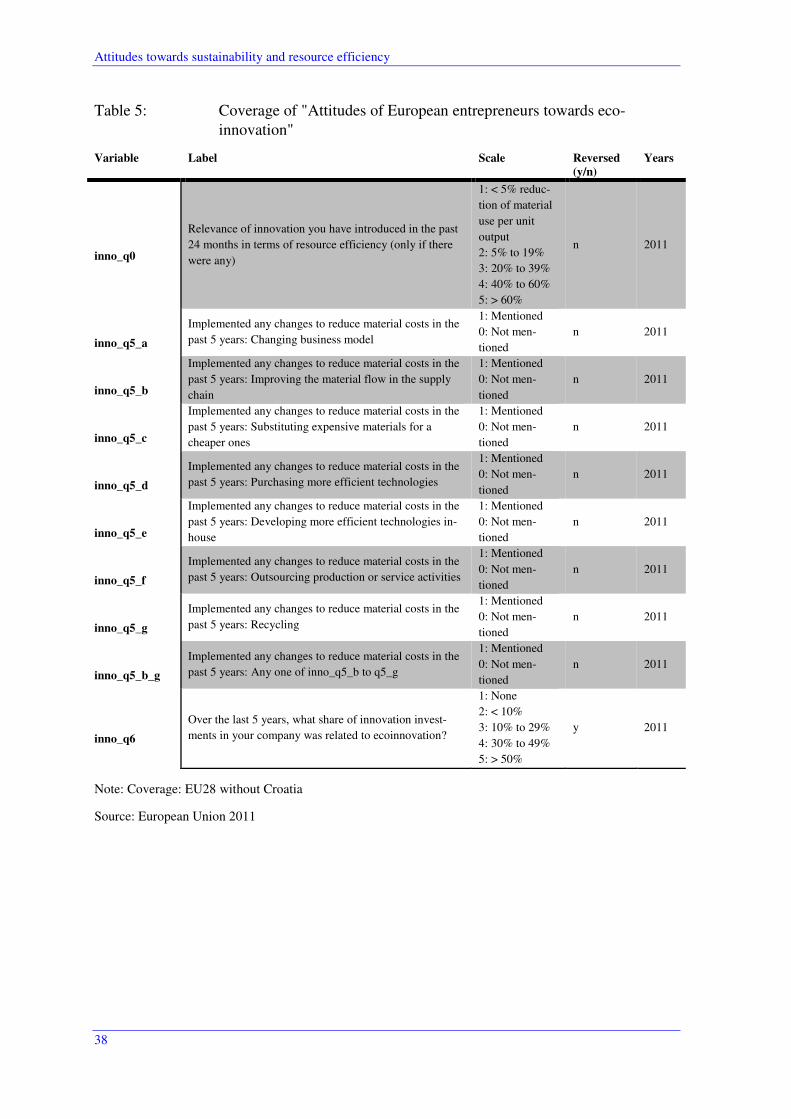
Attitudes towards sustainability and resource efficiency
38
Table 5: Coverage of "Attitudes of European entrepreneurs towards eco-innovation"
Variable Label Scale Reversed (y/n)
Years
inno_q0
Relevance of innovation you have introduced in the past
24 months in terms of resource efficiency (only if there
were any)
1: < 5% reduc-
tion of material
use per unit
output
2: 5% to 19%
3: 20% to 39%
4: 40% to 60%
5: > 60%
n 2011
inno_q5_a
Implemented any changes to reduce material costs in the
past 5 years: Changing business model
1: Mentioned
0: Not men-
tioned
n 2011
inno_q5_b
Implemented any changes to reduce material costs in the
past 5 years: Improving the material flow in the supply
chain
1: Mentioned
0: Not men-
tioned
n 2011
inno_q5_c
Implemented any changes to reduce material costs in the
past 5 years: Substituting expensive materials for a
cheaper ones
1: Mentioned
0: Not men-
tioned
n 2011
inno_q5_d
Implemented any changes to reduce material costs in the
past 5 years: Purchasing more efficient technologies
1: Mentioned
0: Not men-
tioned
n 2011
inno_q5_e
Implemented any changes to reduce material costs in the
past 5 years: Developing more efficient technologies in-
house
1: Mentioned
0: Not men-
tioned
n 2011
inno_q5_f
Implemented any changes to reduce material costs in the
past 5 years: Outsourcing production or service activities
1: Mentioned
0: Not men-
tioned
n 2011
inno_q5_g
Implemented any changes to reduce material costs in the
past 5 years: Recycling
1: Mentioned
0: Not men-
tioned
n 2011
inno_q5_b_g
Implemented any changes to reduce material costs in the
past 5 years: Any one of inno_q5_b to q5_g
1: Mentioned
0: Not men-
tioned
n 2011
inno_q6
Over the last 5 years, what share of innovation invest-
ments in your company was related to ecoinnovation?
1: None
2: < 10%
3: 10% to 29%
4: 30% to 49%
5: > 50%
y 2011
Note: Coverage: EU28 without Croatia
Source: European Union 2011
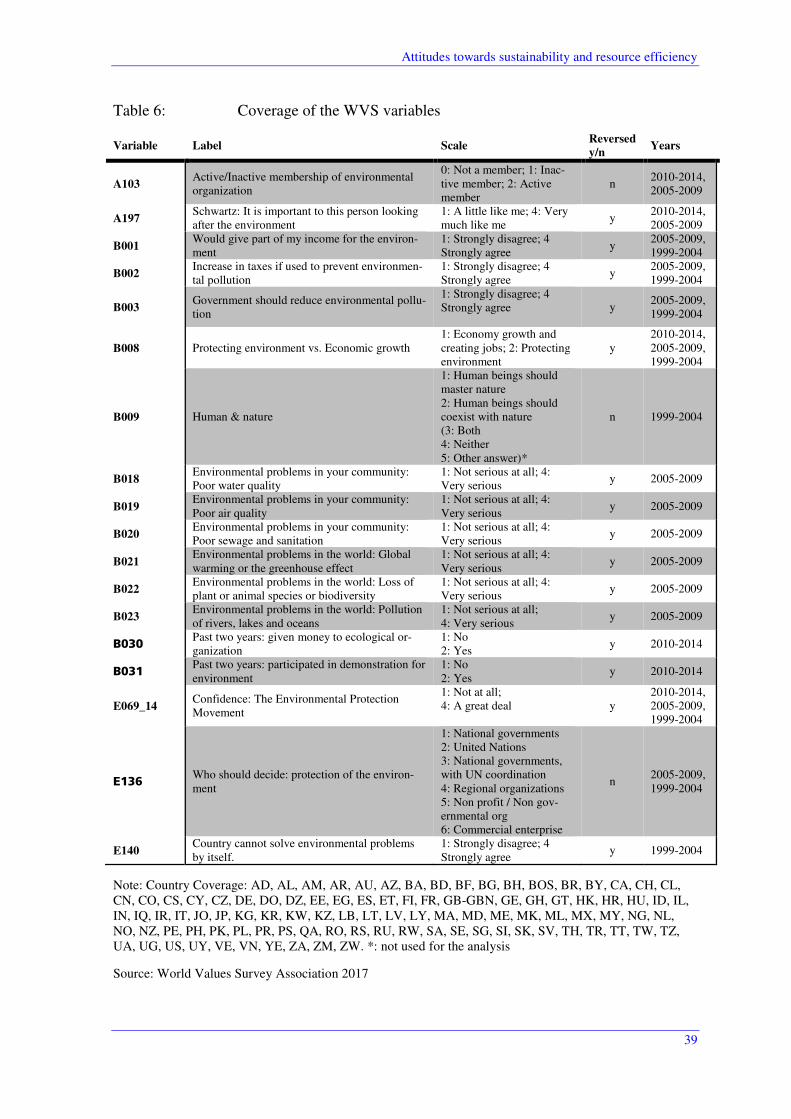
Attitudes towards sustainability and resource efficiency
39
Table 6: Coverage of the WVS variables
Variable Label Scale Reversed y/n
Years
A103 Active/Inactive membership of environmental organization
0: Not a member; 1: Inac-tive member; 2: Active member
n 2010-2014, 2005-2009
A197 Schwartz: It is important to this person looking after the environment
1: A little like me; 4: Very much like me
y 2010-2014, 2005-2009
B001 Would give part of my income for the environ-ment
1: Strongly disagree; 4 Strongly agree
y 2005-2009, 1999-2004
B002 Increase in taxes if used to prevent environmen-tal pollution
1: Strongly disagree; 4 Strongly agree
y 2005-2009, 1999-2004
B003 Government should reduce environmental pollu-tion
1: Strongly disagree; 4 Strongly agree y
2005-2009, 1999-2004
B008 Protecting environment vs. Economic growth 1: Economy growth and creating jobs; 2: Protecting environment
y 2010-2014, 2005-2009, 1999-2004
B009 Human & nature
1: Human beings should master nature 2: Human beings should coexist with nature (3: Both 4: Neither 5: Other answer)*
n 1999-2004
B018 Environmental problems in your community: Poor water quality
1: Not serious at all; 4: Very serious
y 2005-2009
B019 Environmental problems in your community: Poor air quality
1: Not serious at all; 4: Very serious
y 2005-2009
B020 Environmental problems in your community: Poor sewage and sanitation
1: Not serious at all; 4: Very serious
y 2005-2009
B021 Environmental problems in the world: Global warming or the greenhouse effect
1: Not serious at all; 4: Very serious
y 2005-2009
B022 Environmental problems in the world: Loss of plant or animal species or biodiversity
1: Not serious at all; 4: Very serious
y 2005-2009
B023 Environmental problems in the world: Pollution of rivers, lakes and oceans
1: Not serious at all; 4: Very serious
y 2005-2009
B030 Past two years: given money to ecological or-ganization
1: No 2: Yes
y 2010-2014
B031 Past two years: participated in demonstration for environment
1: No 2: Yes
y 2010-2014
E069_14 Confidence: The Environmental Protection Movement
1: Not at all; 4: A great deal y
2010-2014, 2005-2009, 1999-2004
E136 Who should decide: protection of the environ-ment
1: National governments 2: United Nations 3: National governments, with UN coordination 4: Regional organizations 5: Non profit / Non gov-ernmental org 6: Commercial enterprise
n 2005-2009, 1999-2004
E140 Country cannot solve environmental problems by itself.
1: Strongly disagree; 4 Strongly agree
y 1999-2004
Note: Country Coverage: AD, AL, AM, AR, AU, AZ, BA, BD, BF, BG, BH, BOS, BR, BY, CA, CH, CL, CN, CO, CS, CY, CZ, DE, DO, DZ, EE, EG, ES, ET, FI, FR, GB-GBN, GE, GH, GT, HK, HR, HU, ID, IL, IN, IQ, IR, IT, JO, JP, KG, KR, KW, KZ, LB, LT, LV, LY, MA, MD, ME, MK, ML, MX, MY, NG, NL, NO, NZ, PE, PH, PK, PL, PR, PS, QA, RO, RS, RU, RW, SA, SE, SG, SI, SK, SV, TH, TR, TT, TW, TZ, UA, UG, US, UY, VE, VN, YE, ZA, ZM, ZW. *: not used for the analysis
Source: World Values Survey Association 2017
Attitudes towards sustainability and resource efficiency
40
Based on the Eurobarometer and WVS data, we created two datasets that will be analysed
in more detail in the following chapter. For both datasets, we aggregated the values per
country and year (based on averages), resulting in a country-level panel. These panels were
merged to form one panel for the Eurobarometer and one panel for the WVS that allows us
to run estimates across datasets. Furthermore, it allows us to compare the values of the
single studies across countries.
As can be seen from the tables, the Flash Eurobarometer variables only contain values for
one year. The more general "Attitudes of European citizens towards the environment" da-
taset is a "Special Eurobarometer" questionnaire that has been in the field in three waves
(2007, 2011, 2014). As for the WVS, some variables are available across all waves, but
many questions also have only been included in one or two waves. In addition, some ques-
tions are available for a given country in a certain wave, but are missing for the same coun-
try in other waves. However, it is generally possible to generate panel datasets for the
"Special Eurobarometer" and the WVS to analyse time trends. Yet, we focus on the most
recent years for our analyses.
4.3 Results
Within this section, the results of our analyses are presented. We will focus on the method-
ological aspect with regard to the coverage and availability of indicators in the light of the
feasibility of the approach for future studies. Nevertheless, we will provide some interna-
tional comparisons with regard to the sustainability indicators. First, Table 7 shows the
summary statistics for the Eurobarometer variables. As can be seen from the table, the Eu-
robarometer provides a broad coverage of countries, i.e. data for all EU-28 members is
available except for Hungary, where no data is available in the INNO dataset.
This is a bit different for the WVS dataset. Here, we analyze only the most recent survey
wave (2010-2014) as the coverage of questions differs across waves. Six questions of in-
terest are available for this wave, all with a similar coverage across countries. This implies
that it is meaningful to make cross-sectional analyses across different questions. This is
available for a large number of countries. Longitudinal analyses, however, have to be treat-
ed with care as the coverage of questions across waves differs. Although a question might
be available for country A in wave X, it might not be available for country A in wave Y.
The most promising avenue for panel analyses thus seems to be to reduce the number of
countries to a certain core that can be analysed over time.
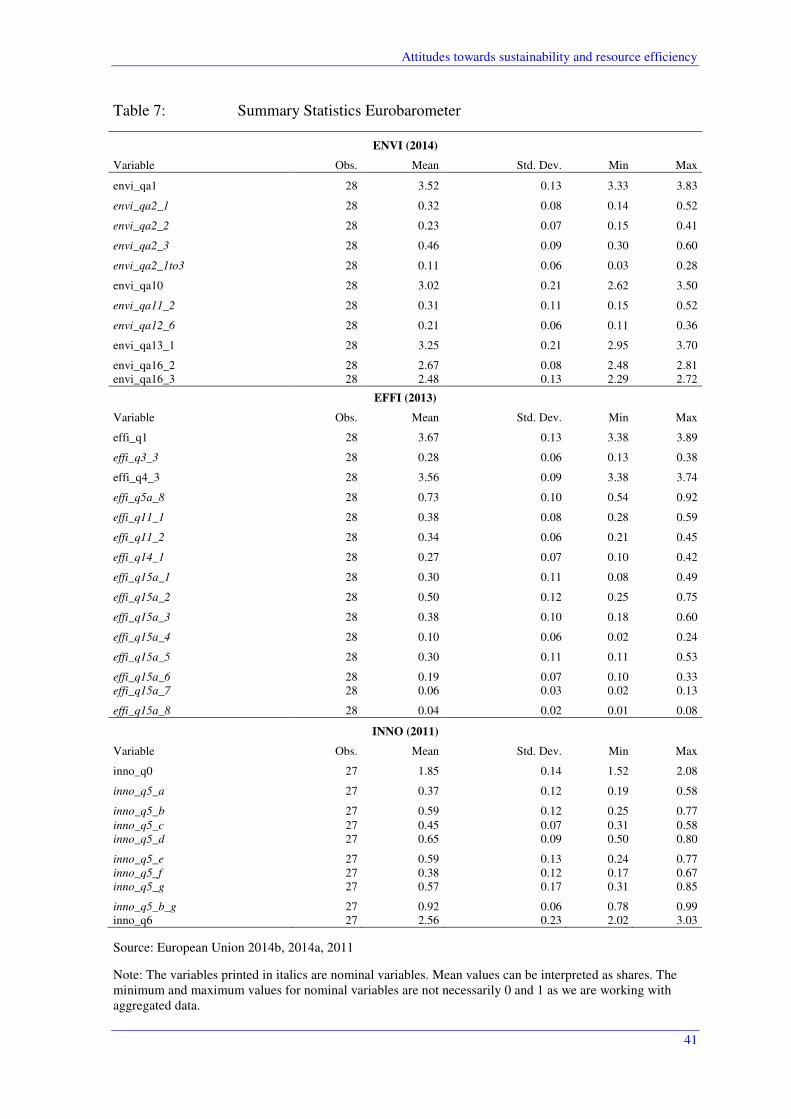
Attitudes towards sustainability and resource efficiency
41
Table 7: Summary Statistics Eurobarometer
ENVI (2014)
Variable Obs. Mean Std. Dev. Min Max
envi_qa1 28 3.52 0.13 3.33 3.83
envi_qa2_1 28 0.32 0.08 0.14 0.52
envi_qa2_2 28 0.23 0.07 0.15 0.41
envi_qa2_3 28 0.46 0.09 0.30 0.60
envi_qa2_1to3 28 0.11 0.06 0.03 0.28
envi_qa10 28 3.02 0.21 2.62 3.50
envi_qa11_2 28 0.31 0.11 0.15 0.52
envi_qa12_6 28 0.21 0.06 0.11 0.36
envi_qa13_1 28 3.25 0.21 2.95 3.70
envi_qa16_2 28 2.67 0.08 2.48 2.81 envi_qa16_3 28 2.48 0.13 2.29 2.72
EFFI (2013)
Variable Obs. Mean Std. Dev. Min Max
effi_q1 28 3.67 0.13 3.38 3.89
effi_q3_3 28 0.28 0.06 0.13 0.38
effi_q4_3 28 3.56 0.09 3.38 3.74
effi_q5a_8 28 0.73 0.10 0.54 0.92
effi_q11_1 28 0.38 0.08 0.28 0.59
effi_q11_2 28 0.34 0.06 0.21 0.45
effi_q14_1 28 0.27 0.07 0.10 0.42
effi_q15a_1 28 0.30 0.11 0.08 0.49
effi_q15a_2 28 0.50 0.12 0.25 0.75
effi_q15a_3 28 0.38 0.10 0.18 0.60
effi_q15a_4 28 0.10 0.06 0.02 0.24
effi_q15a_5 28 0.30 0.11 0.11 0.53
effi_q15a_6 28 0.19 0.07 0.10 0.33 effi_q15a_7 28 0.06 0.03 0.02 0.13
effi_q15a_8 28 0.04 0.02 0.01 0.08
INNO (2011)
Variable Obs. Mean Std. Dev. Min Max
inno_q0 27 1.85 0.14 1.52 2.08
inno_q5_a 27 0.37 0.12 0.19 0.58
inno_q5_b 27 0.59 0.12 0.25 0.77 inno_q5_c 27 0.45 0.07 0.31 0.58 inno_q5_d 27 0.65 0.09 0.50 0.80
inno_q5_e 27 0.59 0.13 0.24 0.77 inno_q5_f 27 0.38 0.12 0.17 0.67 inno_q5_g 27 0.57 0.17 0.31 0.85
inno_q5_b_g 27 0.92 0.06 0.78 0.99 inno_q6 27 2.56 0.23 2.02 3.03
Source: European Union 2014b, 2014a, 2011
Note: The variables printed in italics are nominal variables. Mean values can be interpreted as shares. The minimum and maximum values for nominal variables are not necessarily 0 and 1 as we are working with aggregated data.
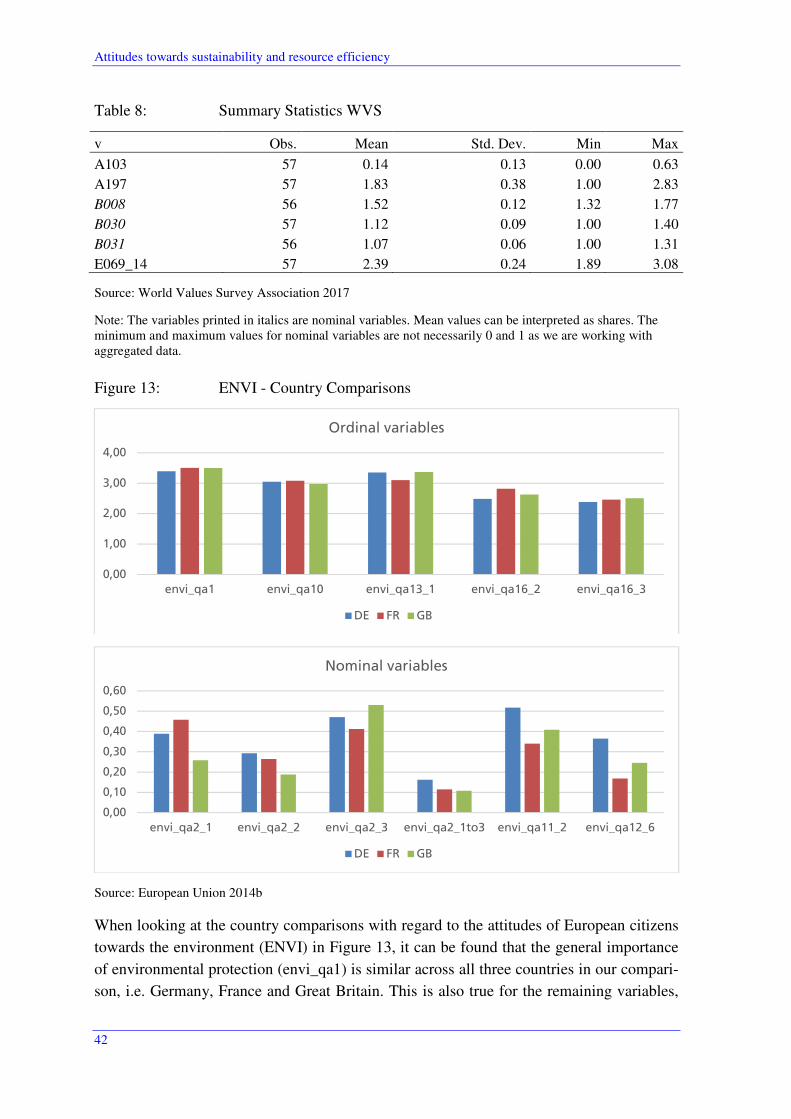
Attitudes towards sustainability and resource efficiency
42
Table 8: Summary Statistics WVS
v Obs. Mean Std. Dev. Min Max
A103 57 0.14 0.13 0.00 0.63
A197 57 1.83 0.38 1.00 2.83
B008 56 1.52 0.12 1.32 1.77
B030 57 1.12 0.09 1.00 1.40
B031 56 1.07 0.06 1.00 1.31
E069_14 57 2.39 0.24 1.89 3.08
Source: World Values Survey Association 2017
Note: The variables printed in italics are nominal variables. Mean values can be interpreted as shares. The minimum and maximum values for nominal variables are not necessarily 0 and 1 as we are working with aggregated data.
Figure 13: ENVI - Country Comparisons
Source: European Union 2014b
When looking at the country comparisons with regard to the attitudes of European citizens
towards the environment (ENVI) in Figure 13, it can be found that the general importance
of environmental protection (envi_qa1) is similar across all three countries in our compari-
son, i.e. Germany, France and Great Britain. This is also true for the remaining variables,
0,00
1,00
2,00
3,00
4,00
envi_qa1 envi_qa10 envi_qa13_1 envi_qa16_2 envi_qa16_3
Ordinal variables
DE FR GB
0,00
0,10
0,20
0,30
0,40
0,50
0,60
envi_qa2_1 envi_qa2_2 envi_qa2_3 envi_qa2_1to3 envi_qa11_2 envi_qa12_6
Nominal variables
DE FR GB
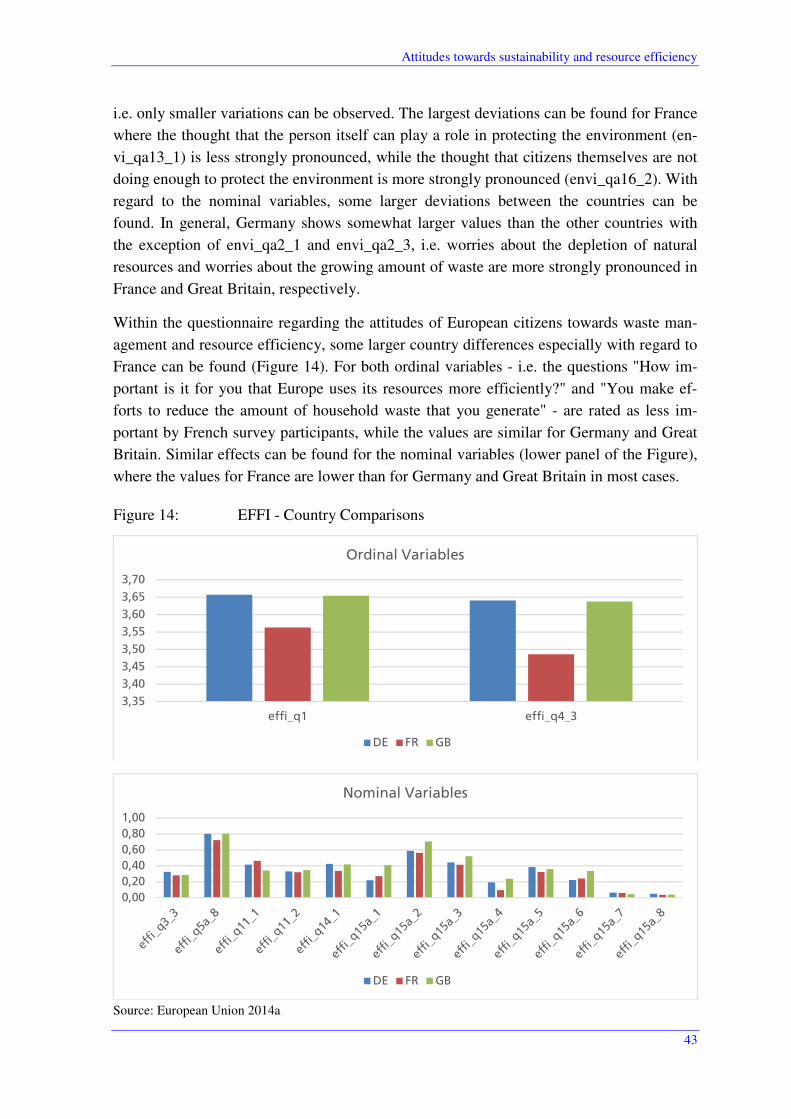
Attitudes towards sustainability and resource efficiency
43
i.e. only smaller variations can be observed. The largest deviations can be found for France
where the thought that the person itself can play a role in protecting the environment (en-
vi_qa13_1) is less strongly pronounced, while the thought that citizens themselves are not
doing enough to protect the environment is more strongly pronounced (envi_qa16_2). With
regard to the nominal variables, some larger deviations between the countries can be
found. In general, Germany shows somewhat larger values than the other countries with
the exception of envi_qa2_1 and envi_qa2_3, i.e. worries about the depletion of natural
resources and worries about the growing amount of waste are more strongly pronounced in
France and Great Britain, respectively.
Within the questionnaire regarding the attitudes of European citizens towards waste man-
agement and resource efficiency, some larger country differences especially with regard to
France can be found (Figure 14). For both ordinal variables - i.e. the questions "How im-
portant is it for you that Europe uses its resources more efficiently?" and "You make ef-
forts to reduce the amount of household waste that you generate" - are rated as less im-
portant by French survey participants, while the values are similar for Germany and Great
Britain. Similar effects can be found for the nominal variables (lower panel of the Figure),
where the values for France are lower than for Germany and Great Britain in most cases.
Figure 14: EFFI - Country Comparisons
Source: European Union 2014a
3,35
3,40
3,45
3,50
3,55
3,60
3,65
3,70
effi_q1 effi_q4_3
Ordinal Variables
DE FR GB
0,00
0,20
0,40
0,60
0,80
1,00
Nominal Variables
DE FR GB
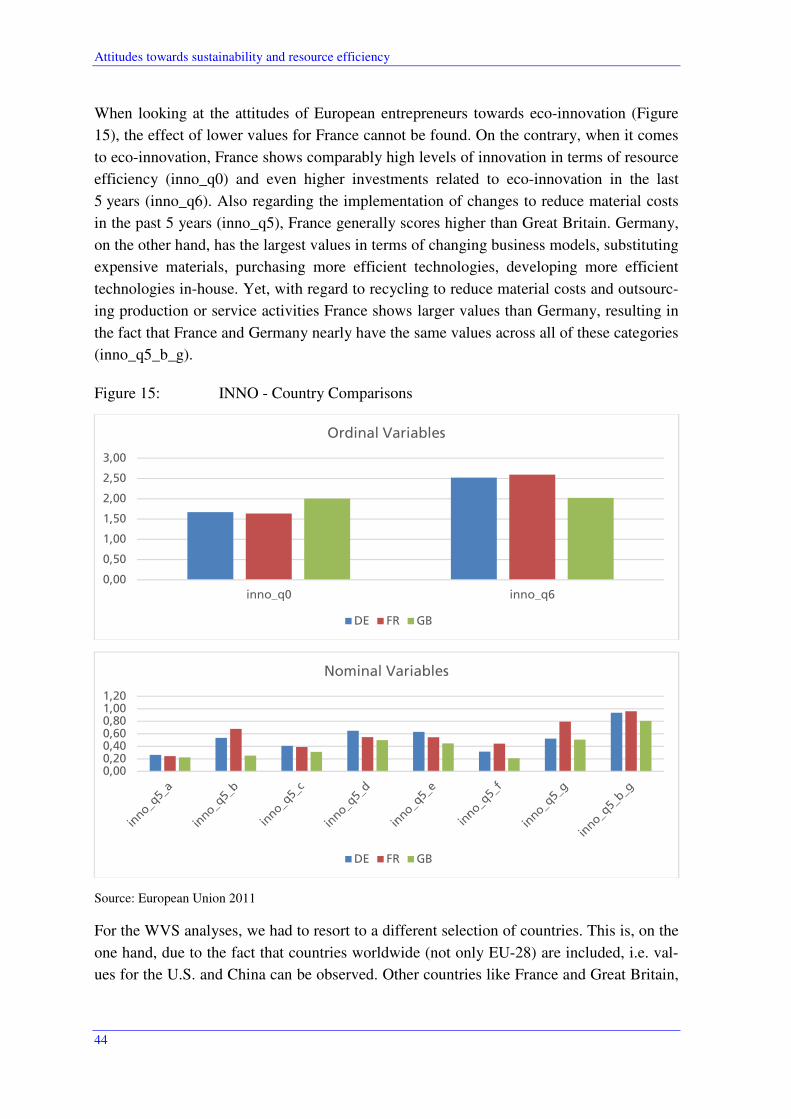
Attitudes towards sustainability and resource efficiency
44
When looking at the attitudes of European entrepreneurs towards eco-innovation (Figure
15), the effect of lower values for France cannot be found. On the contrary, when it comes
to eco-innovation, France shows comparably high levels of innovation in terms of resource
efficiency (inno_q0) and even higher investments related to eco-innovation in the last
5 years (inno_q6). Also regarding the implementation of changes to reduce material costs
in the past 5 years (inno_q5), France generally scores higher than Great Britain. Germany,
on the other hand, has the largest values in terms of changing business models, substituting
expensive materials, purchasing more efficient technologies, developing more efficient
technologies in-house. Yet, with regard to recycling to reduce material costs and outsourc-
ing production or service activities France shows larger values than Germany, resulting in
the fact that France and Germany nearly have the same values across all of these categories
(inno_q5_b_g).
Figure 15: INNO - Country Comparisons
Source: European Union 2011
For the WVS analyses, we had to resort to a different selection of countries. This is, on the
one hand, due to the fact that countries worldwide (not only EU-28) are included, i.e. val-
ues for the U.S. and China can be observed. Other countries like France and Great Britain,
0,00
0,50
1,00
1,50
2,00
2,50
3,00
inno_q0 inno_q6
Ordinal Variables
DE FR GB
0,000,200,400,600,801,001,20
Nominal Variables
DE FR GB
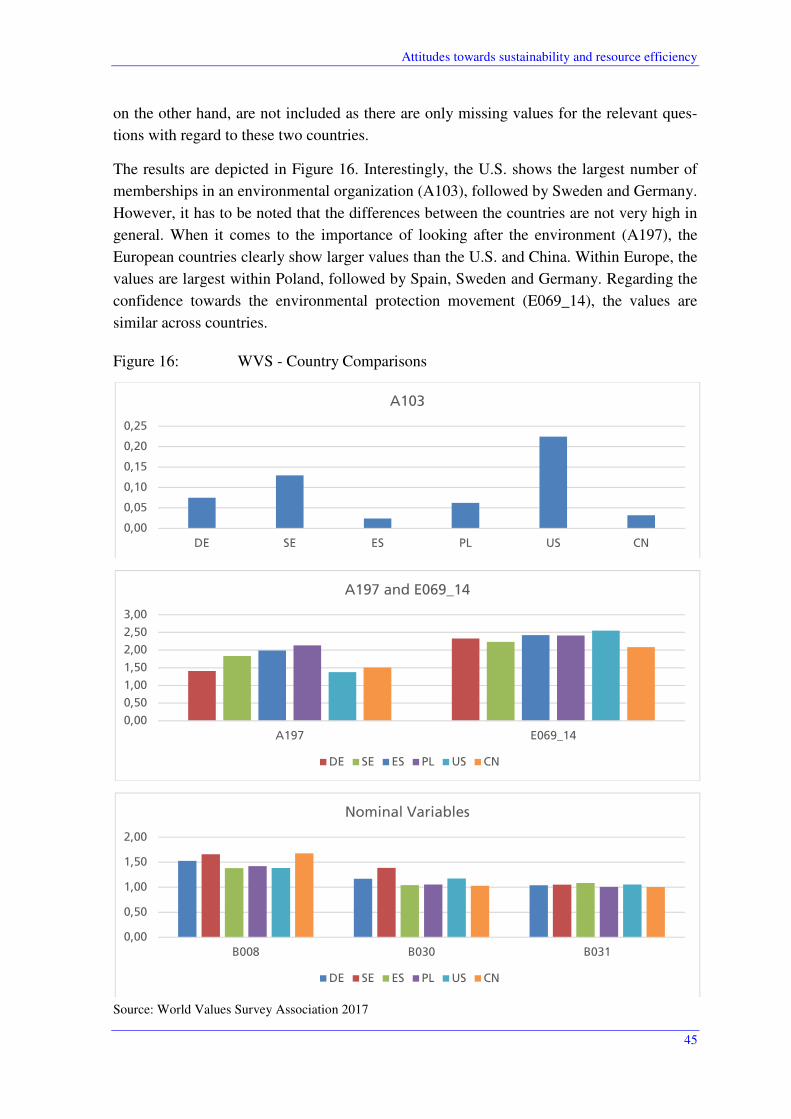
Attitudes towards sustainability and resource efficiency
45
on the other hand, are not included as there are only missing values for the relevant ques-
tions with regard to these two countries.
The results are depicted in Figure 16. Interestingly, the U.S. shows the largest number of
memberships in an environmental organization (A103), followed by Sweden and Germany.
However, it has to be noted that the differences between the countries are not very high in
general. When it comes to the importance of looking after the environment (A197), the
European countries clearly show larger values than the U.S. and China. Within Europe, the
values are largest within Poland, followed by Spain, Sweden and Germany. Regarding the
confidence towards the environmental protection movement (E069_14), the values are
similar across countries.
Figure 16: WVS - Country Comparisons
Source: World Values Survey Association 2017
0,00
0,05
0,10
0,15
0,20
0,25
DE SE ES PL US CN
A103
0,00
0,50
1,00
1,50
2,00
2,50
3,00
A197 E069_14
A197 and E069_14
DE SE ES PL US CN
0,00
0,50
1,00
1,50
2,00
B008 B030 B031
Nominal Variables
DE SE ES PL US CN
Attitudes towards sustainability and resource efficiency
46
The question of economic growth vs. protecting the environment (B008) is rather balanced
at around 50 % for each of the countries under comparison, with China having the largest
share of people opting for protecting the environment, followed by Sweden and Germany.
The shares, however, are much lower with regard to giving money to ecological organiza-
tions (B030) or participating in demonstrations for environment (B031). In the country
comparison, Sweden stands out when it comes to giving money to ecological organiza-
tions, followed by Germany and the United States. As for the demonstrations for the envi-
ronment, there are no sharp country differences.
As a final step of the analyses, we perform a factor analysis for all the selected questions
(variables) from each dataset. Factor analyses aim to deduce latent or unobserved variables
or factors from the empirical measurement of individual variables and thus also serve to
reduce the overall number of variables. In our case, we aim to find out whether some ques-
tions could be seen as substitutes or are highly related so it might make sense to calculate
an index or similar measure based on these variables for future, more in-depth analyses.
In order to determine the number of factors to be extracted, we applied the "eigenvalues"
of the variables from the correlation matrix. They specify how much (additional) variance
is explained by adding an additional factor to the analysis. As soon as the eigenvalues fall
below the value "1", it can be assumed that no sufficient variance in the data is explained
by adding an additional factor. Thus, we extracted as many factors as there were eigenval-
ues above unity.
The results of the factor analysis (factor loadings) for the three questionnaires from the
Eurobarometer are shown in Table 9. The factor charges represent the correlation between
the indicators and the respective factor. For the sake of readability, only values above resp.
below +/- 0.2 are shown. The color code represents a manual selection of variables that fit
together and might thus form a common factor.15
From the ENVI dataset, four factors were extracted. The first factor comprises the main
environmental issues people are worried about, i.e. depletion of resources and consumption
habits (as well as the aggregate variable for this question). This is not surprising as all
these variables are based on the same group of questions. Interestingly, however, the ques-
tion on the growing amount of waste as the main environmental issue loads on its own fac-
tor (factor 4). It thus seems that the waste problematic is different to other environmental
15 Variables that are marked across the whole table do not seem to fit to any of the factors based on their factor loading.
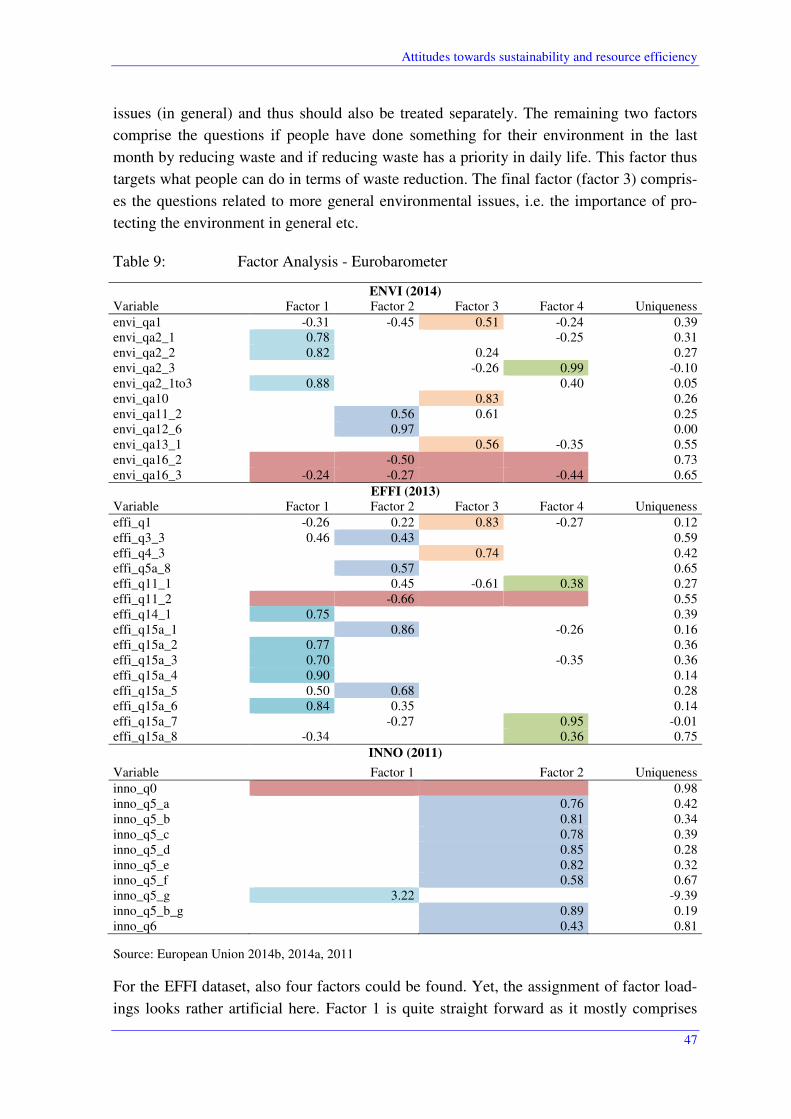
Attitudes towards sustainability and resource efficiency
47
issues (in general) and thus should also be treated separately. The remaining two factors
comprise the questions if people have done something for their environment in the last
month by reducing waste and if reducing waste has a priority in daily life. This factor thus
targets what people can do in terms of waste reduction. The final factor (factor 3) compris-
es the questions related to more general environmental issues, i.e. the importance of pro-
tecting the environment in general etc.
Table 9: Factor Analysis - Eurobarometer
ENVI (2014) Variable Factor 1 Factor 2 Factor 3 Factor 4 Uniqueness envi_qa1 -0.31 -0.45 0.51 -0.24 0.39 envi_qa2_1 0.78 -0.25 0.31 envi_qa2_2 0.82 0.24 0.27 envi_qa2_3 -0.26 0.99 -0.10 envi_qa2_1to3 0.88 0.40 0.05 envi_qa10 0.83 0.26 envi_qa11_2 0.56 0.61 0.25 envi_qa12_6 0.97 0.00 envi_qa13_1 0.56 -0.35 0.55 envi_qa16_2 -0.50 0.73 envi_qa16_3 -0.24 -0.27 -0.44 0.65
EFFI (2013) Variable Factor 1 Factor 2 Factor 3 Factor 4 Uniqueness effi_q1 -0.26 0.22 0.83 -0.27 0.12 effi_q3_3 0.46 0.43 0.59 effi_q4_3 0.74 0.42 effi_q5a_8 0.57 0.65 effi_q11_1 0.45 -0.61 0.38 0.27 effi_q11_2 -0.66 0.55 effi_q14_1 0.75 0.39 effi_q15a_1 0.86 -0.26 0.16 effi_q15a_2 0.77 0.36 effi_q15a_3 0.70 -0.35 0.36 effi_q15a_4 0.90 0.14 effi_q15a_5 0.50 0.68 0.28 effi_q15a_6 0.84 0.35 0.14 effi_q15a_7 -0.27 0.95 -0.01 effi_q15a_8 -0.34 0.36 0.75
INNO (2011)
Variable Factor 1 Factor 2 Uniqueness inno_q0 0.98 inno_q5_a 0.76 0.42 inno_q5_b 0.81 0.34 inno_q5_c 0.78 0.39 inno_q5_d 0.85 0.28 inno_q5_e 0.82 0.32 inno_q5_f 0.58 0.67 inno_q5_g 3.22 -9.39 inno_q5_b_g 0.89 0.19 inno_q6 0.43 0.81
Source: European Union 2014b, 2014a, 2011
For the EFFI dataset, also four factors could be found. Yet, the assignment of factor load-
ings looks rather artificial here. Factor 1 is quite straight forward as it mostly comprises

Attitudes towards sustainability and resource efficiency
48
variables from one group of questions asking what prevents persons from buying products
that have been remanufactured. The other questions, on the other hand, cannot easily be
grouped on a theoretical level, i.e. no clear pattern can be derived. This implies that maybe
the number of factors should be reduced for these questions based on theoretical considera-
tions.
For the INNO dataset, only two factors are extracted. This is first of all the group of ques-
tions regarding the implementation of changes to reduce material costs including the ques-
tion on eco-investments (inno_q6). The only question the stands out is the one regarding
recycling, which loads on a factor on its own. Recycling thus seems to differ very clearly
from other options to reduce material costs and should thus be regarded as a category on its
own.
For the WVS, we also performed a factor analysis. Here, the results are relatively clear.
Two factors have been extracted. Factor 1 loads highly on the questions regarding mem-
berships in environmental organizations, participating in demonstrations or donating mon-
ey to ecological organizations, coupled with a confidence in the movement. The questions
grouped here thus basically revolve around devoting time or resources for the environment.
Factor 2 is more comprised of questions regarding the importance given to the environ-
ment or environmental protection and confidence in the movement (although there is no
clear cut assignment with regard to this question). It thus becomes obvious that there seems
to be a large gap between attitudes and actual behavior. This, however, is a rather common
phenomenon that is well covered in the sociological and psychological literature.
Table 10: Factor Analysis WVS
Factor 1 Factor 2 Uniqueness
A103 1.02 -0.04
A197 0.23 0.95
B008 0.88 0.22
B030 0.59 0.64
B031 0.56 0.68
E069_14 0.47 0.63 0.38
Source: World Values Survey Association 2017
In sum, it can be stated that factor analyses can be helpful to reduce the amount of infor-
mation within the context of sustainability. Questions regarding environmental issues in
general, however, should be treated separately from more specific questions, like waste
reduction. Still it needs an expert in the field to find out which questions can be analysed
meaningfully in which context and where information can be aggregated for the ease of
interpretation.
Attitudes towards sustainability and resource efficiency
49
4.4 Conclusions and feasibility for future studies
In this section, we test if and how the Eurobarometer and the World Values Survey can be
used to analyse questions regarding organisational and social innovations and societal ac-
ceptability in the context of environmental protection and sustainability. In particular, we
focus on the ability to merge different datasets and generate international comparisons over
time.
The country comparisons show that the general attitudes towards environmental protection
are similar across the countries in our comparison, i.e. Germany, France and Great Britain.
When it comes to more detailed questions on resource efficiency, in particular waste man-
agement, some larger differences between the countries can be found. This is especially
true for France, where Europe's efforts to use its resources more efficiently and own efforts
to reduce the amount of household waste are rated as less important than in Germany and
Britain. In the survey of entrepreneurs, however, France shows comparably high levels of
innovation in terms of resource efficiency. Regarding recycling to reduce material costs
and outsourcing production or service activities, France shows even larger values than
Germany, while in Germany changing business models, substituting expensive materials
for cheaper ones, purchasing more efficient technologies and developing more efficient
technologies in-house are more strongly in the focus. As for the WVS analyses, we have to
resort to a different selection of countries, which makes the results hard to compare. Yet,
the international comparisons show that the importance of looking after the environment is
larger in Europe than in the U.S. and China.
More important in this chapter, however, is the feasibility of the approach for future studies
as both data sources offer the potential for more in-depth analyses. We find that the differ-
ent datasets, i.e. Flash Eurobarometer, Special Eurobarometer and WVS, can be merged at
the aggregate level of countries to create a longitudinal dataset for further analyses. Yet,
we also find that, although the possibility exists, it does not deliver much added value. This
is due to the fact that large amounts of missing values are created, as not all studies are
available for all (or even several years). This would result in a quite heavy imputation of
single data points, which might bias the results. Especially the Flash Eurobarometer stud-
ies, that are only available for one year, should thus probably be treated separately. A fur-
ther reason for treating the datasets separately are differences in the statistical population
across datasets - e.g. entrepreneurs vs. total population - that make comparisons impossi-
ble.
Apart from the fact that the data should be treated separately, the two sources offer great
potential for further analyses. While the WVS mostly provides information on general atti-
tudes towards environmental issues, the Eurobarometer (especially the "Flash Eurobarome-
ter", i.e. EFFI and INNO) offers more specific insights. The downside of the Eurobarome-
ter, however, is that the data is only available for the EU-28, while the WVS offers the
potential for wider international comparisons. With regard to analyses over time, the Spe-
Activities of firms
50
cial Eurobarometer (ENVI) dataset has the largest potential, as it is available for three (an-
nual) waves. The EFFI and INNO dataset, however, offer the largest potential for in-depth
analyses for the specific topic of our case studies but are not available over time. With the
WVS, panel analyses are also possible. Yet, it has to be kept in mind that the WVS waves
cover a time period of about 5 years, implying that annual analyses are not possible, only
analyses across time periods. Values for some countries might then still be lacking across
waves, especially for non-industrial nations.
The factor analysis provides some more specific insights on how to treat the single ques-
tions within the dataset. It shows that especially the more general questions can be grouped
together to provide an overview of the recent trends. Yet, for more specific questions, a
grouping of the variables does not seem to be as useful as the loss of information is compa-
rably high, i.e. there are no clear trends in the factor analyses that justify clear groupings
apart from questions regarding attitudes vs. behavior.
5 Activities of firms
In this chapter, we analyze whether the demand for repair services evident in the citizen-
driven maker and repair initiatives is matched by an offer from conventional suppliers, i.e.
we look at the level of actual activities of firms by counting the firms active in the field.
For the identification of these firms, in principle, NACE codes can be used. However, this
approach has some shortcomings, which we will illustrate below. In order to identify com-
panies that offer repair services, we instead conduct a text analysis on the (text) description
of economic activities of firms. We extract the descriptions from the ORBIS database (Bu-
reau van Dijk) that provides information about enterprises worldwide. Based on a set of
keywords, the descriptions are searched and firms that offer repair services are identified.
The resulting set of firms is analysed in terms of the shares of extracted firms within dif-
ferent countries, the composition with regard to different sectors by NACE classes and the
influence of single keywords. Furthermore, the added value of a text based search as com-
pared to a search solely based on NACE classifications is considered.
5.1 Data source and methodological approach
For the identification of firms that offer repair services, we create a set of keywords that
are used in order to search the descriptions of economic activities. In order to select appro-
priate keywords that identify the relevant companies, we start by extracting descriptions of
economic activities based on an initial set of selected keywords:
• maintenance
• warranty
• refurbishment
• remanufactur*
• return/take back
• repair*
• product recovery
• overhaul
Activities of firms
51
• re-use/reuse • reconditioning
In a first step, a random sample of matched descriptions is then used to validate the initial
keywords. The initial set of terms includes for example the word “return”. However, the
analyzed descriptions could not give evidence for a clear occurrence of this term in the
context of repair services. An alternative term for “return” is “take back”, but this keyword
does not match any of the descriptions. The term “maintenance” also poses some problems
as it retrieves companies that offer for example building maintenance. However, since
based on this term, we also find much information about relevant firms, we decide to keep
this term in our set of keywords. Other terms show valuable results, as for example “war-
ranty” that allows us to retrieve companies that offer warranty services.
In a second step, the descriptions of economic activities that are retrieved through the ini-
tial set of keywords are used in order to identify new relevant terms. For this purpose, the
most frequent terms over all retrieved descriptions are examined and further appropriate
terms are selected as new candidate terms:
• renovation
• servicing
• rebuilding
• replacement
• retrofit
• spare part*
The additional keywords are again validated against their context in the newly extracted
descriptions. “Rebuilding”, “retrofit” and “spare part*” achieve good results. ”Renovation”
poses problems similar to those caused by “maintenance”: the results include companies
that offer renovation of buildings, however, it also retrieves much valuable information.
“Servicing” addresses servicing in general which is not an innovative activity, but an in-
crease in servicing activities is actually interesting in terms of sustainability. The term “re-
placement” is discarded since it results in many false positives, for example companies
operating in the medical field, i.e. replacement of joints or hormones. Instead, the term
“replacement part*” is included in the keyword set.
In the last step, a final set of keywords is established:
• maintenance
• overhaul
• product recovery
• rebuilding
• reconditioning
• refurbishment
• remanufactur*
• renovation
• repair*
• replacement part*
• retrofit
• reuse/re-use
• servicing
• spare part*
• warranty
Activities of firms
52
This set of keywords is used in order to search descriptions of economic activities so that
firms offering repair services can be identified.
Besides the description of economic activities, the ORBIS database also provides a NACE
classification code for each firm. Hence, the retrieved firms can be analysed by sector.
5.2 Differentiation of the text analysis from NACE code classifica-
tion
The NACE codes “33.1: Repair of fabricated metal products, machinery and equipment”,
“43: Specialised construction activities”, “45.2: Maintenance and repair of motor vehicles”
and “95: Repair of computers and personal and household goods” define the area of repair
services. These codes provide a clear classification of the firms so that the focus of each
firm can be easily identified. In order to evaluate the added benefit of our text analysis, we
compare the result lists retrieved based on NACE codes to those based on the text analysis,
specifically the keyword “repair”. We find that only 17% of the firms found through the
term “repair” are assigned to one of the NACE codes specified above. The remaining 83%
of firms would have been missed without the application of text analysis. Two examples of
companies retrieved only based on their description are Kinki Co., Ltd. and E.I.S. Aircraft
GmbH. Their economic activities descriptions include “It also has trained repair persons to
handle the maintenance and repair of the electronic equipment and appliances.” (Kinki Co.,
Ltd.) and “It also performs aircraft repair and refurbishment services on commercial and
military aircraft.” (E.I.S. Aircraft GmbH). The reason for the missing classification in a
NACE code related to repair services is that each company is assigned only one NACE
code which intends to characterize the main activity. Kinki Co., Ltd. is assigned the code
“Wholesale and retail trade and repair of motor vehicles and motorcycles” and E.I.S. Air-
craft GmbH the code “Manufacture of other transport equipment”. However, firms may
still perform repair services, even though their main activity is different.
5.3 Analysis of the retrieved firms
By applying our set of keywords to the descriptions of economic activities of firms in
ORBIS, we retrieve 13,807 companies worldwide offering some kind of repair service
which accounts for 1% of all firms.
5.3.1 Analysis of countries and sectors
In Figure 17, the shares of firms retrieved through the keyword search of all firms in a
country are depicted. The share of firms related to repair services is highest in China, 9%
of all Chinese firms are identified through our analysis. In Finland and India, we also find a
high share of companies (7%). Germany is in the midrange (3%), while in the USA and
Russia, the share of companies is vanishingly small.

Activities of firms
53
Figure 18 shows the shares of firms retrieved through the text analysis of all companies in
each sector worldwide. The sectors consist of 11 high-level classes the NACE codes are
assigned to. The sectors “F: Construction”, “C: Manufacturing” and “D: Electricity, gas,
steam and air conditioning supply” show shares of around 2%. Around 1% of the firms in
the sectors “B. Mining and quarrying”, “E: Water supply; sewerage, waste management
and remediation activities” and “J: Information and communication” mention repair ser-
vices within their descriptions.
Figure 17: Shares of firms with “repair services”, identified through keyword-based analysis of all firms for each country
Source: ORBIS (Bureau van Dijk), queries and calculations by Fraunhofer ISI
0%
1%
2%
3%
4%
5%
6%
7%
8%
9%
10%
AT BE BR CA CH CN DE DK ES FI FR GB IL IN IT JP KR NL PL RU SE US ZA
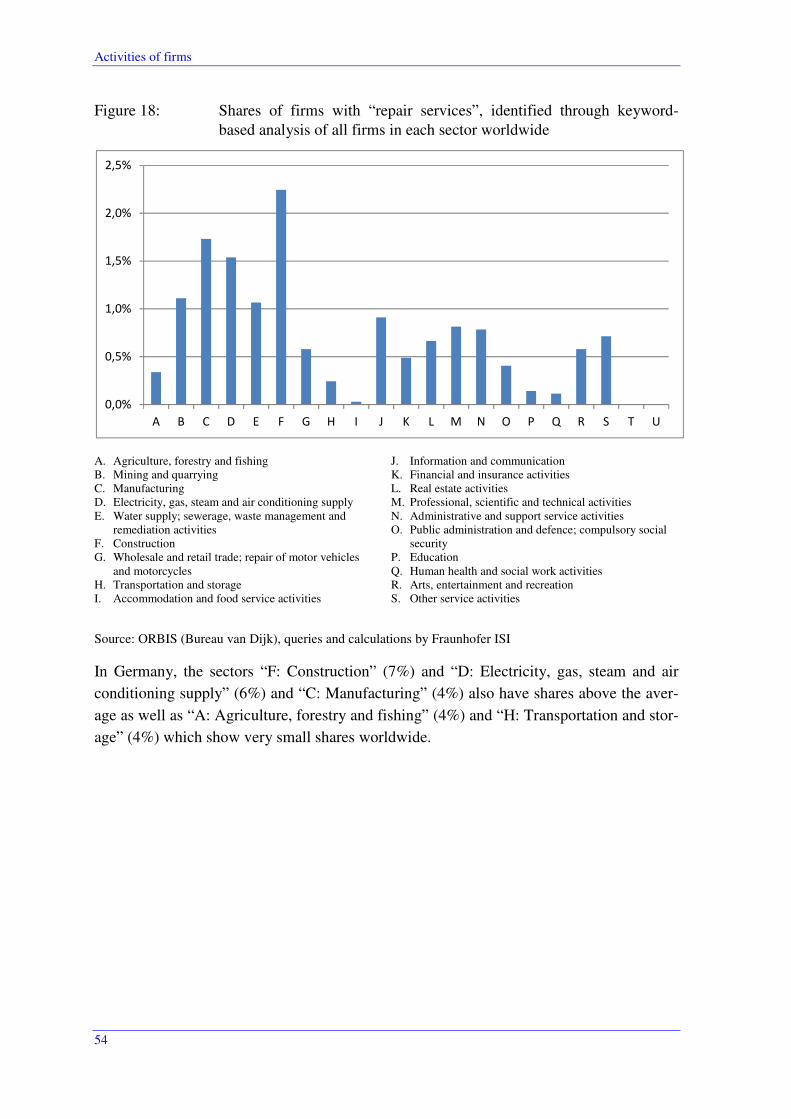
Activities of firms
54
Figure 18: Shares of firms with “repair services”, identified through keyword-based analysis of all firms in each sector worldwide
A. Agriculture, forestry and fishing B. Mining and quarrying C. Manufacturing D. Electricity, gas, steam and air conditioning supply E. Water supply; sewerage, waste management and
remediation activities F. Construction G. Wholesale and retail trade; repair of motor vehicles
and motorcycles H. Transportation and storage I. Accommodation and food service activities
J. Information and communication K. Financial and insurance activities L. Real estate activities M. Professional, scientific and technical activities N. Administrative and support service activities O. Public administration and defence; compulsory social
security P. Education Q. Human health and social work activities R. Arts, entertainment and recreation S. Other service activities
Source: ORBIS (Bureau van Dijk), queries and calculations by Fraunhofer ISI
In Germany, the sectors “F: Construction” (7%) and “D: Electricity, gas, steam and air
conditioning supply” (6%) and “C: Manufacturing” (4%) also have shares above the aver-
age as well as “A: Agriculture, forestry and fishing” (4%) and “H: Transportation and stor-
age” (4%) which show very small shares worldwide.
0,0%
0,5%
1,0%
1,5%
2,0%
2,5%
A B C D E F G H I J K L M N O P Q R S T U
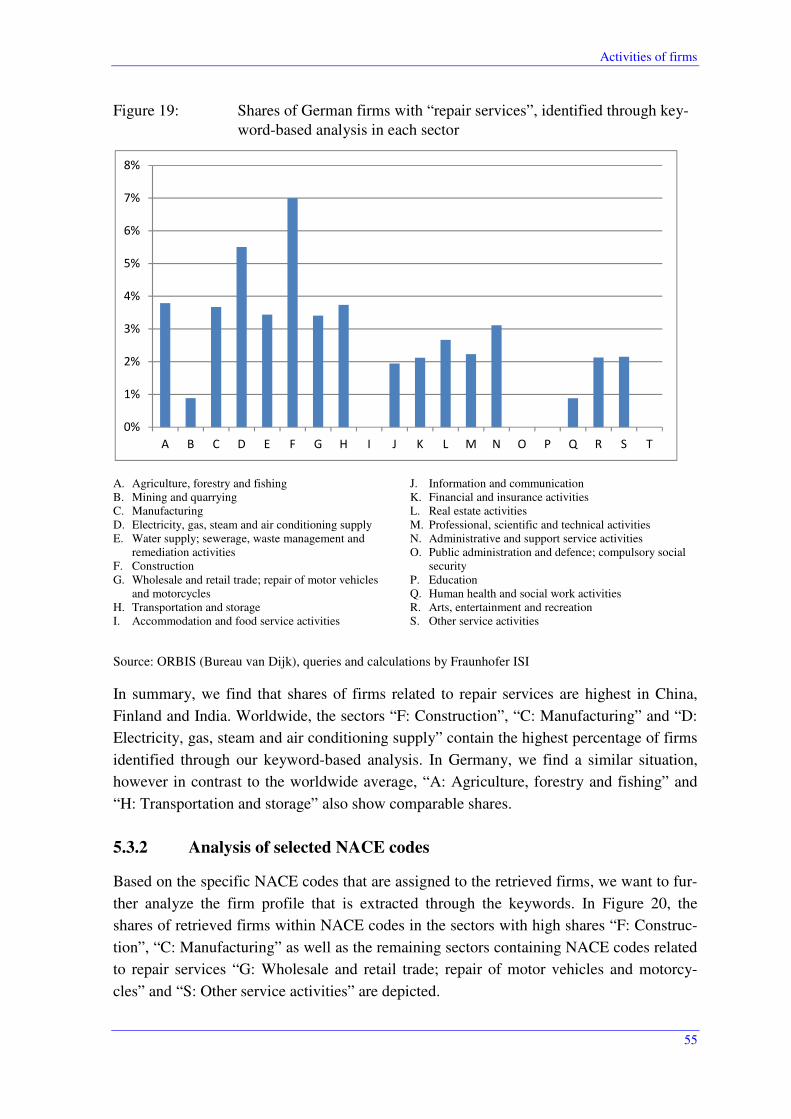
Activities of firms
55
Figure 19: Shares of German firms with “repair services”, identified through key-word-based analysis in each sector
A. Agriculture, forestry and fishing B. Mining and quarrying C. Manufacturing D. Electricity, gas, steam and air conditioning supply E. Water supply; sewerage, waste management and
remediation activities F. Construction G. Wholesale and retail trade; repair of motor vehicles
and motorcycles H. Transportation and storage I. Accommodation and food service activities
J. Information and communication K. Financial and insurance activities L. Real estate activities M. Professional, scientific and technical activities N. Administrative and support service activities O. Public administration and defence; compulsory social
security P. Education Q. Human health and social work activities R. Arts, entertainment and recreation S. Other service activities
Source: ORBIS (Bureau van Dijk), queries and calculations by Fraunhofer ISI
In summary, we find that shares of firms related to repair services are highest in China,
Finland and India. Worldwide, the sectors “F: Construction”, “C: Manufacturing” and “D:
Electricity, gas, steam and air conditioning supply” contain the highest percentage of firms
identified through our keyword-based analysis. In Germany, we find a similar situation,
however in contrast to the worldwide average, “A: Agriculture, forestry and fishing” and
“H: Transportation and storage” also show comparable shares.
5.3.2 Analysis of selected NACE codes
Based on the specific NACE codes that are assigned to the retrieved firms, we want to fur-
ther analyze the firm profile that is extracted through the keywords. In Figure 20, the
shares of retrieved firms within NACE codes in the sectors with high shares “F: Construc-
tion”, “C: Manufacturing” as well as the remaining sectors containing NACE codes related
to repair services “G: Wholesale and retail trade; repair of motor vehicles and motorcy-
cles” and “S: Other service activities” are depicted.
0%
1%
2%
3%
4%
5%
6%
7%
8%
A B C D E F G H I J K L M N O P Q R S T
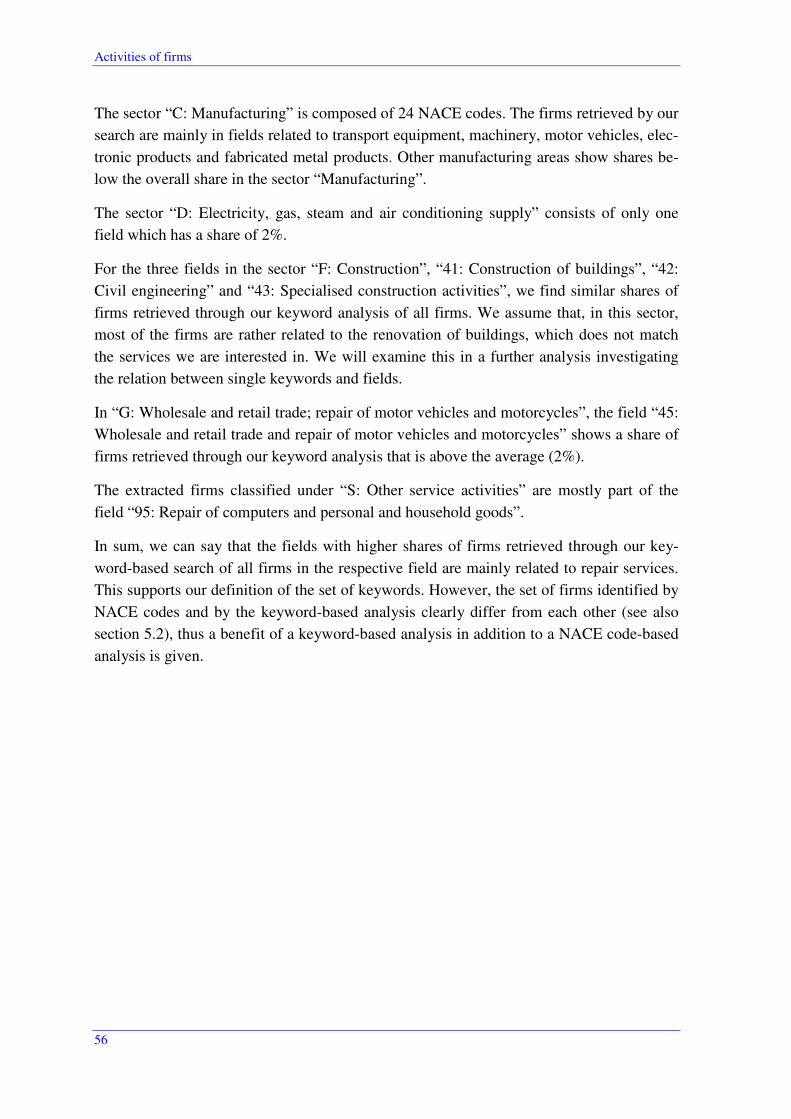
Activities of firms
56
The sector “C: Manufacturing” is composed of 24 NACE codes. The firms retrieved by our
search are mainly in fields related to transport equipment, machinery, motor vehicles, elec-
tronic products and fabricated metal products. Other manufacturing areas show shares be-
low the overall share in the sector “Manufacturing”.
The sector “D: Electricity, gas, steam and air conditioning supply” consists of only one
field which has a share of 2%.
For the three fields in the sector “F: Construction”, “41: Construction of buildings”, “42:
Civil engineering” and “43: Specialised construction activities”, we find similar shares of
firms retrieved through our keyword analysis of all firms. We assume that, in this sector,
most of the firms are rather related to the renovation of buildings, which does not match
the services we are interested in. We will examine this in a further analysis investigating
the relation between single keywords and fields.
In “G: Wholesale and retail trade; repair of motor vehicles and motorcycles”, the field “45:
Wholesale and retail trade and repair of motor vehicles and motorcycles” shows a share of
firms retrieved through our keyword analysis that is above the average (2%).
The extracted firms classified under “S: Other service activities” are mostly part of the
field “95: Repair of computers and personal and household goods”.
In sum, we can say that the fields with higher shares of firms retrieved through our key-
word-based search of all firms in the respective field are mainly related to repair services.
This supports our definition of the set of keywords. However, the set of firms identified by
NACE codes and by the keyword-based analysis clearly differ from each other (see also
section 5.2), thus a benefit of a keyword-based analysis in addition to a NACE code-based
analysis is given.

Activities of firms
57
Figure 20: Shares of firms with “repair services”, identified through keyword-based analysis for some selected sub-sectors16
Source: ORBIS (Bureau van Dijk), queries and calculations by Fraunhofer ISI
5.3.3 Analysis of individual keywords
In the following, we examine the composition of the firms included in the search output in
terms of matching keywords and sectors the firms are classified in.
In Figure 21, the shares of firms identified by a keyword of all firms retrieved by the whole
set are depicted. The shares sum up to more than 100% since the descriptions of economic
activities of firms may include several keywords. Most of the firms (80%) are retrieved by
the keywords “maintenance” (58%) and “repair*” (45%). The terms “servicing” and “spare
part*” identify 10% of the firms, respectively, the term “renovation” extracts 5%.
16 See Annex for a list of sub-sectors.
0%
1%
2%
3%
4%
5%
6%
7%
10 11 12 13 14 15 16 17 18 19 20 21 22 23 24 25 26 27 28 29 30 31 32 33
C: Manufacturing
0%
1%
2%
3%
4%
5%
6%
7%
41 42 43
F: Construction
0%
1%
2%
3%
4%
5%
6%
7%
45 46 47
G: Wholesale and retail
trade; repair of motor
vehicles and motorcycles
0%
1%
2%
3%
4%
5%
6%
7%
94 95 96
S: Other service
activities
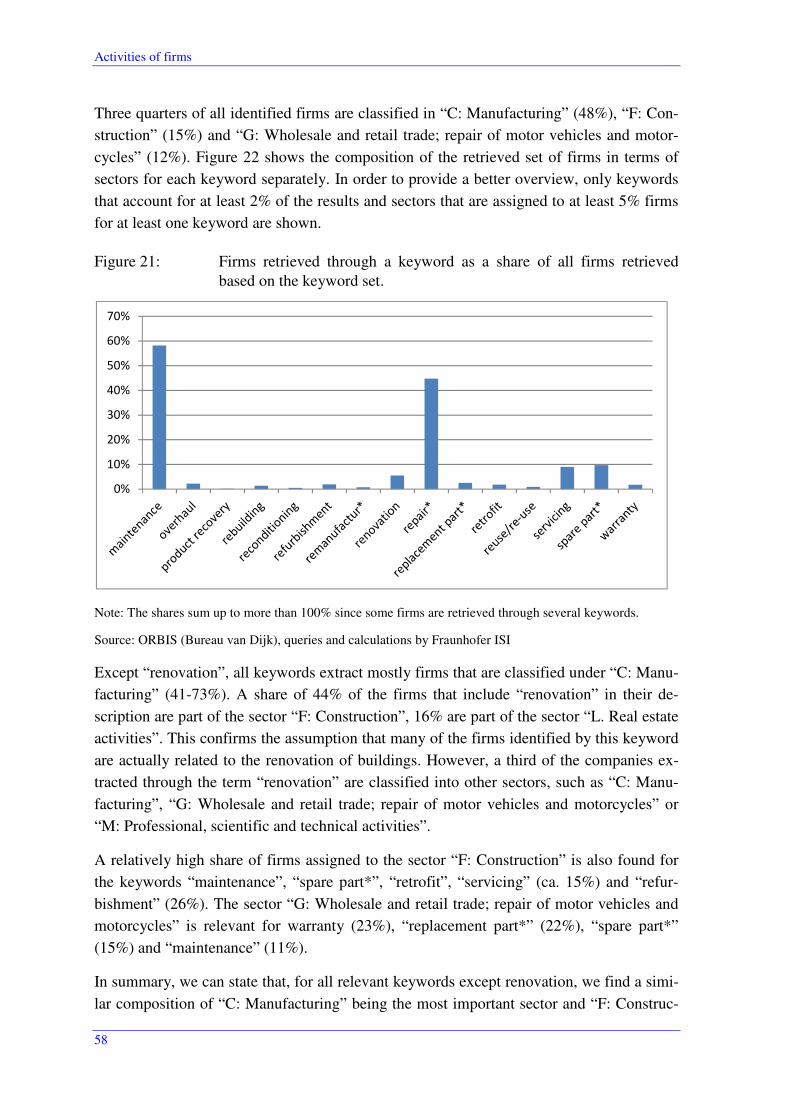
Activities of firms
58
Three quarters of all identified firms are classified in “C: Manufacturing” (48%), “F: Con-
struction” (15%) and “G: Wholesale and retail trade; repair of motor vehicles and motor-
cycles” (12%). Figure 22 shows the composition of the retrieved set of firms in terms of
sectors for each keyword separately. In order to provide a better overview, only keywords
that account for at least 2% of the results and sectors that are assigned to at least 5% firms
for at least one keyword are shown.
Figure 21: Firms retrieved through a keyword as a share of all firms retrieved based on the keyword set.
Note: The shares sum up to more than 100% since some firms are retrieved through several keywords.
Source: ORBIS (Bureau van Dijk), queries and calculations by Fraunhofer ISI
Except “renovation”, all keywords extract mostly firms that are classified under “C: Manu-
facturing” (41-73%). A share of 44% of the firms that include “renovation” in their de-
scription are part of the sector “F: Construction”, 16% are part of the sector “L. Real estate
activities”. This confirms the assumption that many of the firms identified by this keyword
are actually related to the renovation of buildings. However, a third of the companies ex-
tracted through the term “renovation” are classified into other sectors, such as “C: Manu-
facturing”, “G: Wholesale and retail trade; repair of motor vehicles and motorcycles” or
“M: Professional, scientific and technical activities”.
A relatively high share of firms assigned to the sector “F: Construction” is also found for
the keywords “maintenance”, “spare part*”, “retrofit”, “servicing” (ca. 15%) and “refur-
bishment” (26%). The sector “G: Wholesale and retail trade; repair of motor vehicles and
motorcycles” is relevant for warranty (23%), “replacement part*” (22%), “spare part*”
(15%) and “maintenance” (11%).
In summary, we can state that, for all relevant keywords except renovation, we find a simi-
lar composition of “C: Manufacturing” being the most important sector and “F: Construc-
0%
10%
20%
30%
40%
50%
60%
70%
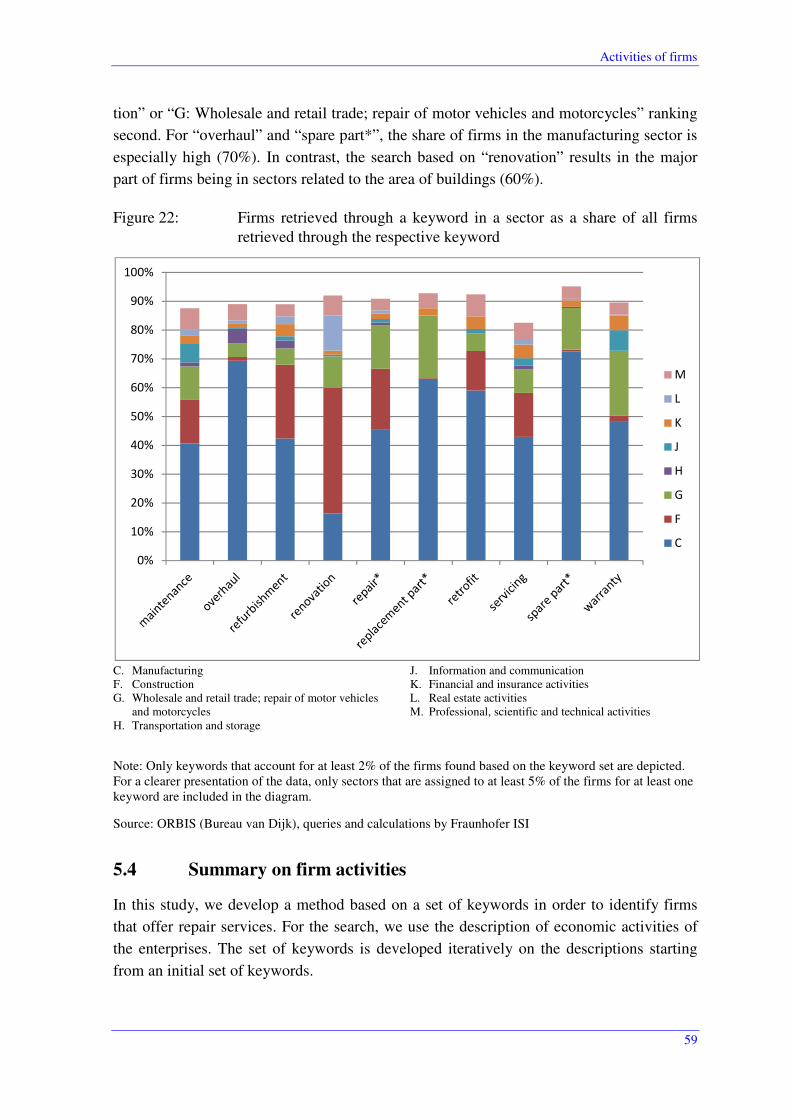
Activities of firms
59
tion” or “G: Wholesale and retail trade; repair of motor vehicles and motorcycles” ranking
second. For “overhaul” and “spare part*”, the share of firms in the manufacturing sector is
especially high (70%). In contrast, the search based on “renovation” results in the major
part of firms being in sectors related to the area of buildings (60%).
Figure 22: Firms retrieved through a keyword in a sector as a share of all firms retrieved through the respective keyword
C. Manufacturing F. Construction G. Wholesale and retail trade; repair of motor vehicles
and motorcycles H. Transportation and storage
J. Information and communication K. Financial and insurance activities L. Real estate activities M. Professional, scientific and technical activities
Note: Only keywords that account for at least 2% of the firms found based on the keyword set are depicted. For a clearer presentation of the data, only sectors that are assigned to at least 5% of the firms for at least one keyword are included in the diagram.
Source: ORBIS (Bureau van Dijk), queries and calculations by Fraunhofer ISI
5.4 Summary on firm activities
In this study, we develop a method based on a set of keywords in order to identify firms
that offer repair services. For the search, we use the description of economic activities of
the enterprises. The set of keywords is developed iteratively on the descriptions starting
from an initial set of keywords.
0%
10%
20%
30%
40%
50%
60%
70%
80%
90%
100%
M
L
K
J
H
G
F
C

Synopsis of evidence and conclusions
60
The extraction of firms based on our keyword analysis results in a set of firms that is
clearly different from the set of firms assigned to NACE codes related to repair services.
This is due to the fact that each enterprise is assigned to only one NACE code which
represents the main focus of the company. However, firms may have several different
activities that can be extracted from the descriptions.
We find that 1% of all firms in the ORBIS database are extracted by our keyword search.
China, Finland and India show highest shares of extracted firms while Germany also has a
share above the worldwide average. In contrast, the percentage in the USA and Russia is
almost 0%.
Considering the proportion of retrieved firms of all firms in the different sectors
worldwide, “F: Construction”, “C: Manufacturing” and “D: Electricity, gas, steam and air
conditioning supply” rank in the top three positions. Germany shows a similar situation, in
addition the sectors “A: Agriculture, forestry and fishing” and “H: Transportation and stor-
age” are relevant.
In a more detailed analysis of the NACE codes, we find that the fields with highest shares
of firms extracted by our set of keywords are mostly related to repair services which
supports our method. However, the results based on the text analysis are clearly different
from an analysis based on NACE codes alone, which proves the benefit of our method.
The analysis of the influence of the individual keywords reveals that most of the firms are
retrieved through the keywords “maintenance “ and “repair*”. Over all keywords, we find
a similar composition of the set of retrieved firms with “C: Manufacturing” being the most
important sector and “F: Construction” or “G: Wholesale and retail trade; repair of motor
vehicles and motorcycles” ranking second. An exception is the keyword “renovation”
which mostly extracts companies related to the area of buildings.
Concluding, we can say that the text analysis provides valuable information about repair
services offered by companies in addition to a NACE code-based analysis. With a share of
1% the proportion of firms worldwide is small yet visible. We can identify differences
between the company profiles in different countries and find that some countries show a
significantly higher share such as China, Finland and India. The major part of firms
offering repair services can be found in the area of manufacturing.
6 Synopsis of evidence and conclusions
Measuring innovation towards sustainability increasingly requires taking organisational
and social innovations into account. In a feasibility study, this report explores the question
of how such „soft“ phenomena of green transformation processes can be captured in inno-
vation indicators. While various indicator types have been used to describe sustainability
innovations related to technological development, such ‘soft innovations’ seem generally
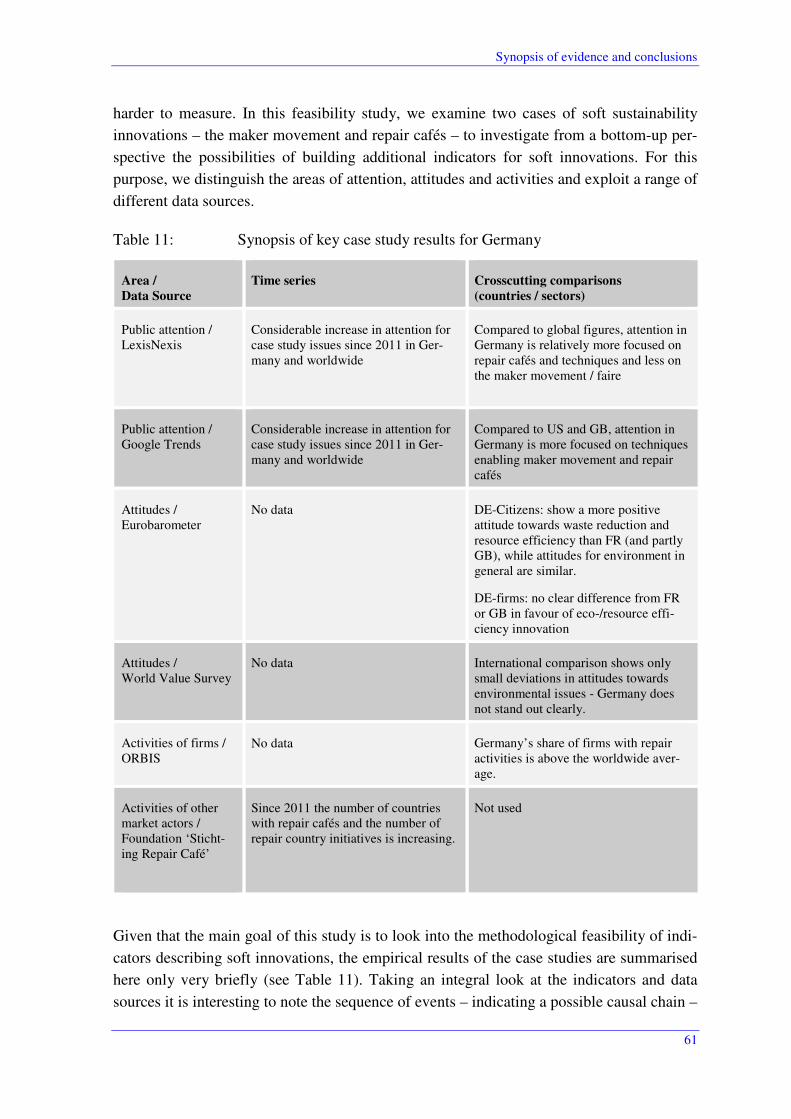
Synopsis of evidence and conclusions
61
harder to measure. In this feasibility study, we examine two cases of soft sustainability
innovations – the maker movement and repair cafés – to investigate from a bottom-up per-
spective the possibilities of building additional indicators for soft innovations. For this
purpose, we distinguish the areas of attention, attitudes and activities and exploit a range of
different data sources.
Table 11: Synopsis of key case study results for Germany
Area /
Data Source
Time series Crosscutting comparisons
(countries / sectors)
Public attention / LexisNexis
Considerable increase in attention for case study issues since 2011 in Ger-many and worldwide
Compared to global figures, attention in Germany is relatively more focused on repair cafés and techniques and less on the maker movement / faire
Public attention / Google Trends
Considerable increase in attention for case study issues since 2011 in Ger-many and worldwide
Compared to US and GB, attention in Germany is more focused on techniques enabling maker movement and repair cafés
Attitudes / Eurobarometer
No data DE-Citizens: show a more positive attitude towards waste reduction and resource efficiency than FR (and partly GB), while attitudes for environment in general are similar.
DE-firms: no clear difference from FR or GB in favour of eco-/resource effi-ciency innovation
Attitudes / World Value Survey
No data International comparison shows only small deviations in attitudes towards environmental issues - Germany does not stand out clearly.
Activities of firms / ORBIS
No data Germany’s share of firms with repair activities is above the worldwide aver-age.
Activities of other market actors / Foundation ‘Sticht-ing Repair Café’
Since 2011 the number of countries with repair cafés and the number of repair country initiatives is increasing.
Not used
Given that the main goal of this study is to look into the methodological feasibility of indi-
cators describing soft innovations, the empirical results of the case studies are summarised
here only very briefly (see Table 11). Taking an integral look at the indicators and data
sources it is interesting to note the sequence of events – indicating a possible causal chain –
Synopsis of evidence and conclusions
62
for repair cafés: Google search indicates that activists became more interested after 2011.
Media picked up the theme in 2012, and the number of activities increased from 2013 on.
The data also signals that there are two trends regarding repair services: An increase in the
attention for repair services as such, regardless whether provided by traditional forms or by
new modes of production, and increases in the specific form. However, the data also shows
that the traditional forms are still receiving more attention than the new modes of produc-
tion. This is also supported by the results from the ORBIS database, which indicates that
the actual repairing activities from companies are indeed much more widespread than indi-
cated by the statistical classification.
The data also reveals differences in importance of the two case studies. Compared to the
maker movement, repair cafés are more important in Germany. Compared to other coun-
tries, Germany’s perspective of using new technologies such as 3D-printers seems to take
place more in a technological framing (high importance of "techniques" keywords), and
not so much in the framing of new modes of production. These differences are hard to de-
tect in the results on attitudes of European citizens towards the environment. Clearly the
questions addressed in these surveys are far too aggregated to be related to differences be-
tween importance of maker movement versus repair cafés.
The study has shown the feasibility of building indicators which represents attention, atti-
tudes and activities: The indicators for attention show the diffusion of ideas and the level
of interest of individuals to take a look into new ideas whereas the indicators for activities
show the level of actual activities taking place. Both types of indicators can be matched to
each other based on the classification used. On the other side, the indicators for attitude
indicate that the increase in development of activities might not just be a temporary hype,
but might be rooted in deeper developments taking place over the longer run. However, as
explained above, the aggregation level of the issues is much higher so that the indicator
cannot be easily matched to the observations on attention and activity.
Data availability and classification methods differ between the indicators. Table 12 shows
that time series as well as crosscutting analyses are possible for many but not all data
sources. The restrictions also have implications for their potential of being employed for
other case studies:
• The indicators for attention use a keyword based search strategy; this results in a very flexible classification system, which can be tailored to many other different forms of soft innovation. The data allows for both building time series data, and performing in-ternational comparisons. However, there might perhaps be a country bias especially in media coverage. Furthermore, international comparisons require a careful translation of the search terms.
• The indicators for attitudes are based on data from existing surveys. Thus, the search and classification is limited by the set of questions used in the survey. The flexibility to address specific soft innovations is low. An international comparison is possible, de-pending on the countries covered by the surveys. To a certain degree, time series data
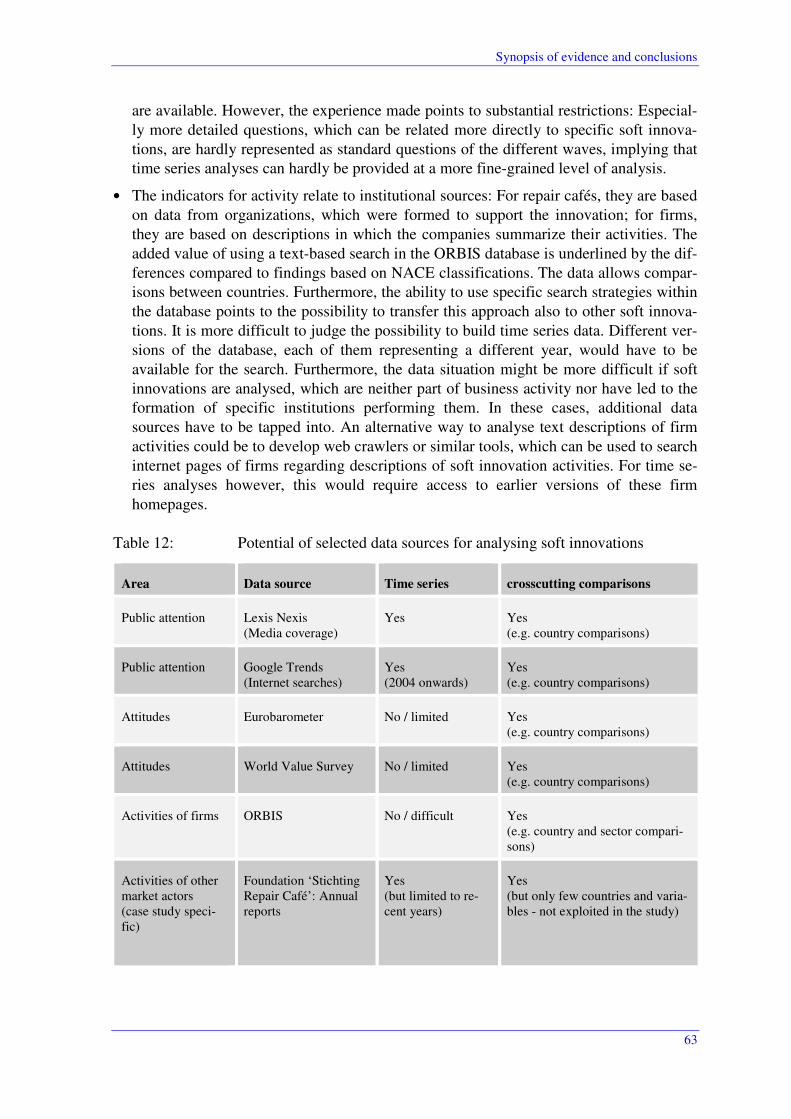
Synopsis of evidence and conclusions
63
are available. However, the experience made points to substantial restrictions: Especial-ly more detailed questions, which can be related more directly to specific soft innova-tions, are hardly represented as standard questions of the different waves, implying that time series analyses can hardly be provided at a more fine-grained level of analysis.
• The indicators for activity relate to institutional sources: For repair cafés, they are based on data from organizations, which were formed to support the innovation; for firms, they are based on descriptions in which the companies summarize their activities. The added value of using a text-based search in the ORBIS database is underlined by the dif-ferences compared to findings based on NACE classifications. The data allows compar-isons between countries. Furthermore, the ability to use specific search strategies within the database points to the possibility to transfer this approach also to other soft innova-tions. It is more difficult to judge the possibility to build time series data. Different ver-sions of the database, each of them representing a different year, would have to be available for the search. Furthermore, the data situation might be more difficult if soft innovations are analysed, which are neither part of business activity nor have led to the formation of specific institutions performing them. In these cases, additional data sources have to be tapped into. An alternative way to analyse text descriptions of firm activities could be to develop web crawlers or similar tools, which can be used to search internet pages of firms regarding descriptions of soft innovation activities. For time se-ries analyses however, this would require access to earlier versions of these firm homepages.
Table 12: Potential of selected data sources for analysing soft innovations
Area Data source Time series crosscutting comparisons
Public attention Lexis Nexis (Media coverage)
Yes Yes (e.g. country comparisons)
Public attention Google Trends (Internet searches)
Yes (2004 onwards)
Yes (e.g. country comparisons)
Attitudes Eurobarometer No / limited Yes (e.g. country comparisons)
Attitudes World Value Survey No / limited Yes (e.g. country comparisons)
Activities of firms ORBIS No / difficult Yes (e.g. country and sector compari-sons)
Activities of other market actors (case study speci-fic)
Foundation ‘Stichting Repair Café’: Annual reports
Yes (but limited to re-cent years)
Yes (but only few countries and varia-bles - not exploited in the study)
Synopsis of evidence and conclusions
64
The experience made in the feasibility study also leads to various open questions. From a
strategic point of view, the following are especially important:
• In conventional innovation indicator studies a leading theme is to judge performance, for example of a specific technology field in relation to overall technological dynamics or of a country in a specific field in relation to a country’s overall technological perfor-mance. For judging the performance, a benchmark is needed. In the analysis of techno-logical innovations, this is for example the dynamics of or share in the total number of patents or of all exports. For soft innovations and the data sources and indicators pro-posed in this study, more work needs to be done to establish similar benchmarks in or-der to allow clearer statements on performance.
• This study looked at the feasibility from the perspective of two case studies. It remains open how to assess soft innovations as an aggregate. Such an approach would increase the generality of results and could also serve as a benchmark for assessing the perfor-mance of subfields. But how can soft innovations as an aggregate be addressed? Is it feasible to build this bottom-up, i.e. by aggregating numerous specific case studies? This would require developing a pre-defined list of soft innovation cases, which are rep-resentative for soft innovations as such. Such an approach is challenging, as it would require adapting the list of soft innovations continuously over time in order to incorpo-rate new forms of soft innovation. On the other side, when you look to indicators for technological sustainability innovations, the aggregate of “green technologies” or “sus-tainability technologies” consists of exactly that: a bottom-up compilation of a large number of technologies from different fields of environmental protection (noise reduc-tion, climate change mitigation etc.). Hence, it faces similar challenges of continuous adaptation. It seems essential, however, that all topics from the bottom-up compilation can be addresses through the same set of data sources, e.g. publications and patent data, trade data etc. Therefore, future research should develop the perspective on the aggre-gate of ‘soft innovations for sustainability’ further with a view to incorporating multiple cases of soft innovations while ensuring that, for all soft innovations on the list, indica-tors can be derived from a common set of data sources.
• On a more technical level, various issues with regard to data availability arise. As to time series, specific questions on soft sustainability innovations are rarely part of the standard questions in questionnaires. Increasing the availability of data on attitudes, which can be related to specific soft innovations would increase the number of surveys – and the costs to implement them – tremendously. In addition, the need to adapt the list of specific soft innovations over time cannot work for obtaining time series data on re-lated attitudes. Thus, the role of indicators for attitudes as such has to be further refined. A possible role might be to look at attitudes, which are related to soft innovations per se, regardless in which area or for which specific case they apply. This means that one would have to search general attitudes that correlate with attitudes towards soft innova-tions and it would require finding a common set of attitudes, which can be related to all forms of soft innovations. Hypotheses have to be formulated, e.g. that actors likely to get active in soft innovations are generally more open to change, more self-reliant and characterized by a loss of trust into the innovation ability of established institutions such as government or business. It is up to future research to determine whether such a com-mon set exists and what it would look like.
Synopsis of evidence and conclusions
65
7 References
Bamberg, Sebastian; Möser, Guido (2007): Twenty years after Hines, Hungerford, and
Tomera. A new meta-analysis of psycho-social determinants of pro-environmental behav-
iour. In Journal of Environmental Psychology 27 (1), pp. 14–25.
Charter, Martin; Keiller, Scott (2016): The Second Global Survey of Repair Cafes: A
Summary of Findings. Centre for Sustainable Design of The University for the Creative
Arts.
Dougherty, Dale (2012): The Maker Movement. In Innovations 7 (3), pp. 11–14. Available
online at http://www.mitpressjournals.org/doi/pdf/10.1162/INOV_a_00135, checked on
6/28/2017.
European Commission (2017): Public Opinion. Available online at
http://ec.europa.eu/commfrontoffice/publicopinion/index.cfm, checked on 8/18/2017.
European Union (2011): Attitudes of European entrepreneurs towards eco-innovation. An-
alytical Report. Edited by European Union (Flash Eurobarometer, 315). Available online at
http://ec.europa.eu/commfrontoffice/publicopinion/flash/fl_315_en.pdf, checked on
8/18/2017.
European Union (2014a): Attitudes of Europeans Towards Waste Management and Re-
source Efficiency. Edited by European Union (Flash Eurobarometer, 388). Available
online at http://ec.europa.eu/commfrontoffice/publicopinion/flash/fl_388_en.pdf, checked
on 8/18/2017.
European Union (2014b): Attitudes of European Citizens Towards the Environment. Edit-
ed by European Union (Special Eurobarometer, 416 / Wave EB81.3). Available online at
http://ec.europa.eu/commfrontoffice/publicopinion/archives/ebs/ebs_416_en.pdf, checked
on 8/18/2017.
GESIS (2017): Eurobarometer Data Service. The European Commission's Eurobarometer
Surveys. Available online at https://www.gesis.org/eurobarometer-data-service/home/,
checked on 8/18/2017.
Google (2017): Google Trends Help Center. Available online at
https://support.google.com/trends/?hl=en#topic=6248052, checked on 8/18/2017.
Hagel, John; Brown, John Seely; Kulasooriya, Duleesha (2014): A movement in the mak-
ing. Edited by Deloitte Center for the Edge. Available online at
https://dupress.deloitte.com/dup-us-en/topics/emerging-technologies/a-movement-in-the-
making.html, checked on 6/6/2017.
Synopsis of evidence and conclusions
66
Howaldt, Jürgen; Schwarz, Michael; Henning, Klaus; Hees, Frank (2010): Social Innova-
tion: Concepts, research fields and international trends: IMA/ZLW.
Klöckner, Christian A. (2013): A comprehensive model of the psychology of environmen-
tal behaviour—A meta-analysis. In Global Environmental Change 23 (5), pp. 1028–1038.
Kohtala, Cindy; Hyysalo, Sampsa (2015): Anticipated environmental sustainability of per-
sonal fabrication. In Journal of Cleaner Production 99, pp. 333–344. DOI:
10.1016/j.jclepro.2015.02.093.
Lacy, Stephen; Watson, Brendan R.; Riffe, Daniel; Lovejoy, Jennette (2015): Issues and
Best Practices in Content Analysis. In Journalism & Mass Communication Quarterly 92
(4), pp. 791–811. DOI: 10.1177/1077699015607338.
Lange, Bastian; Schmidt, Suntje; Domann, Valentin; Ibert, Oliver; Kühn, Juliane; Kuebart,
Andreas (2017): Basteln – Gestalten – Experimentieren: Offene kreative Orte in Deutsch-
land. Leibniz-Institut für Länderkunde (IfL). Leipzig (Nationalatlas aktuell 11 (04.2017),
3). Available online at http://aktuell.nationalatlas.de/kreative_Orte.3_04-2017.0.html/, che-
cked on 6/6/2017.
Maker Media, Inc. (2017): Fast Facts. Available online at http://makerfaire.com/media-
center/#fast-facts, checked on 6/6/2017.
Moulaert, Frank; MacCallum, Diana; Hillier, Jean (2013): Social innovation: intuition,
precept, concept, theory and practice. In Frank Moulaert, Diana MacCallum, Abid
Mehmood, Abdelillah Hamdouch (Eds.): The international handbook on social innovation.
Collective action, social learning and transdisciplinary research. Cheltenham [England]:
Edward Elgar Publishing, pp. 13–24.
Neumeier, Stefan (2012): Why do Social Innovations in Rural Development Matter and
Should They be Considered More Seriously in Rural Development Research? - Proposal
for a Stronger Focus on Social Innovations in Rural Development Research. In Sociologia
Ruralis 52 (1), pp. 48–69. DOI: 10.1111/j.1467-9523.2011.00553.x.
Newig, Jens (2004): Public Attention, Political Action. The Example of Environmental
Regulation. In Rationality and Society 16 (2), pp. 149–190. DOI:
10.1177/1043463104043713.
Repair Café International Foundation (2015): Repair Café Foundation and iFixit start co-
operation. Available online at https://repaircafe.org/en/repair-cafe-foundation-and-ifixit-
start-cooperation/, checked on 6/28/2017.
Repair Café International Foundation (2017): Repair Cafés prevent 250,000 kilos of waste.
Available online at https://repaircafe.org/en/repair-cafes-prevent-250000-kilos-waste/,
checked on 8/2/2017.

Synopsis of evidence and conclusions
67
Ripberger, Joseph T. (2011): Capturing curiosity. Using Internet search trends to measure
public attentiveness. In Policy Studies Journal 39 (2), pp. 239–259.
Seyfang, Gill; Longhurst, Noel (2015): What influences the diffusion of grassroots innova-
tions for sustainability? Investigating community currency niches. In Technology Analysis
& Strategic Management, pp. 1–23. DOI: 10.1080/09537325.2015.1063603.
Simons, Arno; Petschow, Ulrich; Peuckert, Jan (2016): Offene Werkstätten - nachhaltig
innovativ? In Schriftenreihe des IÖW (212). Available online at
https://www.ioew.de/fileadmin/user_upload/BILDER_und_Downloaddateien/Publikatione
n/Schriftenreihen/IOEW_SR-212_Offene_Werkstaetten-nachhaltig_innovativ.pdf, checked
on 6/6/2017.
Stichting Repair Café (2010): Jaarverslag 2010. Edited by Stichting Repair Café. Stichting
Repair Café. Amsterdam. Available online at http://repaircafe.org/wp-
content/uploads/2015/09/Jaarverslag_2010.pdf, checked on 8/3/2017.
Stichting Repair Café (2011): Jaarverslag 2011. Edited by Stichting Repair Café. Stichting
Repair Café. Amsterdam. Available online at http://repaircafe.org/wp-
content/uploads/2015/09/Jaarverslag_2011_webversie.pdf, checked on 8/3/2017.
Stichting Repair Café (2012): Jaarverslag 2012. Edited by Stichting Repair Café. Stichting
Repair Café. Amsterdam. Available online at http://repaircafe.org/wp-
content/uploads/2015/09/Jaarverslag_2012_webversie.pdf, checked on 8/3/2017.
Stichting Repair Café International (2016): Jaarverslag 2016. Edited by Stichting Repair
Café International. Stichting Repair Café International. Amsterdam. Available online at
https://repaircafe.org/wp-content/uploads/2017/06/Jaarverslag_2016_webversie.pdf,
checked on 8/3/2017.
Stichting Repair Café Nederland (2013): Jaarverslag 2013. Edited by Stichting Repair Café
Nederland. Stichting Repair Café Nederland. Amsterdam. Available online at
http://repaircafe.org/wp-content/uploads/2015/09/Jaarverslag_2013_webversie.pdf,
checked on 8/3/2017.
Stichting Repair Café Nederland (2014): Jaarverslag 2014. Edited by Stichting Repair Café
Nederland. Stichting Repair Café Nederland. Amsterdam. Available online at
http://repaircafe.org/wp-content/uploads/2015/09/Jaarverslag_2014_webversie.pdf,
checked on 8/3/2017.
Stichting Repair Café Nederland (2015): Jaarverslag 2015. Edited by Stichting Repair Café
Nederland. Stichting Repair Café Nederland. Amsterdam. Available online at
http://repaircafe.org/wp-content/uploads/2016/03/Jaarverslag_2015_webversie.pdf,
checked on 8/3/2017.
Synopsis of evidence and conclusions
68
Stiftungsgemeinschaft anstiftung & erthomis gGmbH (Ed.) (2015): Reparieren. Projekte,
Orte und Akteure einer Bewegung. München, checked on 6/28/2017.
Stryker, Jo Ellen; Wray, Ricardo J.; Hornik, Robert C.; Yanovitzky, Itzik (2016): Valida-
tion of Database Search Terms for Content Analysis. The Case of Cancer News Coverage.
In Journalism & Mass Communication Quarterly 83 (2), pp. 413–430. DOI:
10.1177/107769900608300212.
Unterfrauner, Elisabeth; Schrammel, Maria; Hofer, Margit; Fabian, Claudia Magdalena;
Voigt, Christian; Deljanin, Sarah Roxenne et al. (2017): D3.2 Final case study report fo-
cusing on cross-case analysis. Edited by Zentrum für Soziale Innovation (MAKE-IT).
Available online at http://make-it.io/wordpress/wp-
content/uploads/dlm_uploads/2017/07/MAKE-IT_D3.2.pdf, checked on 8/1/2017.
Walz, Rainer (2016): Indikatorik von Innovationen im Kontext der deutschen Nachhaltig-
keitsstrategie - Reflexion bisheriger Erfahrungen und Überlegungen zur Weiterentwick-
lung. Kurzgutachten im Auftrag des Rates für Nachhaltige Entwicklung. Karslruhe: Fraun-
hofer ISI. Available online at http://www.isi.fraunhofer.de/isi-
wAs-
sets/docs/n/de/publikationen/20160313_Fraunhofer_ISI_RNE_Studie_Indikatorik_von_In
novationen.pdf, checked on 8/1/2016.
Walz, Rainer; Gotsch, Matthias; Gandenberger, Carsten; Peters, Anja; Bodenheimer,
Miriam; Günther, Edeltraud (2017): Nachhaltiges Wirtschaften. Stand der Transformation
zu einer Green Economy. Edited by Fraunhofer Institut für System- und Innovationsfor-
schung -ISI-. Karlsruhe (Working Papers Sustainability and Innovation, WP03-2017).
Available online at http://www.isi.fraunhofer.de/isi-
wAssets/docs/x/de/publikationen/Working-Papers/WP-03-2017_Nachhaltiges-
Wirtschaften_RW.pdf, checked on 6/26/2017.
Warnke, Philine; Koschatzky, Knut; Dönitz, Ewa; Zenker, Andrea; Stahlecker, Thomas;
Som, Oliver et al. (2016): Opening up the innovation system framework towards new ac-
tors and institutions. Edited by Fraunhofer ISI. Fraunhofer ISI. Karlsruhe (Fraunhofer ISI
Discussion Papers Innovation Systems and Policy Analysis, 49). Available online at
http://www.isi.fraunhofer.de/isi-
wAssets/docs/p/de/diskpap_innosysteme_policyanalyse/discussionpaper_49_2016.pdf.
Wissenschaftlicher Beirat der Bundesregierung Globale Umweltveränderungen (WBGU)
(2011): World in transition. A social contract for sustainability. Berlin: WBGU.
World Values Survey Association (2017): World Values Survey. Available online at
http://www.worldvaluessurvey.org/wvs.jsp, checked on 8/18/2017.
Zirngiebl, Marthe (2017): Good intentions are not enough - the Maker Movement's current
contribution to sustainability transitions. In. International Sustainability Conference 2017.

Synopsis of evidence and conclusions
69
Göteborg, Schweden, 18. - 21. Juni 2017 (IST 2017). Available online at
https://www5.shocklogic.com/scripts/jmevent/programme.php?client_Id=KONGRESS&pr
oject_Id=17361, checked on 6/6/2017.
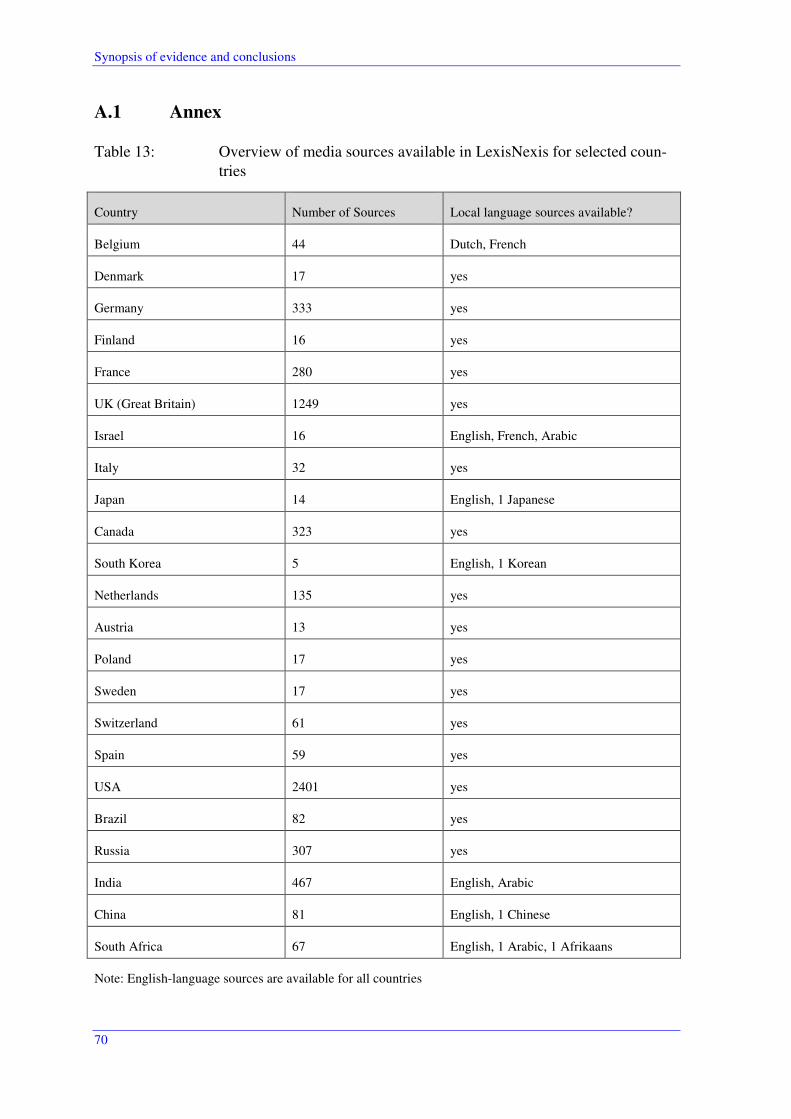
Synopsis of evidence and conclusions
70
A.1 Annex
Table 13: Overview of media sources available in LexisNexis for selected coun-tries
Country Number of Sources Local language sources available?
Belgium 44 Dutch, French
Denmark 17 yes
Germany 333 yes
Finland 16 yes
France 280 yes
UK (Great Britain) 1249 yes
Israel 16 English, French, Arabic
Italy 32 yes
Japan 14 English, 1 Japanese
Canada 323 yes
South Korea 5 English, 1 Korean
Netherlands 135 yes
Austria 13 yes
Poland 17 yes
Sweden 17 yes
Switzerland 61 yes
Spain 59 yes
USA 2401 yes
Brazil 82 yes
Russia 307 yes
India 467 English, Arabic
China 81 English, 1 Chinese
South Africa 67 English, 1 Arabic, 1 Afrikaans
Note: English-language sources are available for all countries
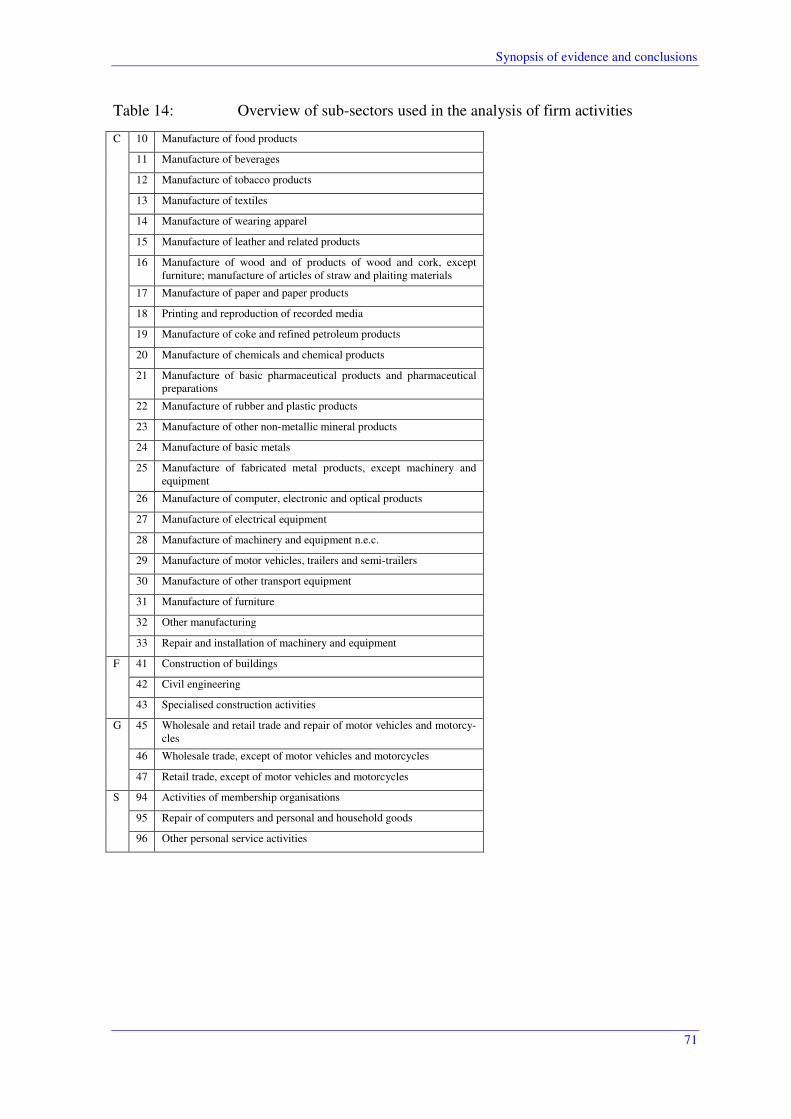
Synopsis of evidence and conclusions
71
Table 14: Overview of sub-sectors used in the analysis of firm activities
C 10 Manufacture of food products
11 Manufacture of beverages
12 Manufacture of tobacco products
13 Manufacture of textiles
14 Manufacture of wearing apparel
15 Manufacture of leather and related products
16 Manufacture of wood and of products of wood and cork, except furniture; manufacture of articles of straw and plaiting materials
17 Manufacture of paper and paper products
18 Printing and reproduction of recorded media
19 Manufacture of coke and refined petroleum products
20 Manufacture of chemicals and chemical products
21 Manufacture of basic pharmaceutical products and pharmaceutical preparations
22 Manufacture of rubber and plastic products
23 Manufacture of other non-metallic mineral products
24 Manufacture of basic metals
25 Manufacture of fabricated metal products, except machinery and equipment
26 Manufacture of computer, electronic and optical products
27 Manufacture of electrical equipment
28 Manufacture of machinery and equipment n.e.c.
29 Manufacture of motor vehicles, trailers and semi-trailers
30 Manufacture of other transport equipment
31 Manufacture of furniture
32 Other manufacturing
33 Repair and installation of machinery and equipment
F 41 Construction of buildings
42 Civil engineering
43 Specialised construction activities
G 45 Wholesale and retail trade and repair of motor vehicles and motorcy-cles
46 Wholesale trade, except of motor vehicles and motorcycles
47 Retail trade, except of motor vehicles and motorcycles
S 94 Activities of membership organisations
95 Repair of computers and personal and household goods
96 Other personal service activities