infographics and big data
TRANSCRIPT

Digital Infographics and BIG DATA
A Crash Course

Info – Graphics
• Using graphic representations in order to convey information.
• Easier to remember• Easier to understand• Looks pretty

Spatial Inforgraphics
Information that describes relative positions and the spatial relationships in a physical or conceptual location.

Chronographical Infographics
Information that describes sequential positions and the causal relationships in a physical or conceptual timeline

Quantitative Infographics
Information that describes scale, proportion, change and organization of quantities in space, time or both.
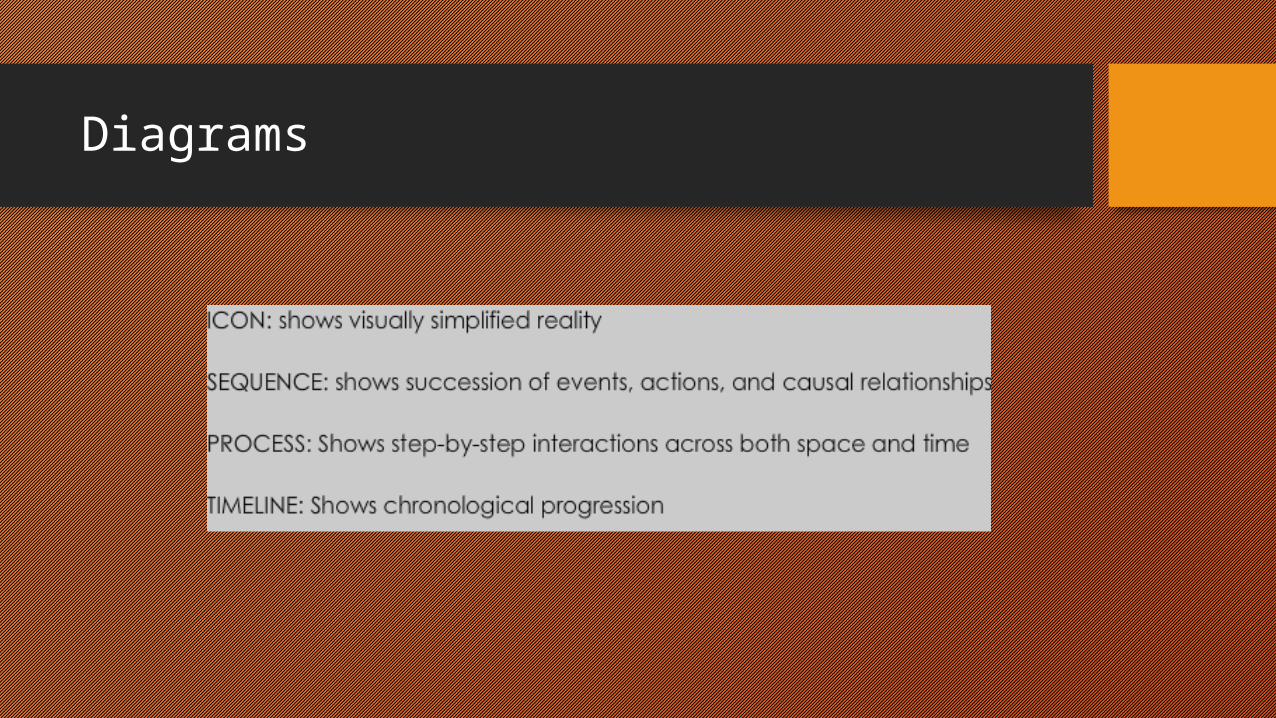
Diagrams
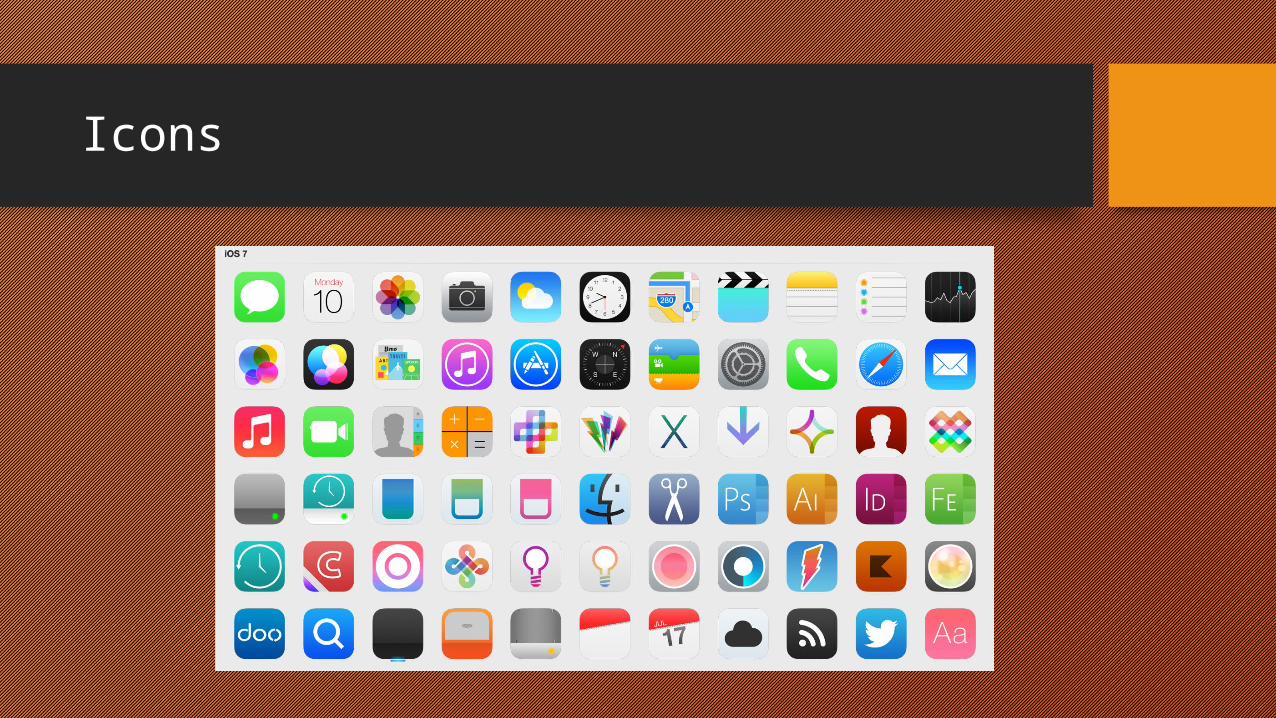
Icons

Sequence
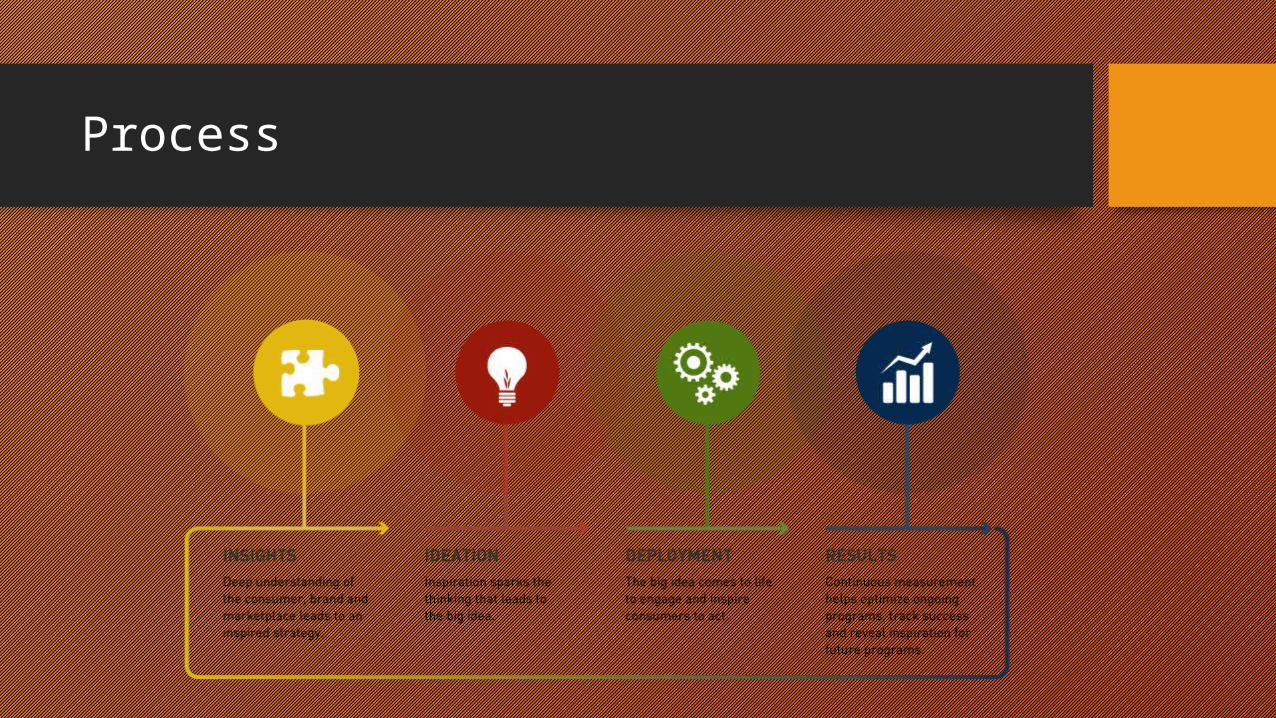
Process

Timeline

Maps
Locator: Shows location in relation to something else
Data: Shows quantitative information in relation to its geographic location
Schematic: shows abstracted representations of geography, process, or sequence

Charts
Flow Charts
Organization
Bar Chart
Pie Charts
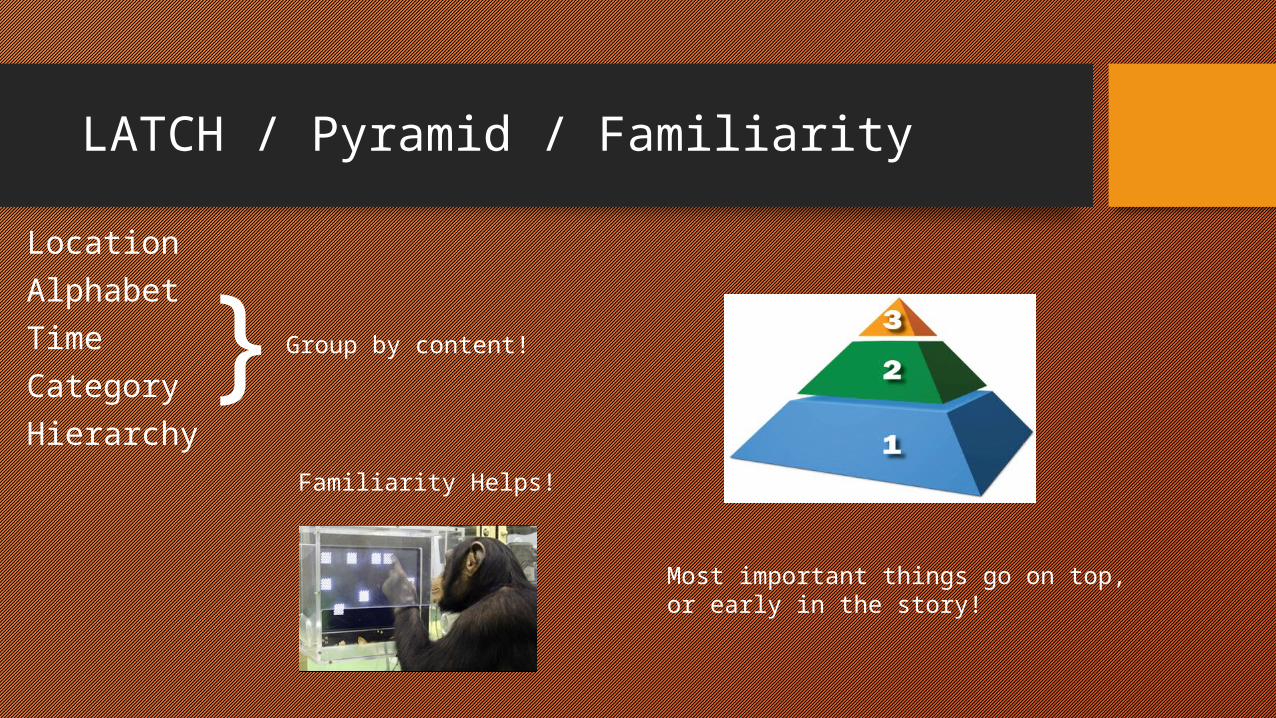
LATCH / Pyramid / Familiarity
Location
Alphabet
Time
Category
Hierarchy
} Group by content!
Most important things go on top, or early in the story!
Familiarity Helps!

Tricks to remember
Learning Style Memory
ProcessPerception

Communication Methods
• Static – Information presented immediately and there is no motion
• Motion - Information presented progressively in a linear sequence
• Interactive – Information Presented Selectively based on user choice
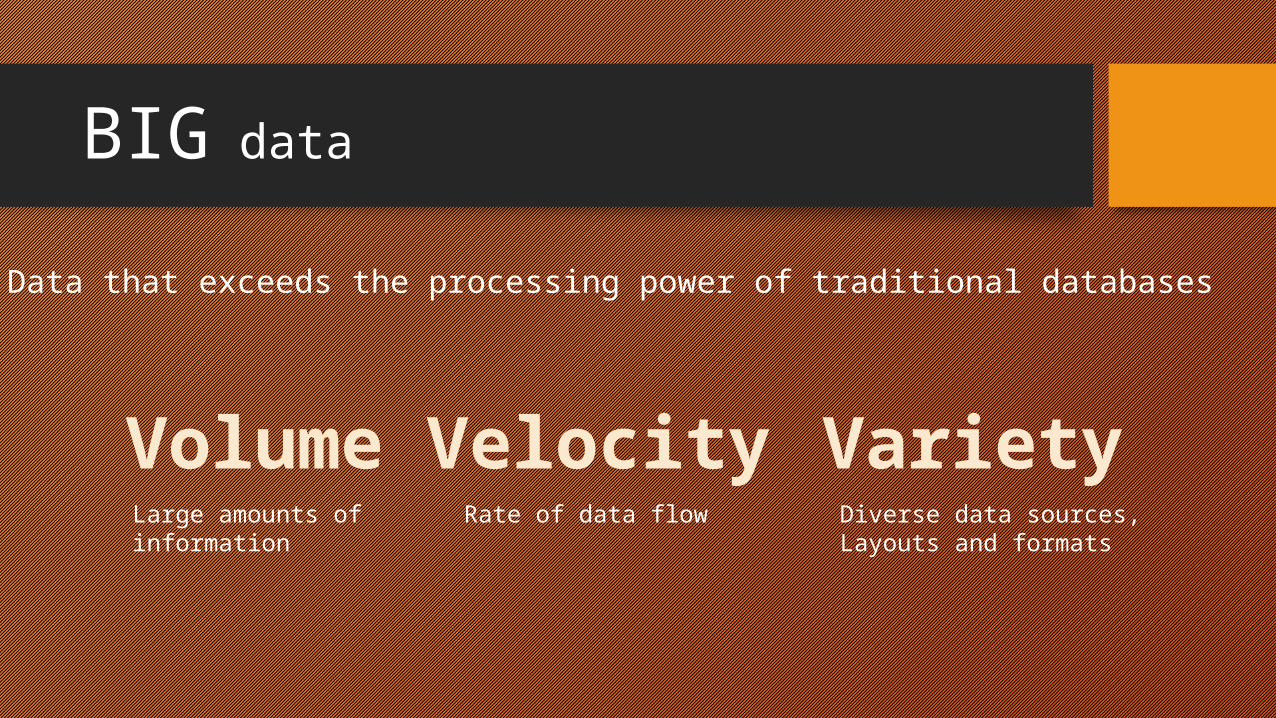
BIG data
Data that exceeds the processing power of traditional databases
Volume Velocity VarietyLarge amounts of information
Rate of data flow Diverse data sources, Layouts and formats

What is it used for?
Recommender Systems
Predictive Modelling
Real-time data analysis
Large data traversal without storage

What is it used for?
• Consumer product companies and retail organizations are monitoring social media like Facebook and Twitter to get an unprecedented view into customer behavior, preferences, and product perception.
• Manufacturers are monitoring minute vibration data from their equipment, which changes slightly as it wears down, to predict the optimal time to replace or maintain. Replacing it too soon wastes money; replacing it too late triggers an expensive work stoppage
• Manufacturers are also monitoring social networks, but with a different goal than marketers: They are using it to detect aftermarket support issues before a warranty failure becomes publicly detrimental.
• The government is making data public at both the national, state, and city level for users to develop new applications that can generate public good. Learn how government agencies significantly reduce the barrier to implementing open data with NuCivic Data
• Financial Services organizations are using data mined from customer interactions to slice and dice their users into finely tuned segments. This enables these financial institutions to create increasingly relevant and sophisticated offers.

What is it used for?
• Advertising and marketing agencies are tracking social media to understand responsiveness to campaigns, promotions, and other advertising mediums.
• Insurance companies are using Big Data analysis to see which home insurance applications can be immediately processed, and which ones need a validating in-person visit from an agent.
• By embracing social media, retail organizations are engaging brand advocates, changing the perception of brand antagonists, and even enabling enthusiastic customers to sell their products.
• Hospitals are analyzing medical data and patient records to predict those patients that are likely to seek readmission within a few months of discharge. The hospital can then intervene in hopes of preventing another costly hospital stay.
• Web-based businesses are developing information products that combine data gathered from customers to offer more appealing recommendations and more successful coupon programs.
• Sports teams are using data for tracking ticket sales and even for tracking team strategies.

Real life examples – Real time data analysis
When a customer jokingly tweeted the Chicago-based steakhouse chain and requested that dinner be sent to the Newark airport, where he would be getting in late after a long day of work, Morton's became a player in a social media stunt heard 'round the Interwebs. The steakhouse saw the tweet, discovered he was a frequent customer (and frequent tweeter), pulled data on what he typically ordered, figured out which flight he was on, and then sent a tuxedo-clad delivery person to serve him his dinner.
Real life examples
Macy's Inc. The retailer adjusts pricing in near-real time for 73 million + items, based on demand and inventory.
PredPol Inc. The software can predict where crimes are likely to occur down to 500 square feet. In LA, there's been a 33% reduction in burglaries and 21% reduction in violent crimes in areas where the software is being used.
Tesco. The supermarket chain collected 70 million refrigerator-related data points coming off its units and fed them into a dedicated data warehouse. Those data points were analyzed to keep better tabs on performance, gauge when the machines might need to be serviced and do more proactive maintenance to cut down on energy costs
Companies like Time Warner, Comcast, and Cablevision are using big data to track media consumption and engagement, advertising, and customer retention as well as operations and infrastructure. The video game industry is using big data for tracking during gameplay and after, predicting performance, and analyzing over 500GB of structured data and 4 TB of operational logs each day.

Technologies
Traditional Setup
BIG Data with Hadoop

Traditional Database Layout
Structured Data SourcesThis is the data creation component. Typically, these are applications that capture transactional data that gets stored in a relational database. Example sources include: ERP, CRM, financial data, POS data, trouble tickets, e-commerce and legacy apps.
Enterprise data warehouse (EDW)This is the data storage component. The EDW is a repository of integrated data from multiple structured data sources used for reporting and data analysis. Data integration tools, such as ETL, are typically used to extract, transform and load structured data into a relational or column-oriented DBMS. Example storage components include:operational warehouse, analytical warehouse (or sandbox), data mart, operational data store (ODS) and data warehouse appliance.
Business Intelligence / AnalyticsThis is the data action component. These are the applications, tools and utilities designed for users to access, interact, analyze and make decisions using data in relational databases and warehouses.
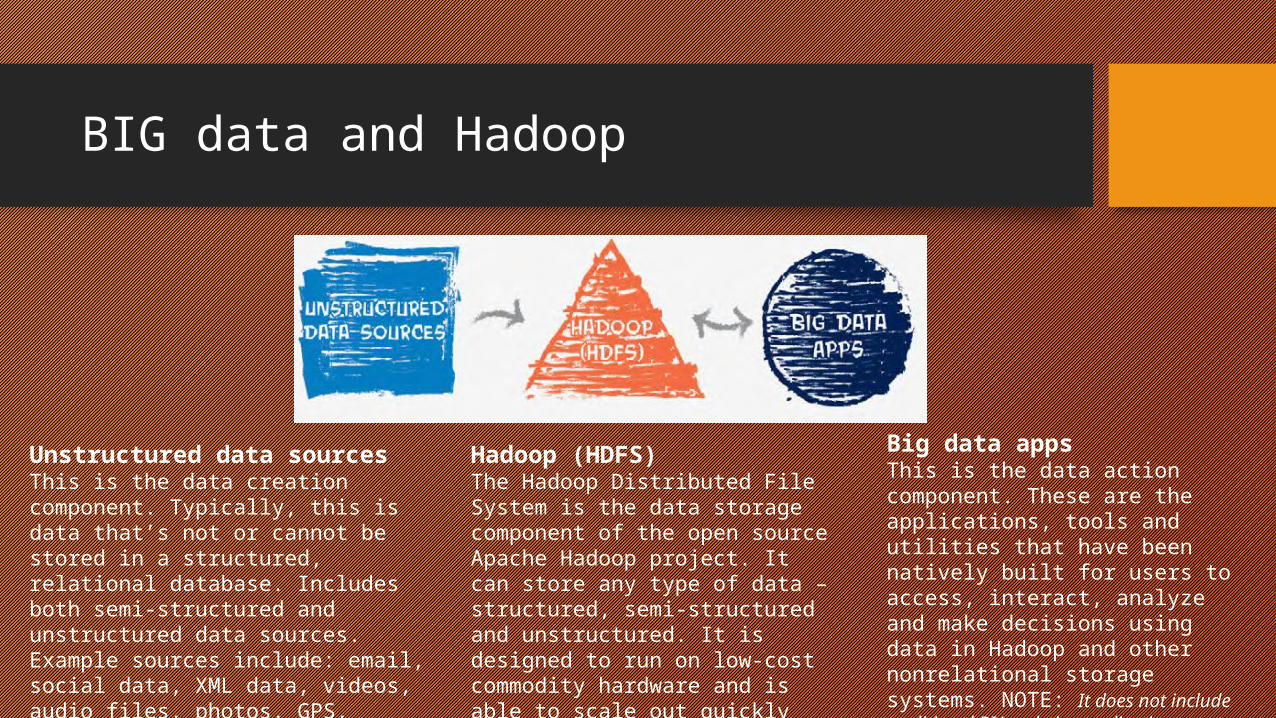
BIG data and Hadoop
Unstructured data sourcesThis is the data creation component. Typically, this is data that’s not or cannot be stored in a structured, relational database. Includes both semi-structured and unstructured data sources. Example sources include: email, social data, XML data, videos, audio files, photos, GPS, satellite images, sensor data, spreadsheets, web log data, mobile data, RFID tags and PDF docs.
Hadoop (HDFS) The Hadoop Distributed File System is the data storage component of the open source Apache Hadoop project. It can store any type of data – structured, semi-structured and unstructured. It is designed to run on low-cost commodity hardware and is able to scale out quickly and cheaply across thousands of machines.
Big data appsThis is the data action component. These are the applications, tools and utilities that have been natively built for users to access, interact, analyze and make decisions using data in Hadoop and other nonrelational storage systems. NOTE: It does not include traditional BI/analytics applicationsor tools that have been extended to support Hadoop.

You may hear the term ‘MapReduce’
Don’t panic… it’s nothing complicated (in theory).
MapReduce is the resource management and processing component of Hadoop. MapReduce allows Hadoop developers to write optimized programs that can process large volumes of data, structured and unstructured, in parallel across clusters of machines in a reliable and fault-tolerant way.
Another benefit of MapReduce is that it processes the data where it resides (in HDFS)instead of moving it around, as is sometimes the case in a traditional EDW system. It also comes with a built-in recovery system – so if one machine goes down, MapReduce knows where to go to get another copy of the data.
Although MapReduce processing is lightning fast when compared to more traditional methods, its jobs must be run in batch mode. This has proven to be a limitation for organizations that need to process data more frequently and/or closer to real time. The good news is that with the release of Hadoop 2.0, the resource management functionality has been packaged separately (it’s called YARN) so that MapReduce doesn’t get bottlenecked and can stay focused on what it does best: processing data.
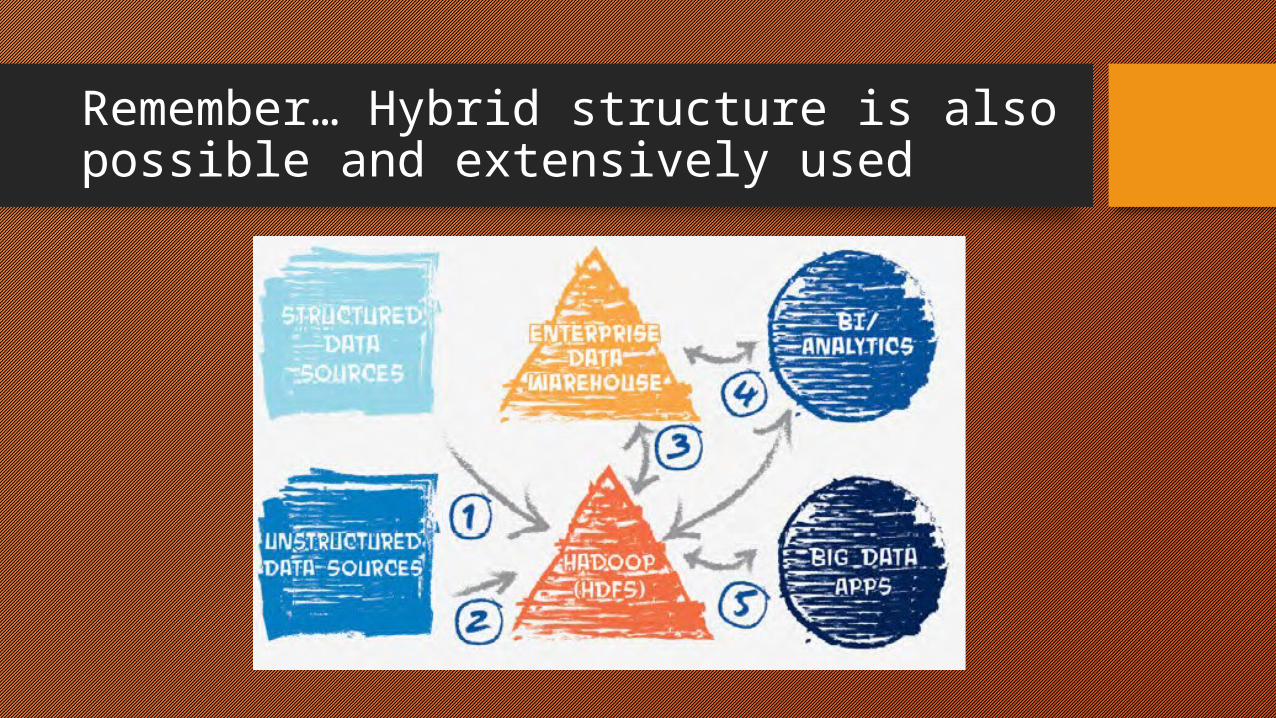
Remember… Hybrid structure is also possible and extensively used