india’s stock of commercial real estate - jll · 2 india’s stock of commercial real estate...
TRANSCRIPT

India’s Stock of Commercial Real Estate
Research Report
2014
On Point
The new preference for international and domestic funds
India’s Stock of Commercial Real Estate 2
Nevertheless, India continues to lead in terms of GDP growth over comparable emerging and developed nations, largely on the back of its socioeconomic fundamentals that remain intact. With a population younger than other comparable emerging nations, India’s favourable demographics and ensuing rise in consumption are sure to last longer than those in other countries, promising a prolonged period of higher GDP and income growth. The median age of India’s population is only 26, while that of other leading emerging nations ranges from 30 to 40. In leading developed nations, the median age falls in the range of 37-46, signalling a relatively lower propensity to spend and a much lower GDP growth rate compared to emerging countries.
Fundamentals remain strong despite frustration over current slow economic growth
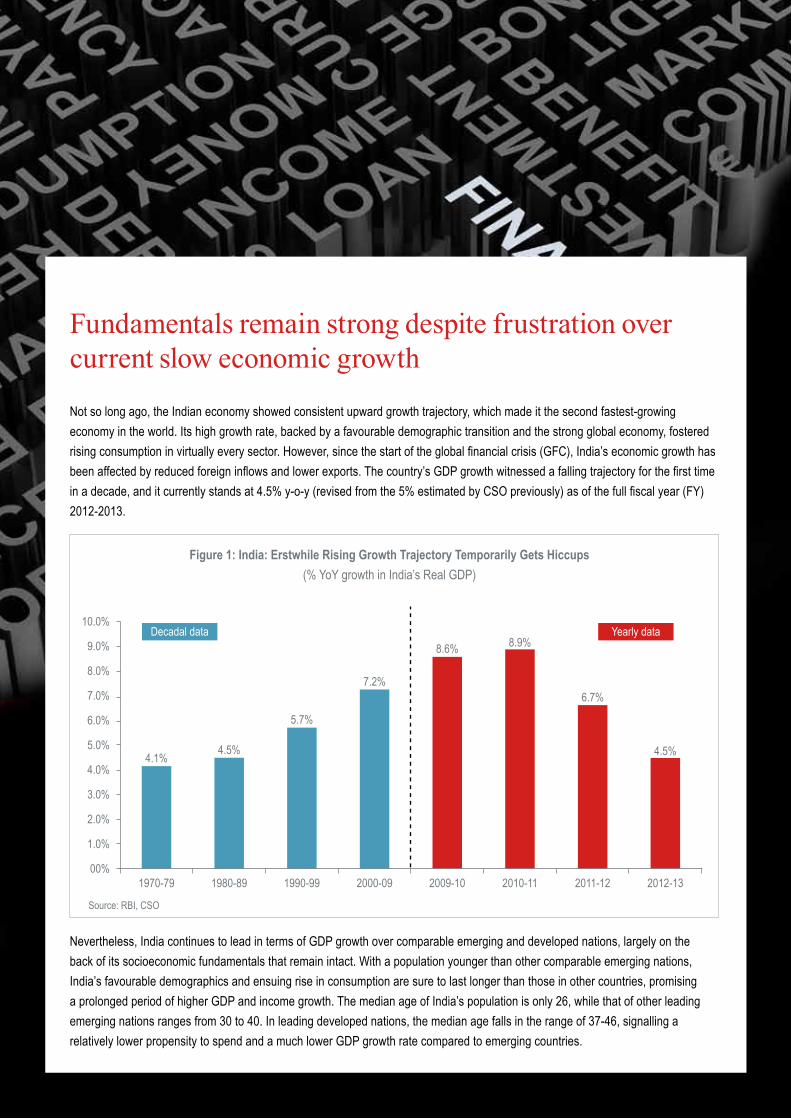
Not so long ago, the Indian economy showed consistent upward growth trajectory, which made it the second fastest-growing economy in the world. Its high growth rate, backed by a favourable demographic transition and the strong global economy, fostered rising consumption in virtually every sector. However, since the start of the global financial crisis (GFC), India’s economic growth has been affected by reduced foreign inflows and lower exports. The country’s GDP growth witnessed a falling trajectory for the first time in a decade, and it currently stands at 4.5% y-o-y (revised from the 5% estimated by CSO previously) as of the full fiscal year (FY) 2012-2013.
Figure 1: India: Erstwhile Rising Growth Trajectory Temporarily Gets Hiccups(% YoY growth in India’s Real GDP)
Source: RBI, CSO
10.0%
1970-79
4.1% 4.5%
5.7%
7.2%
8.6% 8.9%
6.7%
4.5%
1980-89 1990-99 2000-09 2009-10 2010-11 2011-12 2012-13
9.0%
8.0%
7.0%
6.0%
5.0%
4.0%
3.0%
2.0%
1.0%
00%
Decadal data Yearly data
India’s Stock of Commercial Real Estate 3
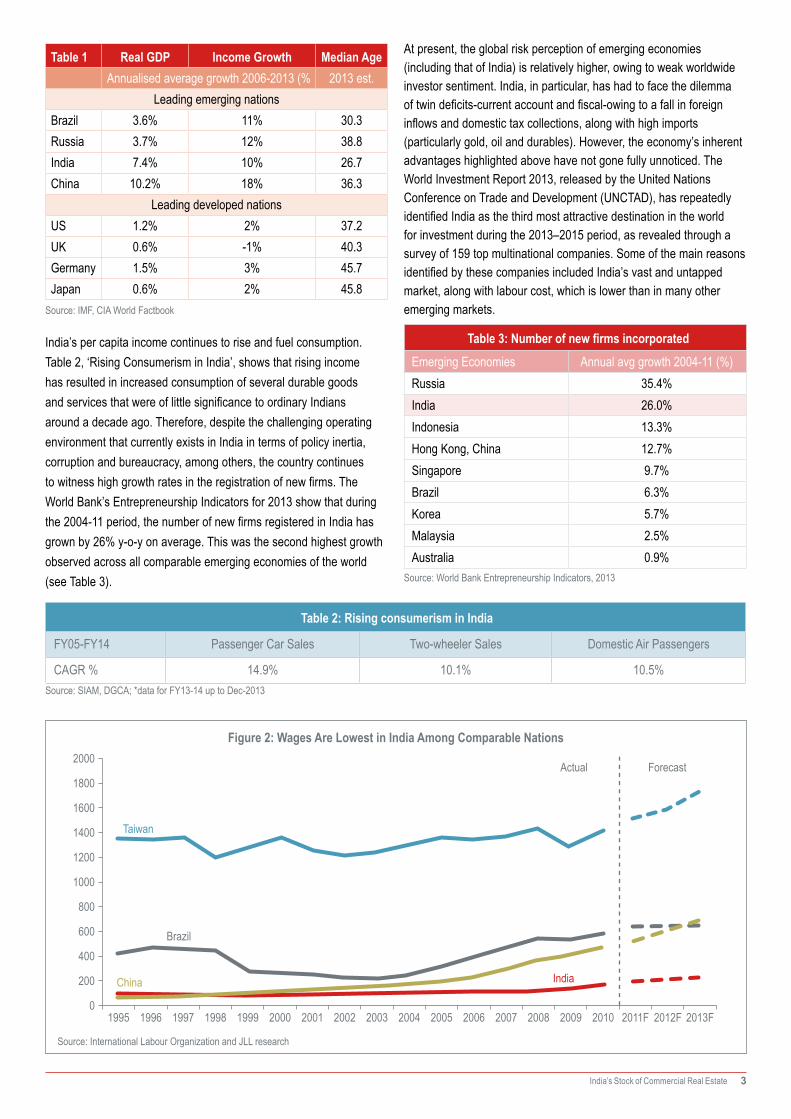
Table 1 Real GDP Income Growth Median AgeAnnualised average growth 2006-2013 (% 2013 est.
Leading emerging nationsBrazil 3.6% 11% 30.3Russia 3.7% 12% 38.8India 7.4% 10% 26.7China 10.2% 18% 36.3
Leading developed nationsUS 1.2% 2% 37.2UK 0.6% -1% 40.3Germany 1.5% 3% 45.7Japan 0.6% 2% 45.8
Source: IMF, CIA World Factbook
Source: SIAM, DGCA; *data for FY13-14 up to Dec-2013
Source: World Bank Entrepreneurship Indicators, 2013
Table 2: Rising consumerism in India
FY05-FY14 Passenger Car Sales Two-wheeler Sales Domestic Air Passengers
CAGR % 14.9% 10.1% 10.5%
Figure 2: Wages Are Lowest in India Among Comparable Nations
India’s per capita income continues to rise and fuel consumption. Table 2, ‘Rising Consumerism in India’, shows that rising income has resulted in increased consumption of several durable goods and services that were of little significance to ordinary Indians around a decade ago. Therefore, despite the challenging operating environment that currently exists in India in terms of policy inertia, corruption and bureaucracy, among others, the country continues to witness high growth rates in the registration of new firms. The World Bank’s Entrepreneurship Indicators for 2013 show that during the 2004-11 period, the number of new firms registered in India has grown by 26% y-o-y on average. This was the second highest growth observed across all comparable emerging economies of the world (see Table 3).
At present, the global risk perception of emerging economies (including that of India) is relatively higher, owing to weak worldwide investor sentiment. India, in particular, has had to face the dilemma of twin deficits-current account and fiscal-owing to a fall in foreign inflows and domestic tax collections, along with high imports (particularly gold, oil and durables). However, the economy’s inherent advantages highlighted above have not gone fully unnoticed. The World Investment Report 2013, released by the United Nations Conference on Trade and Development (UNCTAD), has repeatedly identified India as the third most attractive destination in the world for investment during the 2013–2015 period, as revealed through a survey of 159 top multinational companies. Some of the main reasons identified by these companies included India’s vast and untapped market, along with labour cost, which is lower than in many other emerging markets.
Table 3: Number of new firms incorporatedEmerging Economies Annual avg growth 2004-11 (%)Russia 35.4%India 26.0%Indonesia 13.3%Hong Kong, China 12.7%Singapore 9.7%Brazil 6.3%Korea 5.7%Malaysia 2.5%Australia 0.9%
2000
1600
1200
1000
800
600
400
200
1995 1996 1997 1998 1999 2000 2001 2002 2003 2004 2005 2006 2007 2008 2009 2010 2011F 2012F 2013F
Actual Forecast
0
Brazil
Taiwan
China India
1800
1400
Source: International Labour Organization and JLL research
India’s Stock of Commercial Real Estate 4
Real estate in India: Gradually gaining the interest of mainstream investors
Figure-3(c)
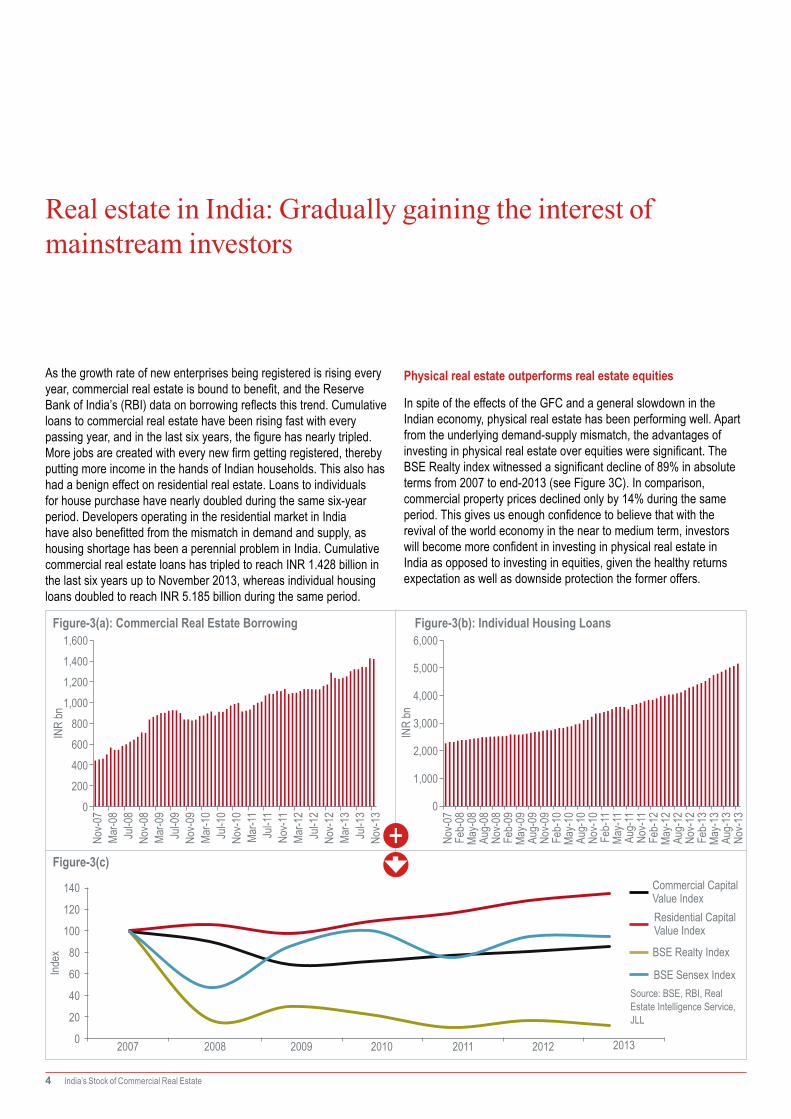
Figure-3(a): Commercial Real Estate Borrowing Figure-3(b): Individual Housing Loans
0
Nov-0
7Ma
r-08
Mar-0
9
Mar-1
0
Mar-1
1
Mar-1
2
Mar-1
3
Jul-0
8
Jul-0
9
Jul-1
0
Jul-1
1
Jul-1
2
Jul-1
3
Nov-0
8
Nov-0
9
Nov-1
0
Nov-1
1
Nov-1
2
Nov-1
3
1,6001,4001,2001,000
800600400200
INR
bn
Source: BSE, RBI, Real Estate Intelligence Service, JLL
140
120
100
80
60
40
20
Index
2007 2008 2009 2010 2011 2012 20130
Commercial Capital Value IndexResidential Capital Value Index
BSE Realty Index
BSE Sensex Index
Nov-0
7Fe
b-08
Feb-
09
Feb-
10
Feb-
11
Feb-
12
Feb-
13
May-0
8
May-0
9
May-1
0
May-1
1
May-1
2
May-1
3
Nov-0
8
Nov-0
9
Nov-1
0
Nov-1
1
Nov-1
2
Nov-1
3
Aug-
08
Aug-
09
Aug-
10
Aug-
11
Aug-
12
Aug-
13
6,000
5,000
4,000
3,000
2,000
1,000
0
INR
bn
As the growth rate of new enterprises being registered is rising every year, commercial real estate is bound to benefit, and the Reserve Bank of India’s (RBI) data on borrowing reflects this trend. Cumulative loans to commercial real estate have been rising fast with every passing year, and in the last six years, the figure has nearly tripled. More jobs are created with every new firm getting registered, thereby putting more income in the hands of Indian households. This also has had a benign effect on residential real estate. Loans to individuals for house purchase have nearly doubled during the same six-year period. Developers operating in the residential market in India have also benefitted from the mismatch in demand and supply, as housing shortage has been a perennial problem in India. Cumulative commercial real estate loans has tripled to reach INR 1.428 billion in the last six years up to November 2013, whereas individual housing loans doubled to reach INR 5.185 billion during the same period.
Physical real estate outperforms real estate equities
In spite of the effects of the GFC and a general slowdown in the Indian economy, physical real estate has been performing well. Apart from the underlying demand-supply mismatch, the advantages of investing in physical real estate over equities were significant. The BSE Realty index witnessed a significant decline of 89% in absolute terms from 2007 to end-2013 (see Figure 3C). In comparison, commercial property prices declined only by 14% during the same period. This gives us enough confidence to believe that with the revival of the world economy in the near to medium term, investors will become more confident in investing in physical real estate in India as opposed to investing in equities, given the healthy returns expectation as well as downside protection the former offers.
India’s Stock of Commercial Real Estate 5
IT-ITES sector-the largest occupier of real estate space in India-continues to strengthen
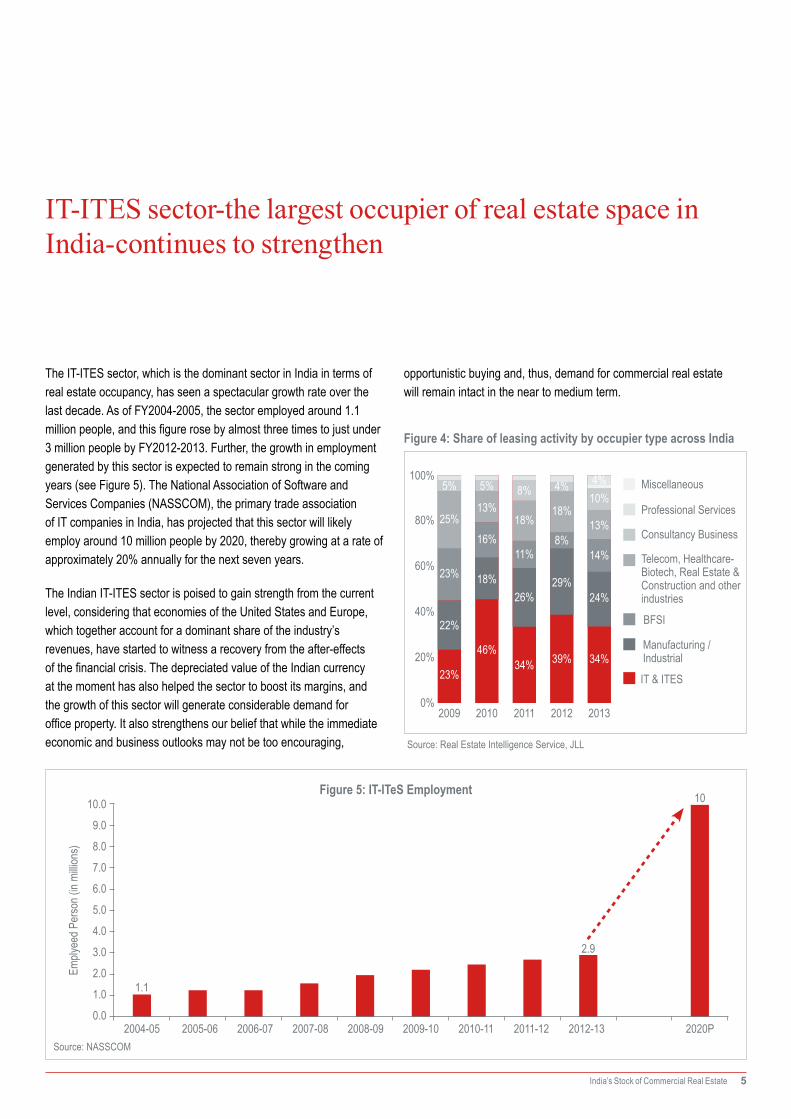
The IT-ITES sector, which is the dominant sector in India in terms of real estate occupancy, has seen a spectacular growth rate over the last decade. As of FY2004-2005, the sector employed around 1.1 million people, and this figure rose by almost three times to just under 3 million people by FY2012-2013. Further, the growth in employment generated by this sector is expected to remain strong in the coming years (see Figure 5). The National Association of Software and Services Companies (NASSCOM), the primary trade association of IT companies in India, has projected that this sector will likely employ around 10 million people by 2020, thereby growing at a rate of approximately 20% annually for the next seven years.
The Indian IT-ITES sector is poised to gain strength from the current level, considering that economies of the United States and Europe, which together account for a dominant share of the industry’s revenues, have started to witness a recovery from the after-effects of the financial crisis. The depreciated value of the Indian currency at the moment has also helped the sector to boost its margins, and the growth of this sector will generate considerable demand for office property. It also strengthens our belief that while the immediate economic and business outlooks may not be too encouraging,
Source: NASSCOM
Source: Real Estate Intelligence Service, JLL
Figure 4: Share of leasing activity by occupier type across India
2009 2010 2011 2012 2013
100%
80%
60%
40%
20%
0%
Professional Services
Consultancy Business
Telecom, Healthcare-Biotech, Real Estate & Construction and other industries
BFSI
Miscellaneous
IT & ITES
Manufacturing / Industrial
23%
22%
23%
25%
5%
34%
26%
11%
18%
8%
39%
29%
8%
18%
4%
46%
18%
16%
13%
5%
34%
14%
13%
10%4%
24%
opportunistic buying and, thus, demand for commercial real estate will remain intact in the near to medium term.
Figure 5: IT-ITeS Employment
8.0
9.0
10.0
7.0
6.0
5.0
4.0
3.0
2.0
1.0
2004-05 2005-06 2006-07 2007-08 2008-09 2009-10 2010-11 2011-12 2012-13 2020P
1.1
2.9
10
0.0
Emply
eed P
erso
n (in
millio
ns)
India’s Stock of Commercial Real Estate 6
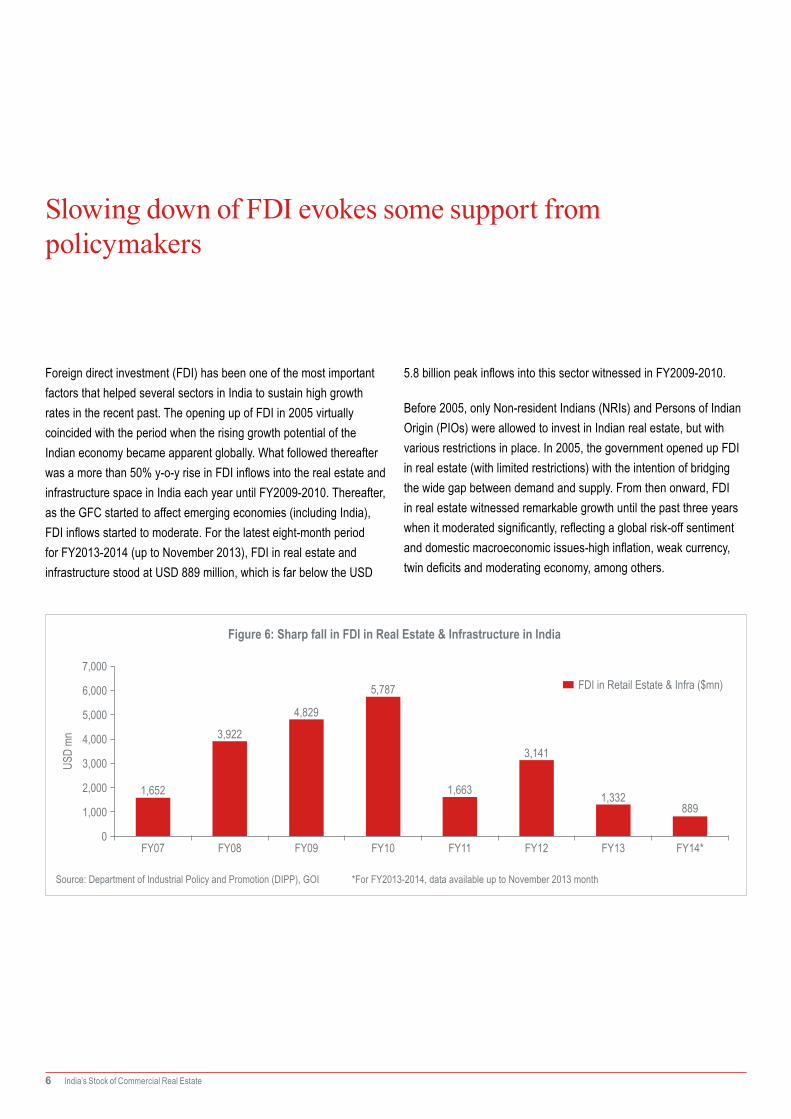
Slowing down of FDI evokes some support from policymakers
Foreign direct investment (FDI) has been one of the most important factors that helped several sectors in India to sustain high growth rates in the recent past. The opening up of FDI in 2005 virtually coincided with the period when the rising growth potential of the Indian economy became apparent globally. What followed thereafter was a more than 50% y-o-y rise in FDI inflows into the real estate and infrastructure space in India each year until FY2009-2010. Thereafter, as the GFC started to affect emerging economies (including India), FDI inflows started to moderate. For the latest eight-month period for FY2013-2014 (up to November 2013), FDI in real estate and infrastructure stood at USD 889 million, which is far below the USD
Source: Department of Industrial Policy and Promotion (DIPP), GOI *For FY2013-2014, data available up to November 2013 month
Figure 6: Sharp fall in FDI in Real Estate & Infrastructure in India
1,000
2,000
3,000
4,000
5,000
6,000
7,000
FY07 FY08 FY09 FY10 FY11 FY12 FY14*FY13
1,652
3,922
4,829
5,787
1,663
3,141
8891,332
FDI in Retail Estate & Infra ($mn)
0
USD
mn
5.8 billion peak inflows into this sector witnessed in FY2009-2010.
Before 2005, only Non-resident Indians (NRIs) and Persons of Indian Origin (PIOs) were allowed to invest in Indian real estate, but with various restrictions in place. In 2005, the government opened up FDI in real estate (with limited restrictions) with the intention of bridging the wide gap between demand and supply. From then onward, FDI in real estate witnessed remarkable growth until the past three years when it moderated significantly, reflecting a global risk-off sentiment and domestic macroeconomic issues-high inflation, weak currency, twin deficits and moderating economy, among others.
India’s Stock of Commercial Real Estate 7
Real estate investments in India: FDI conditions highlighted in the Press Note 3 guidelines
FDI in India is permitted either via the automatic route or through the approval route. Investments in integrated townships, housing, built-up infrastructure and construction development (including hotels and resorts, commercial, hospitals and so forth) are automatically approved.While the slowing growth of the Indian economy has significantly affected FDI inflows into the real estate sector, the government has recently shown a commitment toward reviving FDI investors’ sentiment, particularly for real estate.
Recent efforts of the government to revive FDI are moves in the right direction• There is a proposal to introduce the Real Estate Regulatory Bill,
which could help allay concerns over the transparency issues that currently plague the Indian real estate sector.
• In June 2013, the RBI eased norms for external commercial borrowings in the affordable housing sector. The minimum experience for developers was reduced from five to three years.
• Several initiatives were taken to allay concerns of international retailers, who were hitherto unconvinced about entering India despite the further opening up of the sector last year.
• In the retail sector, the government is mulling over the idea of further raising FDI limit to 74% in multibrand retailing from the present limit of 51%.
• Foreign retailers are now allowed to open stores in cities with less than 1 million population in those states where not a single city has a population of 1 million or more.
• The criteria of 30% sourcing from small and medium enterprises (SMEs) that have an investment cap of USD 1 million has been relaxed to some extent. The cap has now been raised to USD 2 million, considering the future growth prospects for the SME unit.
The Indian government is also toying with the idea of relaxing norms on minimum built-up areas, investment horizons (time frame) and minimum capitalisation conditions to encourage FDI capital inflows. These initiatives, we believe, would help in reviving sentiment among foreign investors.
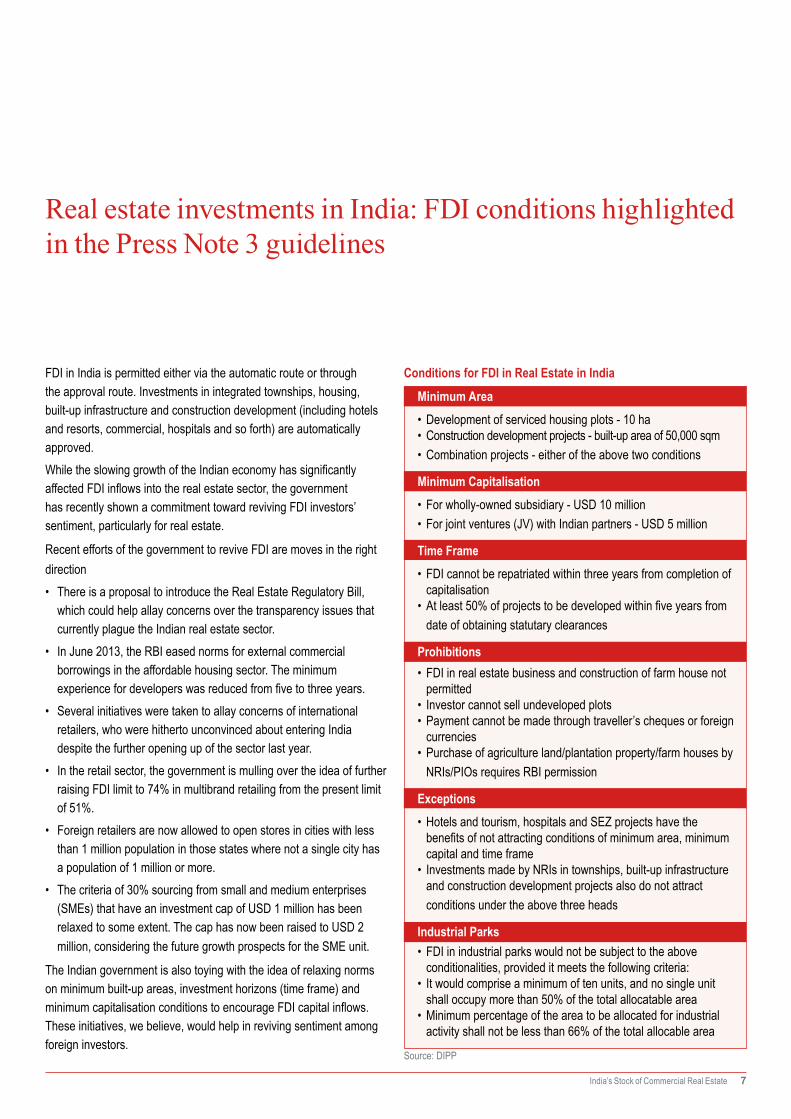
Conditions for FDI in Real Estate in India
Minimum Area• Development of serviced housing plots - 10 ha• Construction development projects - built-up area of 50,000 sqm• Combination projects - either of the above two conditions
Minimum Capitalisation• For wholly-owned subsidiary - USD 10 million• For joint ventures (JV) with Indian partners - USD 5 million
Time Frame• FDI cannot be repatriated within three years from completion of
capitalisation• At least 50% of projects to be developed within five years from
date of obtaining statutary clearances
Prohibitions• FDI in real estate business and construction of farm house not
permitted• Investor cannot sell undeveloped plots• Payment cannot be made through traveller’s cheques or foreign
currencies• Purchase of agriculture land/plantation property/farm houses by
NRIs/PIOs requires RBI permission
Exceptions• Hotels and tourism, hospitals and SEZ projects have the
benefits of not attracting conditions of minimum area, minimum capital and time frame
• Investments made by NRIs in townships, built-up infrastructure and construction development projects also do not attract conditions under the above three heads
Industrial Parks• FDI in industrial parks would not be subject to the above
conditionalities, provided it meets the following criteria: • It would comprise a minimum of ten units, and no single unit
shall occupy more than 50% of the total allocatable area• Minimum percentage of the area to be allocated for industrial
activity shall not be less than 66% of the total allocable area
Source: DIPP
India’s Stock of Commercial Real Estate 8
Indian REITs - A keenly awaited source of funding for cash-strapped developers
Real Estate Investment Trust (REIT) is a listed entity that owns and actively manages a portfolio of income-producing real estate assets. REITs are listed on stock exchanges, and their shares are publicly traded like equities. This is a key feature that helps REITs to generate liquidity. REITs can have sector-specific portfolios (e.g., office, retail, industrial or residential) or a diversified real estate portfolio across several real estate sectors. They also use geographic diversification in managing the risk of their commercial real estate portfolios.
REITs are yet to take off in India, while globally, many developed and developing countries have already introduced them.
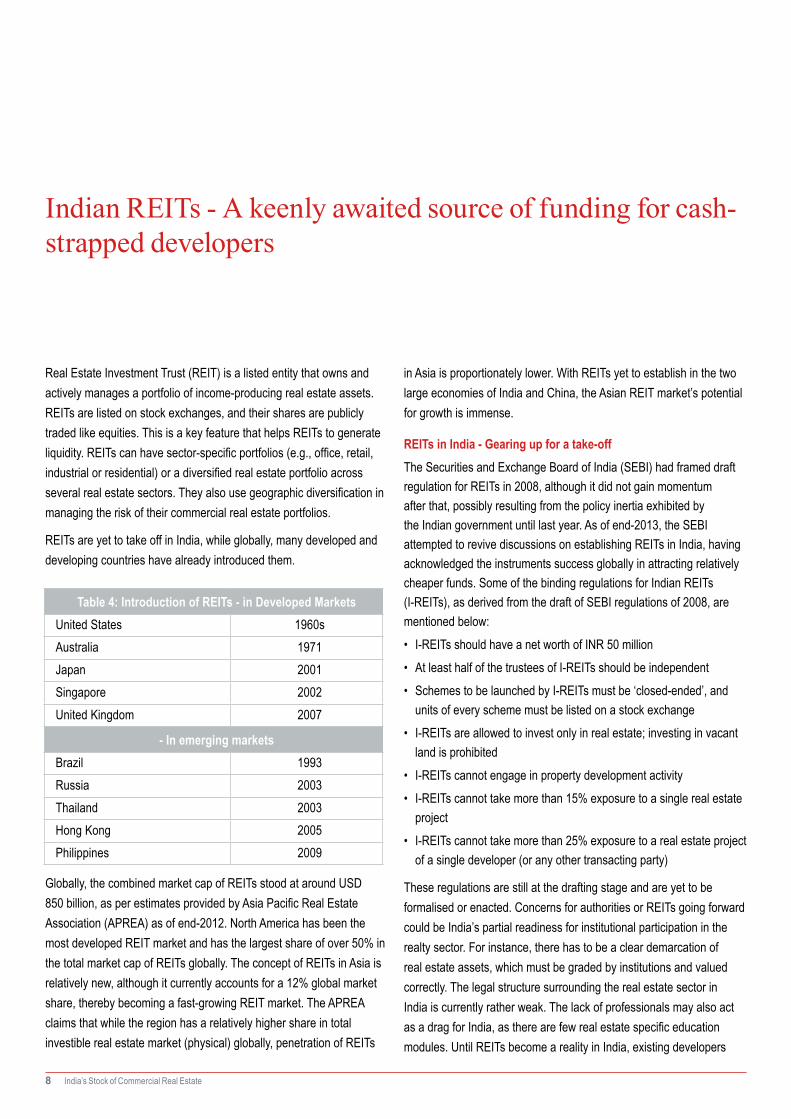
Table 4: Introduction of REITs - in Developed MarketsUnited States 1960sAustralia 1971Japan 2001Singapore 2002United Kingdom 2007
- In emerging marketsBrazil 1993Russia 2003Thailand 2003Hong Kong 2005Philippines 2009
Globally, the combined market cap of REITs stood at around USD 850 billion, as per estimates provided by Asia Pacific Real Estate Association (APREA) as of end-2012. North America has been the most developed REIT market and has the largest share of over 50% in the total market cap of REITs globally. The concept of REITs in Asia is relatively new, although it currently accounts for a 12% global market share, thereby becoming a fast-growing REIT market. The APREA claims that while the region has a relatively higher share in total investible real estate market (physical) globally, penetration of REITs
in Asia is proportionately lower. With REITs yet to establish in the two large economies of India and China, the Asian REIT market’s potential for growth is immense.
REITs in India - Gearing up for a take-offThe Securities and Exchange Board of India (SEBI) had framed draft regulation for REITs in 2008, although it did not gain momentum after that, possibly resulting from the policy inertia exhibited by the Indian government until last year. As of end-2013, the SEBI attempted to revive discussions on establishing REITs in India, having acknowledged the instruments success globally in attracting relatively cheaper funds. Some of the binding regulations for Indian REITs (I-REITs), as derived from the draft of SEBI regulations of 2008, are mentioned below:• I-REITs should have a net worth of INR 50 million• At least half of the trustees of I-REITs should be independent• Schemes to be launched by I-REITs must be ‘closed-ended’, and
units of every scheme must be listed on a stock exchange• I-REITs are allowed to invest only in real estate; investing in vacant
land is prohibited• I-REITs cannot engage in property development activity• I-REITs cannot take more than 15% exposure to a single real estate
project• I-REITs cannot take more than 25% exposure to a real estate project
of a single developer (or any other transacting party)
These regulations are still at the drafting stage and are yet to be formalised or enacted. Concerns for authorities or REITs going forward could be India’s partial readiness for institutional participation in the realty sector. For instance, there has to be a clear demarcation of real estate assets, which must be graded by institutions and valued correctly. The legal structure surrounding the real estate sector in India is currently rather weak. The lack of professionals may also act as a drag for India, as there are few real estate specific education modules. Until REITs become a reality in India, existing developers
India’s Stock of Commercial Real Estate 9
Source: IPIT website
Source: A-iTrust website
and investors will look to FDI as the only possible alternative for exiting an investment.
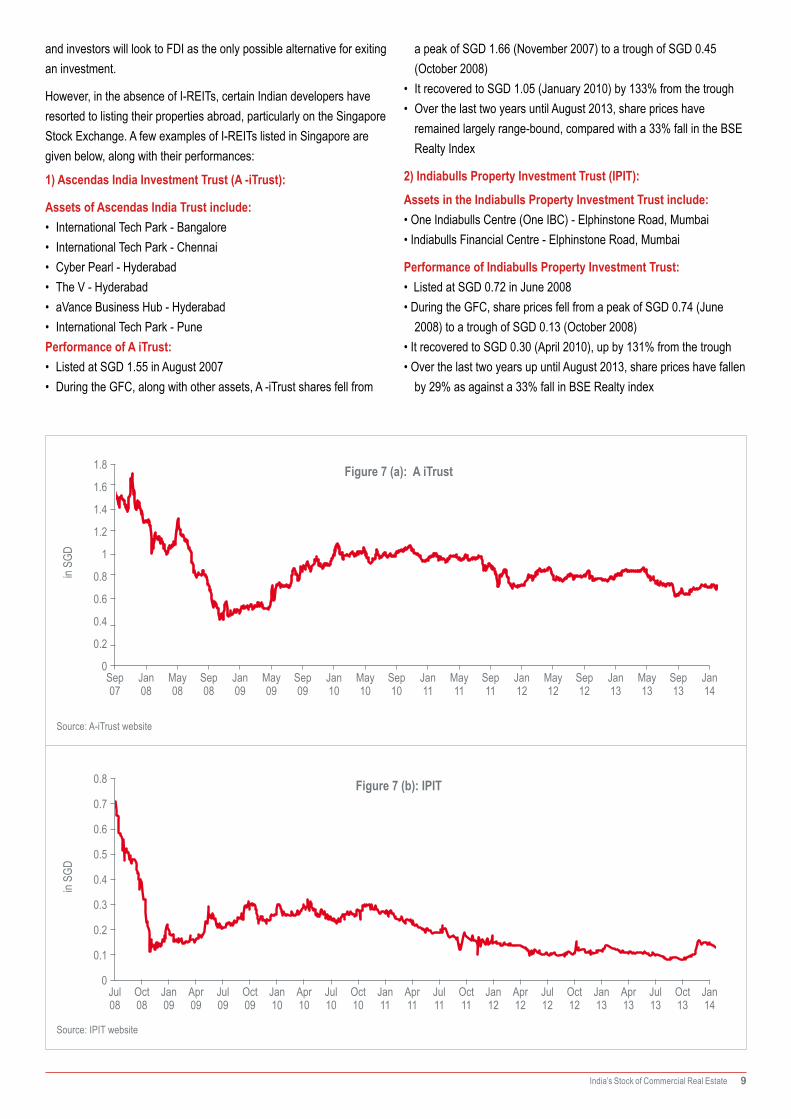
However, in the absence of I-REITs, certain Indian developers have resorted to listing their properties abroad, particularly on the Singapore Stock Exchange. A few examples of I-REITs listed in Singapore are given below, along with their performances:
1) Ascendas India Investment Trust (A -iTrust):
Assets of Ascendas India Trust include:• International Tech Park - Bangalore• International Tech Park - Chennai• Cyber Pearl - Hyderabad• The V - Hyderabad• aVance Business Hub - Hyderabad• International Tech Park - Pune Performance of A iTrust:• Listed at SGD 1.55 in August 2007• During the GFC, along with other assets, A -iTrust shares fell from
a peak of SGD 1.66 (November 2007) to a trough of SGD 0.45 (October 2008)
• It recovered to SGD 1.05 (January 2010) by 133% from the trough• Over the last two years until August 2013, share prices have
remained largely range-bound, compared with a 33% fall in the BSE Realty Index
2) Indiabulls Property Investment Trust (IPIT):
Assets in the Indiabulls Property Investment Trust include:• One Indiabulls Centre (One IBC) - Elphinstone Road, Mumbai• Indiabulls Financial Centre - Elphinstone Road, Mumbai
Performance of Indiabulls Property Investment Trust:• Listed at SGD 0.72 in June 2008• During the GFC, share prices fell from a peak of SGD 0.74 (June
2008) to a trough of SGD 0.13 (October 2008)• It recovered to SGD 0.30 (April 2010), up by 131% from the trough• Over the last two years up until August 2013, share prices have fallen
by 29% as against a 33% fall in BSE Realty index
Figure 7 (a): A iTrust1.8
1.6
1.4
1.2
1
0.8
0.6
0.4
0.2
Sep 07
Sep 08
Sep 09
Sep 10
Sep 11
Sep 12
Jan 14
Jan 08
Jan 09
Jan 10
Jan 11
Jan 12
Jan 13
May 08
May 09
May 10
May 11
May 12
Sep 13
May 13
0
in SG
D
Figure 7 (b): IPIT0.8
0.7
0.3
0.1
0.6
0.5
0.4
0.2
Jul 08
Apr 09
Jan 10
Jan 14
Oct 13
Jul 13
Apr 13
Jan 13
Jan12
Jan 11
Oct 12
Oct 11
Oct 10
Jul 12
Jul 11
Jul 10
Apr 12
Apr 11
Apr 10
Oct 08
Jul 09
Jan 09
Oct 09
0
in SG
D
India’s Stock of Commercial Real Estate 10
Value of ‘under-construction’ real estate in India: Analysing office sector value dynamics
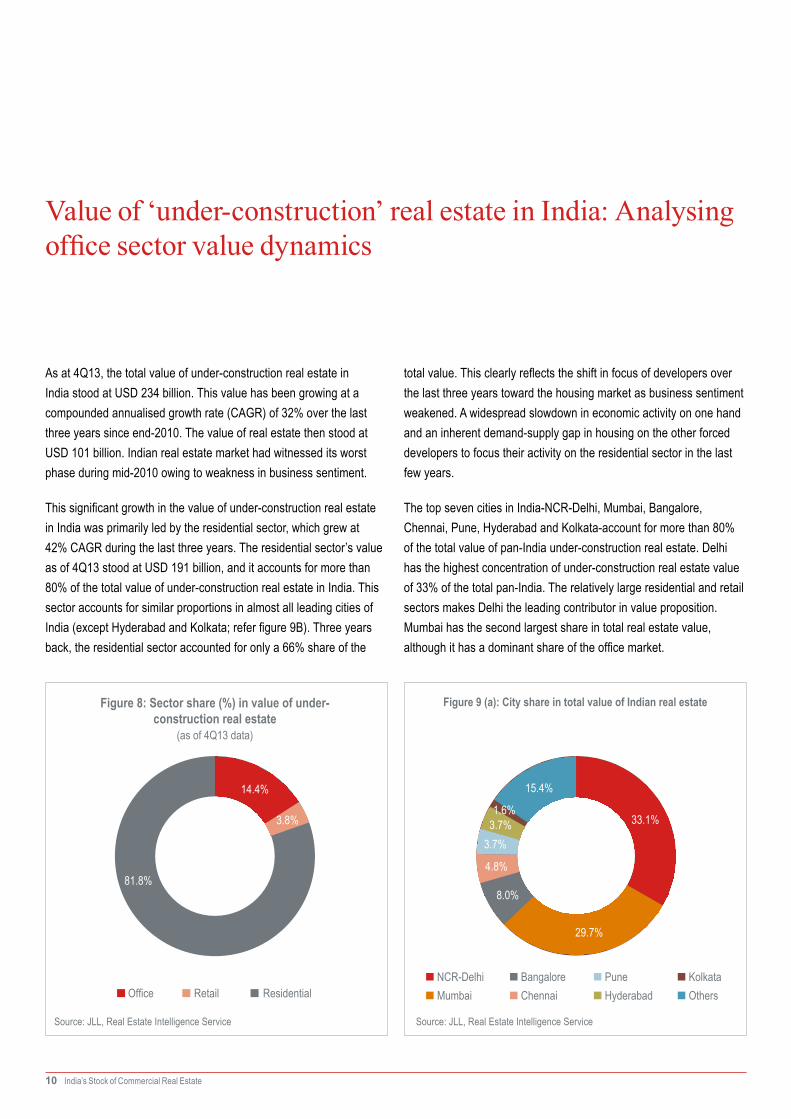
As at 4Q13, the total value of under-construction real estate in India stood at USD 234 billion. This value has been growing at a compounded annualised growth rate (CAGR) of 32% over the last three years since end-2010. The value of real estate then stood at USD 101 billion. Indian real estate market had witnessed its worst phase during mid-2010 owing to weakness in business sentiment.
This significant growth in the value of under-construction real estate in India was primarily led by the residential sector, which grew at 42% CAGR during the last three years. The residential sector’s value as of 4Q13 stood at USD 191 billion, and it accounts for more than 80% of the total value of under-construction real estate in India. This sector accounts for similar proportions in almost all leading cities of India (except Hyderabad and Kolkata; refer figure 9B). Three years back, the residential sector accounted for only a 66% share of the
Figure 8: Sector share (%) in value of under-construction real estate
(as of 4Q13 data)
14.4%
3.8%
81.8%
Office Retail Residential
Source: JLL, Real Estate Intelligence Service
total value. This clearly reflects the shift in focus of developers over the last three years toward the housing market as business sentiment weakened. A widespread slowdown in economic activity on one hand and an inherent demand-supply gap in housing on the other forced developers to focus their activity on the residential sector in the last few years.
The top seven cities in India-NCR-Delhi, Mumbai, Bangalore, Chennai, Pune, Hyderabad and Kolkata-account for more than 80% of the total value of pan-India under-construction real estate. Delhi has the highest concentration of under-construction real estate value of 33% of the total pan-India. The relatively large residential and retail sectors makes Delhi the leading contributor in value proposition. Mumbai has the second largest share in total real estate value, although it has a dominant share of the office market.
Figure 9 (a): City share in total value of Indian real estate
Source: JLL, Real Estate Intelligence Service
33.1%
15.4%
1.6%
8.0%
3.7%3.7%
29.7%
4.8%
NCR-DelhiMumbai
BangaloreChennai
PuneHyderabad
KolkataOthers

India’s Stock of Commercial Real Estate 11
Source: JLL, Real Estate Intelligence Service
Figure 9(b): Sector-wise share (%) in value of real estate under-construction across top cities (data as of 4Q13)
100%
80%
60%
40%
20%
NCR-Delhi Bangalore Chennai Kolkata Other CitiesPune HyderabadMumbai0%
3.8%10.9%
85.5%
1.1%
14.7%
84.2%
3.7%
17.1%
79.1%
2.2%
11.1%
86.7%
4.8%12.7%
82.5%
23.7%
23.9%
52.4%
8.1%
29.6%
62.3%
4.1%
17.3%
78.6%Office
Retail
Residential
Figure 10: City-wise share (%) of office by area in 4Q13
Source: JLL, Real Estate Intelligence Service
Other Cities
Bangalore
NCR-Delhi
Chennai
Kolkata
3.8%
4.6%
4.9%
9.1%
13.1%
16.7%
17.8%
30.0%
Pune
Hyderabad
Mumbai
0.0% 10.0% 20.0% 30.0% 40.0%
Figure 11: City-wise share (%) of office by value as of 4Q13
Source: JLL, Real Estate Intelligence Service
NCR-Delhi
Bangalore
Other Cities
Chennai
Kolkata
3.3%
3.4%
3.7%
6.1%
9.5%
18.6%
25.1%
30.4%
Pune
Hyderabad
Mumbai
0.0% 10.0% 20.0% 30.0% 40.0%

India’s Stock of Commercial Real Estate 12
Office market scenario: Value dynamics across leading cities in India
The top-seven cities account for 80% of the total real estate value in the office sector. The total value of office real estate pan-India stood at USD 34 billion as of end-2013. The value of under-construction office space in India currently accounts for 60% of the total value of completed office space. This means that in the next five years, the value of completed office space is likely to grow to over USD 50 billion. Being the commercial capital of India, Mumbai has the highest concentration of under-construction office real estate value. The city accounts for a dominant 30% share in pan-India office market value (see figure 11). NCR-Delhi (25%) and Bangalore (9.5%) are the other two tier-I cities that follow Mumbai in that regard. .
Over the last three years, Bangalore has witnessed the highest growth by value of under-construction office space. The city’s value has grown at a CAGR of 26% during the last three years. The availability of high-quality and large office space at sub-dollar price per square feet of rentals (lower operational costs), access to a large pool of skilled workforce and a cosmopolitan culture have worked in Bangalore’s favour, making it a preferred destination for IT–ITES, manufacturing and consulting companies. Bangalore’s office market vacancy level is less than 10%, which is much below the national average of 18% as of 4Q13. Among Tier I cities, NCR-Delhi follows Bangalore, with an 11% CAGR of the value of under-construction stock during the same period, supported by improving infrastructure
and the consequently rising acceptance of NCR as a preferred destination for business.
Among the Tier II cities, Hyderabad has seen the value of under-construction office stock grow by 13% CAGR during the last three years. The office market in Hyderabad is largely driven by the IT–ITES and pharmaceutical sectors, both of which have managed to show resilience to the economic slowdown. These sectors have a strong export market, particularly in the West, which is currently recovering steadily from the GFC.
Mumbai has seen only a marginal rise in value of office under-construction, owing to the slowdown witnessed in its stronghold BFSI sector. However, over the last few years, Mumbai has gradually witnessed the penetration of non-BFSI tenants, which has helped the office market in the suburban (inexpensive) locations of the city. The city has recently witnessed major infrastructure projects getting completed or nearing completion, all of which will create new opportunities for developers and investors around the upcoming micromarkets.
While the supply of under-construction office space in the three leading metropolitan cities (Mumbai, Delhi and Bangalore) is much the same, capital values in these cities are the key differentiators of the value dynamics. In terms of concentration of office supply (or area) in the under-construction space, NCR-Delhi leads the pack of top seven cities, with a share of 17.8% of India’s overall supply, while Mumbai (16.7%) and Bangalore (13.1%) follow closely.
India’s Stock of Commercial Real Estate 13
Taking stock of ‘completed’ office assets in India
23%
1%7%
9%
19%
23%
18%
NCR-DelhiBangalore
Chennai
Mumbai
Kolkata
PuneHyderabad
Source: JLL, Real Estate Intelligence Service
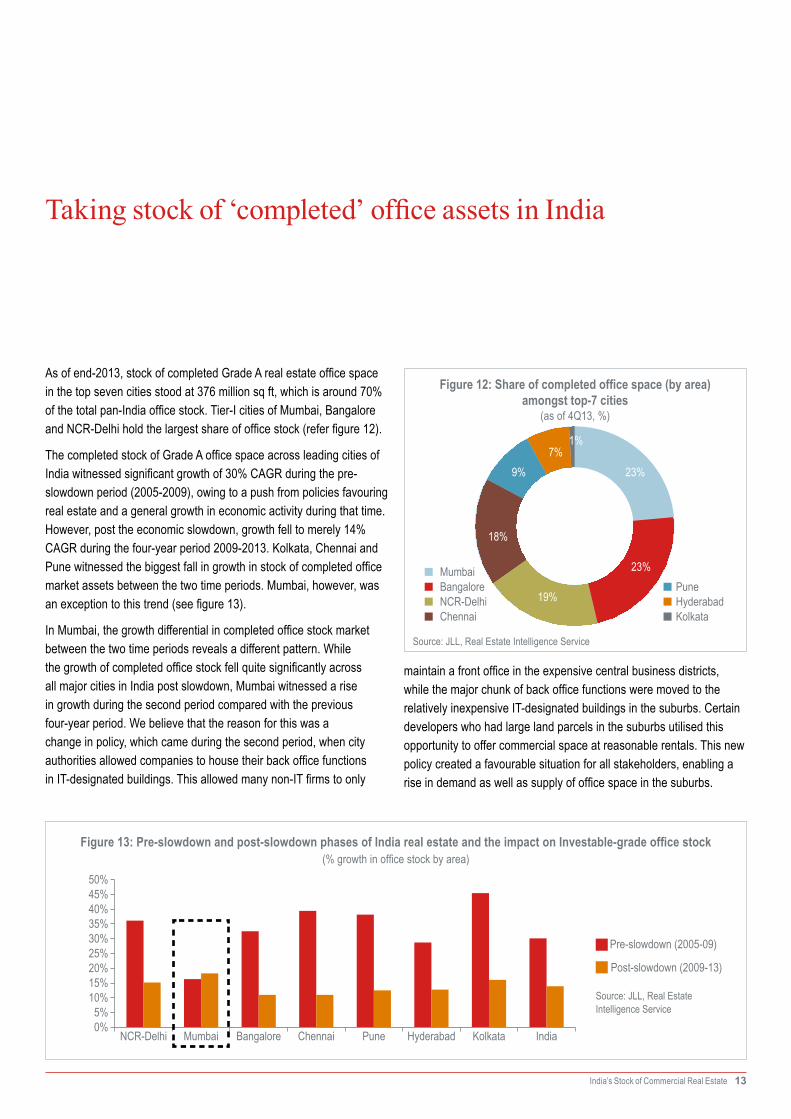
As of end-2013, stock of completed Grade A real estate office space in the top seven cities stood at 376 million sq ft, which is around 70% of the total pan-India office stock. Tier-I cities of Mumbai, Bangalore and NCR-Delhi hold the largest share of office stock (refer figure 12).
The completed stock of Grade A office space across leading cities of India witnessed significant growth of 30% CAGR during the pre-slowdown period (2005-2009), owing to a push from policies favouring real estate and a general growth in economic activity during that time. However, post the economic slowdown, growth fell to merely 14% CAGR during the four-year period 2009-2013. Kolkata, Chennai and Pune witnessed the biggest fall in growth in stock of completed office market assets between the two time periods. Mumbai, however, was an exception to this trend (see figure 13).
In Mumbai, the growth differential in completed office stock market between the two time periods reveals a different pattern. While the growth of completed office stock fell quite significantly across all major cities in India post slowdown, Mumbai witnessed a rise in growth during the second period compared with the previous four-year period. We believe that the reason for this was a change in policy, which came during the second period, when city authorities allowed companies to house their back office functions in IT-designated buildings. This allowed many non-IT firms to only
maintain a front office in the expensive central business districts, while the major chunk of back office functions were moved to the relatively inexpensive IT-designated buildings in the suburbs. Certain developers who had large land parcels in the suburbs utilised this opportunity to offer commercial space at reasonable rentals. This new policy created a favourable situation for all stakeholders, enabling a rise in demand as well as supply of office space in the suburbs.
Figure 12: Share of completed office space (by area) amongst top-7 cities
(as of 4Q13, %)
50%45%40%35%30%25%20%15%10%
5%0%
NCR-Delhi Bangalore ChennaiMumbai Kolkata IndiaPune Hyderabad
Post-slowdown (2009-13)
Pre-slowdown (2005-09)
Figure 13: Pre-slowdown and post-slowdown phases of India real estate and the impact on Investable-grade office stock(% growth in office stock by area)
Source: JLL, Real Estate Intelligence Service
India’s Stock of Commercial Real Estate 14
Growth of Real Estate Office Stock in Different Cities over 2009 Stock
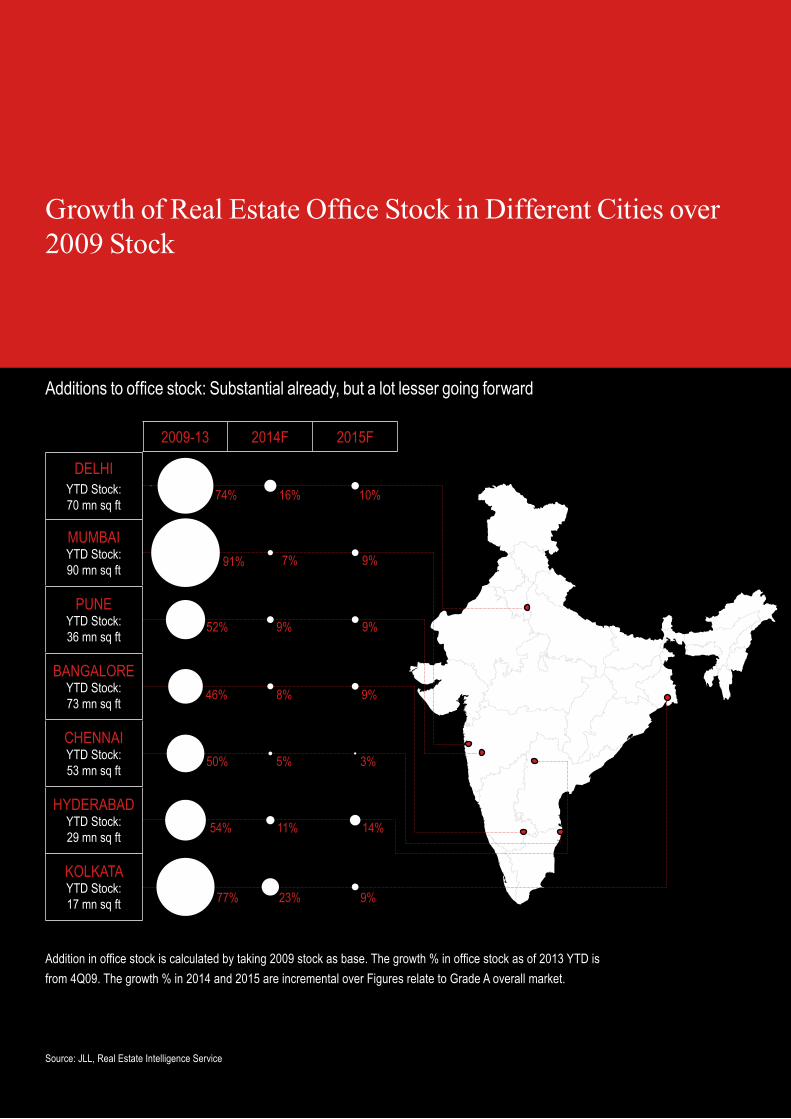
Additions to office stock: Substantial already, but a lot lesser going forward
Addition in office stock is calculated by taking 2009 stock as base. The growth % in office stock as of 2013 YTD is from 4Q09. The growth % in 2014 and 2015 are incremental over Figures relate to Grade A overall market.
Source: JLL, Real Estate Intelligence Service
2009-13 2014F 2015F
DELHIYTD Stock: 70 mn sq ft
MUMBAI YTD Stock: 90 mn sq ft
PUNE YTD Stock: 36 mn sq ft
BANGALORE YTD Stock: 73 mn sq ft
CHENNAI YTD Stock: 53 mn sq ft
HYDERABAD YTD Stock: 29 mn sq ft
KOLKATA YTD Stock: 17 mn sq ft
16%
7%
9%
10%
9%
9%
74%
91%
52%
8% 9%46%
5% 3%50%
11% 14%54%
23% 9%77%
India’s Stock of Commercial Real Estate 15
Pune
Figure 14: Listed players’ share in total FDI-compliant universe
Figure 15: Building category-wise share of FDI-compliant stock (by area) of office space
Figure 16: City-wise share in FDI-compliant stock (by area) of office space
27%
73%
Listed player’s share
Unlisted player’s share
26%
1%7%
12%
18%20%
16%
NCR-DelhiBangaloreChennai
Mumbai
KolkataHyderabad
5%
48%48%
Non ITIT SEZIT Buildings
The Universe of FDI-compliant office assets in India
*By FDI-Compliant stock, we mean that sub-set of the total Grade-A office stock which meets all criteria for receiving FDI investments as per Press Note 2 and 3 guidelines of the Department of Industrial Policy & Promotions (DIPP)
Source: JLL, Real Estate Intelligence Service
Source: JLL, Real Estate Intelligence ServiceSource: JLL, Real Estate Intelligence Service
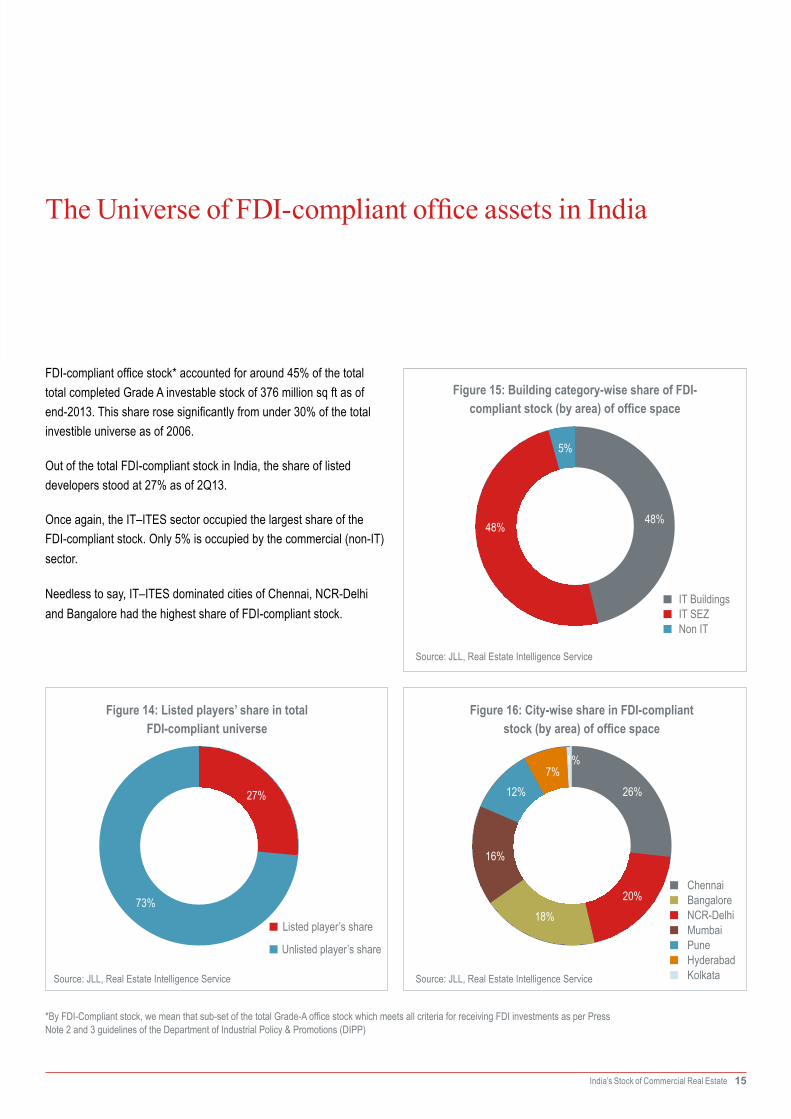
FDI-compliant office stock* accounted for around 45% of the total total completed Grade A investable stock of 376 million sq ft as of end-2013. This share rose significantly from under 30% of the total investible universe as of 2006.
Out of the total FDI-compliant stock in India, the share of listed developers stood at 27% as of 2Q13.
Once again, the IT–ITES sector occupied the largest share of the FDI-compliant stock. Only 5% is occupied by the commercial (non-IT) sector.
Needless to say, IT–ITES dominated cities of Chennai, NCR-Delhi and Bangalore had the highest share of FDI-compliant stock.
India’s Stock of Commercial Real Estate 16
Source: JLL, Real Estate Intelligence Service
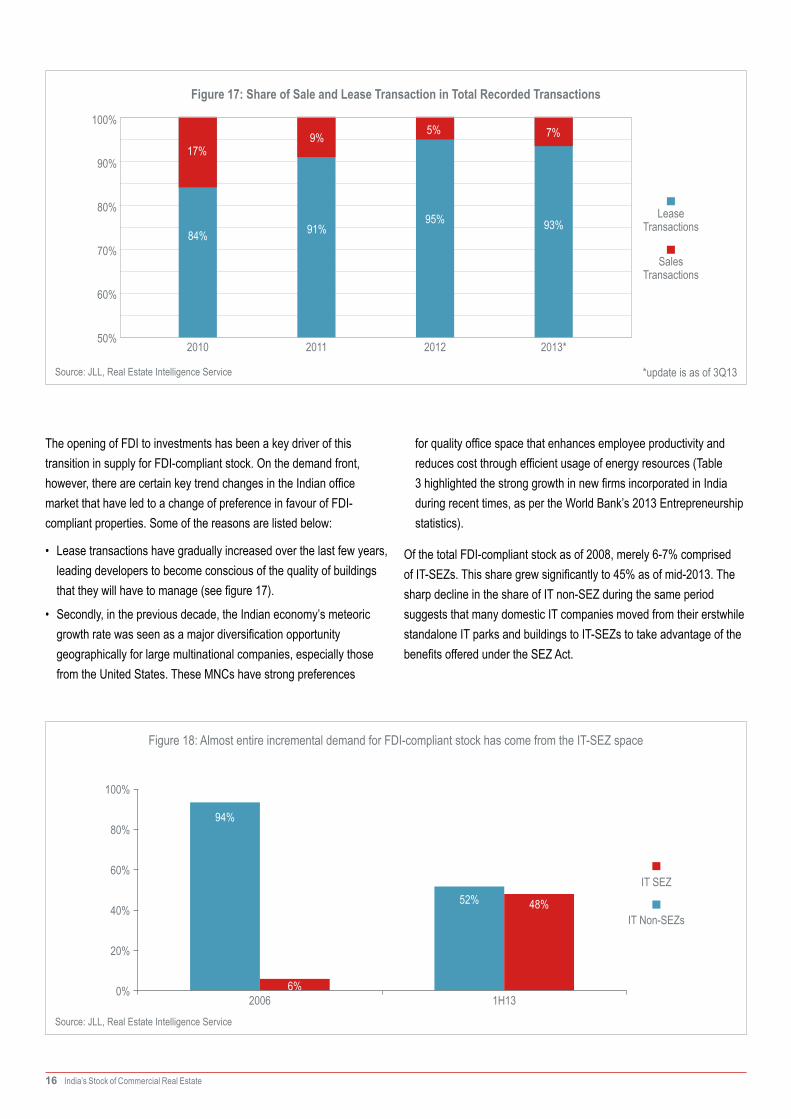
The opening of FDI to investments has been a key driver of this transition in supply for FDI-compliant stock. On the demand front, however, there are certain key trend changes in the Indian office market that have led to a change of preference in favour of FDI-compliant properties. Some of the reasons are listed below:
• Lease transactions have gradually increased over the last few years, leading developers to become conscious of the quality of buildings that they will have to manage (see figure 17).
• Secondly, in the previous decade, the Indian economy’s meteoric growth rate was seen as a major diversification opportunity geographically for large multinational companies, especially those from the United States. These MNCs have strong preferences
Source: JLL, Real Estate Intelligence Service
Figure 18: Almost entire incremental demand for FDI-compliant stock has come from the IT-SEZ space
100%
80%
60%
40%
20%
1H1320060%
IT SEZ
IT Non-SEZs
94%
52%
6%
48%
Figure 17: Share of Sale and Lease Transaction in Total Recorded Transactions
100%
95%
5%
91%
9%
93%
7%
84%
17%90%
80%
70%
60%
2011 2013*2012201050%
Sales Transactions
Lease Transactions
for quality office space that enhances employee productivity and reduces cost through efficient usage of energy resources (Table 3 highlighted the strong growth in new firms incorporated in India during recent times, as per the World Bank’s 2013 Entrepreneurship statistics).
Of the total FDI-compliant stock as of 2008, merely 6-7% comprised of IT-SEZs. This share grew significantly to 45% as of mid-2013. The sharp decline in the share of IT non-SEZ during the same period suggests that many domestic IT companies moved from their erstwhile standalone IT parks and buildings to IT-SEZs to take advantage of the benefits offered under the SEZ Act.
*update is as of 3Q13
India’s Stock of Commercial Real Estate 17
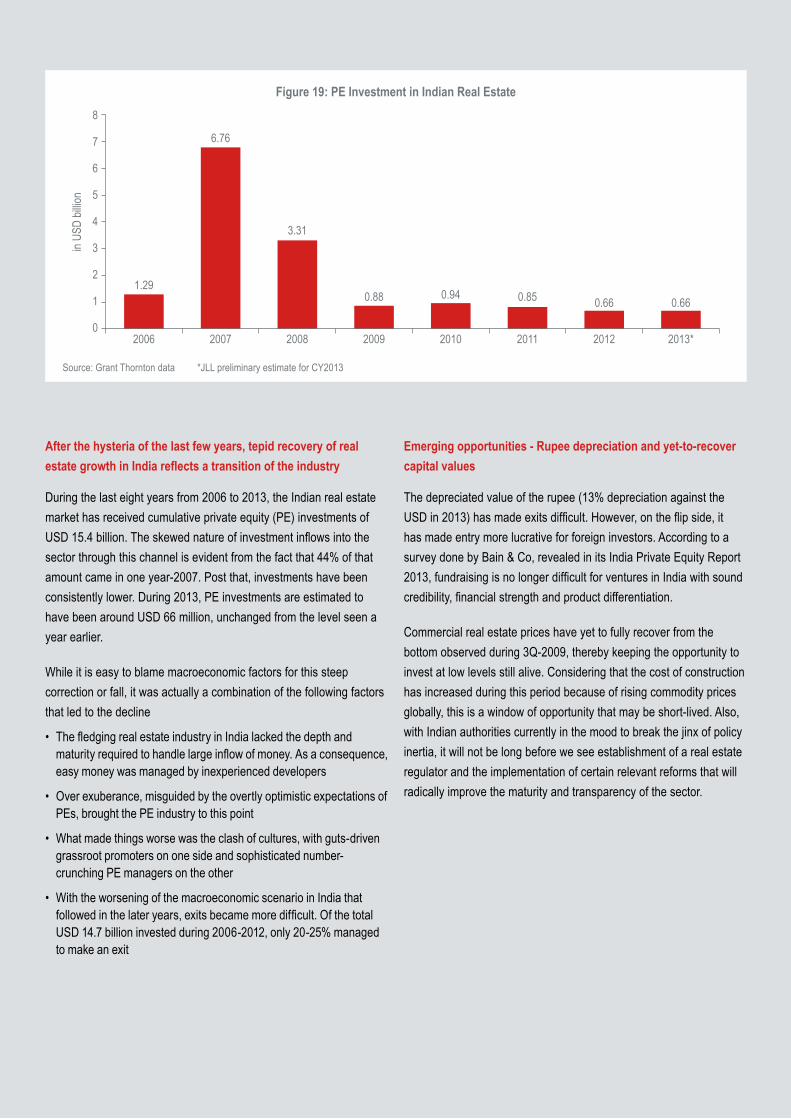
After the hysteria of the last few years, tepid recovery of real estate growth in India reflects a transition of the industry
During the last eight years from 2006 to 2013, the Indian real estate market has received cumulative private equity (PE) investments of USD 15.4 billion. The skewed nature of investment inflows into the sector through this channel is evident from the fact that 44% of that amount came in one year-2007. Post that, investments have been consistently lower. During 2013, PE investments are estimated to have been around USD 66 million, unchanged from the level seen a year earlier.
While it is easy to blame macroeconomic factors for this steep correction or fall, it was actually a combination of the following factors that led to the decline
• The fledging real estate industry in India lacked the depth and maturity required to handle large inflow of money. As a consequence, easy money was managed by inexperienced developers
• Over exuberance, misguided by the overtly optimistic expectations of PEs, brought the PE industry to this point
• What made things worse was the clash of cultures, with guts-driven grassroot promoters on one side and sophisticated number-crunching PE managers on the other
• With the worsening of the macroeconomic scenario in India that followed in the later years, exits became more difficult. Of the total USD 14.7 billion invested during 2006-2012, only 20-25% managed to make an exit
Emerging opportunities - Rupee depreciation and yet-to-recover capital values
The depreciated value of the rupee (13% depreciation against the USD in 2013) has made exits difficult. However, on the flip side, it has made entry more lucrative for foreign investors. According to a survey done by Bain & Co, revealed in its India Private Equity Report 2013, fundraising is no longer difficult for ventures in India with sound credibility, financial strength and product differentiation.
Commercial real estate prices have yet to fully recover from the bottom observed during 3Q-2009, thereby keeping the opportunity to invest at low levels still alive. Considering that the cost of construction has increased during this period because of rising commodity prices globally, this is a window of opportunity that may be short-lived. Also, with Indian authorities currently in the mood to break the jinx of policy inertia, it will not be long before we see establishment of a real estate regulator and the implementation of certain relevant reforms that will radically improve the maturity and transparency of the sector.
Figure 19: PE Investment in Indian Real Estate8
7
6
5
4
3
2
1
2006 2007 2008 2009 2010 2011 2013*2012
0.850.940.88
3.31
6.76
1.290.660.66
0
in US
D bil
lion
Source: Grant Thornton data *JLL preliminary estimate for CY2013
India’s Stock of Commercial Real Estate 18
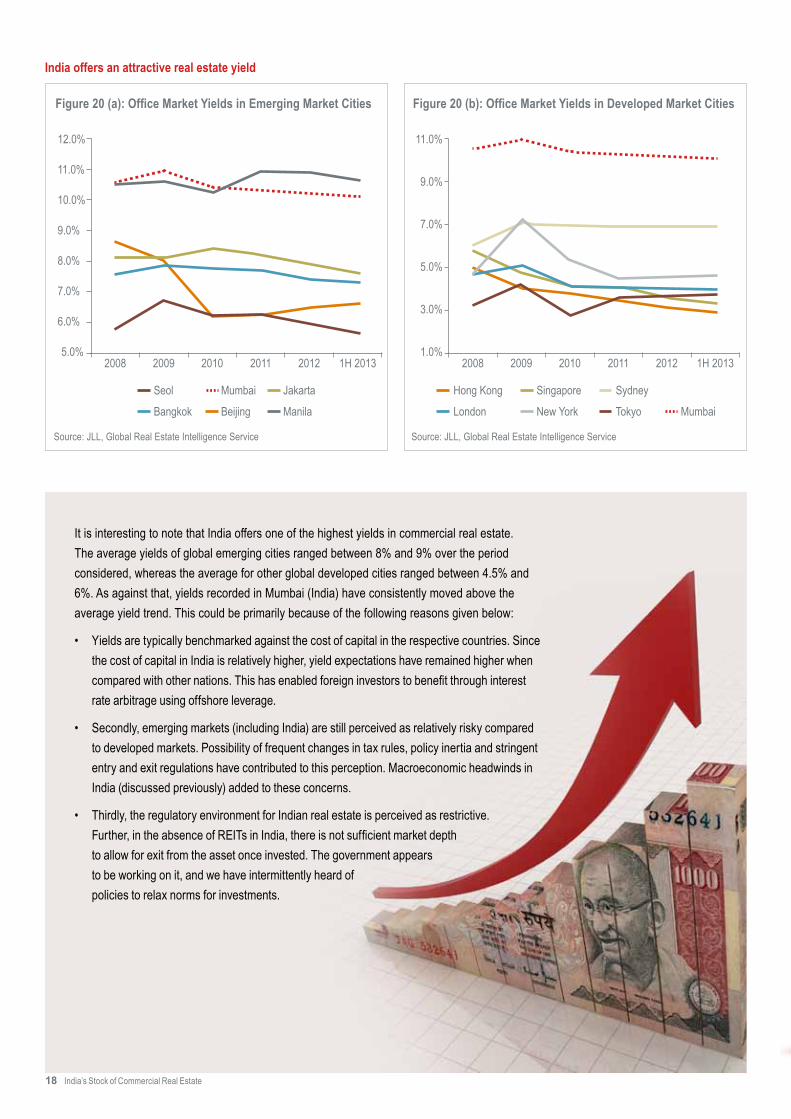
It is interesting to note that India offers one of the highest yields in commercial real estate. The average yields of global emerging cities ranged between 8% and 9% over the period considered, whereas the average for other global developed cities ranged between 4.5% and 6%. As against that, yields recorded in Mumbai (India) have consistently moved above the average yield trend. This could be primarily because of the following reasons given below:
• Yields are typically benchmarked against the cost of capital in the respective countries. Since the cost of capital in India is relatively higher, yield expectations have remained higher when compared with other nations. This has enabled foreign investors to benefit through interest rate arbitrage using offshore leverage.
• Secondly, emerging markets (including India) are still perceived as relatively risky compared to developed markets. Possibility of frequent changes in tax rules, policy inertia and stringent entry and exit regulations have contributed to this perception. Macroeconomic headwinds in India (discussed previously) added to these concerns.
• Thirdly, the regulatory environment for Indian real estate is perceived as restrictive. Further, in the absence of REITs in India, there is not sufficient market depth to allow for exit from the asset once invested. The government appears to be working on it, and we have intermittently heard of policies to relax norms for investments.
India offers an attractive real estate yield
Source: JLL, Global Real Estate Intelligence Service
11.0%
9.0%
5.0%
3.0%
2008 2009 2010 2011 1H 201320121.0%
Hong Kong SydneySingapore
New YorkLondon Tokyo Mumbai
Figure 20 (b): Office Market Yields in Developed Market Cities
7.0%
Source: JLL, Global Real Estate Intelligence Service
12.0%
11.0%
10.0%
9.0%
8.0%
7.0%
6.0%
2008 2009 2010 2011 1H 201320125.0%
Seol JakartaMumbai
BeijingBangkok Manila
Figure 20 (a): Office Market Yields in Emerging Market Cities
India’s Stock of Commercial Real Estate 19
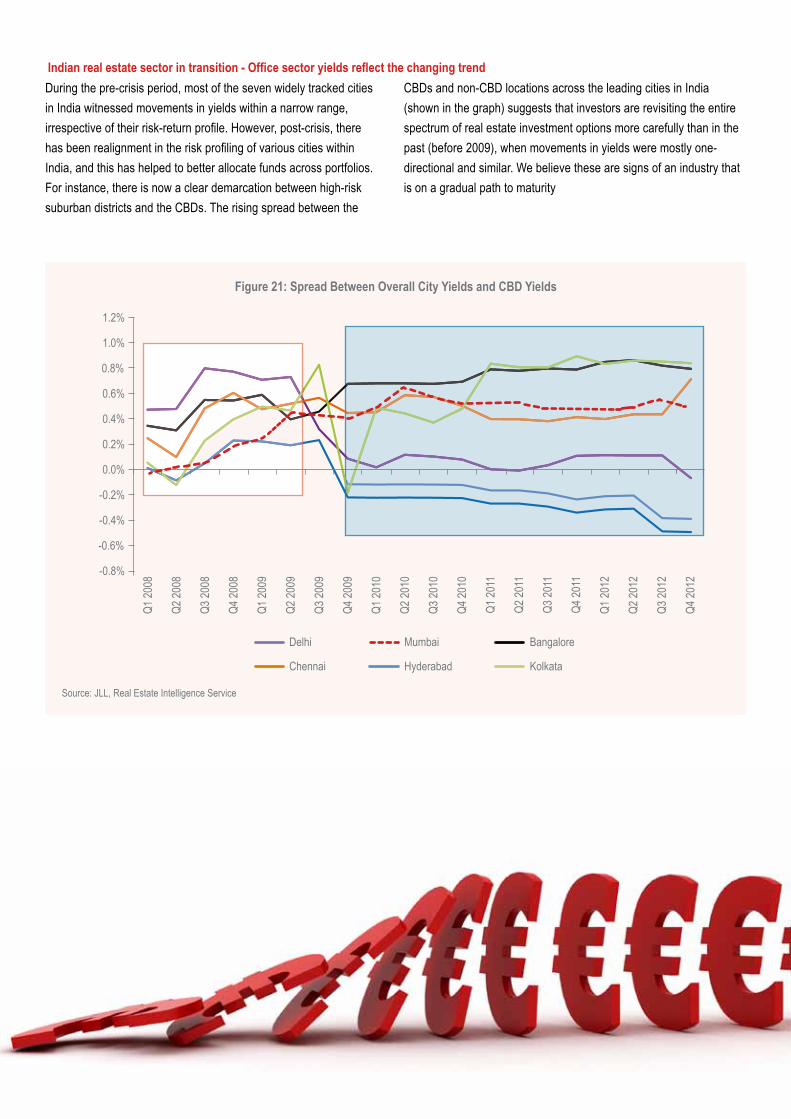
Indian real estate sector in transition - Office sector yields reflect the changing trend
Image
Figure 21: Spread Between Overall City Yields and CBD Yields
Source: JLL, Real Estate Intelligence Service
Q1 20
08
Q1 20
09
Q1 20
10
Q1 20
11
Q1 20
12
Q2 20
08
Q2 20
09
Q2 20
10
Q2 20
11
Q2 20
12
Q3 20
08
Q3 20
09
Q3 20
10
Q3 20
11
Q3 20
12
Q4 20
08
Q4 20
09
Q4 20
10
Q4 20
11
Q4 20
12
Delhi Mumbai Bangalore
Chennai Hyderabad Kolkata
1.2%
0.8%
0.4%
1.0%
0.6%
0.2%
-0.8%
-0.4%
0.0%
-0.2%
-0.6%
During the pre-crisis period, most of the seven widely tracked cities in India witnessed movements in yields within a narrow range, irrespective of their risk-return profile. However, post-crisis, there has been realignment in the risk profiling of various cities within India, and this has helped to better allocate funds across portfolios. For instance, there is now a clear demarcation between high-risk suburban districts and the CBDs. The rising spread between the
CBDs and non-CBD locations across the leading cities in India (shown in the graph) suggests that investors are revisiting the entire spectrum of real estate investment options more carefully than in the past (before 2009), when movements in yields were mostly one-directional and similar. We believe these are signs of an industry that is on a gradual path to maturity
India’s Stock of Commercial Real Estate 20
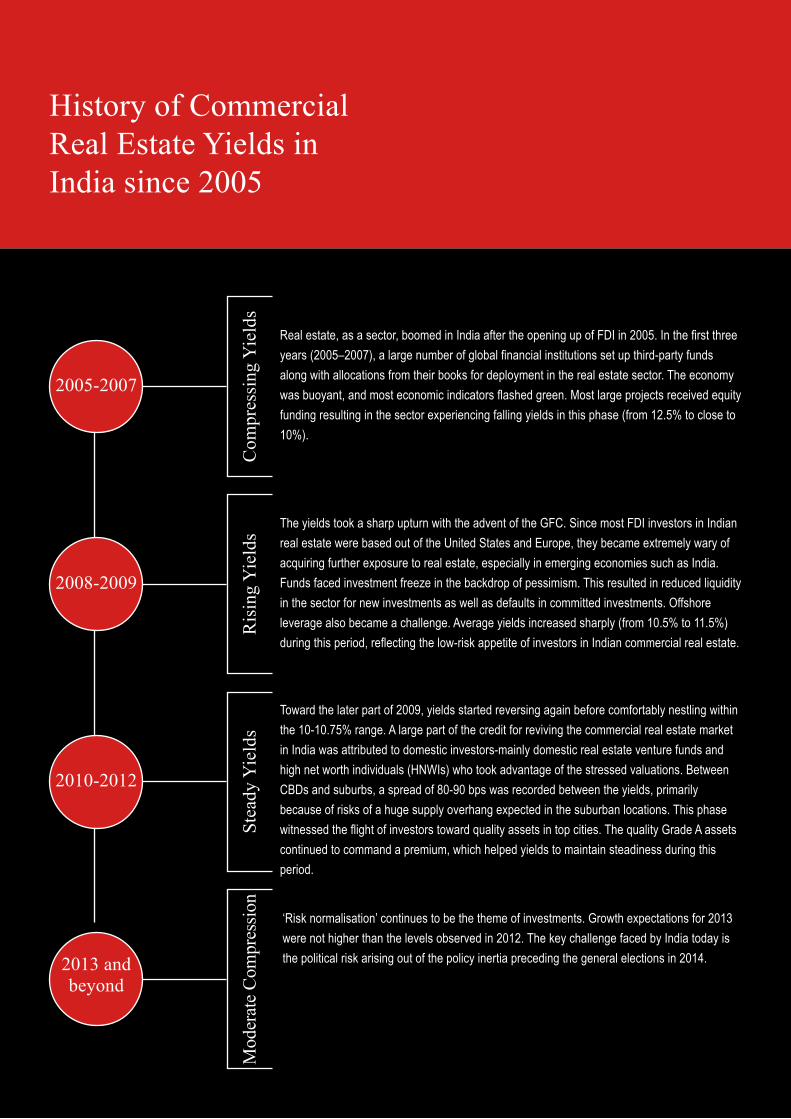
History of Commercial Real Estate Yields in India since 2005
The yields took a sharp upturn with the advent of the GFC. Since most FDI investors in Indian real estate were based out of the United States and Europe, they became extremely wary of acquiring further exposure to real estate, especially in emerging economies such as India. Funds faced investment freeze in the backdrop of pessimism. This resulted in reduced liquidity in the sector for new investments as well as defaults in committed investments. Offshore leverage also became a challenge. Average yields increased sharply (from 10.5% to 11.5%) during this period, reflecting the low-risk appetite of investors in Indian commercial real estate.
Ris
ing
Yie
lds
2008-2009
Toward the later part of 2009, yields started reversing again before comfortably nestling within the 10-10.75% range. A large part of the credit for reviving the commercial real estate market in India was attributed to domestic investors-mainly domestic real estate venture funds and high net worth individuals (HNWIs) who took advantage of the stressed valuations. Between CBDs and suburbs, a spread of 80-90 bps was recorded between the yields, primarily because of risks of a huge supply overhang expected in the suburban locations. This phase witnessed the flight of investors toward quality assets in top cities. The quality Grade A assets continued to command a premium, which helped yields to maintain steadiness during this period.
Stea
dy Y
ield
s
2010-2012
‘Risk normalisation’ continues to be the theme of investments. Growth expectations for 2013 were not higher than the levels observed in 2012. The key challenge faced by India today is the political risk arising out of the policy inertia preceding the general elections in 2014.
Mod
erat
e Co
mpr
essio
n
2013 and beyond
Real estate, as a sector, boomed in India after the opening up of FDI in 2005. In the first three years (2005–2007), a large number of global financial institutions set up third-party funds along with allocations from their books for deployment in the real estate sector. The economy was buoyant, and most economic indicators flashed green. Most large projects received equity funding resulting in the sector experiencing falling yields in this phase (from 12.5% to close to 10%).
Com
pres
sing
Yie
lds
2005-2007
India’s Stock of Commercial Real Estate 21
Market yield (%)
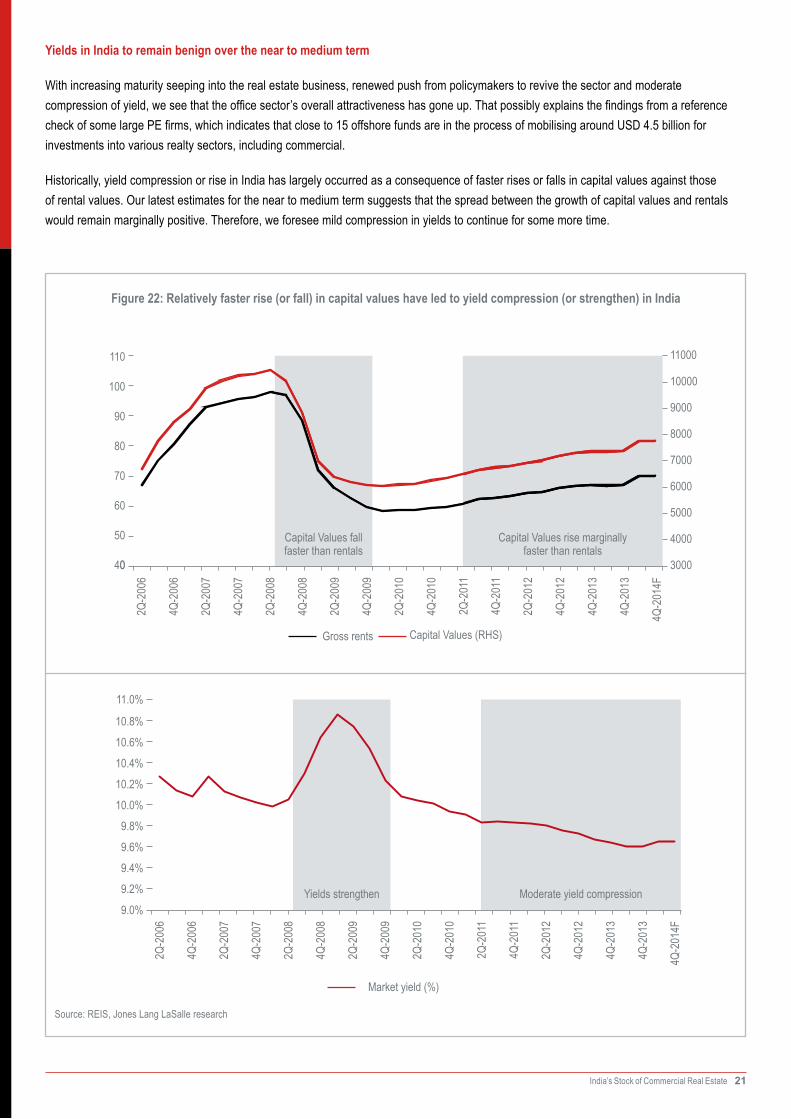
Figure 22: Relatively faster rise (or fall) in capital values have led to yield compression (or strengthen) in India
Source: REIS, Jones Lang LaSalle research
Yields in India to remain benign over the near to medium term
With increasing maturity seeping into the real estate business, renewed push from policymakers to revive the sector and moderate compression of yield, we see that the office sector’s overall attractiveness has gone up. That possibly explains the findings from a reference check of some large PE firms, which indicates that close to 15 offshore funds are in the process of mobilising around USD 4.5 billion for investments into various realty sectors, including commercial.
Historically, yield compression or rise in India has largely occurred as a consequence of faster rises or falls in capital values against those of rental values. Our latest estimates for the near to medium term suggests that the spread between the growth of capital values and rentals would remain marginally positive. Therefore, we foresee mild compression in yields to continue for some more time.
Gross rents Capital Values (RHS)
11000
10000
9000
8000
7000
6000
5000
4000
3000
Capital Values fall faster than rentals
Capital Values rise marginally faster than rentals
110
70
0
100
80
90
60
50
40
2Q-2
006
2Q-2
007
2Q-2
008
2Q-2
009
2Q-2
010
2Q-2
011
2Q-2
012
4Q-2
006
4Q-2
007
4Q-2
008
4Q-2
009
4Q-2
010
4Q-2
011
4Q-2
012
4Q-2
013
4Q-2
013
4Q-2
014F
Yields strengthen Moderate yield compression
11.0%
10.8%
10.6%
10.4%
10.2%
10.0%
9.8%
9.6%
9.4%
9.2%
9.0%
2Q-2
006
2Q-2
007
2Q-2
008
2Q-2
009
2Q-2
010
2Q-2
011
2Q-2
012
4Q-2
006
4Q-2
007
4Q-2
008
4Q-2
009
4Q-2
010
4Q-2
011
4Q-2
012
4Q-2
013
4Q-2
013
4Q-2
014F

India’s Stock of Commercial Real Estate 22
Conclusion The Indian real estate sector has witnessed stark contradictions in terms of growth over the last decade. During the pre-GFC period, it received large capital inflows, owing to India’s strengthening economic activity and support from favourable policies. However, during the GFC, immaturities of India’s real estate sector came out glaring at investors as well as policymakers. A combination of factors, along with a weakening domestic economic growth, led to demand sluggishness in the sector. An ensuing slackness in absorption of office assets, however, could not shake fundamentals of the Indian real estate sec-tor. We believe that the economy’s high potential for growth, coupled with a rising national income and propensity to consume will attract many multinational businesses, thereby generating demand for office space. Additionally, the sector itself is in transition over the last few
years since its immaturity got exposed during the financial crisis. While investors were always the smarter and professional lot, they had much to learn about the operating dynamics of the sector in India. Develop-ers, on the other hand, have increasingly realised the benefits of inte-grating professional practices to stay financially sound and attractive.
Our guide to the universe of Grade A office assets and FDI-compliant office assets is a useful tool for investors trying to ascertain various investment options in the commercial real estate space in India. We believe that at present, the sluggishness in the commercial real estate sector is behind us, and the sector is poised for a recovery on the back of attractive yields and yet-to-recover capital values.

India’s Stock of Commercial Real Estate 23
Author
Suvishesh ValsanAssistant Vice President, Research & REIS+91 22 3985 [email protected]
Special contribution & guidance
Karan KhetanAssistant Manager, Research & [email protected]
Akshit ShahManager, Capital Markets Research [email protected]
Devi ShankarAssistant Vice President, Capital [email protected]
Ujwala RaoHead - Capital Markets (West India)[email protected]
For more information about research
Ashutosh LimayeHead of Research - India+91 22 3985 [email protected]
For further business with Capital Markets
Shobhit AgarwalManaging Director - Capital Markets+91 22 3985 [email protected]
www.jll..com
About JLLJones Lang LaSalle (NYSE:JLL) is a professional services and investment management firm offering specialized real estate services to clients seeking increased value by owning, occupying and investing in real estate. With annual revenue of $4 billion, JLL operates in 70 countries from more than 1,000 locations worldwide. On behalf of its clients, the firm provides management and real estate outsourcing services to a property portfolio of 3.0 billion square feet. Its investment management business, LaSalle Investment Management, has $47.6 billion of real estate assets under management.JLL has over 50 years of experience in Asia Pacific, with over 27,500 employees operating in 80 offices in 15 countries across the region. The firm was named ‘Best Property Consultancy’ in three Asia Pacific countries at the International Property Awards Asia Pacific 2013, and won nine Asia Pacific Awards in the Euromoney Real Estate Awards 2013.For further information, please visit our website, www.jll.com.
About JLL IndiaJLL is India’s premier and largest professional services firm specializing in real estate. With an extensive geographic footprint across 11 cities (Ahmedabad, Delhi, Mumbai, Bangalore, Pune, Chennai, Hyderabad, Kolkata, Kochi, Chandigarh and Coimbatore) and a staff strength of over 6800, the firm provides investors, developers, local corporates and multinational companies with a comprehensive range of services including research, analytics, consultancy, transactions, project and development services, integrated facility management, property and asset management, sustainability, industrial, capital markets, residential, hotels, health care, senior living, education and retail advisory.The firm was named the Best Property Consultancy in India (5 Star Winner) at the International Property Awards - Asia Pacific for 2012-13.For further information, please visit www.joneslanglasalle.co.in
COPYRIGHT @ JONES LANG LASALLE 2014. All rights reserved. The content of this publication has been compiled from the various sources acknowledged. The information is from sources we deem reliable; however, no representation or warranty is made to the accuracy thereof. This report has been produced solely as a general guide and does not constitute advice. We stress that forecasting is a problematical exercise which at best should be regarded as an indicative assessment of possibilities rather than absolute certainties.
Ashutosh Limaye Head, Research and REIS [email protected] +91 98211 07054
For more information about Research