corporate real estate, capital structure and stock ... corporate re capit… · 3 corporate real...
TRANSCRIPT

1 Corporate Real Estate, Capital Structure and Stock Performance
INTERNATIONAL REAL ESTATE REVIEW
201X Vol. XX No. XX: pp. XX – XX
Corporate Real Estate, Capital Structure and
Stock Performance: Evidence from China
Hongyan Du PhD candidate at the School of Management and Economics, University of Electronic Science and Technology of China. [email protected].
Yongkai Ma *
Professor and Vice Dean of the School of Management and Economics, University of Electronic Science and Technology of China. Address: No.4, Section 2, North Jianshe Road, Chengdu, P.R.China. Tel: +86-28-83205611. [email protected].
This paper attempts to study the relationships among corporate real estate (CRE), capital structure and stock performance of China’s non-real estate firms, including the bidirectional relationships between debt ratio (DR) and corporate real estate ratio (CRER), the impact of CRER on stock performance, and whether this impact differs across firms with different debt levels. The results show that for the overall sample, DR has a positive effect on CRER, while CRER negatively affects DR. CRER has no significant positive impact on the abnormal returns of stocks, and even decreases those for firms in the information industry. However, it can significantly reduce the systematic risks of stock returns. Moreover, we find that CRER has no significant effect on abnormal returns regardless of the amount of debt level that a firm has, and there is no significant difference between the effects of CRER on abnormal returns for firms with different levels of debt. On the other hand, the effect of CRER on systematic risk is significantly negative for firms in the low debt group, and insignificantly positive for firms in the high debt group. The CRER of lower debt firms can significantly reduce much more systematic risk than that of the high debt firms.
Keywords:
Corporate real estate; Capital structure; Stock performance
* Corresponding author

Du and Ma 2
1. Introduction
Corporate real estate (CRE) comprise buildings and lands owned by a
non-real estate corporation to support its core business operations and
development (Liow, 2004), which play an important role in corporate asset
structure. Its effect on corporate operations has attracted considerable
attention from both the academia and the industry. Prior studies pay the most
attention to the impact of CRE on stock performance, and report mixed results.
For example, Deng and Gyourko (2000), Seiler et al. (2001), Liow (2004),
Brounen and Eochholtz (2005), Du et al. (2007) and Dong et al. (2011) all
show that CRE ownership may not increase the abnormal return of stocks,
although in a few of the industries, it can significantly decrease the systematic
risk. The research by Tuzel (2010) suggests that a higher corporate real estate
ratio (CRER) is associated with higher stock returns and systematic risks.
Moreover, by using a sample of 454 international retail companies, Brounen
et al. (2005) find that CRE ownership not only can significantly increase
abnormal returns, but also decrease systematic risks. One possible reason for
these mixed findings is that the data used by the researchers are derived from
different countries, regions, or industries. Moreover, another possible
explanation is that there are some other factors which affect the relationship
between CRER and stock performance.
Capital structure may be one of these factors, as it correlates with both the
stock performance and CRER of the firm (Hukubun, 2005; Brounen and
Eichhlotz, 2005). Therefore, the relationship between CRER and stock
performance may be affected by the firm’s debt level. To our knowledge, only
Tuzel (2010) has tested this possible effect with a portfolio based approach by
sorting his sample firms according to their real estate ratio and long-term debt
ratio (DR) simultaneously, and then distributing into portfolios. His results
show that the firms with higher CRER earn higher returns for both high
leverage as well as low leverage sorted portfolios.
The prior studies show that there are few studies which have examined the
effect of capital structure on the relationship between CRER and stock
performance. Therefore, it is necessary to study this issue with some other
data and methods, compare the results with those of Tuzel (2010), and enrich
the research of CRE. Moreover, for the relationship between CRER and
capital structure, we can find from prior studies that aside from the
significantly positive relationship documented by Brounen and Eichhlotz
(2005), Brounen et al. (2005) also find an insignificant effect of DR on CRER.
Yet it is worth noticing that real estate is an asset that locks in a great deal of
corporate resources, and interacts with a firm’s capital structure. On the one
hand, DR will have an impact on CRER. As real estate is an asset with a high
capital requirement, it may be necessary for a firm to buy through debt
financing, and then we will observe a rise of CRER following an increase of

3 Corporate Real Estate, Capital Structure and Stock Performance
DR1. However, when the debt level is high, to repay the principle and interest,
a firm may avoid investing in low liquidity assets. In this case, higher DR is
associated with lower CRER. On the other hand, CRER will also affect DR
from other three aspects (1) real estate can serve as collateral for refinancing,
(2) a firm sells unused or underutilized real estate to obtain funding and then
repay the debt, and (3) a firm uses the cash flow generated from real estate
operations and management to repay the debt. In the first two cases, CRER
positively affects DR, while in the last case, CRER and DR are negatively
correlated. Given that firms efficiently manage and operate their real estate,
the more CRE that they own, the more cash flow will be generated, and thus,
the more debt that can be repaid. Therefore, if we observe a negative effect of
CRER on DR, we can propose that these firms have a more efficient real
estate operation and management. However, if a positive impact is observed,
this shows that these firms take real estate as collateral for loans, or sell
unused or underutilized real estate to repay the debt. If the latter case is true,
we can assume that these firms may over-invest in real estate or inefficiently
manage real estate. Therefore, studying the impact of DR on CRER can help
us to clarify the ways that firms finance real estate, while examining the
impact of CRER on DR can help us to determine whether the firm’s real estate
operations and management are efficient. However, the bidirectional
relationships between DR and CRER have not been examined by prior
studies.
In addition, we can also find that in prior studies, only Dong et al. (2011) have
studied the relationship between CRE and stock performance for Chinese
firms. In their research, fixed asset holding is used to proxy for CRE. While it
is a fact that the CRE is an important part of fixed assets for Chinese firms,
but it is not enough to only have the CRE as a complete representation2.
The purpose of this paper is to study the relationships among CRER, capital
structure and stock performance, by using the real estate data of Chinese
non-real estate firms. First, we make a primary attempt to examine the
bidirectional relationships between CRER and DR. Secondly, we will study
the effect of CRER on stock performance. Finally, we will test whether this
effect differs across firms with different levels of debt.
The remainder of this paper is organized as follows. Section 2 introduces our
data and presents some simple statistical analyses. The study methods are
1 Fundamentally, this case should be thought of as the effect of CRER on DR.
However, the rise of DR consequently comes before the increase of CRER, and we
consider the relationship between CRER and DR from the perspective in which the
change of DR results in the change of CRER. 2 According to statistics, for Chinese non-real estate firms, the ratios of net real estate
on net fixed assets are 51% in 2003 and 48% in 2008, while the ratios of gross real
estate to gross fixed assets are 43% and 41%, respectively.

Du and Ma 4
described in Section 3. The empirical results and analysis are presented in
Section 4. The last section provides our conclusions.
2. Data
In this paper, the sample covers all the Chinese non-real estate firms that issue
A-shares in the Shanghai Stock Exchange. Monthly stock return and
semi-annual balance sheet and notes information are retrieved from both the
China Stock Market Trading Database (CSMAR) and the website of the
Shanghai Stock Exchange. Due to a variety of data limitations in the databases,
we confine our analysis to the period of 2003 to 2008. We exclude financial
firms from the sample because of the peculiar nature of their business
operations. Companies in agriculture, mining, construction, social services
and transmission are also excluded as the sample sizes of these industries are
smaller than 20. The final sample includes 340 firms in 6 non-real estate
industries.
In China, buildings and land belong to different categories on a balance sheet,
which is different from that of other countries3. The land use rights are
intangible assets, while the buildings are tangible assets. In our database, the
information on land use rights of the sample firms is only available from 2007
to 2008, while the information on buildings is available from 2003 to 2008.
Therefore, in order to maintain the sample size, we employ the ratio of
buildings to total assets as a measure of CRER4.
Table 1 shows the summary statistics for both absolute CRE holdings
(CREABS) and CRE ratio of the entire sample. The average CREABS for the
sample period is 777 million RMB, clearly much higher than the median 293
million RMB. These statistics demonstrate that most of the firms in our
sample hold less real estate, and only a minority owns quite a lot of real estate.
The minimum and maximum of CREABS are 0.13 and 5170 million RMB,
respectively, which suggest that the absolute CRE holdings greatly vary across
firms. The statistics of the CRER exhibit similar patterns.
3 In China, all land is monopolized by the state or collectives, and there is no private
ownership of land. Companies, organizations, and individuals could acquire land use
rights from the government or existing rights-holders. Depending on the type and
purpose of the land use, the maximum duration of the land use grant is 40 years for
commercial use, 50 years for industrial use, and 70 years for residential use (Du et al.,
2010). 4 Since the information about land use rights is missing, the CRER calculated in this
paper is lower than the real CRER of these firms.

5 Corporate Real Estate, Capital Structure and Stock Performance
Table 1 Summary Statistics for Absolute CRE Holdings and CRE Ratio
Statistic CREABS CRER
Mean 777 18.80%
Median 293 15.90%
Min 0.13 0.03%
Max 51700 88.23%
Std. 2810 0.17
Observations 2040 2040
Notes: CREABS (unit: million RMB) = gross building value reflected in
notes of balance sheets.
CRER= CREABS/total asset.
Table 2 presents the average absolute CRE holdings and CRER for all six
industries. As we see from Panel A, in absolute terms, the average CRE
holdings vary from 263 million RMB in information to 1680 million RMB in
electricity, which show that there are significant differences among the six
industries. Moreover, during the entire sample period, the average CREABS
continued to increase, in contrast to the downward trend that was exhibited by
Liow (2004). Panel B indicates that, on average, the CRER continued to
increase from 18% in 2003 to 19.9% in 2006, then experienced a slight
decrease in 2007 with a rebound in 2008. This may be due to the fact that
Chinese housing price was very high in the year 2007, and then many firms
stopped investing in real estate. However, their firm sizes continued to expand,
which thus led to a decrease in the CRER. In 2008, the Chinese housing price
quickly dropped, owing to the effect of the global financial crisis and the
macro control of the Chinese government. Then, many firms reinvested in real
estate, and an uptrend of the CRER is observed. The distribution of the CRER
across industries is different from that of CREABS. The CRER of retail is the
highest, which is more than 30%, while the corresponding number of
information is the lowest, about 11.2%.
As Panel B of Table 2 shows, the CRERs of 4 out of the 6 industries are less
than 20%5, except for electricity and retail. The average CRER of our sample
is lower than that of most of the previous studies. There are two possible
reasons. One is that the proxy for the CRER in this paper is different from that
in the previous literature6. The other one is that the CRER presented in Table 2
5 Liow (1999) applied a 20 percent cut-off point to identify ―property intensive‖
non-real estate firms. 6 There are two ways to measure the CRER in those studies: property, plant and
equipment (PPE) /total asset (Deng and Gyourko, 2000; Brounen and Eichholtz, 2005;
Brounen et al., 2005), and property/total tangible asset (Liow, 1999, 2004).

Du and Ma 6
does not contain the value of land use rights. To clearly illustrate the CRE
holdings of Chinese non-real estate firms, Table 3 provides the absolute and
relative CRE holdings of the sample firms in 2007 and 2008, which include
both the value of the buildings and land use rights. From Table 3, we can find
that the average CRER exceeds 20% in both 2007 and 2008, and the CRERs
of 4 of the 6 industries are higher than 20% as well.
Table 2 Average Absolute CRE Holdings and CRE Ratio per Year and
per Industry
Panel A:Average CREABS per year and per industry (unit: million RMB)
Industries Ma El Tr In Re Co TOTAL
2003 638 1170 508 199 464 381 593
2004 651 1570 549 231 583 472 647
2005 798 1640 639 266 642 550 766
2006 936 1830 541 286 721 563 871
2007 952 1940 584 284 665 400 871
2008 963 1900 1030 312 725 466 914
AVERAGE 823 1680 642 263 633 471 777
Panel B:Average CRER per year and per industry
2003 17.0% 22.5% 19.7% 10.1% 29.2% 15.2% 18.0%
2004 18.0% 23.6% 18.8% 10.9% 30.2% 17.4% 19.0%
2005 18.8% 23.7% 19.4% 11.7% 33.3% 18.7% 20.0%
2006 19.3% 26.0% 13.5% 11.6% 32.6% 16.8% 19.9%
2007 16.5% 24.6% 12.4% 9.8% 24.8% 11.6% 16.7%
2008 18.7% 22.3% 17.2% 13.1% 33.5% 15.1% 19.6%
AVERAGE 18.0% 23.8% 16.8% 11.2% 30.6% 15.8% 18.8%
SIZE 215 20 20 26 33 26 340
Notes: Ma—Manufacturing, El—Electricity, Tr—Transportation, In—Information,
Re—Retail, Co—Conglomerate.
CREABS (unit: million RMB) = gross building value reflected in notes of
balance sheets.
CRER= CREABS/total asset.
With respect to measuring the capital structure, Brounen and Eichholtz (2005)
and Tuzel (2010) use total debt (TD) and long-term debt (LTD) to compute
the DR, respectively. Following their methods and to eliminate the bias of
variable selection, we use both TD/ (TD+MVE) and LTD/ (LTD+MVE) to
measure capital structure, and name them DR1 and DR2, where MVE is the
market value of equity. Table 4 contains the averages of the two variables for
the six industries and six years. From the table, we can see that the
distribution of DR1 is different from that of DR2. Firms in electricity have the
highest DR1 and DR2, while firms in retail have the second-highest DR1 and

7 Corporate Real Estate, Capital Structure and Stock Performance
lowest DR2. As for transportation, its DR1 is the lowest, but DR2 is the
second-highest. Therefore, these two variables can be used to describe capital
structure from different perspectives. If we derive consistent results by
including the two variables in models respectively, then the results are
credible to a certain extent.
Table 3 Average Absolute CRE Holdings and CRE Ratio per Industry
from 2007 to 2008
Panel A: Average CREABS* and CRER* per industry in 2007
Industries Ma El Tr In Re Co TOTAL
CREABS* 1380 1310 635 628 856 440 1140
CRER* 21.3% 30.4% 21.9% 18.6% 24.3% 14.6% 21.5%
Panel B: Average CREABS* and CRER* per industry in 2008
CREABS* 1240 1690 1820 434 929 408 1150
CRER* 23.5% 26.8% 31.3% 15.6% 26.4% 18.5% 23.4%
Notes: Ma—Manufacturing, El—Electricity, Tr—Transportation, In—Information,
Re—Retail, Co—Conglomerate.
CREABS* (unit: million RMB) = gross house, building and land value
reflected in notes of balance sheets.
CRER*= CREABS*/total asset.
Table 4 Average Debt Level per Year and per Industry
Panel A:Average DR1 per year and per industry
Industries Ma El Tr In Re Co TOTAL
2003 25.5% 27.5% 18.2% 28.2% 37.7% 31.8% 27.1%
2004 33.2% 38.4% 22.6% 32.3% 40.8% 35.7% 33.8%
2005 41.4% 49.6% 31.2% 42.0% 46.4% 43.6% 42.0%
2006 36.0% 47.0% 32.0% 35.0% 37.6% 36.5% 36.6%
2007 20.4% 28.4% 20.5% 19.6% 21.8% 21.2% 21.1%
2008 38.8% 53.3% 41.5% 34.5% 41.1% 36.2% 39.5%
AVERGAE 32.5% 40.7% 27.7% 31.9% 37.6% 34.1% 33.3%
Panel B:Average DR2 per year and per industry
2003 5.1% 13.5% 7.0% 1.8% 2.4% 6.1% 5.3%
2004 6.7% 21.8% 8.4% 3.5% 3.4% 7.3% 7.2%
2005 9.1% 31.8% 15.1% 5.2% 4.2% 9.3% 10.1%
2006 7.1% 28.5% 15.1% 3.6% 3.7% 6.2% 8.2%
2007 3.0% 15.6% 9.3% 1.8% 1.6% 4.4% 4.0%
2008 7.4% 34.8% 22.1% 3.0% 5.8% 8.5% 9.5%
AVERGAE 6.4% 24.3% 12.8% 3.1% 3.5% 7.0% 7.4%
Notes: Ma—Manufacturing, El—Electricity, Tr—Transportation, In—Information,
Re—Retail, Co—Conglomerate.
DR1=total debt/(total debt + market value of equity); DR2=long-term
debt/(long-term debt + market value of equity).

Du and Ma 8
3. Research Methodology
The empirical research of this paper consists of three parts.
We first examine the bidirectional relationships between capital structure and
CRER by using a Granger causality test. First, we check whether the pooled
panel data for CRER, DR1 and DR2 are stationary for the overall sample and
the industry-specific sub-samples. We use the procedure developed by Levin
et al. (2002) to conduct the unit-root tests. The results show that CRER, DR1
and DR2 are stationary in most cases, except that the CRER of conglomerate,
DR1 of transportation and DR2 of retail are I(1) series, so we find no
cointegrated relationships between CRER and DR for both the overall sample
and the sub-samples. Therefore, we use Models (1) and (2) to examine the
relationship between CRER and DR for the samples in which the CRER and
DR are stationary, while for samples in which the CRER, DR1 or DR2 are
I(1), we replace the CRER and DR of Models (1) and (2) with the first
differenced CRER and DR, which are stationary.
5
, , - , - 1 , 2 2 ,
1 1 1
CRER CRER DR SIZE MARKET Im n
i t i j i t j k i t k i t t d d i t
j k d
c
(1) 5
, , , 1 , 2 2 ,
1 1 1
DR DR CRER SIZE MARKET Ip q
i t i j i t j k i t k i t t d d i t
j k d
c
(2)
where ,CRER i t and ,DR i t are the CRER and DR of firm i at time t. In
consideration of the results shown by the descriptive statistics in which both
CRER and DR differ across industries and change along with the changing
market conditions, we control the industry and market condition effect in
Models (1) and (2). Id(d=1, 2, 3, 4, 5) are industry dummies that represent
manufacturing, electricity, transportation, information, and retail, respectively.
MARKETt is the market condition dummy variable, which takes a value of
1 when the time is 2008, otherwise 0. That is because in 2008, the Chinese
economy was fiercely shocked due to the global financial crisis, and the
economic environment greatly changed. Firm size is also included as a control
variable as large firms can borrow money at a cheaper rate, may hold more
debt, and then buy more CREs. ,SIZEi t is the logarithm of the equity market
value of firm i at time t. The optimal lag lengths m, n, p and q are decided
based on the Akaike information criteria (AIC). In Models (1) and (2), we
mainly focus on the estimated values of 1
n
k
k
and 1
q
k
k
, which represent
the effect of CRER and DR on each other. A Wald test is conducted to
determine whether1
n
k
k
and1
q
k
k
are statistically significant.

9 Corporate Real Estate, Capital Structure and Stock Performance
Secondly, we investigate the effect of CRER on stock performance in two
stages. The first is to select stock performance indicators. Similar to the
existing literature, we use both abnormal return and systematic risk to
measure stock performance. Following the methodology of Deng and
Gyourko (2000), Brounen et al. (2005) and Du et al. (2007), we use the
Fama-Macbeth approach to estimate the two items. The regression model is:
, , , ,R Rf (Rm Rf )i t t i t i t t t i t (3)
where Rit represents the monthly return of stock i during period t, Rmt and
Rft are the market return and risk-free rate over period t, respectively. βi is the
systematic risk of the stock. It measures the sensitivity of the stock return to
the market return. αi is the idiosyncratic component of the excess return,
called Jensen’s alpha.
In the second stage, both abnormal return and systematic risk serve as
dependent variables in Models (4) and (5). To ensure the accounting
information is already impounded into the stock price, all of the accounting
data that we used is from the prior period.
5
, 1 , 1 2 , 1 3 , 1 4 , 1 5 ,
1
CRER DR SIZE MB MARKET Ii t i i t i t i t i t t d d i t
d
c a a a a a
(4) 5
, 1 , 1 2 , 1 3 , 1 4 ,
1
CRER DR SIZE MARKET Ii t i i t i t i t t d d i t
d
c a a a a
(5)
The selection of the control variables is based on the following considerations:
(1) according to the three-factor model of Fama-French (1993, 1995), we
include SIZE and MB in models to control for the effect of firm size and
growth opportunities. SIZE is the logarithm of the market value of equity,
while MB is the market to book value of equity; (2) Brounen and Eichholtz
(2005) and Seiler et al. (2001) control the effect of debt when they studied the
relationship between CRE and stock performance. Variable DR is also
included in our models to control the possible effect of debt level. This
variable has two different measurements, thus every model in this paper has
two specifications; (3) the change in market conditions may have an important
effect on firm operation and even their market values, so we include the
dummy variable MARKET in the model, which takes a value of 1 when the
time is 2008, otherwise 0; and (4) by following Brounen and Eichholtz (2005),
we control the industry effect by using industry dummies I1, I2, I3, I4 and I5.
Thirdly, we examine whether the relationship between CRER and stock
performance differs across firms with different debt levels. At first, similar to
the method used by Tuzel (2010), we sort the sample firms by year and
industry according to their DR, and categorize them into low, medium and
high debt groups. Then we generate two debt level dummies, LD and MD. LD
takes a value of 1 if the firm is in the low debt group, otherwise 0, while MD

Du and Ma 10
takes a value of 1 if the firm is in the medium debt group, otherwise 0.
Therefore, Models (6) and (7) are specified below. In these two models,1a ,
1 3a a and 1 2a a measure the effects of CRER on abnormal returns and
systematic risks for high, medium and low debt firms, respectively. A Wald
test is conducted to determine whether 1 3a a and
1 2a a are statistically
significant. If 2a and
3a are significant, then there is evidence that the effects
of CRER for low and medium debt firms are significantly different from those
of high debt firms.
, 1 , 1 2 . 1 , 1 3 . 1 , 1 4 . 1 5 . 1
5
6 , 1 7 , 1 8 ,
1
CRER LD *CRER MD *CRER LD MD
SIZE MB MARKET I
i t i i t i t i t i t i t i t i t
i t i t t d d i t
d
c a a a a a
a a a
(6)
, 1 , 1 2 . 1 , 1 3 . 1 , 1 4 . 1 5 . 1
5
6 , 1 7 ,
1
C R E R L D * C R E R M D * C R E R L D M D
S I Z E M A R K E T I
i t i i t i t i t i t i t i t i t
i t t d d i t
d
c a a a a a
a a
(7)
There are three methods to estimate the panel data model: pool, fixed effect
and random effect models. We first use the Hausman test to compare the fixed
effect model versus the random effect model. If the random effect model is
better, we will use the LM test to choose between this model and the pool
model, but in the event that the fixed effect model is better, we will use an
F-test to choose between the fixed effect model and the pool model. The
F-statistic is: (SSE SSE ) / (N 1)
FSSE / (NT-N-K)
r u
u
where SSEr and SSEu represent the sum of the residual squares of the pool
model and fixed effect model, respectively. N is the number of individuals, K
is the number of independent variables, T is the maximum length of the time
series, and NT is N*T. If F > Fα(N-1,NT-N-K), we will choose the fixed effect
model.
4. Empirical Results
Tables 5 and 6 document the regression results of Models (1) and (2)7. As
Table 1 shows, 1
n
k
k
for the overall samples in Spec.1 is positive and
significant at the 1% level, while the corresponding number in Spec.2 is also
positive, but not significant. An analysis on the results of the sub-samples
7 Since the estimated values of
1
n
k
k
and1
q
k
k
are mainly focused, and due to the table
design, we do not report the values of 1
m
j
j
and 1
p
j
j
. The results are available
upon request.
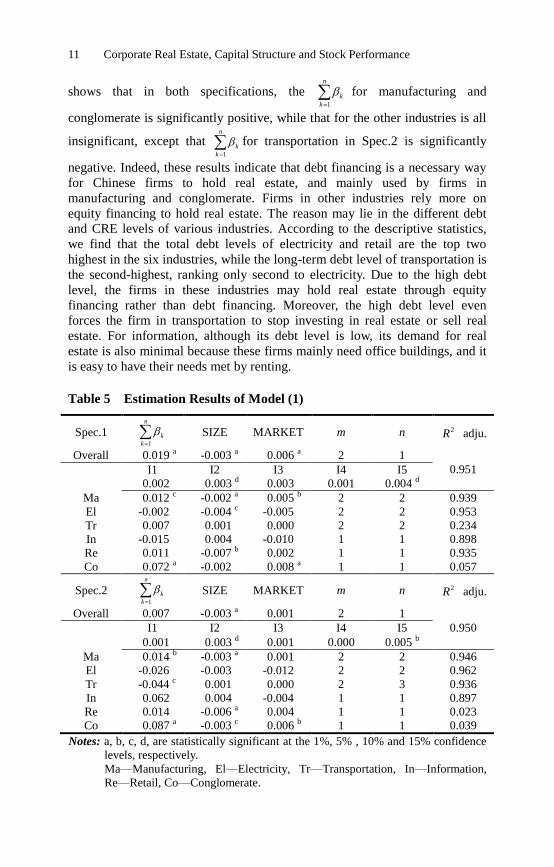
11 Corporate Real Estate, Capital Structure and Stock Performance
shows that in both specifications, the 1
n
k
k
for manufacturing and
conglomerate is significantly positive, while that for the other industries is all
insignificant, except that 1
n
k
k
for transportation in Spec.2 is significantly
negative. Indeed, these results indicate that debt financing is a necessary way
for Chinese firms to hold real estate, and mainly used by firms in
manufacturing and conglomerate. Firms in other industries rely more on
equity financing to hold real estate. The reason may lie in the different debt
and CRE levels of various industries. According to the descriptive statistics,
we find that the total debt levels of electricity and retail are the top two
highest in the six industries, while the long-term debt level of transportation is
the second-highest, ranking only second to electricity. Due to the high debt
level, the firms in these industries may hold real estate through equity
financing rather than debt financing. Moreover, the high debt level even
forces the firm in transportation to stop investing in real estate or sell real
estate. For information, although its debt level is low, its demand for real
estate is also minimal because these firms mainly need office buildings, and it
is easy to have their needs met by renting.
Table 5 Estimation Results of Model (1)
Spec.1 1
n
k
k
SIZE MARKET m n 2R adju.
Overall 0.019 a -0.003 a 0.006 a 2 1
0.951 I1 I2 I3 I4 I5
0.002 0.003 d 0.003 0.001 0.004 d
Ma 0.012 c -0.002 a 0.005 b 2 2 0.939
El -0.002 -0.004 c -0.005 2 2 0.953
Tr 0.007 0.001 0.000 2 2 0.234
In -0.015 0.004 -0.010 1 1 0.898
Re 0.011 -0.007 b 0.002 1 1 0.935
Co 0.072 a -0.002 0.008 a 1 1 0.057
Spec.2 1
n
k
k
SIZE MARKET m n 2R adju.
Overall 0.007 -0.003 a 0.001 2 1
0.950 I1 I2 I3 I4 I5
0.001 0.003 d 0.001 0.000 0.005 b
Ma 0.014 b -0.003 a 0.001 2 2 0.946
El -0.026 -0.003 -0.012 2 2 0.962
Tr -0.044 c 0.001 0.000 2 3 0.936
In 0.062 0.004 -0.004 1 1 0.897
Re 0.014 -0.006 a 0.004 1 1 0.023
Co 0.087 a -0.003 c 0.006 b 1 1 0.039
Notes: a, b, c, d, are statistically significant at the 1%, 5% , 10% and 15% confidence
levels, respectively.
Ma—Manufacturing, El—Electricity, Tr—Transportation, In—Information,
Re—Retail, Co—Conglomerate.
Du and Ma 12
Table 6 shows that in Spec.1, the 1
q
k
k
for the overall sample is negative
with a significance of 5%, while it is insignificantly negative in Spec.2. As we
have mentioned before, the negative effect of CRER on debt level suggests
that Chinese firms gain benefits from real estate operation and management.
These companies efficiently manage and operate their real estate to a certain
extent. The analysis on the sub-samples shows that the 1
q
k
k
for
manufacturing, retail and transportation is significantly negative. The
difference is that the CRER has a significantly negative effect on both the
total debt and the long-term debt levels for manufacturing, while for
transportation and retail, CRER just significantly decreases the long-term and
the total debt levels, respectively. This can be explained by the differences in
the total and long-term debt levels of these industries. For example, the total
DR of retail is 37.6% and its long-term DR is just 3.5%, therefore, the return
gained from real estate will not be used to repay the long-term debt, while in
the case of transportation, it is just the opposite. Moreover, it is worth noticing
that in both specifications, the 1
q
k
k
for information is positive and significant
at a 1% level. Therefore, there is no evidence to support the view that
information firms receive benefits from real estate management, but possibly
that these firms may sell real estate to repay debt, reflecting an
over-investment and inefficient management of real estate. On the other hand,
for other industries, there is no significant effect of CRER on DR. From the
analysis above, we can argue that firms in manufacturing, transportation and
retail manage real estate much more efficiently than the firms in the other
industries, and the real estate management efficiency of information may be
the lowest. Therefore, we expect that the performance of CRE in the first three
industries will be better than that in the other industries.
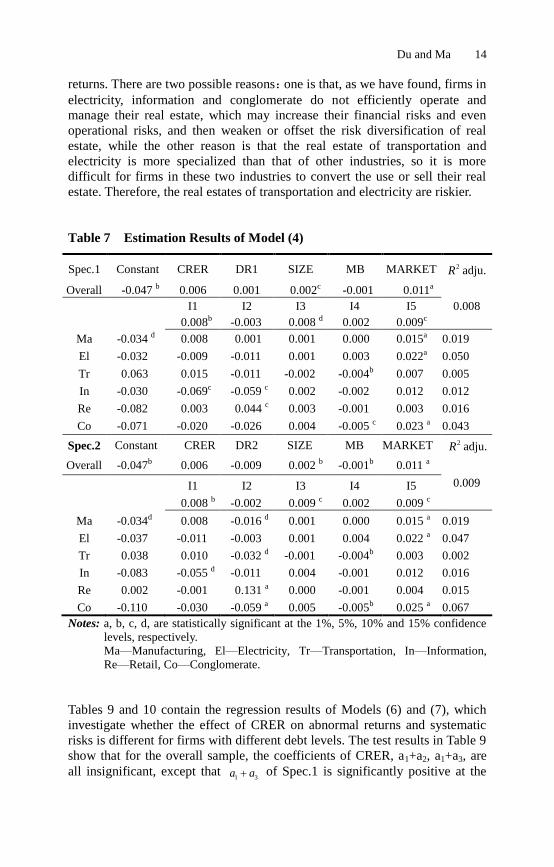
Table 7 reports the estimated results of Model (4). For the overall sample, the
coefficients of CRER in both specifications are insignificantly positive, while
for the sub-samples, the coefficients of CRER are all insignificant, except for
the significantly negative CRER coefficient for information. This shows that
CRE will not significantly increase the abnormal returns of Chinese non-real
estate firms, and even significantly decrease those of firms in information,
which is consistent with the results of Seiler et al. (2001), but contrasts with
the results of Tuzel (2010). As Dong et al. (2011) have shown, a possible
reason is that Chinese firms have overinvested in real estate, so that the return
may be weakened or even offset by the losses of over-investment or
inefficient management. We can also find that the coefficients of CRER for
manufacturing, transportation and retail are a little higher than those of
electricity, information and conglomerate, while the coefficient for
information is the lowest. This is consistent with our findings in which firms
in the first three industries operate and manage their real estate much more
efficiently, and the efficiency of real estate management of information may
be the lowest.

13 Corporate Real Estate, Capital Structure and Stock Performance
Table 6 Estimation Results of Model (2)
Spec.1 1
q
k
k
SIZE MARKET p q 2R adju.
Overall -0.020 b 0.000 -0.048
a 2 1
0.683 I1 I2 I3 I4 I5
0.002 0.028 a 0.007 0.001 0.008
Ma -0.074 a -0.046
a -0.077
a 1 1 0.781
El -0.048 -0.002 -0.045 2 1 0.706
Tr 0.057 -0.043 a -0.038
d 1 1 0.007
In 0.137 a -0.045
a -0.101
a 1 1 0.731
Re -0.028 c 0.006 -0.045
a 1 1 0.764
Co -0.041 -0.082 a -0.022
c 1 1 0.168
Spec.2 1
q
k
k
SIZE MARKET p q 2R adju.
Overall -0.009 a 0.000
c -0.001
b 1 1
0.621 I1 I2 I3 I4 I5
0.000 0.020 a 0.010
a -0.001 0.003
b
Ma -0.012 a -0.001
a -0.002
a 1 1 0.613
El 0.028 0.005 -0.007 2 1 0.486
Tr -0.082 a -0.004
a 0.005
a 1 1 0.582
In 0.004 a -0.003
a -0.012
a 1 1 0.552
Re 0.000 -0.001 0.000 1 1 0.001
Co 0.042 0.000 -0.008 1 1 0.014
Notes:a, b, c, d, are statistically significant at the 1%, 5%, 10% and 15% confidence
levels, respectively.
Ma—Manufacturing, El—Electricity, Tr—Transportation, In—Information,
Re—Retail, Co—Conglomerate.
The estimation results of Model (5) are presented in Table 8. In both
specifications, the coefficients of CRER are significantly negative at the 1%
level for the overall sample, which suggests that CRE ownership of Chinese
non-real estate firms provides a diversification benefit in terms of lowering
the systematic risk, which is different from the results of Seiler et al. (2001),
Liow (2004) and Tuzel (2010). However, this effect differs across industries.
As we can see from Spec.1, the coefficient of CRER is -0.360 for
manufacturing with a significance of 5%, while that for retail is -0.332 and
significant at a level of 1%. The coefficients of CRER for electricity and
transportation are insignificantly negative, while those for information and
conglomerate are insignificantly positive. The results of Spec.2 are similar to
those of Spec.1, except that the coefficient of CRER for transportation is
insignificantly positive. These results indicate that the CRE holdings of firms
in transportation, electricity, information, and conglomerate will not
significantly decrease or even increase the systematic risk of their stock
Du and Ma 14
returns. There are two possible reasons:one is that, as we have found, firms in
electricity, information and conglomerate do not efficiently operate and
manage their real estate, which may increase their financial risks and even
operational risks, and then weaken or offset the risk diversification of real
estate, while the other reason is that the real estate of transportation and
electricity is more specialized than that of other industries, so it is more
difficult for firms in these two industries to convert the use or sell their real
estate. Therefore, the real estates of transportation and electricity are riskier.
Table 7 Estimation Results of Model (4)
Spec.1 Constant CRER DR1 SIZE MB MARKET 2R adju.
Overall -0.047 b 0.006 0.001 0.002c -0.001 0.011a
0.008 I1 I2 I3 I4 I5
0.008b -0.003 0.008 d 0.002 0.009c
Ma -0.034 d 0.008 0.001 0.001 0.000 0.015a 0.019
El -0.032 -0.009 -0.011 0.001 0.003 0.022a 0.050
Tr 0.063 0.015 -0.011 -0.002 -0.004b 0.007 0.005
In -0.030 -0.069c -0.059 c 0.002 -0.002 0.012 0.012
Re -0.082 0.003 0.044 c 0.003 -0.001 0.003 0.016
Co -0.071 -0.020 -0.026 0.004 -0.005 c 0.023 a 0.043
Spec.2 Constant CRER DR2 SIZE MB MARKET 2R adju.
Overall -0.047b 0.006 -0.009 0.002 b -0.001b 0.011 a
0.009 I1 I2 I3 I4 I5
0.008 b -0.002 0.009 c 0.002 0.009 c
Ma -0.034d 0.008 -0.016 d 0.001 0.000 0.015 a 0.019
El -0.037 -0.011 -0.003 0.001 0.004 0.022 a 0.047
Tr 0.038 0.010 -0.032 d -0.001 -0.004b 0.003 0.002
In -0.083 -0.055 d -0.011 0.004 -0.001 0.012 0.016
Re 0.002 -0.001 0.131 a 0.000 -0.001 0.004 0.015
Co -0.110 -0.030 -0.059 a 0.005 -0.005b 0.025 a 0.067
Notes: a, b, c, d, are statistically significant at the 1%, 5%, 10% and 15% confidence
levels, respectively.
Ma—Manufacturing, El—Electricity, Tr—Transportation, In—Information,
Re—Retail, Co—Conglomerate.
Tables 9 and 10 contain the regression results of Models (6) and (7), which
investigate whether the effect of CRER on abnormal returns and systematic
risks is different for firms with different debt levels. The test results in Table 9
show that for the overall sample, the coefficients of CRER, a1+a2, a1+a3, are
all insignificant, except that 1 3a a of Spec.1 is significantly positive at the

15 Corporate Real Estate, Capital Structure and Stock Performance
15% level, which does not hold in Spec.2. It shows that regardless of the debt
level of a firm, the CRER has no significant effect on the abnormal returns of
stocks. This result is different from that of Tuzel (2010). He shows that a
higher CRER can earn higher returns for both high leverage as well as low
leverage sorted portfolios. The reason may lie in that, as Table 7 shows, for
Chinese firms, DR has no significant effect on abnormal returns8, and the
impact of CRER on abnormal returns has not been affected by the debt level.
The estimated coefficients of LD*CRER and MD*CRER for the overall
sample in both Specs.1 and 2 are insignificant, which suggest that there is no
statistical difference between the effects of CRER on abnormal returns for
firms with different debt levels. Meanwhile, the regressions results for the
sub-samples show that only in a very few cases is the difference significant.
For instance, in Spec.1, the medium debt firms in retail will obtain
significantly higher abnormal returns than high debt firms by holding real
estate. However, this result is not robust in Spec.2.
Table 8 Estimation Results of Model (5)
Spec.1 Constant CRER DR1 SIZE MARKET 2R adju.
Overall 2.287 a -0.192 a 0.213 a -0.056 a 0.083 a
0.164 I1 I2 I3 I4 I5
-0.081 c 0.023 -0.142 b -0.031 -0.109 b
Ma 4.261 a -0.360 b 0.271 d -0.152 a 0.193 a 0.036
El 2.133 a -0.267 -0.024 -0.041 -0.121 d 0.115
Tr 2.457 b -0.207 -0.054 -0.068 0.211 b 0.005
In 3.768 b 0.659 1.112 a -0.142 b 0.140 0.046
Re 4.022 a -0.332 a 0.161 -0.140 a 0.074 0.180
Co 1.751 0.294 0.151 -0.032 -0.077 0.176
Spec.2 Constant CRER DR2 SIZE MARKET 2R adju.
Overall 2.515 a -0.210 a 0.207 b -0.064 a 0.084 a
0.162 I1 I2 I3 I4 I5
-0.085 b 0.005 -0.168 a -0.028 -0.098 c
Ma 5.029 a -0.358 c 0.184 -0.184 a 0.210 a 0.035
El 2.106 a -0.274 0.078 -0.041 -0.121 d 0.116
Tr 1.287 0.187 -0.651 -0.015 0.223 b 0.102
In 5.196 a 0.323 0.035 -0.191 a 0.112 0.016
Re 4.266 a -0.349 a 0.133 -0.148 a 0.070 0.178
Co 2.022 c 0.327 0.164 -0.043 -0.079 0.173
Notes: a, b, c, d, are statistically significant at the 1%, 5%, 10% and 15% confidence
levels, respectively.
Ma—Manufacturing, El—Electricity, Tr—Transportation, In—Information,
Re—Retail, Co—Conglomerate.
8 In Table 7, the coefficients of DR1 and DR2 for the overall sample and most of the
sub-samples are insignificant.

Du and Ma 16
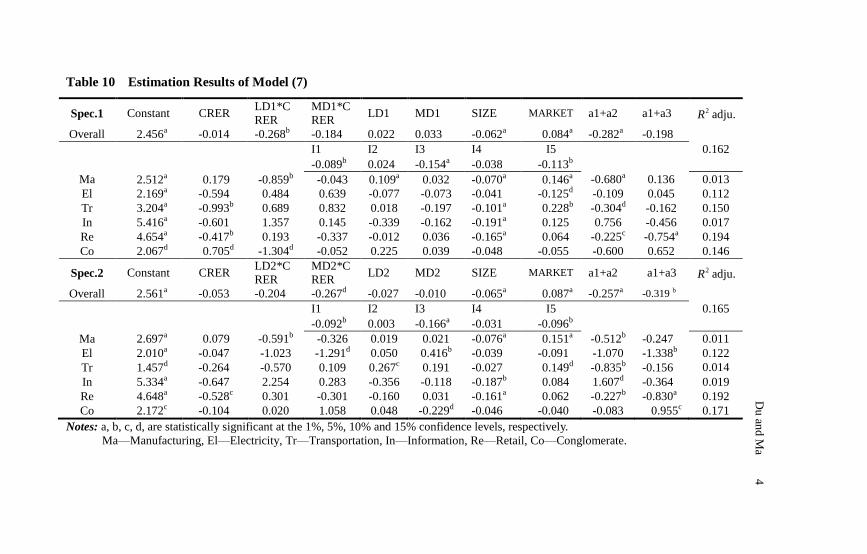
As we can see in Table 10, the results of Spec.1 show that the coefficients of
CRER, 1 2a a and
1 3a a for the overall sample are -0.014, -0.282 and
-0.198, respectively, and only 1 2a a is significant. The coefficients of
LD*CRER and MD*CRER are -0.268 and -0.184, respectively, while the
former is significant at the level of 5% and the latter is not significant. These
results indicate that only the low debt firms can experience a significant
decrease in systematic risk by holding real estate, and the negative effect of
CRER on systematic risk for them is significantly greater than that of firms
with high debt. In Spec.2, the coefficient of CRER for the overall sample is
-0.053, not significant, while 1 2a a and
1 3a a are -0.257 and -0.319,
respectively, and significant at the levels of 1% and 5%. These results show
that the CRE holdings of medium and low debt firms are associated with
significantly lower systematic risks. Meanwhile, the coefficient of MD*CRER
is -0.267 with a significance of 15%, which indicates that firms with medium
debt will reduce more systematic risk by holding real estate than firms with
high debt. Moreover, we find that the negative effect of CRER on systematic
risk for low debt firms is a little less than that for medium debt firms, which is
in contrast with the results of Spec.1. This may be because the DR used in
Spec.2 is long-term, while the average long term debt ratio (LTDR) for the
low, medium and high debt groups are 0.11%, 2.85% and 18.3% respectively.
The average LTDR of the low debt group is very close to that of medium debt
group, which may lead to a reverse relationship between the results of the two
groups.
The regression analysis on the sub-samples in both specifications show that
for manufacturing, transportation and retail, the CRER of low debt firms is
associated with significantly lower systematic risk, while for retail, the high
debt firms can significantly decrease their systematic risks by holding real
estate. Moreover, the significant coefficients of LD*CRER and MD*CRER all
show that the CRE of firms with lower debt levels will have better
performances in terms of decreasing systematic risks of stock returns. This
may be because, as Table 8 has illustrated, DR1 and DR2 are both
significantly positive associated with a firm’s systematic risk. Therefore, the
risk lowering of CRE holdings may be weakened by the risk rising of debt,
thus we cannot observe a significant relationship between the CRER and
systematic risk for high debt firms.

17 Corporate Real Estate, Capital Structure and Stock Performance
Table 9 Estimation Results of Model (6)
Spec.1 Constant CRER LD1*C
RER MD1*CRER
LD1 MD1 SIZE MB MARKET a1+a2 a1+a3 R2 adju.
Overall -0.042b 0.000 0.004 0.018 -0.007 -0.008b 0.002d 0.000 0.011a 0.004 0.018d
0.010 I1 I2 I3 I4 I5
0.008b -0.004 0.009d 0.003 0.008 c
Ma -0.029 0.001 0.013 0.011 -0.007c -0.007 0.001 0.000 0.015a 0.014 0.012 0.020
El -0.041 -0.005 0.066 -0.066 -0.022 0.012 0.001 0.005d 0.019a 0.061 -0.071c 0.060
Tr 0.009 0.042 -0.026 -0.055 0.002 0.022 d 0.000 -0.003 0.002 0.016 -0.012 0.029
In -0.082 0.060 -0.145 -0.102 0.023 0.004 0.003 -0.001 0.013 -0.084d -0.042 0.025
Re -0.061 -0.020 0.022 0.043c -0.024a -0.009 0.004 -0.002 0.003 0.002 0.023 0.040
Co -0.152d -0.004 -0.053 -0.016 -0.002 0.005 0.007 -0.002 0.022a -0.057 -0.020 0.040
Spec.2 Constant CRER LD2*C
RER
MD2*
CRER LD2 MD2 SIZE MB MARKET a1+a2 a1+a3 2R adju.
Overall -0.046c 0.012 -0.006 -0.018 -0.001 0.001 0.002c -0.001 0.011a 0.006 -0.006
0.008 I1 I2 I3 I4 I5
0.008b -0.004 0.008 d 0.002 0.009 b
Ma -0.039c 0.006 0.006 -0.001 0.002 0.002 0.002 0.000 0.015a 0.012 0.005 0.018
El -0.026 -0.023 -0.067 0.076 0.021 -0.022 0.001 0.004 0.020a -0.090 0.053 0.043
Tr 0.087 0.002 0.042 -0.038 -0.016d -0.012 -0.003 -0.002 0.004 0.044 d -0.036 0.024
In -0.061 -0.107 0.042 0.052 -0.007 0.000 0.003 -0.001 0.013 -0.065 -0.055 0.019
Re 0.03 0.006 -0.006 -0.018 -0.019 c -0.007 -0.001 -0.001 0.004 0.000 -0.012 0.015
Co -0.095 0.058 -0.083 -0.146b 0.021 d 0.023b 0.004 -0.004d 0.024 a -0.025 -0.089 b 0.050
Notes: a, b, c, d, are statistically significant at the 1%, 5%, 10% and 15% confidence levels, respectively.
Ma—Manufacturing, El—Electricity, Tr—Transportation, In—Information, Re—Retail, Co—Conglomerate.
4
C
orp
orate R
eal Estate, C
apital S
tructu
re and
Sto
ck P
erform
ance
Du and Ma 18
Table 10 Estimation Results of Model (7)
Spec.1 Constant CRER LD1*C
RER
MD1*C
RER LD1 MD1 SIZE MARKET a1+a2 a1+a3 2R adju.
Overall 2.456a -0.014 -0.268b -0.184 0.022 0.033 -0.062a 0.084a -0.282a -0.198
0.162 I1 I2 I3 I4 I5
-0.089b 0.024 -0.154a -0.038 -0.113b
Ma 2.512a 0.179 -0.859b -0.043 0.109a 0.032 -0.070a 0.146a -0.680a 0.136 0.013
El 2.169a -0.594 0.484 0.639 -0.077 -0.073 -0.041 -0.125d -0.109 0.045 0.112
Tr 3.204a -0.993b 0.689 0.832 0.018 -0.197 -0.101a 0.228b -0.304d -0.162 0.150
In 5.416a -0.601 1.357 0.145 -0.339 -0.162 -0.191a 0.125 0.756 -0.456 0.017
Re 4.654a -0.417b 0.193 -0.337 -0.012 0.036 -0.165a 0.064 -0.225c -0.754a 0.194
Co 2.067d 0.705d -1.304d -0.052 0.225 0.039 -0.048 -0.055 -0.600 0.652 0.146
Spec.2 Constant CRER LD2*C
RER
MD2*C
RER LD2 MD2 SIZE MARKET a1+a2 a1+a3 2R adju.
Overall 2.561a -0.053 -0.204 -0.267d -0.027 -0.010 -0.065a 0.087a -0.257a -0.319 b
0.165 I1 I2 I3 I4 I5
-0.092b 0.003 -0.166a -0.031 -0.096b
Ma 2.697a 0.079 -0.591b -0.326 0.019 0.021 -0.076a 0.151a -0.512b -0.247 0.011
El 2.010a -0.047 -1.023 -1.291d 0.050 0.416b -0.039 -0.091 -1.070 -1.338b 0.122
Tr 1.457d -0.264 -0.570 0.109 0.267c 0.191 -0.027 0.149d -0.835b -0.156 0.014
In 5.334a -0.647 2.254 0.283 -0.356 -0.118 -0.187b 0.084 1.607d -0.364 0.019
Re 4.648a -0.528c 0.301 -0.301 -0.160 0.031 -0.161a 0.062 -0.227b -0.830a 0.192
Co 2.172c -0.104 0.020 1.058 0.048 -0.229d -0.046 -0.040 -0.083 0.955c 0.171
Notes: a, b, c, d, are statistically significant at the 1%, 5%, 10% and 15% confidence levels, respectively.
Ma—Manufacturing, El—Electricity, Tr—Transportation, In—Information, Re—Retail, Co—Conglomerate.
Du
and M
a
4

19 Corporate Real Estate, Capital Structure and Stock Performance
5. Conclusions
This paper has investigated the relationships among CRE, capital structure
and stock performance of Chinese non-real estate firms, including the
bidirectional relationships between debt level and CRER, the impact of CRER
on stock performance, and whether this impact differs across firms with
different debt levels. Our test results demonstrate that for the overall sample,
DR has a positive effect on CRER, while for the industry-specific
sub-samples, the effect of DR on CRER is significantly positive in
manufacturing and conglomerate, significantly negative in transportation
when a long-term DR is used to measure the debt level, and insignificant in
other industries. Indeed, this indicates that debt financing is a necessary way
for Chinese firms to hold real estate, and mainly used by firms in
manufacturing and conglomerate. These results can be explained by the
different debt and CRE levels of various industries. On the other hand, CRER
negatively affects DR for the overall sample, and the effect of CRER is
significantly negative in manufacturing, retail and transportation, significantly
positive in information, and insignificant in other industries. This suggests
that Chinese firms efficiently manage and operate their real estate to a certain
extent, and the CRE in manufacturing, retail and transportation may have a
better performance than that in other industries.
Moreover, we find that the CRER of Chinese non-real estate firms has no
significantly positive impact on the abnormal returns of stocks, and even
decrease those of firms in the information industry. One possible reason is that
the returns gained by real estate as a kind of production factor and investment
assets are weakened or even offset by the losses of over-investment and
inefficient management. However, the CRE holdings can significantly
decrease the systematic risks of the stock returns. This may be because there
is a small positive to small negative correlation between the returns of real
estate and common stock returns as Han and Liang (1995) have suggested,
which may provide the firm with diversification benefits.9 A comparative
analysis on the results of the sub-samples shows that the CRE performance of
transportation, retail and manufacturing is better than that of other industries,
which is in line with our findings that firms in these three industries manage
real estate much more efficiently.
9 We collected the quarterly Shanghai Stock Exchange Composite Index and the
average housing price and land price of Beijing, Shanghai, Tianjin and Chongqing,
which are the municipalities under the Chinese central government’s direct
administration. The data spans from 2001 Q1 to 2009 Q4. Then, we tested the
correlation between the returns of market index and the returns of house and land, and
find that the housing return of Beijing is negatively correlated with the market index
return, while there are only small positive correlations between the housing returns of
the other three cities with the market index return. Moreover, the land returns of the
four cities are all negatively correlated with the market index return.

Du and Ma 20
In addition, we find that the CRER has no significant effect on abnormal
returns of stocks regardless of a firm’s debt level, and the differences between
these effects across firms with different levels of debt are not statistically
significant, while in terms of the effect of CRER on systematic risk, it is
significantly negative for firms in the low debt group, and insignificantly
negative for firms in the high debt group. There is a significant difference
between the effects in systematic risks for high and low debt firms. The CRER
of lower debt firms can significantly reduce much more systematic risks than
that of high debt firms.
Acknowledgment
We acknowledge the support from the National Natural Science Foundation of
China (70672104) and the Program for New Century Excellent Talents in
Universities funded by the Ministry of Education in China (Contract #:
NCET-05-0811). We also greatly appreciate the insightful comments and
suggestions from an anonymous referee.
References
Brounen, D., Colloander, G.C. and Eichholtz, P.M.A.E. (2005). Corporate
Real Estate and Stock Performance in the International Retail Sector, Journal
of Corporate Real Estate, 7, 4, 287-299.
Brounen, D., Eichholtz, P.M.A.E. (2005). Corporate Real Estate Ownership
Implications: International Performance Evidence, The Journal of Real Estate
Finance and Economics, 30, 4, 429-445.
Cheong, K. and Kim, S.K. (1997). Corporate Real Estate Holdings and the
Value of Firm in Korea, Journal of Real Estate Research, 13, 3, 273-295.
Deng, Y.S. and Gyourko, J. (2000). Real Estate Ownership by Non-real Estate
Firms: An Estimate of the Impact on Firm Return, University of Southern
California, July.
Dong, Y., Leung, C.K.Y. and Cai, D. (2011). What Drives Fixed Asset
Holding and Risk-adjusted Performance of Corporate in China? An Empirical

21 Corporate Real Estate, Capital Structure and Stock Performance
Analysis, Available from:
http://mpra.ub.uni-muenchen.de/29128/1/MPRA_paper_29128.pdf.
Du, J., Leung, K.Y.C. and Chu, D. (2007). Return Enhancing, Cash-rich or
Simply Empire-building? An Empirical Investigation of Corporate Real Estate
Holdings, working paper, Department of Economics, Chinese University of
Hong Kong, Hong Kong, October.
Du, H., Ma, Y., and An, Y. (2011). The Impact of Land Policy on the Relation
between Housing and Land Prices: Evidence from China, The Quarterly
Review of Economics and Finance, 51, 2, 19-27.
Fama, E. and French, K. (1993). Common Risk Factors in the Returns on
Stocks and Bonds, Journal of Financial Economics, 33, 1, 3-56.
Fama, E. and French, K. (1995). Size and Book to Market Factors in Earnings
and Returns, Journal of Finance, 50, 1, 131-155.
Han, J. and Liang, Y. (1995). The Historical Performance of Real Estate
Investment Trusts, Journal of Real Estate Research, 10, 2, 235–261.
Hukubun, F.N. (2005). Effect of Capital Structure Changes on Stock Return
Performance of LQ-45 Stocks Listed in Jakarta Stock Exchange Pre and Post
Financial Crisis, Universities Kristen Petra.
Levin, A., Lin, C. and Chu, C.C. (2002). Unit Root Tests in Panel Data:
Asymptotic and Finite-sample Properties, Journal of Econometrics, 108, 1,
1–24.
Liow, K.H. (1999).Corporate Investment and Ownership in Real Estate in
Singapore: Some Empirical Evidence, Journal of Corporate Real Estate, 1, 4,
329-342.
Liow, K.H. (2004). Corporate Real Estate and Stock Market Performance,
Journal of Real Estate Finance and Economics, 29, 1, 119-140.
Seiler, S.J., Chatrath, A. and J. R. Webb. (2001). Real Estate Ownership and
the Risk and Return to Stockholders, Journal of Real Estate Research, 22,
1,199-212.
Tuzel, S. (2010). Corporate Real Estate Holdings and the Cross-section of
Stock Returns Review of Financial Studies, 23, 6, 2268-2302.