incremental progress but no realistic capability · incremental progress but no realistic...
TRANSCRIPT

Incremental Progress but No Realistic Capability Analysis of the Ground-based
Midcourse Missile Defense Test
FTG-15 (May 30, 2017)
Laura Grego
David Wright
January 2018
NATIONAL HEADQUARTERS Two Brattle Square Cambridge, MA 02138-3780 t 617.547.5552 f 617.864.9405
WASHINGTON, DC, OFFICE 1825 K St. NW, Ste. 800 Washington, DC 20006-1232 t 202.223.6133 f 202.223.6162
WEST COAST OFFICE 500 12th St., Suite 340 Oakland, CA 94607-4087 t 510.843.1872 f 510.451.3785
MIDWEST OFFICE One N. LaSalle St., Ste. 1904 Chicago, IL 60602-4064 t 312.578.1750 f 312.578.1751
© 2018 Union of Concerned Scientists
All Rights Reserved
Laura Grego is a senior scientist in the UCS
Global Security Program. David Wright is a
senior scientist and co-director of the UCS
Global Security Program.
The Union of Concerned Scientists puts
rigorous, independent science to work to solve
our planet’s most pressing problems. Joining
with people across the country, we combine
technical analysis and effective advocacy to
create innovative, practical solutions for a
healthy, safe, and sustainable future.
More information about UCS and the Global
Security Program is available on the UCS
website: www.ucsusa.org/nuclear-
weapons#.WkvRvHlG2Hs
This report is available online (in PDF format)
at www.ucsusa.org/MissileDefenseTestFTG15.
ACKNOWLEDGMENTS
Organizational affiliations are listed for
identification purposes only. The opinions
expressed herein do not necessarily reflect those
of the organizations that funded the work or the
individuals who reviewed it. The Union of
Concerned Scientists bears sole responsibility
for the report’s contents.
Analysis of the Ground-Based Midcourse Missile Defense Test FTG-15 (May 20, 2017) 1
Summary
May 30, 2017, marked the first intercept test in nearly three years of the Ground-based Midcourse Defense
(GMD) system, the missile defense system intended to protect the United States from intercontinental ballistic
missiles. The test, designated FTG-15, was declared successful in its primary and secondary objectives. This
brings the GMD’s intercept test record to four successes in ten attempts since its December 2004 deployment, and
its second success in the last five attempts.
The test appears to have demonstrated that the new CE-II Block 1 kill vehicles and the upgraded C2 booster
worked. It also tested the system against a longer-range target than previous GMD tests. In the post-test press
conference, the director of the Missile Defense Agency (MDA) said that the target “flew at a higher altitude and a
longer range and a higher velocity than any other target we've flown to date.” The publicly available data seem to
support this claim.
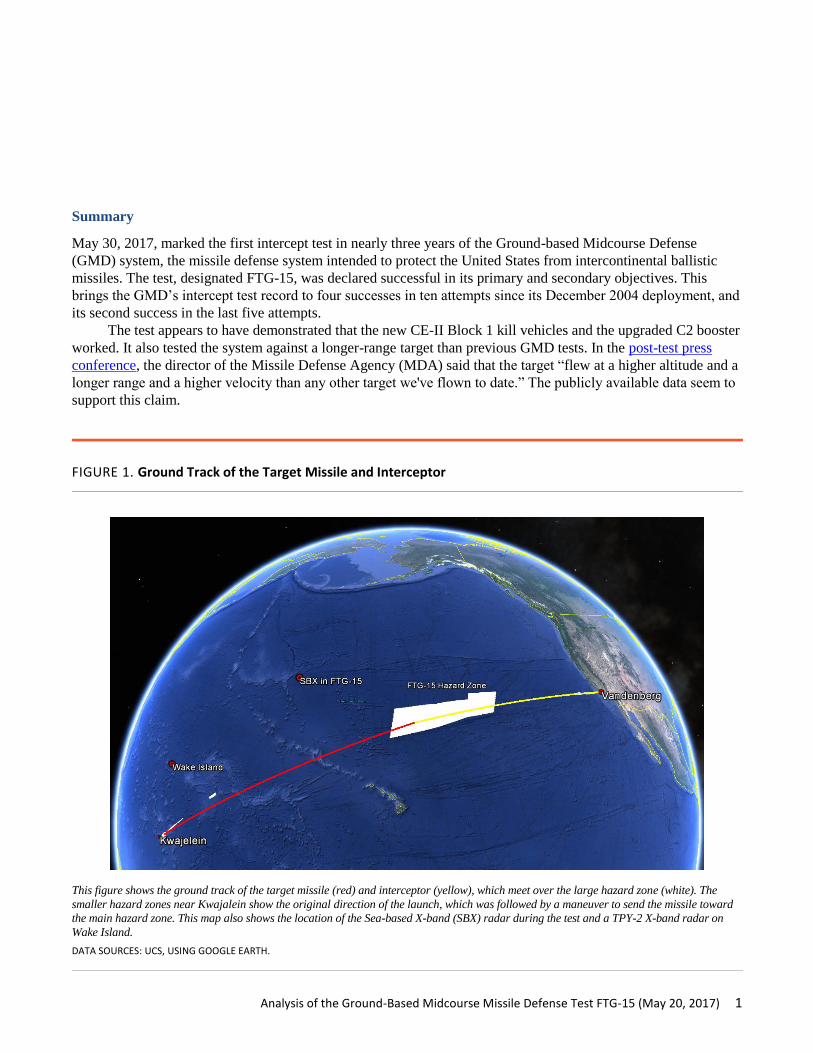
FIGURE 1. Ground Track of the Target Missile and Interceptor
This figure shows the ground track of the target missile (red) and interceptor (yellow), which meet over the large hazard zone (white). The
smaller hazard zones near Kwajalein show the original direction of the launch, which was followed by a maneuver to send the missile toward
the main hazard zone. This map also shows the location of the Sea-based X-band (SBX) radar during the test and a TPY-2 X-band radar on
Wake Island.
DATA SOURCES: UCS, USING GOOGLE EARTH.

2 UNION OF CONCERNED SCIENTISTS
While the Office of the Director of Operational Test and Evaluation upgraded its assessment of the GMD
system on June 6 to reflect this successful intercept, it did so with important caveats. In particular, it notes that the
capability the system demonstrated was against a small number of missiles with only simple countermeasures,
and when using its full sensors and command and control architecture. These conditions may well not apply in a
real-world attack.
The MDA director also said the test “actually replicated … an operational scenario that we're concerned
about” in which North Korea fires a missile at the United States. However, the scenario it seems to represent, an
attack on targets in Alaska, is an unlikely one, for reasons discussed below. Moreover, the test conditions appear
to have been simplified in important ways that enhanced the test’s chance of success instead of challenging the
system to work in a realistic way.
What Does the Timing and Geometry of the Test Tell Us?
In this test, the target missile was launched from the Kwajalein test complex and the interceptor was launched
from the Vandenberg Air Force Base test silo in California (Figure 1).
Prior to the test, the United States released Notices to Mariners that indicated hazard zones east of
Kwajalein Atoll, west of Vandenberg Air Force Base, and an area northeast of Hawaii. These appeared to
correspond to drop zones for rocket stages related to the launches of the target and the interceptor, and the debris
associated with the intercept of the target (or splashdown of the target and interceptor if the test was
unsuccessful.) Those areas are indicated by the white boxes in Figure 1.
RANGE OF THE TARGET
In testimony to the House a week after the test, MDA Director Vice Admiral James Syring said that the
intercept took place about 3,200 kilometers (km) (2,000 miles) west of California. That is consistent with the
FIGURE 2. Estimated Geometry of FTG-15
Estimated geometry of FTG-15 based on publicly released information (see Appendix for details).
Analysis of the Ground-Based Midcourse Missile Defense Test FTG-15 (May 20, 2017) 3
large hazard zone in Figure 1, and puts the intercept in the western side of the zone. The eastern edge of the
hazard zone is about 5,800 km (3,600 miles) from the target’s launch site; this defines the maximum range of the
test missile, which must fit within the hazard zone. Intercontinental-range ballistic missiles (ICBMs) are defined
by the Department of Defense to be those with range greater than 5,500 km. The test missile, with a maximum
range of 5,800 km, is thus in the low end of those considered intercontinental range. So, from the available
evidence, the claim that FTG-15 included an “ICBM-range target” is credible.
Director Syring also claimed that the target used in FTG-15 was the longest range target the GMD system
has faced. While a study of all 18 GMD tests is beyond the scope of this work, we did construct the hazard zone
for the last successful GMD test, FTG-06b in June 2014. For the target missile, which was launched from
Kwajalein Atoll, to fall in the hazard zone, the missile range must have been between 3,000 km (the distance of
the western edge of the zone from Kwajalein) and 4,300 km (the distance of the eastern edge of the zone from
Kwajalein).
The target missile for FTG-15, with a maximum range of about 5800 km, is therefore longer range. It is
important to note that a missile with a range of 5,800 km could not reach the contiguous United States from North
Korea. A missile with a range of 3,000 km could not reach Guam from North Korea.
CLOSING SPEED OF THE INTERCEPT
Using publicly available information about the location and timing of the events of the test, we can estimate
the relative angle and speed of the interceptor and target during the test (see Figure 2).
Figure 2 shows that the angle between the velocities of the interceptor and target missile at intercept is
about 152 degrees, where 180 degrees would be entirely head-on (this assumes the two trajectories lie roughly in
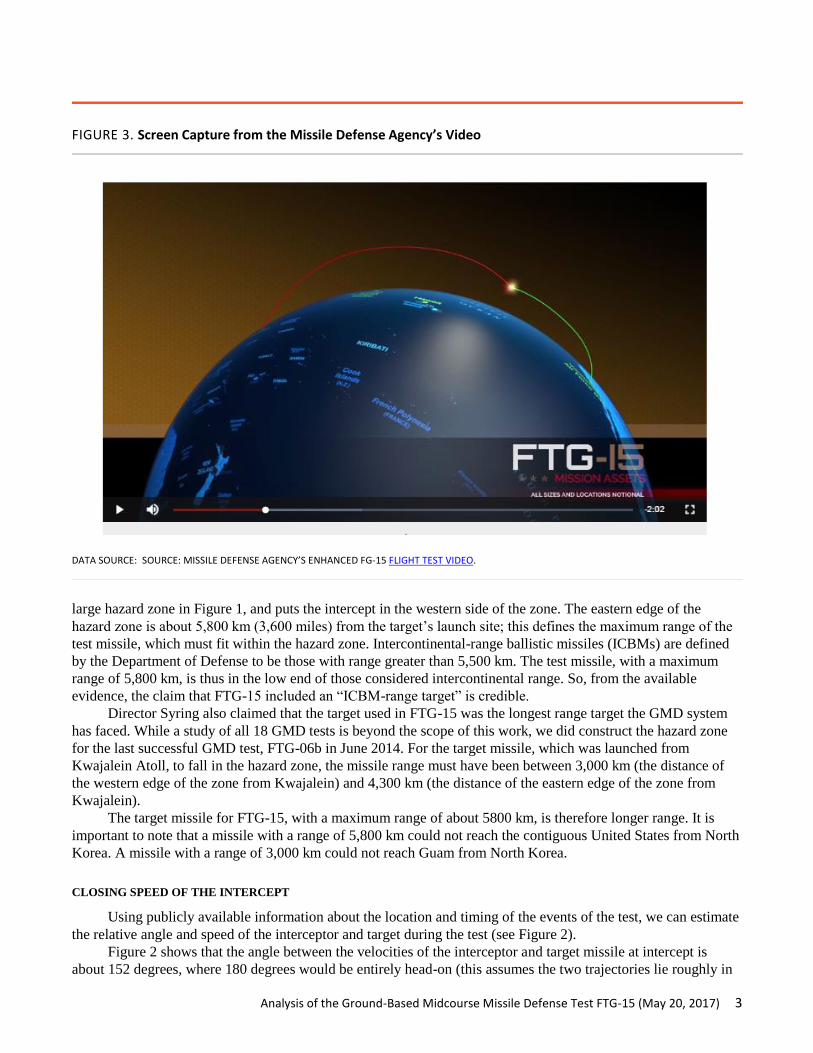
FIGURE 3. Screen Capture from the Missile Defense Agency’s Video
DATA SOURCE: SOURCE: MISSILE DEFENSE AGENCY’S ENHANCED FG-15 FLIGHT TEST VIDEO.

4 UNION OF CONCERNED SCIENTISTS
the same plane, as indicated in Figure 1). The intercept occurs when both the target and interceptor have already
reached their peak altitude and are headed back down to earth; this configuration is used in tests to minimize the
amount of persistent space debris produced by the collision.
The closing speed is the relative speed of the two objects, which is the speed you would see the target
traveling toward you if you were riding on the kill vehicle. In this geometry, the closing speed of the intercept is
about 10.0 km/s (22,000 miles per hour) (see Appendix for details).
Figure 2 is consistent with the notional intercept geometry from the video released by the Missile Defense
Agency after the test. A screen capture from the video (Figure 3) and the hazard zones (Figure 1) are both
consistent with an intercept without a large crossing angle, with both interceptor and target past apogee, meaning
they are both on their way down.
Was the Test an “Exact Replica” of a North Korean Missile Scenario and Was It Realistic?
Director Syring claimed that FTG-15 was an “exact replica” of “an operational scenario that we're concerned
about.” This is not supported by the evidence.
At the post-test press conference, Vice Adm. Syring stated that:
Although this was a developmental test, this is exactly the scenario we would expect to occur during an
actual operational engagement. …It actually replicated—without going into classified details—an
operational scenario that we're concerned about.
He reiterated the point in his congressional testimony:
The scenario that we conducted was actually an exact replica of the scenario that this country would face if
North Korea were to fire a ballistic missile against the United States. We have TPY-2 radars in Japan. We
have our radar in Alaska. And we have a homeland defense system in Alaska as well. So, what we did is move that scenario south and put a TPY-2 on Wake Island, a sea-based expand radar
northwest of Hawaii, and shot an interceptor out of Vandenberg, which just, you know, 1,000 or 2,000 miles
south, replicated what the war fighter would face in real time… I would actually argue the scenario that we
conducted was maybe more operationally realistic than not. We only fired one interceptor and the war
fighter in a real world scenario will fire more.
TABLE 1. Missile Ranges on Maximum Range Trajectories and Related Missile Burnout Speeds
Missile range
(miles)
Missile range
(km)
Burnout speed
(km/s)
3,400 5,500 5.8 Lower range of ICBM
3,600 5,800 5.9 Upper range of target in this test;
North Korea-Fort Greely, AK distance
4,650 7,500 6.3 North Korea-Hawaii
5,800 9,300 6.7 North Korea-Los Angeles, CA
6,750 10,850 7.0 North Korea-Washington DC
Analysis of the Ground-Based Midcourse Missile Defense Test FTG-15 (May 20, 2017) 5
Two claims bear closer examination. The first is that the test was an “exact replica” of an attack the United
States is concerned about, simply moved south. The second is that the test was “more operationally realistic than
not.”
WAS THE TEST AN “EXACT REPLICA” OF A REAL-WORLD SCENARIO?
Was the scenario realistic? The first question to ask is whether this test featured a relevant real-world scenario.
The analysis above indicates the test was a near head-on interception of a 5,800 km missile. While a missile of
this range is technically an ICBM-range missile, launched from North Korea it could not reach the contiguous
United States nor Hawaii. The only US state such a missile could reach is Alaska (see Table 1).
The distance from North Korea to Fort Greely, Alaska, where most of the GMD interceptors are located, is
5,800 km. Moreover, since the missiles would be flying toward the location where the interceptors are launched,
an intercept would be essentially head-on. This therefore appears to be the scenario Director Syring was referring
to (see Figure 4).
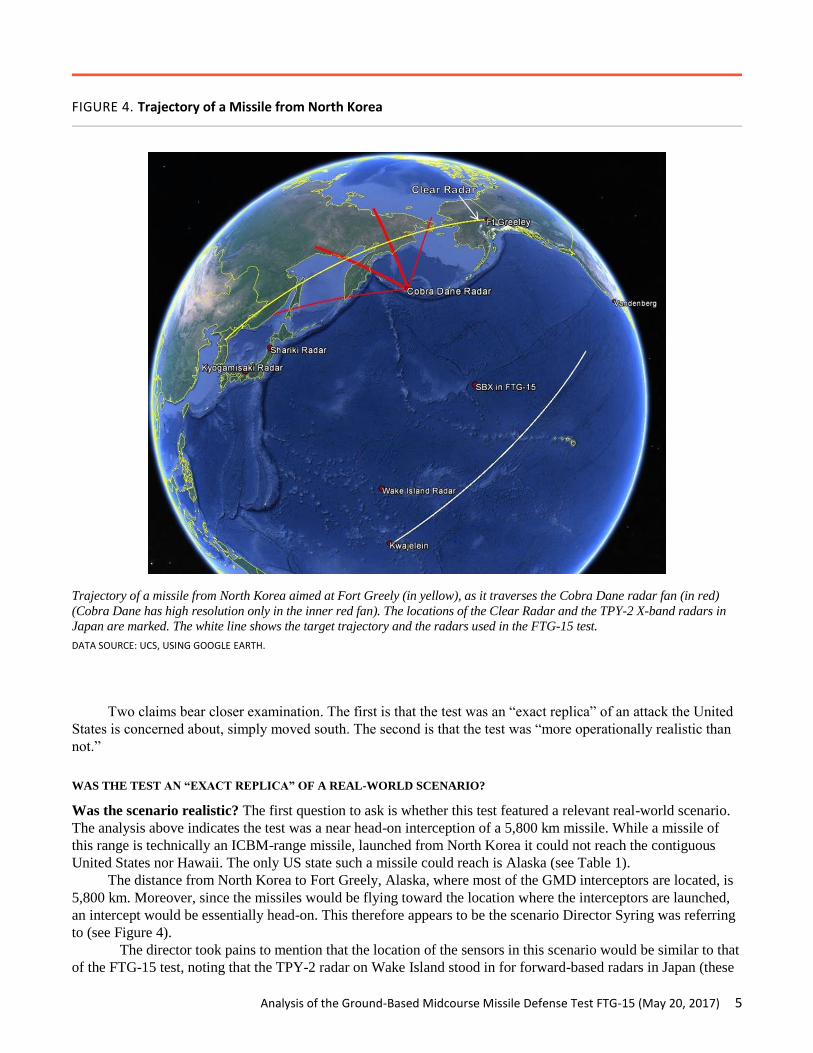
The director took pains to mention that the location of the sensors in this scenario would be similar to that
of the FTG-15 test, noting that the TPY-2 radar on Wake Island stood in for forward-based radars in Japan (these
FIGURE 4. Trajectory of a Missile from North Korea
Trajectory of a missile from North Korea aimed at Fort Greely (in yellow), as it traverses the Cobra Dane radar fan (in red)
(Cobra Dane has high resolution only in the inner red fan). The locations of the Clear Radar and the TPY-2 X-band radars in
Japan are marked. The white line shows the target trajectory and the radars used in the FTG-15 test.
DATA SOURCE: UCS, USING GOOGLE EARTH.
6 UNION OF CONCERNED SCIENTISTS
radars are in Shariki and Kyogamisaki provinces), and that there was a radar in the test that stood in for Alaskan
radars (Figure 4).
The MDA had some flexibility to position sensors for the test. In the May 30 test, the Sea-based X-band
radar (SBX) position, as indicated by a Notice to Airmen issued by the Federal Aviation Administration, was
about 1300 km from the target’s flight path, with the nearest pass to the flight path coming at about 3000 km after
launch, or about at apogee. This is similar to the relationship of the Cobra Dane radar on Alaska’s Shemya Island
to a trajectory from North Korea to Fort Greeley, which would be about 1,100 km from the trajectory at its closest
point. While the Cobra Dane radar would be in position to provide data for a trajectory from North Korea to
Alaska, it is not well-placed to provide tracking data for the more likely launch paths from North Korea to Hawaii
or Los Angeles, since it is a fixed radar that was built to observe Soviet missile tests and therefore looks in the
wrong direction to see these trajectories.
The FTG-15 test appears to mimic in some ways an interception of a missile from North Korea headed
toward Alaska—it is a head-on engagement of a missile that is roughly the right range and at similar closing
speeds, and the radars are in a similar place, giving similar information. The parameters aren’t precisely the same:
In the North Korea-Fort Greely geometry, the interceptor would be traveling a shorter distance to the intercept
point, and would be flying up the incoming trajectory (Figure 5).
Is this an operational scenario MDA should be concerned about? Director Syring’s assertion,
however, that this is an exact replica of a real-world scenario of concern seems unlikely. For the scenario in
Figure 5, the targets would appear to be either the silos for the GMD interceptors; the Upgraded Early Warning
radar at Clear, Alaska, or the Long Range Discrimination Radar planned for that site; or possibly the city of
Anchorage.
Such an attack is possible, but would have little value. The inaccuracy of a long-range North Korean
missile, which is likely tens of kilometers, makes using long-range missiles—even nuclear-armed—an ineffective
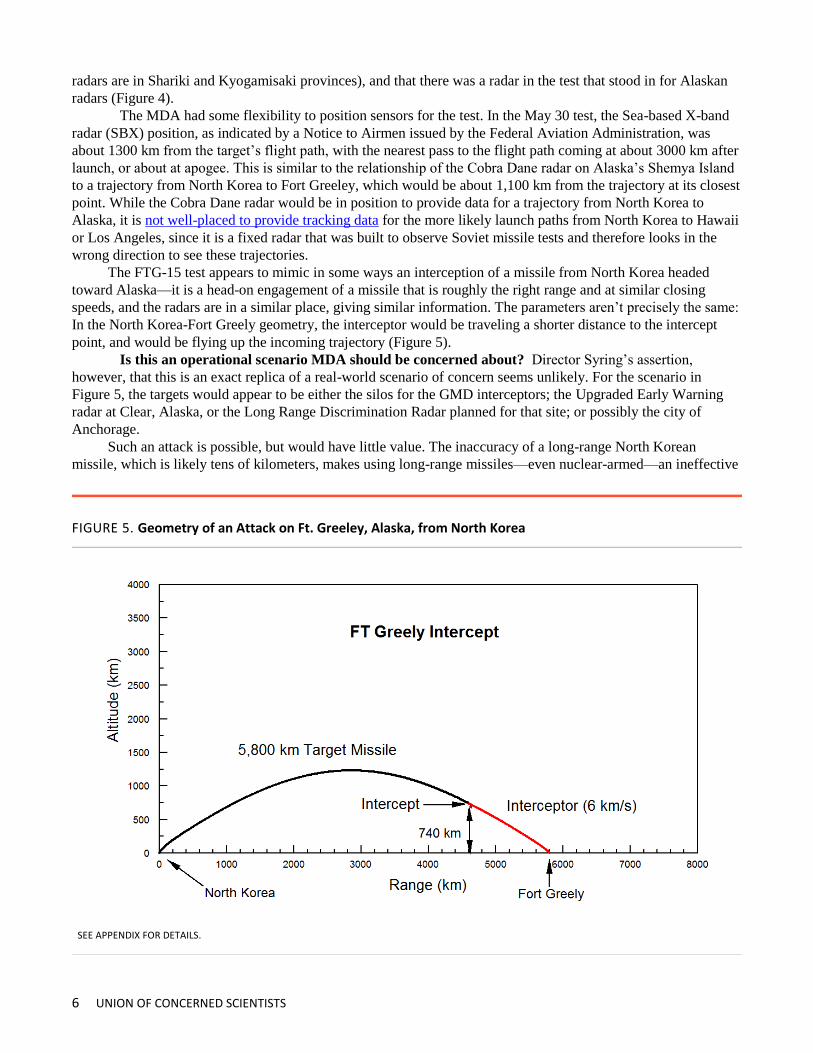
FIGURE 5. Geometry of an Attack on Ft. Greeley, Alaska, from North Korea
SEE APPENDIX FOR DETAILS.

Analysis of the Ground-Based Midcourse Missile Defense Test FTG-15 (May 20, 2017) 7
way to attack relatively small targets like these, and therefore makes this an unlikely scenario.
The inaccuracy of North Korea’s missiles stems both from guidance and control errors during boost phase
and unpredictable atmospheric forces during reentry. The latter will remain large even as the guidance and control
system improves.
For example, consider a case in which North Korea is able to launch a 5,800 km-range missile carrying a
150 kiloton nuclear warhead—a yield consistent with its most recent nuclear test—and that its missile accuracy is
an optimistic 10 km.
Suppose the missile targeted the GMD interceptors, which are arranged in an area with a radius a bit less
than a kilometer and are expected to be at least moderately hardened to a nuclear blast. The probability that the
weapon could compromise all the interceptors is less than 1% (see Appendix).
A “softer” target—for example, the Upgraded Early Warning radar at Clear, AK, or the Long Range
Discrimination Radar planned for that site—would be modestly more vulnerable to an inaccurate missile. Even
so, the probability that this North Korean nuclear missile could destroy the radar is less than 10%. If the accuracy
was poorer, say 20 km, the probability that the radar would be compromised is about 2%. The results are similar if
the target is Anchorage (see Appendix).
The types of missiles that North Korea is likely to be able to field for the foreseeable future are not suited
for relatively small targets. Thus, the scenario of a missile attack on Alaska seems like an unlikely operational
scenario for MDA to be concerned about.
Was the defense set up as it would be in a real engagement? The GMD tests are done over the open
ocean for safety reasons, quite a bit south of the very northerly path a North Korean missile launch would follow.
In a real engagement of a North Korean missile of such range, the missile would be detected by infrared satellite
sensors, then one or both forward-based TPY-2 X-band radars based in Shariki and Kyogamisaki, Japan. These
radars would cue the Upgraded Early Warning Radar system. In this case, the relevant radars would be the
Upgraded PAVE PAWs radar at Clear, Alaska, and the Upgraded Cobra Dane radar at Shemya, Alaska; both
radars operate at lower frequency (UHF and L-band, respectively) than X-band radars. The interceptor would be
launched from Fort Greeley, Alaska.
For FTG-15, the Sea-based X-band radar (SBX) was positioned north of Hawaii, and a TPY-2 radar was
installed on Wake Island. In his May 31 press conference, Director Syring stated:
OK, so if you think about where we test, we test in basically the eastern two-thirds of the Pacific where we
don't have TPY-2, the Japan radar coverage that we would use against a country like North Korea
for detection. So the radars that we used was a TPY-2 on the Kwajalein Atoll—on Wake Island, I'm sorry,
not Kwajalein, on Wake. And then the SBX to replicate and—I'm being very careful here—to facilitate the
execution of the test.
If it was an operational scenario the TPY-2s in Japan would play heavily in that. The radar in Alaska today
at Clear would play heavily into the intercept solution. And the overhead sensors as well. So what we did in
the construct of the test since we don't have—we're much further south and much further east than where
we have radar coverage, that's the purpose of having a TPY-2 on Wake and the SBX there to facilitate the
testing and the way the test was outlined.
The Kyogamisaki and Shariki radars are 800 to 900 km from a trajectory from North Korea to Alaska,
though they would be further from a trajectory to the US east coast, and closer to a trajectory to the US west
coast. The Shariki radar is about 700 km further along the trajectory than the Kyogamisaki radar. The Cobra Dane
radar is 1,100 km from this trajectory and 3,000 km further along the trajectory than the Shariki radar, and the
radar at Clear is more than 5,000 km from Shariki.
The Wake Island TPY-2 was positioned around 1,000 km from the test trajectory, and the SBX was about
1,300 km from it. The SBX was 2,700 km further down the trajectory than the Wake Island radar, indicating that
the SBX played the role of the upgraded early warning radar used to track the target. It should be noted that X-
8 UNION OF CONCERNED SCIENTISTS
band radar data from the SBX provides significantly higher resolution than either of the Cobra Dane and Clear
radars. These two radars have resolutions of greater than one and five meters, respectively, and so cannot see fine
details that might help discriminate target warheads from simple countermeasures. Thus, it is important to note
that the SBX could provide both tracking data and detailed data that could help with discrimination, but the Cobra
Dane and Clear radars, which it substituted for in this test, could not.
The careful positioning of the sensors is an important point. The June 6, 2017, assessment by the Director of
Operational Testing and Evaluation (DOT&E) of the GMD system following the FTG-15 test said:
GMD has demonstrated capability to defend the U.S. Homeland from a small number of intermediate-
range or intercontinental ballistic missile threats with simple countermeasures when the Homeland
Defense BMDS employs its full sensors/command and control architecture.” (emphasis added).
The SBX was originally built as a test asset and has a number of operational limitations. It is not normally
located where it could contribute to the intercept of a North Korean missile aimed at the United States.
WAS THE TEST “MORE OPERATIONALLY REALISTIC THAN NOT”?
An analysis of the engagement shows that several important aspects of the test were not operationally realistic.
Target was not wobbling or tumbling. In his press conference, Director Syring said the goal of the test:
… was to replicate a threat missile from a country like Iran and a re-entry vehicle in terms of its
performance and how it flies…
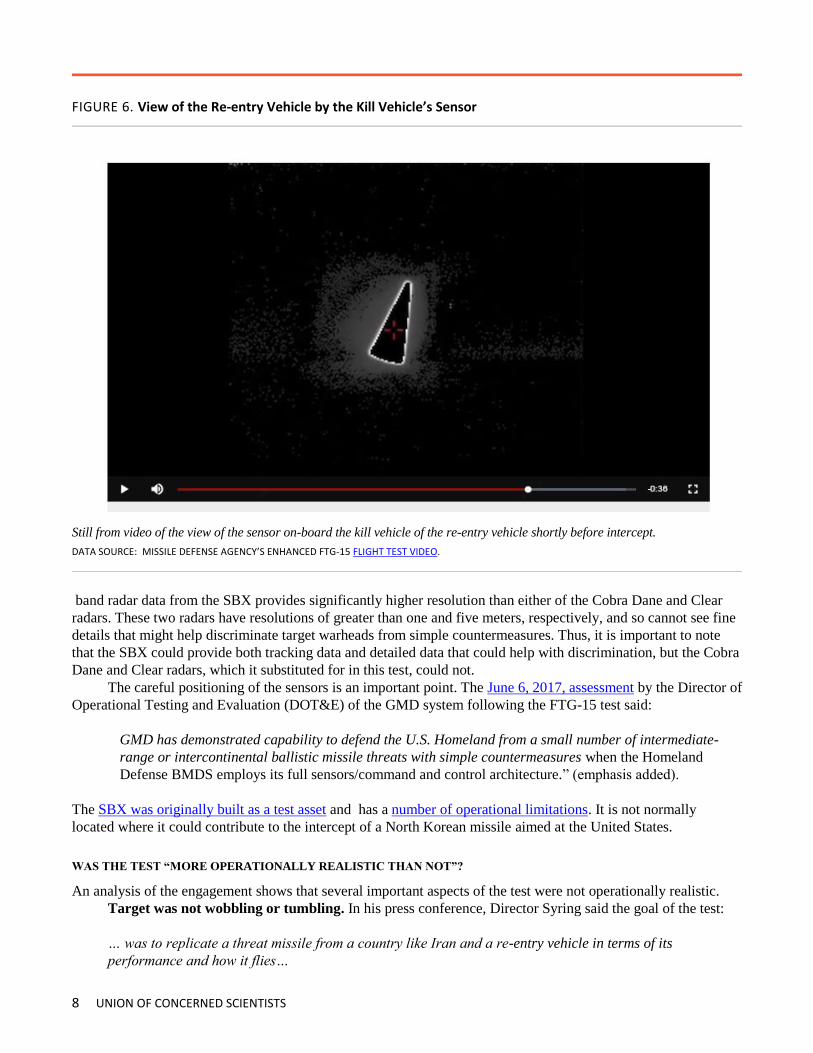
FIGURE 6. View of the Re-entry Vehicle by the Kill Vehicle’s Sensor
Still from video of the view of the sensor on-board the kill vehicle of the re-entry vehicle shortly before intercept.
DATA SOURCE: MISSILE DEFENSE AGENCY’S ENHANCED FTG-15 FLIGHT TEST VIDEO.

Analysis of the Ground-Based Midcourse Missile Defense Test FTG-15 (May 20, 2017) 9
The post-test video released by the MDA includes a view of the target complex (the target re-entry vehicle
and other objects in view) from the sensor on the kill vehicle for the last few seconds before intercept. It is clear
from the video that considerable care has been taken to stabilize the re-entry vehicle to minimize any wobbling or
other movement of the re-entry vehicle. Thus, it presents a very stable target for the sensor to home on (Figure 6).
In an actual attack, however, a re-entry vehicle released by a North Korean missile may be wobbling
significantly or even tumbling. In that case the kill vehicle’s sensor would see a fluctuating infrared signal, which
would make the homing process more difficult.
Stabilizing the target makes the intercept more likely to succeed, but also makes the test less stressing and
less realistic. Since a wobbling or tumbling re-entry vehicle presents a more difficult target, North Korea may
choose not to stabilize the warhead even if that reduces the accuracy of its targeting. It could also decide not to
separate the re-entry vehicle from the final stage of the missile. In that case the kill vehicle would see a longer
object than expected, which could cause the kill vehicle to aim for a point behind the re-entry vehicle itself, so
that a collision would not destroy the warhead.
Ensuring that the kill vehicle hits the correct spot on the target is important for a successful intercept; in the
2006 intercept test FTG-02, the kill vehicle was able to hit the target, but failed to destroy it. Instead the test was
described as a “glancing blow” by the director of Operational Test and Evaluation.
Further, in the post-test press conference, Director Syring stated that the Missile Defense Agency would
“analyze the lethality data over the next 30 days and literally we've got to get down to determining within which
centimeter on the RV did it hit.”
No GMD intercept tests to date have been done against a tumbling warhead.
Lighting conditions not varied from past tests. In FTG-15, the timing and geometry was such that the
target re-entry vehicle was illuminated by the sun, which was positioned behind the kill vehicle. This condition
has been the same for all intercept tests save one, and for all of those that were successful. Because the kill vehicle
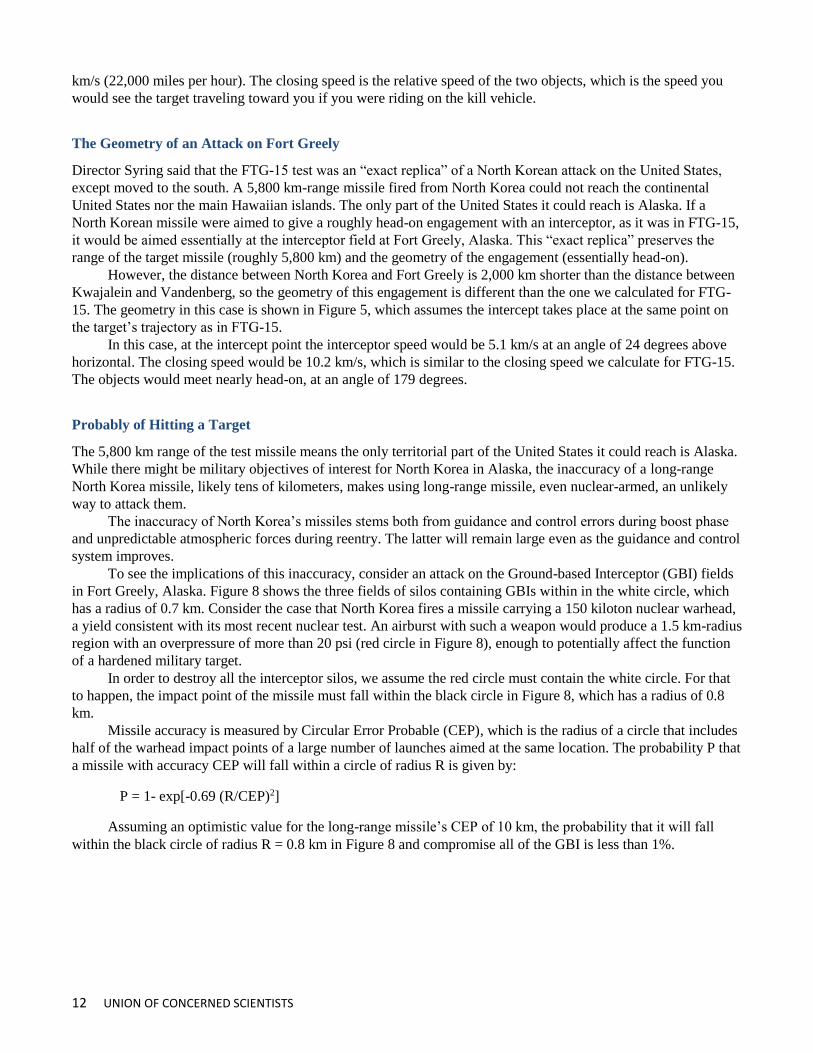
FIGURE 7. Objects in the Target Cluster of FTG-15
Figure 7a. (1:30 into video, rotated Figure 7b (2:05 into video) 180 degrees)
Objects in the target cluster of FTG-15 seen by the IR sensor on the kill vehicle (left) and by a sensor on a second platform
(right).
DATA SOURCE: MISSILE DEFENSE AGENCY’S ENHANCED FTG-15 FLIGHT TEST VIDEO.
10 UNION OF CONCERNED SCIENTISTS
failed to separate from the booster in the only test with a nighttime interceptor launch, IFT-10, no data could be
collected under those different lighting conditions. It is fully possible, perhaps even likely, that an adversary
would choose to launch when the target was lit from a different angle or when the kill vehicle would need to look
toward the sun.
In his press conference, Director Syring was asked about this and answered that the test:
… was within the operational envelope of what we would expect.
Yet presumably the “operational envelope” within which an adversary might launch a missile includes a
range of lighting conditions. Director Syring’s response does not contest that the tests have been done under
advantageous conditions nor explain why those are the likely conditions for an attack.
No realistic decoys or countermeasures. The GMD system was designed to defend against a limited threat
and has little capability to defend against more sophisticated threats that include countermeasures such as
lightweight, credible decoys that confuse or overwhelm the defense. The GMD system must try to select the
warhead from among these objects or engage them all. The Pentagon’s Office of Operational Test and Evaluation
considers whether a test includes complex countermeasures as one of the criteria by which it judges the
operational realism of missile defense tests. In its April 2016 missile defense assessment, the DOT&E stated that
“The MDA has not incorporated complex countermeasures into any BMDS testing.”
However, Director Syring implied that the countermeasures in FTG-15 were realistic. In his press
conference he referred to intelligence estimations, though without indicating the source of them:
So our entire test program is based on intelligence forecasts and projections. And where they may be with
re-entry vehicle technology, with countermeasure technology, with rocket motor technology. And we seek to
replicate many of those intelligence projections in the tests that we conduct.
However, MDA’s video of the FTG-15 intercept shows how the target scene looked to the kill vehicle’s
sensor and to a second sensor. In these images, the three objects look very different from one another and are easy
to distinguish.
In the video, the kill vehicle’s infrared sensor sees three objects indicated by the yellow, green, and red
boxes (Figure 7a). All three objects are noticeably different in brightness. Figure 7b is the view from an infrared
sensor on a different platform, showing the lower two objects from Figure 7a. Again it is clear that the upper
object, which is part of the target missile, is much brighter than the target re-entry vehicle (labeled “Target
Warhead”). From this it is clear that the decoy used in the test, which appears to be the object in the yellow square
in the upper right of Figure 7a, looks very different from the re-entry vehicle.
“Discrimination” in this test was straightforward, not challenging in the way a real world adversary would
try to be. The kill vehicle knows what the re-entry vehicle looks like, and it looks significantly different from the
other objects. In a real attack, the defense is unlikely to know precisely how the re-entry vehicle will look to the
kill vehicle’s sensor. Additionally, the attacker could disguise the re-entry vehicle’s signal or arrange to have all
the objects appear similar. As the National Intelligence Council judged in 1999, numerous techniques to do this
would be available to a country capable of building a long-range missile, such as North Korea. A detailed, open-
source look at these is provided in the 2000 Countermeasures report.

Analysis of the Ground-Based Midcourse Missile Defense Test FTG-15 (May 20, 2017) 11
[APPENDIX]
Geometry of the FTG-15 Intercept Test
This section explains how we determined the test geometry discussed above in the text.
In test FTG-15, the target missile was launched from Kwajalein atoll in the mid-Pacific and the interceptor
was launched from Vandenberg Air Force Base in California, 7,800 km (4,850 miles) away.
The United States released notices to aircraft of radar operations, and notices to ships warning of maritime
areas where the test may create hazardous falling debris. Plotting those hazard zones shows the locations of the
Sea-based X-band (SBX) and AN-TPY 2 radars during the test, shows the region where the intercept occurred,
and indicates the trajectory of both missiles. The target missile fired from Kwajalein performed a short dogleg
maneuver shortly after launch so that the two missiles approached each other essentially head on (Figure 1).
The large hazard zone shows where the intercept took place and puts an upper bound on the range of the
target missile. If the intercept were unsuccessful and the target continued on its path intact, it would need to fall
within the hazard zone. That means that the eastern edge of the hazard zone must extend at least as far as the point
where the target missile would splash down. In this case, the edge of the zone is about 5,800 km (3,600 miles)
from Kwajalein, so that is an upper bound for the range of the target missile (see Figure 2).
The Missile Defense Agency said this was the first test against an Intercontinental Ballistic Missile
(ICBM)-class target. ICBMs are defined by the Pentagon as missiles with range greater than 5,500 km (3,400
miles). Since the hazard zone implies the missile had a range of at most 5,800 km, the target was barely ICBM-
class. For the rest of the analysis we assume the range of the target missile was 5,800 km.
In House testimony following the test,1 MDA Director Syring said that the intercept took place 2000 miles
(3,200 km) from Vandenberg Air Force Base, or about 4,600 km (2,850 miles) from Kwajalein (Figure 2). If the
target missile was flown on a standard trajectory (rather than lofted or depressed) for a 5,800 km range, the target
would be at an altitude of about 740 km at the intercept point. It would have a velocity of 5.1 km/s at an angle of
25 degrees below horizontal. Its flight time to this point would be 22.3 minutes (1,340 seconds).
Director Syring also said the interceptor was launched 10 minutes after the target’s launch. That means its
flight time to the intercept point was about 12.3 minutes (740 s). An interceptor that flies to a range of 3,200 km
and an altitude of 740 km in that time would have a burnout speed of about 6 km/s.2 At the intercept point it
would have a speed of 5.2 km/s at an angle of 2.6 degrees below horizontal. (The United States arranges these
tests to have the velocity vectors of both objects pointed toward the Earth to minimize the amount of persistent
orbital debris that the intercept might create.)
In this configuration, the angle between the velocities of the interceptor and target at intercept is about 152
degrees, where 180 degrees would be head-on. With this geometry, the closing speed of the intercept is about 10.0
1 This information comes from the discussion at the hearing:
HANABUSA: Thank you, Mr. Chair. Admiral Syring, I just would like to get an orientation here. So, from the
time—if you can say this in open session—from the time the ICBM was launched from Kwajalein, how long was it
before the Vandenberg interceptor was launched?
SYRING: About 10 minutes.
HANABUSA: Then can you tell me where exactly did they intercept? Was it like close to Hawaii, closer to the West
Coast, closer to the point?
SYRING: It was about 2,000 miles west of California but further to the north of Hawaii. 2 Modeling the interceptor indicates that its maximum speed would be greater than 8 km/s, so it appears to have maneuvered
during boost phase to reduce its speed at burnout. If its speed had been much faster than 6 km/s it would not have been on a
downward trajectory at intercept in this geometry.
12 UNION OF CONCERNED SCIENTISTS
km/s (22,000 miles per hour). The closing speed is the relative speed of the two objects, which is the speed you
would see the target traveling toward you if you were riding on the kill vehicle.
The Geometry of an Attack on Fort Greely
Director Syring said that the FTG-15 test was an “exact replica” of a North Korean attack on the United States,
except moved to the south. A 5,800 km-range missile fired from North Korea could not reach the continental
United States nor the main Hawaiian islands. The only part of the United States it could reach is Alaska. If a
North Korean missile were aimed to give a roughly head-on engagement with an interceptor, as it was in FTG-15,
it would be aimed essentially at the interceptor field at Fort Greely, Alaska. This “exact replica” preserves the
range of the target missile (roughly 5,800 km) and the geometry of the engagement (essentially head-on).
However, the distance between North Korea and Fort Greely is 2,000 km shorter than the distance between
Kwajalein and Vandenberg, so the geometry of this engagement is different than the one we calculated for FTG-
15. The geometry in this case is shown in Figure 5, which assumes the intercept takes place at the same point on
the target’s trajectory as in FTG-15.
In this case, at the intercept point the interceptor speed would be 5.1 km/s at an angle of 24 degrees above
horizontal. The closing speed would be 10.2 km/s, which is similar to the closing speed we calculate for FTG-15.
The objects would meet nearly head-on, at an angle of 179 degrees.
Probably of Hitting a Target
The 5,800 km range of the test missile means the only territorial part of the United States it could reach is Alaska.
While there might be military objectives of interest for North Korea in Alaska, the inaccuracy of a long-range
North Korea missile, likely tens of kilometers, makes using long-range missile, even nuclear-armed, an unlikely
way to attack them.
The inaccuracy of North Korea’s missiles stems both from guidance and control errors during boost phase
and unpredictable atmospheric forces during reentry. The latter will remain large even as the guidance and control
system improves.
To see the implications of this inaccuracy, consider an attack on the Ground-based Interceptor (GBI) fields
in Fort Greely, Alaska. Figure 8 shows the three fields of silos containing GBIs within in the white circle, which
has a radius of 0.7 km. Consider the case that North Korea fires a missile carrying a 150 kiloton nuclear warhead,
a yield consistent with its most recent nuclear test. An airburst with such a weapon would produce a 1.5 km-radius
region with an overpressure of more than 20 psi (red circle in Figure 8), enough to potentially affect the function
of a hardened military target.
In order to destroy all the interceptor silos, we assume the red circle must contain the white circle. For that
to happen, the impact point of the missile must fall within the black circle in Figure 8, which has a radius of 0.8
km.
Missile accuracy is measured by Circular Error Probable (CEP), which is the radius of a circle that includes
half of the warhead impact points of a large number of launches aimed at the same location. The probability P that
a missile with accuracy CEP will fall within a circle of radius R is given by:
P = 1- exp[-0.69 (R/CEP)2]
Assuming an optimistic value for the long-range missile’s CEP of 10 km, the probability that it will fall
within the black circle of radius R = 0.8 km in Figure 8 and compromise all of the GBI is less than 1%.

Analysis of the Ground-Based Midcourse Missile Defense Test FTG-15 (May 20, 2017) 13
Another potential target could be the radar at Clear, Alaska, which is 200 km west of Fort Greely. The radar
is less robust than missile silos, and so in this case, we assume the lethal overpressure is 5 psi. For a 150 kiloton
warhead in an airburst, the 5 psi radius is 3.7 km. In this case the probability that a missile with a CEP of 10 km
could destroy its target is less than 10%. If the accuracy of the incoming missile was poorer, say with a CEP of 20
km, the probability that the radar would be compromised is about 2%.
Similarly, if the target was the city of Anchorage, which is 400 km southwest of Fort Greely, the probability
that the 5 psi circle would fall within the roughly 8 km radius of the main part of the city is about 12% for a CEP
of 10 km and 3% for a CEP of 20 km.
FIGURE 8. The Ground-based Midcourse System Interceptor Fields
Three fields of silos contain interceptors within in the white circle, which has a radius of 0.7 km. The red circle, with radius 1.5 km, represents
the area with sufficient pressure from a 150 kT nuclear burst to compromise hardened military targets, if the burst is at the center of the red
circle.
DATA SOURCE: UCS, USING GOOGLE EARTH.