impact of human resource investment on labor productivity
TRANSCRIPT
Impact of Human Resource Investment on Labor
Productivity in Indonesia
Roziana Baharin1, Rizqon Halal Syah Aji2, Ishak Yussof 1, Nasir Mohd Saukani1
1. Faculty of Economics & Management, Universiti Kebangsaan Malaysia, Bangi, Malaysia 2. Faculty of Economics and Business, Syarif Hidayatullah State Islamic University, Jakarta, Indonesia
(Received: April 30, 2019 ; Revised: August 23, 2019 ; Accepted: September 21, 2019)
Abstract This study examines the impact of human capital on productivity of labor in
Indonesia, using the ARDL analysis data method. This study uses the variable of
human capital with a proxy level of labor education, the health status of labor and
labor productivity. The data used are sourced from World Bank publications in the
period of 1981-2014. The outputs of the analysis with the method of ARDL show
that the short-run analyses of primary, secondary, tertiary education variables and
health variables have a significant positive impact on labor productivity. In contrast,
the long-run analysis including only primary and secondary educations showed a
significant positive influence on labor productivity while tertiary education variables
have a significant negative effect. The labors’ health variable has a positive but not
significant effect. This shows that the quality of human capital in Indonesia is still a
problem for labor productivity.
Keywords Human capital, Education, Health, Labor productivity, ARDL.
Corresponding Author, Email: [email protected]
Iranian Journal of Management Studies (IJMS) http://ijms.ut.ac.ir/
Vol. 13, No. 1, Winter 2020 Print ISSN: 2008-7055
pp. 139-164 Online ISSN: 2345-3745 Document Type: Research Paper DOI: 10.22059/ijms.2019.280284.673616
140 (IJMS) Vol. 13, No. 1, Winter 2020
Introduction Human capital is a never-exhausted issue experienced by all
developing countries, including Indonesia. As a country, developing
Indonesia requires an adequate quality of human resources; of course,
human resources that are skillful and ready to welcome development
need standards. If human resources are well-managed, Indonesia will
become a country full of qualified labor. However, if not, Indonesia
has to bear a population burden. High-quality labor will increase labor
productivity and to have a high productivity, workers should have
high skills and knowledge along with healthy physical and mental
conditions (Schultz, 1961; Becker, 1962).
The important factors of human capital include education and health
conditions. Many economists present the results of their research on
human capital that said human capital is the key to a nation's economic
accretion and it is even the key to the success of the development. Two
aspects of human capital that are often discussed are the education and
health quality. In the view of contemporary economists such as Schultz
(1961), Becker (1965) and Uzawa (1965), education and health are
important aspects in developing human resources.
According to the economists above, two things encourage the
workforce to have high productivity. The first is qualified education and
skills. The second is good physical and mental health of workers, which
is very influential on the performance of workers in carrying out work
tasks. The good conditions of workers' health make productivity
increase. In addition, workers who are equipped with high education
and skills and have good physical health will easily adapt to new
technologies, compared to workers who are low educated and
physically unwell. High productivity will have an impact on wages
gained by workers to fulfill their personal and family welfare.
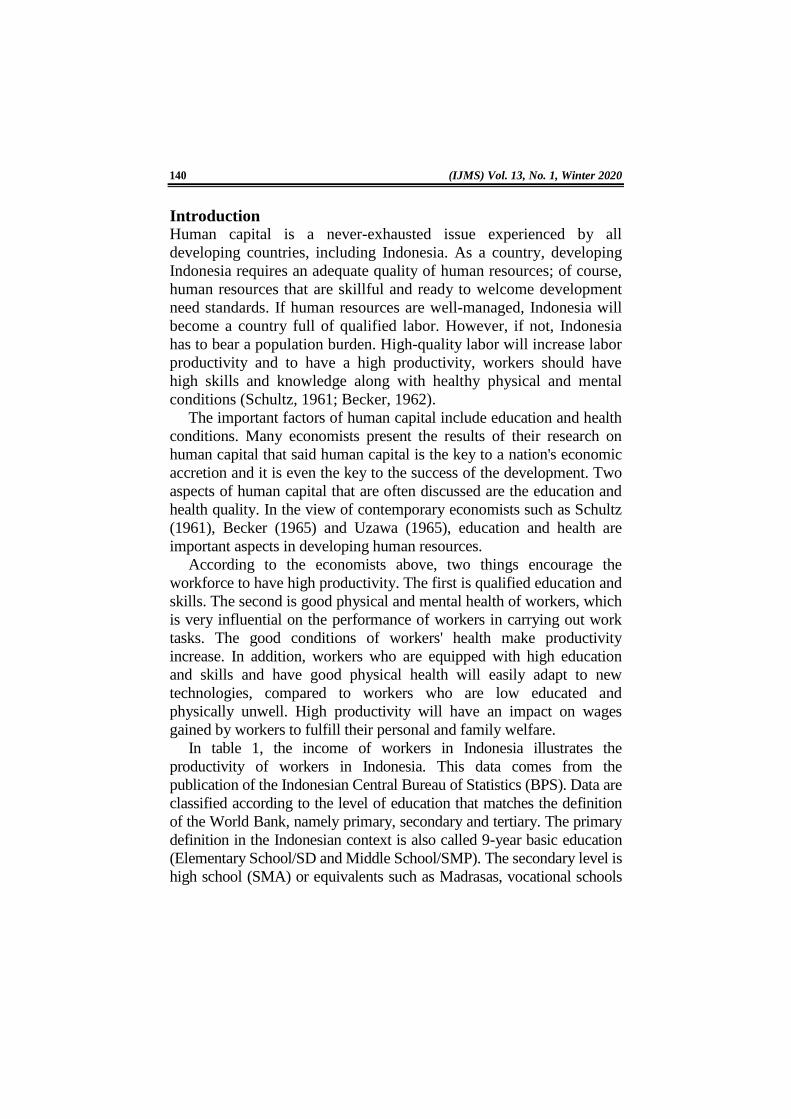
In table 1, the income of workers in Indonesia illustrates the
productivity of workers in Indonesia. This data comes from the
publication of the Indonesian Central Bureau of Statistics (BPS). Data are
classified according to the level of education that matches the definition
of the World Bank, namely primary, secondary and tertiary. The primary
definition in the Indonesian context is also called 9-year basic education
(Elementary School/SD and Middle School/SMP). The secondary level is
high school (SMA) or equivalents such as Madrasas, vocational schools
Impact of Human Resource Investment on Labor Productivity in Indonesia 141
or public schools. The tertiary level is university or equivalents such as a
diploma or graduate. The data does not mention the classification of
secondary or high education whether it is vocational or not.
Table 1. Average hourly wage of a worker in different education groups
Education
Group
Average hourly wages (Rupiah)
Year
2015 2016
<=Elementary School 8,662.10 8,198.60
Junior High School 7,663.97 9,256.70
Senior High School 10,849.48 13,441.84
Graduate 21,574.08 25,073.97 Source: Central Bereau of Statistics, Indonesia, 2018
Table 1 provides a simplistic explanation that the hourly average
income of workers in Indonesia is still categorized as low compared to
the minimum wage of neighboring countries such as Malaysia, which
has a minimum wage of 4.2 million rupiahs, equivalent to RM 1200,
even the Philippines at 3.8 million pesos, equivalent to US $ 256.
Indonesia strives to develop the human resources’ quality
continuously by investing in education and health, and continues to focus
and be consistent in meeting the basic needs of its people such as
adjusting the costs of education and health to be more affordable to its
people. In addition, the Indonesian government has also made efforts to
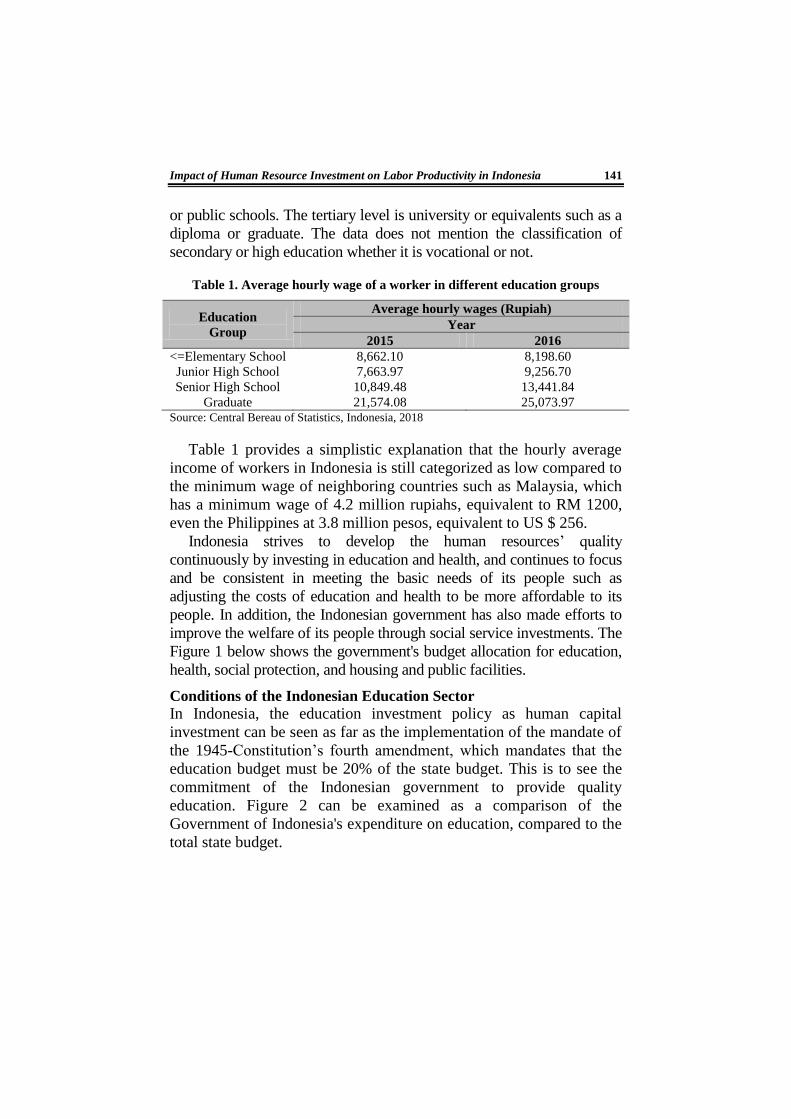
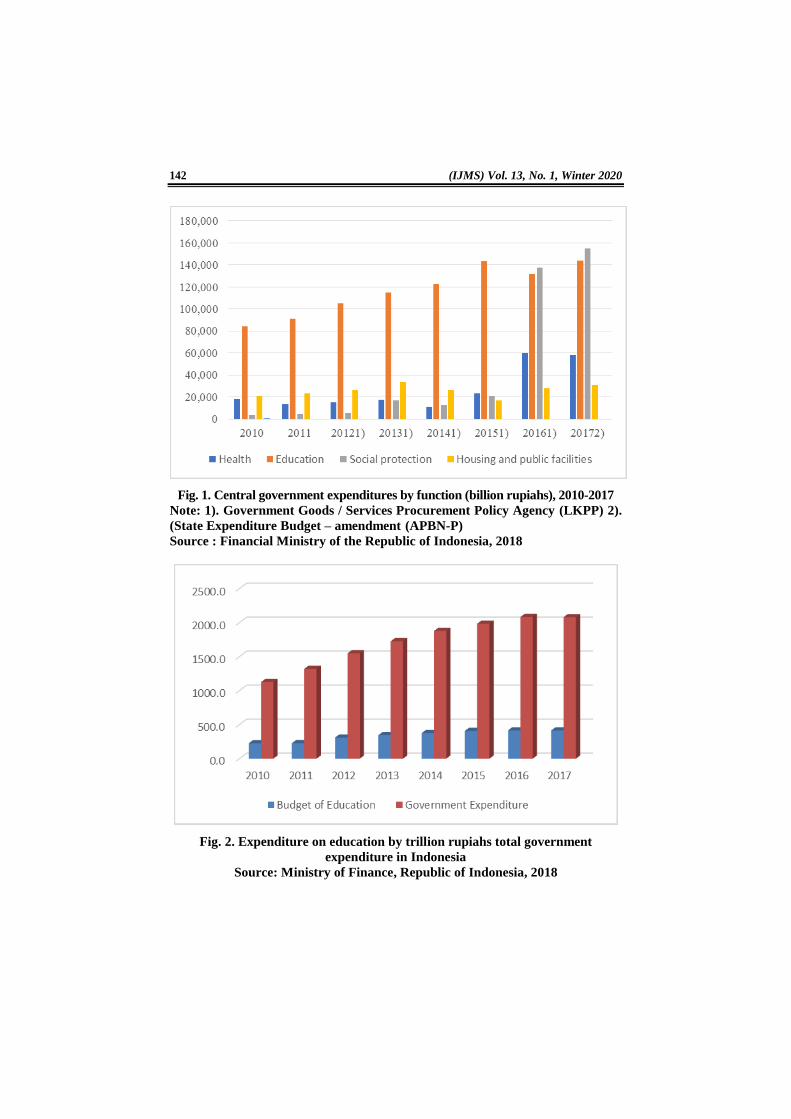
improve the welfare of its people through social service investments. The
Figure 1 below shows the government's budget allocation for education,
health, social protection, and housing and public facilities.
Conditions of the Indonesian Education Sector
In Indonesia, the education investment policy as human capital
investment can be seen as far as the implementation of the mandate of
the 1945-Constitution’s fourth amendment, which mandates that the
education budget must be 20% of the state budget. This is to see the
commitment of the Indonesian government to provide quality
education. Figure 2 can be examined as a comparison of the
Government of Indonesia's expenditure on education, compared to the
total state budget.
142 (IJMS) Vol. 13, No. 1, Winter 2020
Fig. 1. Central government expenditures by function (billion rupiahs), 2010-2017
Note: 1). Government Goods / Services Procurement Policy Agency (LKPP) 2).
(State Expenditure Budget – amendment (APBN-P)
Source : Financial Ministry of the Republic of Indonesia, 2018
Fig. 2. Expenditure on education by trillion rupiahs total government
expenditure in Indonesia
Source: Ministry of Finance, Republic of Indonesia, 2018
Impact of Human Resource Investment on Labor Productivity in Indonesia 143
Indonesian government’s spending on education is programmed in
schools without a levy. The school education program without levies
in Indonesia has been running for 13 years since the policy was
introduced. The aim of the Indonesian government in implementing
education policies without levies is to open access to all school-aged
children to get a good education.
What are the implications of policy implementations? The Indonesian
Central Bureau of Statistics defines the Net Enrollment Rate (NER). This
figure represents the percentage of the population in certain groups of
age, who are still attending school, to the population in that group.
According to 2017 Central Bureau of Statistics (BPS), the net enrollment
rate showed a percentage of 97.14 percent in elementary schools (SD),
78.30 percent in junior high schools (SMP) and 60.19 percent in high
schools (SMA) and vocational high schools (SMK).
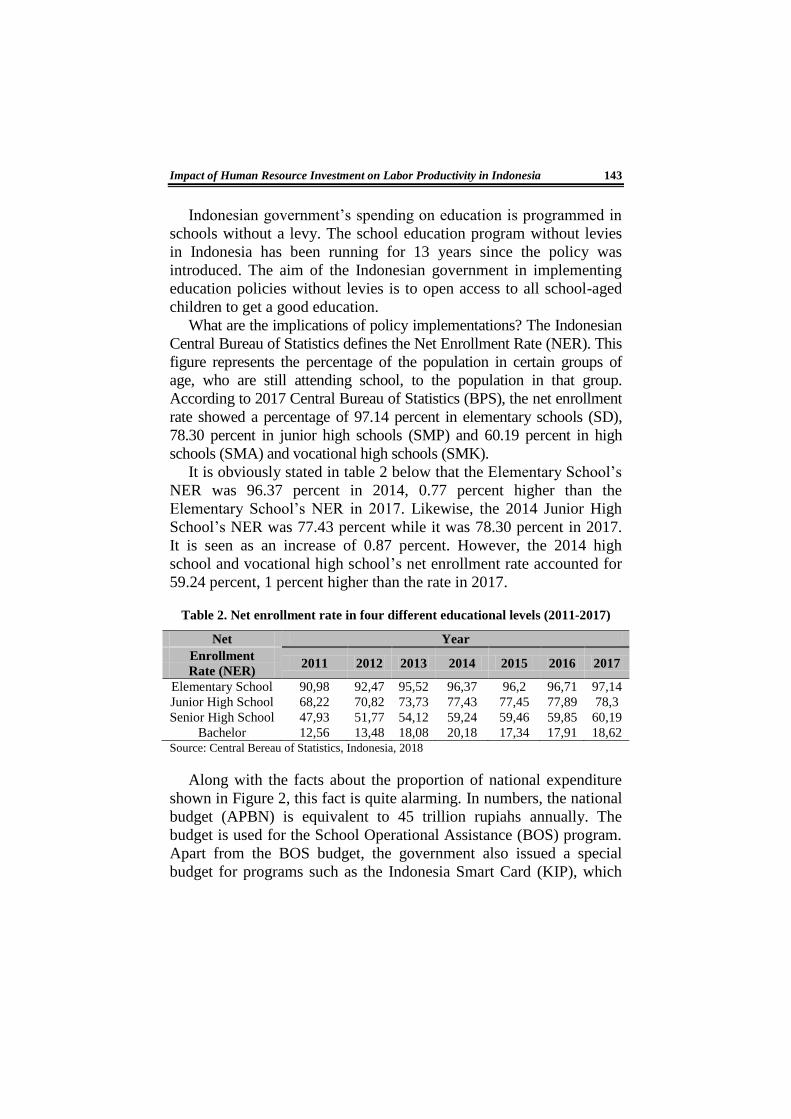
It is obviously stated in table 2 below that the Elementary School’s
NER was 96.37 percent in 2014, 0.77 percent higher than the
Elementary School’s NER in 2017. Likewise, the 2014 Junior High
School’s NER was 77.43 percent while it was 78.30 percent in 2017.
It is seen as an increase of 0.87 percent. However, the 2014 high
school and vocational high school’s net enrollment rate accounted for
59.24 percent, 1 percent higher than the rate in 2017.
Table 2. Net enrollment rate in four different educational levels (2011-2017)
Net Year
Enrollment 2011 2012 2013 2014 2015 2016 2017
Rate (NER)
Elementary School 90,98 92,47 95,52 96,37 96,2 96,71 97,14
Junior High School 68,22 70,82 73,73 77,43 77,45 77,89 78,3
Senior High School 47,93 51,77 54,12 59,24 59,46 59,85 60,19
Bachelor 12,56 13,48 18,08 20,18 17,34 17,91 18,62 Source: Central Bereau of Statistics, Indonesia, 2018
Along with the facts about the proportion of national expenditure
shown in Figure 2, this fact is quite alarming. In numbers, the national
budget (APBN) is equivalent to 45 trillion rupiahs annually. The
budget is used for the School Operational Assistance (BOS) program.
Apart from the BOS budget, the government also issued a special
budget for programs such as the Indonesia Smart Card (KIP), which
144 (IJMS) Vol. 13, No. 1, Winter 2020
began in the era of President Joko Widodo in 2015, and allocated
funds around 9 trillion rupiahs.
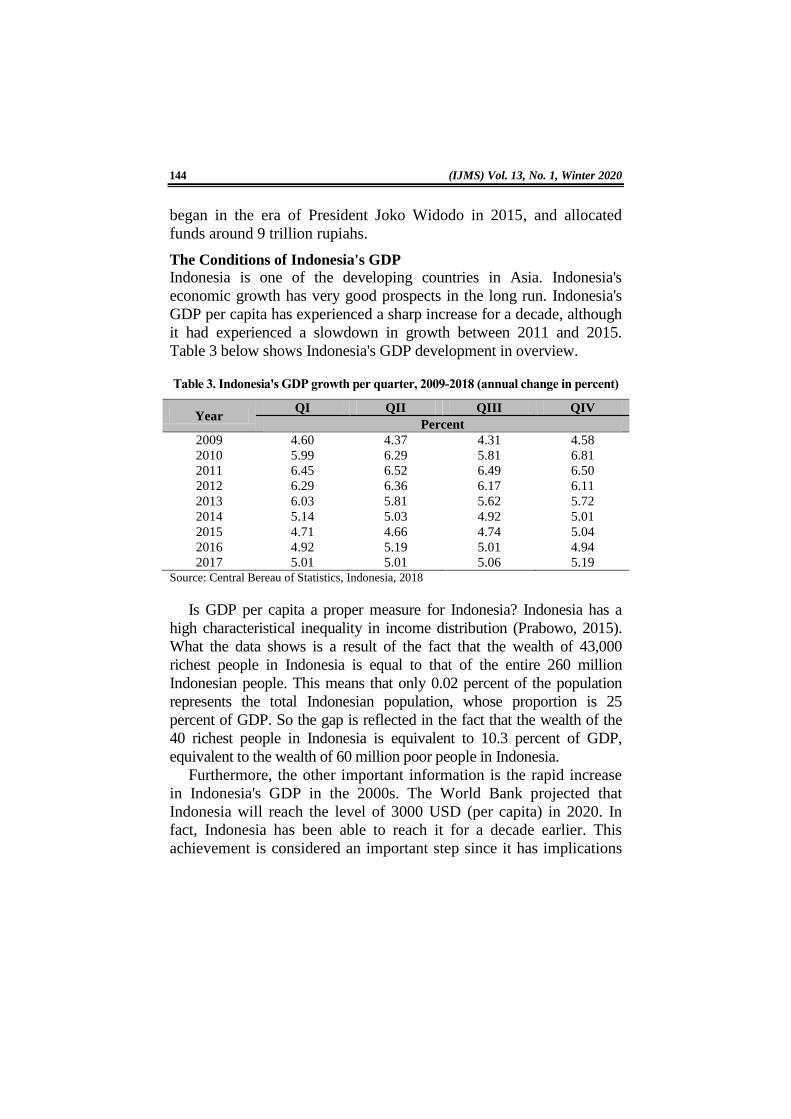
The Conditions of Indonesia's GDP
Indonesia is one of the developing countries in Asia. Indonesia's
economic growth has very good prospects in the long run. Indonesia's
GDP per capita has experienced a sharp increase for a decade, although
it had experienced a slowdown in growth between 2011 and 2015.
Table 3 below shows Indonesia's GDP development in overview.
Table 3. Indonesia's GDP growth per quarter, 2009-2018 (annual change in percent)
Year QI QII QIII QIV
Percent
2009 4.60 4.37 4.31 4.58
2010 5.99 6.29 5.81 6.81
2011 6.45 6.52 6.49 6.50
2012 6.29 6.36 6.17 6.11
2013 6.03 5.81 5.62 5.72
2014 5.14 5.03 4.92 5.01
2015 4.71 4.66 4.74 5.04
2016 4.92 5.19 5.01 4.94
2017 5.01 5.01 5.06 5.19 Source: Central Bereau of Statistics, Indonesia, 2018
Is GDP per capita a proper measure for Indonesia? Indonesia has a
high characteristical inequality in income distribution (Prabowo, 2015).
What the data shows is a result of the fact that the wealth of 43,000
richest people in Indonesia is equal to that of the entire 260 million
Indonesian people. This means that only 0.02 percent of the population
represents the total Indonesian population, whose proportion is 25
percent of GDP. So the gap is reflected in the fact that the wealth of the
40 richest people in Indonesia is equivalent to 10.3 percent of GDP,
equivalent to the wealth of 60 million poor people in Indonesia.
Furthermore, the other important information is the rapid increase
in Indonesia's GDP in the 2000s. The World Bank projected that
Indonesia will reach the level of 3000 USD (per capita) in 2020. In
fact, Indonesia has been able to reach it for a decade earlier. This
achievement is considered an important step since it has implications
Impact of Human Resource Investment on Labor Productivity in Indonesia 145
for development acceleration in a number of sectors such as the retail,
automotive and property sectors.
The Condition of Indonesia’s HDI
The human development index is a summary measure of the long-term
progress of human development. The human development index is
measured in three dimensions, namely life expectancy and health, ingress
to knowledge and purchasing power or living standard. Report on the
development of human development made by the United Nations
Development Program (UNDP) informed that the value of Indonesia's
HDI in 2017 amounted to 0.694 in the human development category at a
moderate level. It means Indonesia still ranked 113 out of 189 countries.
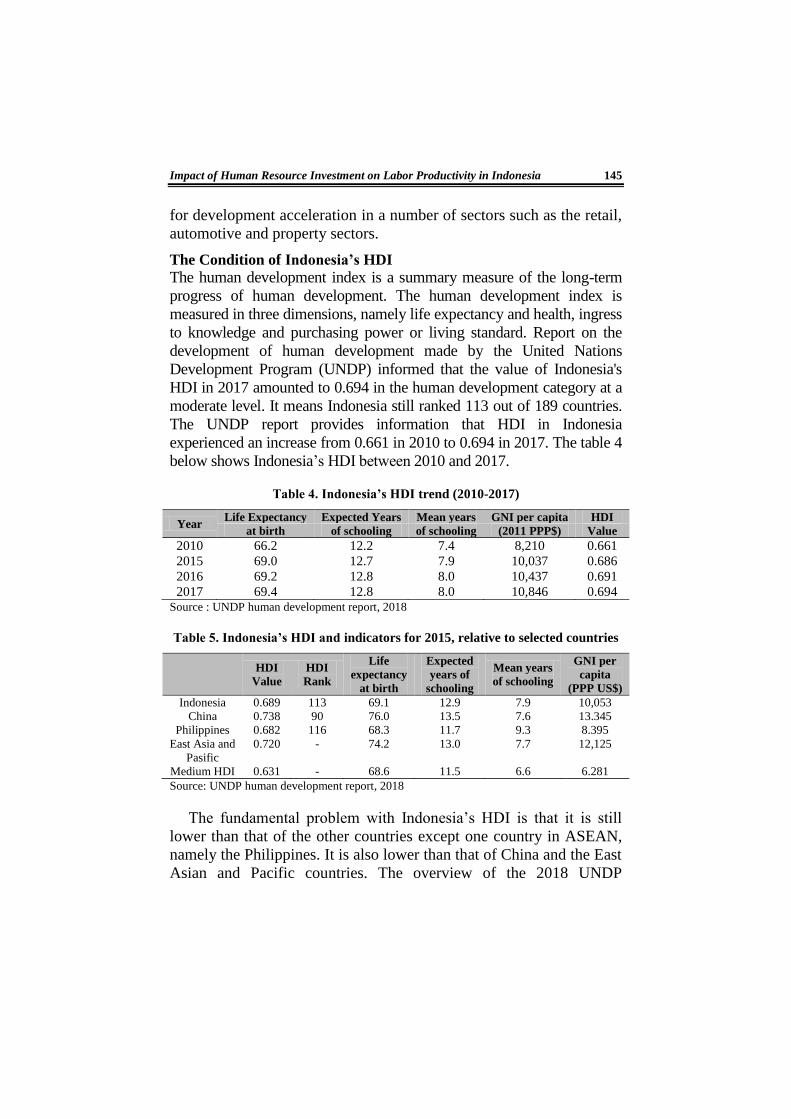
The UNDP report provides information that HDI in Indonesia
experienced an increase from 0.661 in 2010 to 0.694 in 2017. The table 4
below shows Indonesia’s HDI between 2010 and 2017.
Table 4. Indonesia’s HDI trend (2010-2017)
Year Life Expectancy Expected Years Mean years GNI per capita HDI
at birth of schooling of schooling (2011 PPP$) Value
2010 66.2 12.2 7.4 8,210 0.661
2015 69.0 12.7 7.9 10,037 0.686
2016 69.2 12.8 8.0 10,437 0.691
2017 69.4 12.8 8.0 10,846 0.694 Source : UNDP human development report, 2018
Table 5. Indonesia’s HDI and indicators for 2015, relative to selected countries
HDI
Value
HDI
Rank
Life
expectancy
at birth
Expected
years of
schooling
Mean years
of schooling
GNI per
capita
(PPP US$)
Indonesia 0.689 113 69.1 12.9 7.9 10,053
China 0.738 90 76.0 13.5 7.6 13.345
Philippines 0.682 116 68.3 11.7 9.3 8.395
East Asia and 0.720 - 74.2 13.0 7.7 12,125
Pasific
Medium HDI 0.631 - 68.6 11.5 6.6 6.281
Source: UNDP human development report, 2018
The fundamental problem with Indonesia’s HDI is that it is still
lower than that of the other countries except one country in ASEAN,
namely the Philippines. It is also lower than that of China and the East
Asian and Pacific countries. The overview of the 2018 UNDP
146 (IJMS) Vol. 13, No. 1, Winter 2020
statistics gave Indonesia a warning and suggested that Indonesia focus
more on developing its human resources.
This background description provides the importance of this study to
see the long-term relationship between the quality of human resources
and labor productivity in Indonesia. We consider the education level of
workers and health status to be proxies for the quality of human
resources. This study has limitations on the categorization of education
levels. In education level data, vocational education is not separated
from general (non-vocational) education because this study is done in
general to see the long-term and short-term effects of human capital on
labor productivity. Thus, it does not explain in detail the specific effects
of vocational education output on labor productivity. Therefore, the
main purpose of this study is to determine the effect of the contribution
of human capital, namely education and workforce health, on labor
productivity in Indonesia. Therefore, the question in this study is
whether human resources affect labor productivity in Indonesia. The
hypothesis for this question is that human resources have an impact on
labor productivity in Indonesia.
This study is very important because there is still a very limited
number of studies in Indonesia that examine the relationship between
human resources and labor productivity in Indonesia based on the latest
data sets. This research question refers to how Indonesia's human
resources contribute from a long-term and short-term model to labor
productivity. This study will also provide pieces of advice and
recommendations on potential policy implications as a solution to the
policies that have been made. After the description of this background,
the remaining parts of this paper will be arranged as follows; part two is
a theoretical review of the correlation between human capital and
productivity. Part 3 describes the methodological framework and
econometric techniques. Part 4 is reporting on empirical results and Part
5 is presenting findings and making suggestions on policy implications.
Literature Review
Research on human resource investment as a development tool has
been supported by world economists. For example, Schultz (1961,
1988), Becker (1965, 1975 & 1992) & Becker, Murphy & Tamura
(1990) emphasized the importance of investing in human resources.
Impact of Human Resource Investment on Labor Productivity in Indonesia 147
Their concept describes that human capital is an asset that is as
important as physical capital in creating wealth. Investment in human
capital affects future income and consumption through school
attainment and improves medical care and skills through training.
Achieving a higher education level encourages individuals to earn
higher wages. When individual workers get higher wages, their health
and fitness improve. They can afford more nutritious diets as an effort
to increase endurance and work productivity.
Empirically, Barro (1991) clearly explained that the theory of
endogenous growth prioritizing human capital investment is related to
GDP per capita. Likewise, in research on the sources of economic
growth carried out by Barro & Lee (1994), variables of infant
mortality and life expectancy are used as proxies for workers’ health
variable. Relevant to that, Renelt (1992) found that the level of school
enrollment was positively correlated with economic growth. Another
finding by Hanushek & Kimko (1993) stated that the quality of
education has an effect on productivity and the degree of economic
growth in the nation. Similar to these findings, Barro & Sala-i-martin
(1995) described that the average school year for both men and
women at the higher education level significantly influences the
growth rate of GDP per capita.
Empirical studies of the scope of human capital investment in
productivity have been carried out by scholars in various parts of the
world. A study was conducted by Arshad & Malik (2015) in Malaysia
with the fixed effects generalized least square (GLS) method to see the
relationship between human capital and labor productivity. Proxies for
education variables were school year average, education level, school
enrollment rate, government expenditure for education and literacy rates.
The health variables were measured by life expectancy, government
spending on health and the survival rate of adults. The study led to a
conclusion that the quality of human resources (higher education and
health status) positively and significantly increased the labor’s
productivity in Malaysia.
Meanwhile, a study by Chansarn (2015), that is obtained from data
sources during 1981-2005 (24 years) and sourced from 30 countries,
examined the effect of education, health and technological progress on
the level of labor productivity growth. The proxies used are Gross
148 (IJMS) Vol. 13, No. 1, Winter 2020
Domestic Product, Gross Fixed Capital formation, labor force, school
year, life expectancy at birth and total growth rate of productivity
factors. Using the OLS method (Ordinary Least Square), it pointed to
the conclusion that education and technology are significant
determinants of the level of labor productivity growth.
A different study was conducted by Wang & Liu (2016) using
panel data in 55 countries from 1960 to 2009, which involved basic
education, secondary education, and higher education proxies as
educational variables, proxies of life expectancy as health variables,
and GDP as the proxy of economic growth. It concluded that the
positive impact of higher education on economic growth is very
significant, but secondary education does not have a significant impact
on economic growth. Moreover, human capital and life expectancy
(health) show a significant positive correlation to economic growth.
Another study involving educational variables and health variables
as advocates of human resource theory to see its effect on labor
productivity is Forbes (2010). The study took survey data from
Households, Income and Labor Dynamics in Australia (HILDA). The
findings of this study say that increasing educational attainment has a
significant positive effect on hourly wages. The study also measured
the effects of five health problems every hour and concluded that all
health problems significantly reduced hourly wages.
Other empirical evidence from a study in Nigeria by Umoru &
Yacub (2013) found that health capital investment increases labor
force productivity. Another finding in his research is that, statistically,
the education of labor force increases labor force productivity.
The results of an empirical study in Indonesia conducted by Wahyuni
& Monika (2016) showed evidence that the influence of education on
income is higher for a more skilled workforce. The study also describes
that education can reduce income inequality. Furthermore, the study
illustrates that the influence of education on male income is lower than
that of women. The results of the study by Brezis and Brand (2016),
which looked at the contribution of education to human resources,
provide differences in labor productivity between tradable and non-
tradable industries, although the increase in human capital in the two
industrial sectors was not significantly different.
The studies above are similar to the study conducted by Dukec and
Impact of Human Resource Investment on Labor Productivity in Indonesia 149
Mirosla (2017) regarding the effect of human capital on agricultural
production. The study was conducted on workers in livestock companies
in Poland. Their research shows a conclusion that output elasticity of
labor factors is significantly higher in farm groups managed by farmers
with higher levels of education. The research by Qutb (2017) in Egypt is
different. He used a total productivity factor proxy to measure the level
of labor productivity. In addition, he considered that the quality of
education in human resources is caused by the educational achievement
of labor. Data processing using the Autoregressive Distributed Lag
(ARDL) approach concludes that only slightly does the quality of
education in higher education alone improve the quality of education in
the whole human resources. Likewise, Research by Bokana & Akinola
(2017) stated that high level of education in human resources must be
supported by the strong implementation of state policies, for it can have a
positive impact on productivity growth.
A recent study in Indonesia conducted by Mendy (2018) shows the
results that long-term and short-term relationships of various levels of
education in the structure of human resources in Indonesia are still at the
level of expanding economic growth and identifying education at the
third level as the main evolving factor. This study empirically collapsed
to find a considerable correlation between school level and economic
growth.
Theoretical framework and methodology
Theoretically, to check the influence of long-term model of human
capital on economic productivity in Indonesia, it is first obligatory to look
at linear functions based on the fundamental principles of the Cobb-
Douglas production function (Sieng & Yussof, 2014). There are two
approaches commonly used in analyzing the relationship between human
resources and labor productivity. Most empirical studies examine the
relationship of education to production by using income function
framework (Becker, 1965; Mincer, 1974). In this conventional approach,
the profit factor is used as a proxy for productivity, which then the profit
function can estimate the effect of education on productivity. Aggrey,
Eliab, and Joseph (2010) mentioned that the second approach is to
estimate the relationship between variables of human capital and labor
productivity carried out by using production analysis. This method has
150 (IJMS) Vol. 13, No. 1, Winter 2020
been carried out by Cörvers (1996). The use of production analysis has
advantages compared to the income function framework. This function
can be written as follows:
t t tY AK L (1)
In equation 1, Y is output, K defines physical capital and L is labor.
The attribute t in variables indicate the time and A, α, β are positive
constants. The production function does not consider the quality of
work and presumes that labor is homogeneous. In Romer's
endogenous growth theory (1990), human capital is modeled as a
factor of production which can increase aggregate production and the
marginal physical product of capital. It is this thought that causes the
hypothesis to hold that the quality of labor is the main clincher
variable in production growth. Therefore, the quality of work can be
mathematically written as follows:
1 1 1 1 1 1t t t t t tY ak LP lny lna lnk lnLP (2)
2 2 2 2 1t t t t it tY ak LS lny lna lnk lnLS (3)
3 3 3 3 1t t t t it tY ak LT lny lna lnk lnLT (4)
Y1t, Y2t, and Y3t are the productions of labors from primary,
secondary and tertiary education, respectively. From the description of
the equation above, the sum of all production by workers with
primary, secondary and tertiary education levels can be achieved
(Sieng & Yussof, 2014).
The experimental estimation model that accompanies the proxy on
independent variables is the life expectancy at birth that describes
government spending on health and the survival rate of adults.
Then we will use a mathematical equation that includes the
percentage of workers with health states in the time period t.
( )t t tY AK uhL (5)
To analyze the accumulation of human capital associated with the
function of production, effective labor, then L*, represents the labor at
Impact of Human Resource Investment on Labor Productivity in Indonesia 151
three educational stages and mental and physical health conditions.
Mathematically, it can be formulated as below:
*( )t t tY AK L (6)
In the condition of the labor with different years of educational
levels (j = 1, 2, 3) according to the level, it can be said that
* 1, 2, 3,j
t tL L L j dan (7)
After knowing the result of equation (7), the result can be
substituted in equation (5). Therefore, the newest equation is as
follows:
31 2 2
3t t t t t tY AK L L L L L
(8)
To get the labor productivity function, equation (5) needs to be
divided with Lt to produce the equation as follows:
31 2( )t t t t t t
t t
Y AK L L L L
L L
Alternatively, it can be written
31 2t tt t t t
t t
Y KA L L L L
L L
(9)
The Equation will be used to link labor productivity with the ratio
of labor input at the level of primary, secondary and tertiary education
along with good labor health conditions for a certain period of time.
Before directing this formula to the analysis formation process with
Auto-regressive Distributed Lag (ARDL), it is best to look first at the
logarithmic model:
0 1 2 3 4t t t t t tlnGDP lnLP lnLS lnLT lnHL (10)
The equation above explains that the GDP logarithm is a constant
Gross Domestic Product (GDP) per worker. The worker's education is
symbolized by LP (primary education), LS (second level of education)
and LT (third level of education). HL symbolizes the life expectation
152 (IJMS) Vol. 13, No. 1, Winter 2020
of workers while e is a symbol of error, i attribute is the number of
statuses (i = 1, 2, 3 ..., n) and t shows the year period.
Time series data from 1981 to 2014 were from World Bank data
collections. The data will be analyzed by the Autoregressive
Distributed Lag (ARDL) method introduced by Pesaran (1995).
Pesaran explains the co-integration relationship in the ARDL model.
The ARDL model approach was chosen because this model is able to
accommodate a large number of variables and is possible to use for
long-term and short-term estimates under the control of co-integration
procedures and is also strongly used in small samples. According to
Shin, Smith, and Pesaran (2001), ARDL can also be applied
regardless of pure regressor I (0), I (l) or reciprocal integration. Then
the operationalization step can be continued to see short-term
relationships among variables. After that, it will be continued to see
the existence of long-run relationships among variables as a closing.
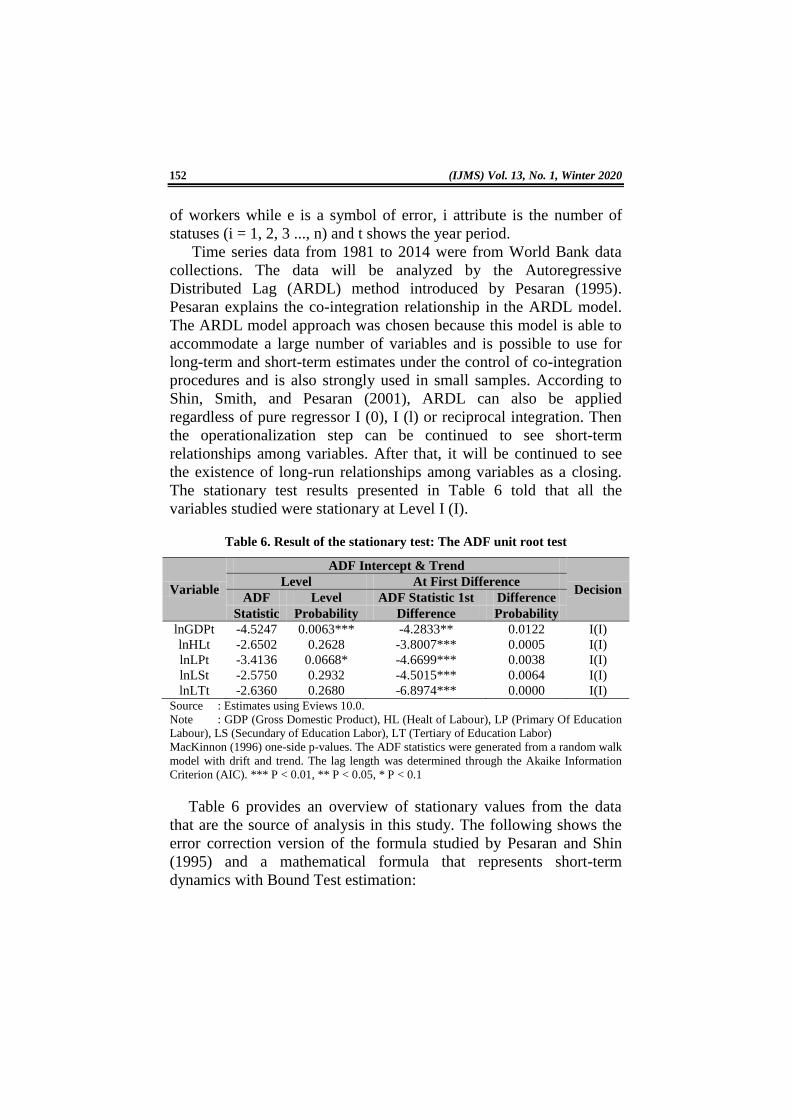
The stationary test results presented in Table 6 told that all the
variables studied were stationary at Level I (I).
Table 6. Result of the stationary test: The ADF unit root test
Variable
ADF Intercept & Trend
Decision Level At First Difference
ADF Level ADF Statistic 1st Difference
Statistic Probability Difference Probability
lnGDPt -4.5247 0.0063*** -4.2833** 0.0122 I(I)
lnHLt -2.6502 0.2628 -3.8007*** 0.0005 I(I)
lnLPt -3.4136 0.0668* -4.6699*** 0.0038 I(I)
lnLSt -2.5750 0.2932 -4.5015*** 0.0064 I(I)
lnLTt -2.6360 0.2680 -6.8974*** 0.0000 I(I) Source : Estimates using Eviews 10.0.
Note : GDP (Gross Domestic Product), HL (Healt of Labour), LP (Primary Of Education
Labour), LS (Secundary of Education Labor), LT (Tertiary of Education Labor)
MacKinnon (1996) one-side p-values. The ADF statistics were generated from a random walk
model with drift and trend. The lag length was determined through the Akaike Information
Criterion (AIC). *** P < 0.01, ** P < 0.05, * P < 0.1
Table 6 provides an overview of stationary values from the data
that are the source of analysis in this study. The following shows the
error correction version of the formula studied by Pesaran and Shin
(1995) and a mathematical formula that represents short-term
dynamics with Bound Test estimation:
Impact of Human Resource Investment on Labor Productivity in Indonesia 153
0 1 1 2 1
1 1
3 1 4 1 5 1 1 1
1 1 1
2 1 3 1 4 5 1
n n
t t t
i t
n n n
t t t t
t t t
t t t t
lnGDP lnGDP lnLP
lnLS lnLT lnHL lnGDP
lnLP lnLS ln lnHL
(11)
∆ symbolizes the level of differentiation while β1, β2, β3, β4, and
β5 are a sequence of models l (l) on the short-run model dynamics.
Whereas to test the long-run model amongst the variables examined
the F-test is used, it is necessary to submit a hypothesis to see
cointegration. The hypothesis proposed is as follows:
H0: δ1 = δ2 = δ3 = δ4 = δ5 = 0 (no cointegration between the
variables)
H1: δ1 δ2 δ3 δ4 δ5 0 (cointegration exists between the
variables)
There are three conclusions from this hypothesis. First, if the
condition on the statistical number of F is higher than the critical number
of the upper limit, then the conclusion is that no cointegration is rejected,
which means there is a long-term relationship between variables. Second,
if F results are less than the critical lower limit, the null hypothesis cannot
be rejected. This shows that there is no long-term relationship among
variables. Third, if statistic F results far between the critical value of the
lower limit and the upper limit, then the test cannot be concluded. The
following is a long-term model estimate:
1 1 1
0 1 1 2 1 3 1
1 0 0
1 1
4 1 5 1 6 1
0 0
n n n
t t t
t t t
n n
t t t t
t t
lnGDP lnGDP lnLP lnLS
lnLT lnHL ECT
(12)
β1, β2, β3, β4, β5, and β6 are short-run coefficients. ECT
symbolizes the adjustment coefficient rate to achieve a long-term
balance after a short-term surprise. This model is run to see how long
the economic dynamics correct the long-term balance through short-
term adjustments. Furthermore, the ARDL model needs to be
examined further in the state of the diagnostic test and stability test.
The function of a diagnostic test is to check serial relationship,
functional model conditions, normality, and heteroskedasticity. The
154 (IJMS) Vol. 13, No. 1, Winter 2020
structural stability test is useful to see cumulative residues with
indicators named CUSUM (cumulative residues) and CUSUMSQ
(square number of recursive cumulative residue).
Outputs and Discussion This part will describe the outputs and discuss the discoveries in three
parts. The first part describes the results of the unit root test. The second
part discusses the results of co-integration tests and simultaneously
interprets them. The last part discusses the results of the diagnostic test.
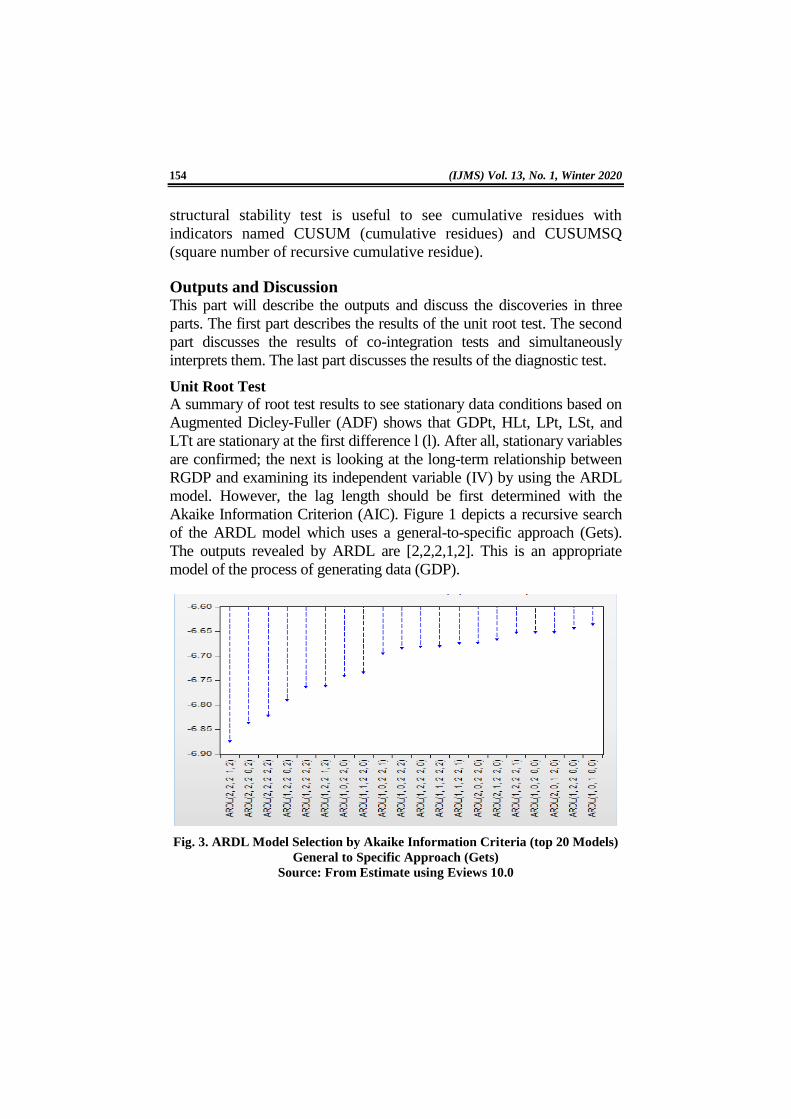
Unit Root Test
A summary of root test results to see stationary data conditions based on
Augmented Dicley-Fuller (ADF) shows that GDPt, HLt, LPt, LSt, and
LTt are stationary at the first difference l (l). After all, stationary variables
are confirmed; the next is looking at the long-term relationship between
RGDP and examining its independent variable (IV) by using the ARDL
model. However, the lag length should be first determined with the
Akaike Information Criterion (AIC). Figure 1 depicts a recursive search
of the ARDL model which uses a general-to-specific approach (Gets).
The outputs revealed by ARDL are [2,2,2,1,2]. This is an appropriate
model of the process of generating data (GDP).
Fig. 3. ARDL Model Selection by Akaike Information Criteria (top 20 Models)
General to Specific Approach (Gets)
Source: From Estimate using Eviews 10.0
Impact of Human Resource Investment on Labor Productivity in Indonesia 155
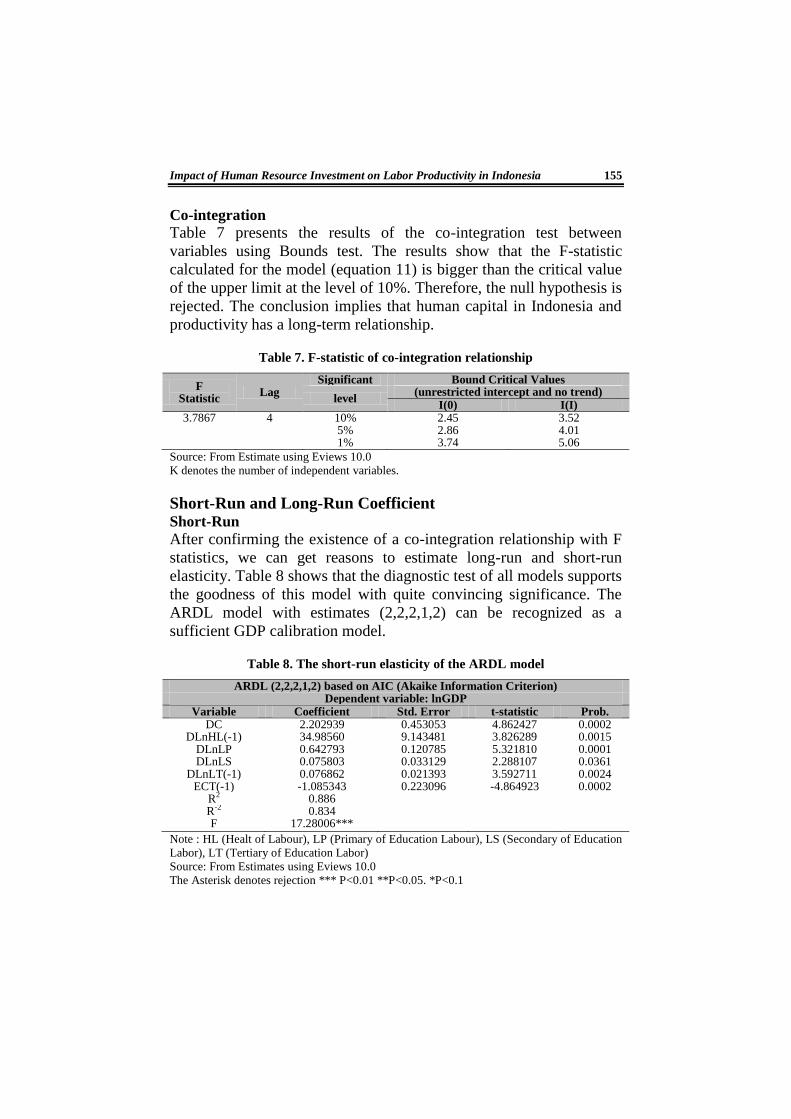
Co-integration
Table 7 presents the results of the co-integration test between
variables using Bounds test. The results show that the F-statistic
calculated for the model (equation 11) is bigger than the critical value
of the upper limit at the level of 10%. Therefore, the null hypothesis is
rejected. The conclusion implies that human capital in Indonesia and
productivity has a long-term relationship.
Table 7. F-statistic of co-integration relationship
F Statistic
Lag Significant Bound Critical Values
level (unrestricted intercept and no trend)
I(0) I(I) 3.7867 4 10% 2.45 3.52
5% 2.86 4.01 1% 3.74 5.06
Source: From Estimate using Eviews 10.0
K denotes the number of independent variables.
Short-Run and Long-Run Coefficient Short-Run
After confirming the existence of a co-integration relationship with F
statistics, we can get reasons to estimate long-run and short-run
elasticity. Table 8 shows that the diagnostic test of all models supports
the goodness of this model with quite convincing significance. The
ARDL model with estimates (2,2,2,1,2) can be recognized as a
sufficient GDP calibration model.
Table 8. The short-run elasticity of the ARDL model
ARDL (2,2,2,1,2) based on AIC (Akaike Information Criterion) Dependent variable: lnGDP
Variable Coefficient Std. Error t-statistic Prob. DC 2.202939 0.453053 4.862427 0.0002
DLnHL(-1) 34.98560 9.143481 3.826289 0.0015 DLnLP 0.642793 0.120785 5.321810 0.0001 DLnLS 0.075803 0.033129 2.288107 0.0361
DLnLT(-1) 0.076862 0.021393 3.592711 0.0024 ECT(-1) -1.085343 0.223096 -4.864923 0.0002
R2 0.886
R-2 0.834
F 17.28006***
Note : HL (Healt of Labour), LP (Primary of Education Labour), LS (Secondary of Education
Labor), LT (Tertiary of Education Labor)
Source: From Estimates using Eviews 10.0
The Asterisk denotes rejection *** P<0.01 **P<0.05. *P<0.1
156 (IJMS) Vol. 13, No. 1, Winter 2020
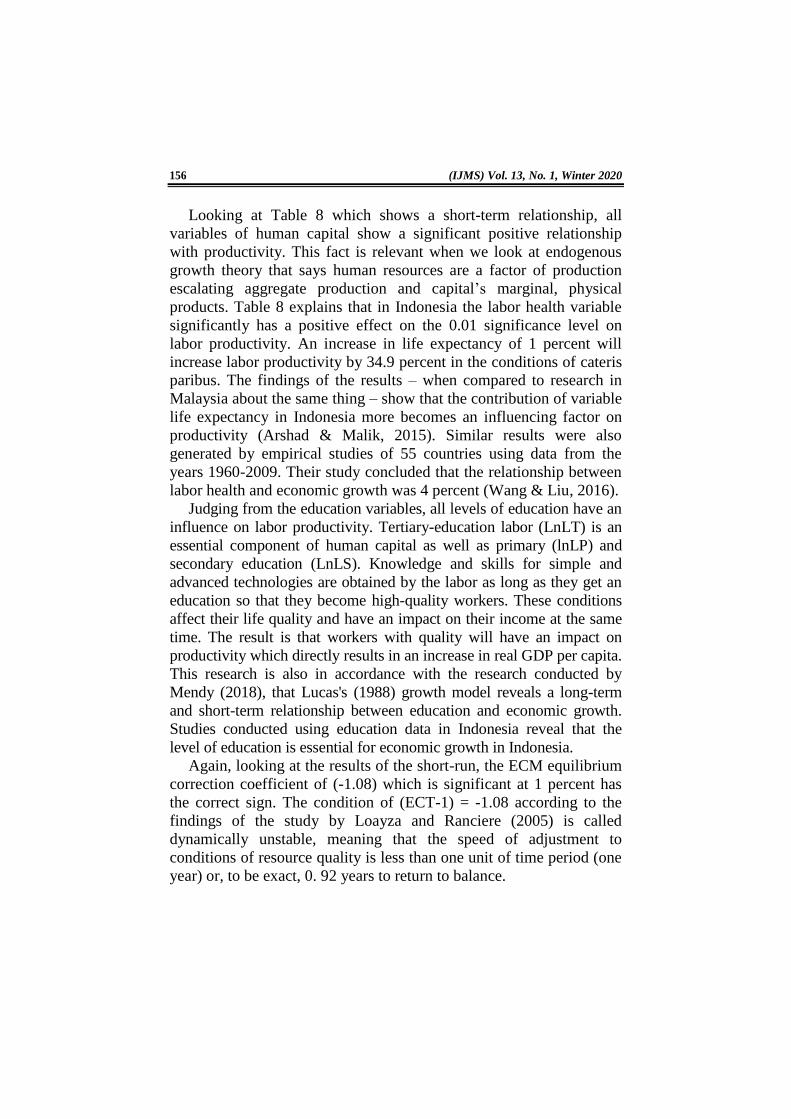
Looking at Table 8 which shows a short-term relationship, all
variables of human capital show a significant positive relationship
with productivity. This fact is relevant when we look at endogenous
growth theory that says human resources are a factor of production
escalating aggregate production and capital’s marginal, physical
products. Table 8 explains that in Indonesia the labor health variable
significantly has a positive effect on the 0.01 significance level on
labor productivity. An increase in life expectancy of 1 percent will
increase labor productivity by 34.9 percent in the conditions of cateris
paribus. The findings of the results – when compared to research in
Malaysia about the same thing – show that the contribution of variable
life expectancy in Indonesia more becomes an influencing factor on
productivity (Arshad & Malik, 2015). Similar results were also
generated by empirical studies of 55 countries using data from the
years 1960-2009. Their study concluded that the relationship between
labor health and economic growth was 4 percent (Wang & Liu, 2016).
Judging from the education variables, all levels of education have an
influence on labor productivity. Tertiary-education labor (LnLT) is an
essential component of human capital as well as primary (lnLP) and
secondary education (LnLS). Knowledge and skills for simple and
advanced technologies are obtained by the labor as long as they get an
education so that they become high-quality workers. These conditions
affect their life quality and have an impact on their income at the same
time. The result is that workers with quality will have an impact on
productivity which directly results in an increase in real GDP per capita.
This research is also in accordance with the research conducted by
Mendy (2018), that Lucas's (1988) growth model reveals a long-term
and short-term relationship between education and economic growth.
Studies conducted using education data in Indonesia reveal that the
level of education is essential for economic growth in Indonesia.
Again, looking at the results of the short-run, the ECM equilibrium
correction coefficient of (-1.08) which is significant at 1 percent has
the correct sign. The condition of (ECT-1) = -1.08 according to the
findings of the study by Loayza and Ranciere (2005) is called
dynamically unstable, meaning that the speed of adjustment to
conditions of resource quality is less than one unit of time period (one
year) or, to be exact, 0. 92 years to return to balance.
Impact of Human Resource Investment on Labor Productivity in Indonesia 157
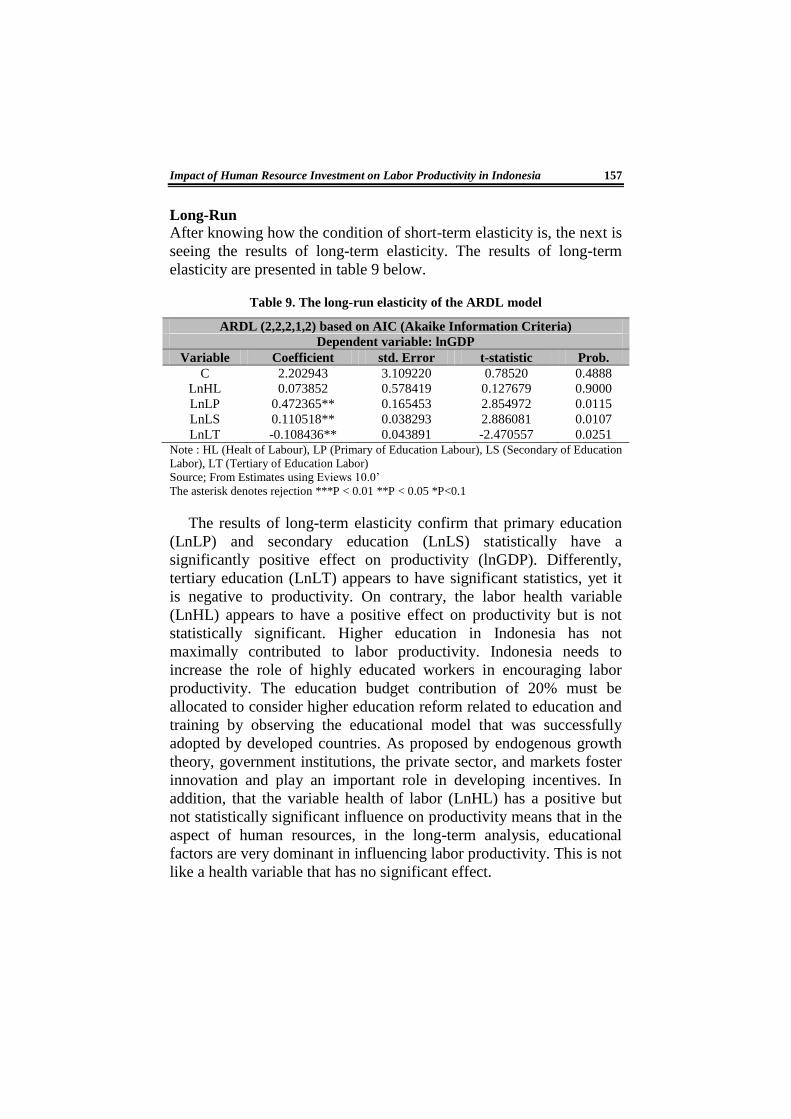
Long-Run
After knowing how the condition of short-term elasticity is, the next is
seeing the results of long-term elasticity. The results of long-term
elasticity are presented in table 9 below.
Table 9. The long-run elasticity of the ARDL model
ARDL (2,2,2,1,2) based on AIC (Akaike Information Criteria)
Dependent variable: lnGDP
Variable Coefficient std. Error t-statistic Prob.
C 2.202943 3.109220 0.78520 0.4888
LnHL 0.073852 0.578419 0.127679 0.9000
LnLP 0.472365** 0.165453 2.854972 0.0115
LnLS 0.110518** 0.038293 2.886081 0.0107
LnLT -0.108436** 0.043891 -2.470557 0.0251 Note : HL (Healt of Labour), LP (Primary of Education Labour), LS (Secondary of Education
Labor), LT (Tertiary of Education Labor)
Source; From Estimates using Eviews 10.0’
The asterisk denotes rejection ***P < 0.01 **P < 0.05 *P<0.1
The results of long-term elasticity confirm that primary education
(LnLP) and secondary education (LnLS) statistically have a
significantly positive effect on productivity (lnGDP). Differently,
tertiary education (LnLT) appears to have significant statistics, yet it
is negative to productivity. On contrary, the labor health variable
(LnHL) appears to have a positive effect on productivity but is not
statistically significant. Higher education in Indonesia has not
maximally contributed to labor productivity. Indonesia needs to
increase the role of highly educated workers in encouraging labor
productivity. The education budget contribution of 20% must be
allocated to consider higher education reform related to education and
training by observing the educational model that was successfully
adopted by developed countries. As proposed by endogenous growth
theory, government institutions, the private sector, and markets foster
innovation and play an important role in developing incentives. In
addition, that the variable health of labor (LnHL) has a positive but
not statistically significant influence on productivity means that in the
aspect of human resources, in the long-term analysis, educational
factors are very dominant in influencing labor productivity. This is not
like a health variable that has no significant effect.
158 (IJMS) Vol. 13, No. 1, Winter 2020
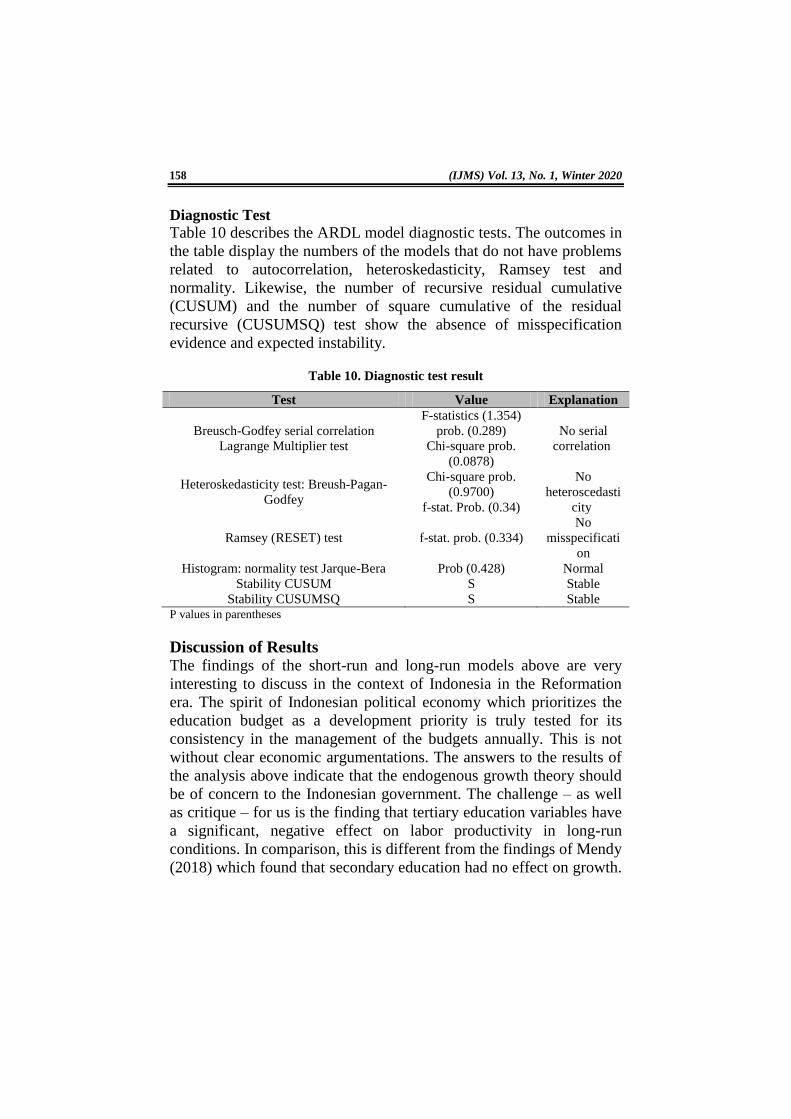
Diagnostic Test
Table 10 describes the ARDL model diagnostic tests. The outcomes in
the table display the numbers of the models that do not have problems
related to autocorrelation, heteroskedasticity, Ramsey test and
normality. Likewise, the number of recursive residual cumulative
(CUSUM) and the number of square cumulative of the residual
recursive (CUSUMSQ) test show the absence of misspecification
evidence and expected instability.
Table 10. Diagnostic test result
Test Value Explanation
Breusch-Godfey serial correlation
Lagrange Multiplier test
F-statistics (1.354)
prob. (0.289) No serial
correlation Chi-square prob.
(0.0878)
Heteroskedasticity test: Breush-Pagan-
Godfey
Chi-square prob.
(0.9700)
No
heteroscedasti
city f-stat. Prob. (0.34)
Ramsey (RESET) test f-stat. prob. (0.334)
No
misspecificati
on
Histogram: normality test Jarque-Bera Prob (0.428) Normal
Stability CUSUM S Stable
Stability CUSUMSQ S Stable P values in parentheses
Discussion of Results The findings of the short-run and long-run models above are very
interesting to discuss in the context of Indonesia in the Reformation
era. The spirit of Indonesian political economy which prioritizes the
education budget as a development priority is truly tested for its
consistency in the management of the budgets annually. This is not
without clear economic argumentations. The answers to the results of
the analysis above indicate that the endogenous growth theory should
be of concern to the Indonesian government. The challenge – as well
as critique – for us is the finding that tertiary education variables have
a significant, negative effect on labor productivity in long-run
conditions. In comparison, this is different from the findings of Mendy
(2018) which found that secondary education had no effect on growth.
Impact of Human Resource Investment on Labor Productivity in Indonesia 159
The evaluation-demanding fact is that the tertiary education quality
factors in Indonesia are not yet at the stage of fulfilling the right
criteria in employment that demands a high level of skills and
knowledge. This condition can be seen from the inaccurate targeting
of the Indonesian education budget voiced since 2002 regarding the
education reform.
Primary and secondary education has influenced Indonesia's labor
productivity in the end significantly and positively. What needs to be
examined more closely is that there are still many jobs in Indonesia,
the majority of which require labor at the level of primary and
secondary education. Spectrums of work are supplied by labor with
low education and low skill. Hence, the allocation of their work is to
the scope of agricultural laborers, production workers or laborers of
low-skill-demanding service sectors. This means that tertiary-
education labor will be brought in from outside the country to meet
the needs of high-skilled labor. This is different from the findings of
the study of Singh, Sieng & Saukani (2018) which states that in
Malaysia, in the long run, primary and tertiary educations are
important contributors to growth. Likewise, the research of Yussof
and Zakariya (2009) stated that, in the long run, in Malaysia, workers
with a higher education level have a positive effect on GDP. The labor
with a low education level has a non-significant, positive effect. The
analysis is reasonable since Malaysia is a developed country with high
income due to the influence of skilled and qualified labor from the
tertiary education. So it seems obvious that, according to the 2018
UNDP report, qualitatively, Indonesia's HDI is still below that of its
neighboring country, Malaysia.
The long-term negative influence of tertiary-education labor is also
worrying for Indonesia. The future demand for skilled labor cannot be
met by the output of the country's higher educational institutions. This
condition reminds us of the prediction that Indonesia in 2030 needs
113 million semi-skilled workers, which currently are still around 55
million.
In the long-term elasticity, the health variable has a positive effect
even though it is not significant at any level. This shows that in
Indonesia the health variable is not an absolute determinant of labor
productivity in long-term conditions. This can be seen from the results
160 (IJMS) Vol. 13, No. 1, Winter 2020
of the long-run analysis that labor health variables only contribute
seven percent, which is not quite significant. It can be interpreted that
physical safety and life expectancy are not the main factors in
productivity because long-term awareness of health tends to be low
due to low education.
Conclusion and Recommendation
This paper – investigating the correlation between the quality of
human resources and productivity of labor in Indonesia by using
Autoregressive Distributed Lag (ARDL) method in processing the
data – concluded that the quality of human resources is cointegrated
with labor productivity. In the short run, all variables including the
variables of health, primary, secondary and tertiary education of the
labor have a positive effect. This finding suggested that these
variables need to be safeguarded by government policies. However, in
the long run, the tertiary-education variable needs to be prioritized by
the government in order to produce high-skilled college graduates.
This means that college graduates need to be equipped with further
skills to turn into high-skilled workforce. As a result, they will
become a potential supply in the labor market. Meanwhile, the health
variables need to be focused more so that the labor health becomes the
concern of the workers, the companies or employee-hiring institutions.
In the end, it appears to be true that the human resource quality is the
causative factor of labor productivity in Indonesia.
Impact of Human Resource Investment on Labor Productivity in Indonesia 161
References Aggrey, N., Eliab, L., & Joseph, S. (2010). Human capital and labor
productivity in East African manufacturing firms. Current
Research Journal of Economic Theory, 2(2), 48–54. Retrieved
from http://core.kmi.open.ac.uk/download/pdf/5564813.pdf
Arshad, M. N. M., & Malik, Z. A. (2015). Quality of human capital
and labor productivity: A case of Malaysia. International
Journal of Economics, Management and Accounting, 23(1), 37–
55. https://doi.org/10.5430/rwe.v4n2p43
Barro, R. J. (1991b). Economic growth in a cross section of countries.
The Quarterly Journal of Economics, 106(2), 407.
https://doi.org/10.2307/2937943
Barro, R. J., & Lee, J. W. (1994). Sources of economic growth.
Carnegie-Rochester Confer. Series on Public Policy, 40(C), 1–
46. https://doi.org/10.1016/0167-2231(94)90002-7
Barro, R. J., & Sala-i-martin, X. (1995). Economic Growth (2nd ed.).
London: MIT Press.
Becker, G. S. (1962). Investment in human capital : A theoretical
analysis. The Journal of Political Economy, LXX (5), 9–49.
Becker, G. S. (1965). A theory of the allocation of time. The
Economic Journal, Vol. 75(299), 493–517.
Becker, G. S. (1975). Human capital: A theoretical and empirical
analysis, with special reference to education, chapter pages in
book (p.-22-0). National Bureau of Economic Research.
Becker, G. S. (1992). The economic way of looking at life. Working
Paper No. 12, Department of Economics, University of
Chicago.
Bokana, K. G., & Akinola, G. W. (2017). Productivity effects of
higher education human capital in selected countries of Sub-
Saharan Africa. Zbornik Radova Ekonomskog Fakulteta u
Rijeci: Časopis Za Ekonomsku Teoriju i Praksu/Proceedings of
Rijeka Faculty of Economics: Journal of Economics and
Business, 35(1), 173–198.
https://doi.org/10.18045/zbefri.2017.1.173
Brezis, E. S., & Brand, G. (2016). The effects of education on labor
productivity : Differences between tradable and non-tradable
industries. Preminary version, September.
162 (IJMS) Vol. 13, No. 1, Winter 2020
Chansarn, S. (2015). Labor productivity growth , education , health
and tchnological progress : A cross-country analysis. Economic
Analysis & Policy, 40(2), 249–262.
Cörvers, F. (1996). the impact of human capital on labour productivity
in manufacturing industries in Enugu and Anambra States,
Faculty of Economics and Bussines Adminitrasion, University of
Limburg. ISBN 90-5321-169-1
Dukec, D., & Mirosla, S. (2017). The effect of human capital on
labour productivity. Obrazovanje Za Poduzetništvo / Education
for Entrepreneurship, vol.7.(NR1), 9–19.
Forbes, M. (2010). The effects of education and health on wages and
productivity. Productivity. Communsion. Staff Working Paper.
Commonwealtth. ISBN 978-1-74037-309-8.
Becker, G. S., Murphy, K. M. & Tamura, Robert (1990). Human
capital , fertility , and economic growth. Journal of Political
Economy, Vol. 98(3), S12-S37.
Yussof, I., & Zakariya, Z. (2009). Economic Growth and Higher
Education Dewamnd in Malaysia. Malaysian Journal of
Economics, Vol 43(2009), 85-105.
Singh, N. K. H., Sieng, L. W., & Saukani, M. N. M. (2018). Impact of
education levels on economic growth in Malaysia : A gender
base analysis. Malaysian Journal of Society and Space, 4(4),
13–26.
Hanushek. E. A., & Kimko, D. D. (1993). Schooling , labor-force
quality , and the growth of nations. The American Economic
Review, Vol. 90(5), 1184-1208.
Loayza, N., & Ranciere, R. (2005). Financial development, financial
fragility , and growth. Working Paper. No. 05/170. ISBN/ISSN
9781451861891/1018-5941
Lucas, R. E. (1988). on The Mechanics of Economic Development.
Journal of Monetary Economics, 22(February), 3–42.
Mendy, D. (2018). Do education levels matter on Indonesian
economic growth? Economics & Sociology, 11(3), 133–146.
https://doi.org/10.14254/2071-789X.2018/11-3/8
Mincer, J. A. (1974). Schooling, experience, and eraning. Columbia
Univesity Press, pp. 1–4. Volume ISBN 0-870-14265-8. Volume
URL: http://www.nber.org/books/minc74-1
Impact of Human Resource Investment on Labor Productivity in Indonesia 163
Pesaran, M. H., & Shin, Y. (1995). An autoregressive distributed lag
modeling Approach to Co-integration Analysis. In Symposium
at the Centennial of Ragnar Frisch. The Norwegian Academy of
Science and Letters. Oslo, Mach 3-5.
https://doi.org/10.1016/S0025-5564(99)00018-8
Prabowo, Prayudi S & Bidiono (2015). An Overview of Income
Inequality in Indonesia in Preparation for the 2015 Asean
Economic Community. Journal of Research in Economic and
Management, 15(1), 182–189.
Qutb, R. (2017). How education does at all levels influence total
factors productivity growth? International Research Journal of
Finance and Economics, 159(1). 58-75
Renelt, R. L. D. (1992). A sensitivity analysis of cross-country growth
regressions. The American Economic Review, 82(4), 942–963.
Romer, P. M. (1990). Endogenous technological change. Journal of
Political Economy, 98(5), S71-102.
Schultz, T. W. (1961). Investment in human capital. The American
Economic Review, Vol 51.(1), 1-17.
Schultz, T. W. (1988). Education investmen and return. Handbook of
development Economics.Volume I. Edited by H. Chenery and
T.N. Srinivasan. Science Publisher B.V. ISSN. 15734471.DOI.
10.1016/S1573-4471(88)01016-2
Shin, Y., Smith, R. J., & Pesaran, M. H. (2001). Bounds testing
approaches to the analysis of level relationships. Journal of
Applied Econometrics, 16:289–326.
https://doi.org/10.1002/jae.616
Sieng, L. W., & Yussof, I. (2014). Human capital accumulation and
economic growth in Malaysia - Investigating the long run nexus.
Malaysian Journal of Economics, 48(1), 155–165.
https://doi.org/10.17576/JEM-2014-4801-13
Umoru, D., & Yacub, J. O. (2013). Labour productivity and health
capital in Nigeria : The empirical evidence. International
Journal of Humanities and Social Science, 3(4), 199–221.
Uzawa, H. (1965). Optimum technical change in an aggregative model
of economic growth. International Economic Review, 6(1), 18–
31.
164 (IJMS) Vol. 13, No. 1, Winter 2020
Wahyuni, R.N.T., & Monika, A.K. (2016) The impact of education on
income inequality among Indonesian workers. The Journal of
Indonesian 11(1), 110–125.
https://doi.org/10.1016/j.chieco.2015.12.009
Wang, Y., & Liu, S. (2016). Education, human capital and economic
growth: Empirical research on 55 countries and regions (1960-
2009). Theoretical Economics Letters, vol.6 347–355.
https://doi.org/10.4236/tel.2016.62039