increased labor productivity and it investment in the ... · stock and growth rate of labor...
TRANSCRIPT
International Department Working Paper Series 00-E-1
International Department
Bank of Japan
C.P.O. BOX 203 TOKYO100-8630 JAPAN
Views expressed in Working Paper Series are those of authors and do not
necessarily reflect those of Bank of Japan or International Department.
Increased Labor productivity andIT Investment in the United States
Yoshihito [email protected]

1
(This paper was originally published in Japanese in the Bank of Japan Monthly Bulletin on February 2000.)
Increased Labor Productivity and IT Investment in the United States
June 2000
Yoshihito SAITO1
International Department, Bank of Japan
Summary
1. The US economy has been booming for almost nine consecutive years after hitting
bottom in March 1991. It is often said that this long period of economic expansion is
due to the enhanced productivity of the overall US economy through the active use of
computers and the Internet to realize labor saving, inventory reductions, and sales
network expansion. However, labor productivity, which is obtained by dividing real
GDP by labor input, grew only about 1.5% on average annually until the mid-1990s.
Thus, it has been argued that the quantitative contribution of information technology
(IT) investment to economic growth by reinforcing the supply side of the economy
cannot be confirmed ( which has been called the “IT Paradox”).
2. However, data since 1996 shows that labor productivity growth has risen to an
average 2.5% annually. This is partly due to the comprehensive revision of GDP
statistics released on October 1999, whereby software expenses are now recorded as
value added. This pushed up GDP figures, since the growth in IT investment is directly
reflected in GDP growth. However, even excluding the upward effect occasioned by the
comprehensive revision of GDP statistics, labor productivity improvement became
prominent in the latter half of the 1990s.
1 Global Economic Research Division, International Department, Bank of Japan(e-mail: [email protected]).Key terms: Productivity, Information Technology, IT paradoxJEL classification: D20, L10, N10, O30, O40
2
3. This paper examines some factors that have been contributing to the recent
improvement in productivity, among which IT investment is our major interest. First, by
decomposing real GDP into several factors, we verify that technological innovation
actually contributes significantly to economic growth. It is found that capital stock and
labor input are not enough to fully explain enhanced real GDP growth in the 1990s.
Rather, factors other than the above, namely “Total Factor Productivity”, have been
found to account for roughly half of economic growth in the latter half of the 1990s. It
is also thought that the effect of the substitution of capital stock for labor input is not a
major cause of the increase in labor productivity, because the capital equipment ratio
did not rise to any significant degree.
From this analysis, it becomes apparent that “technological innovations” that
enhances output per unit of capital equipment and per unit of labor became increasingly
conspicuous during the late 1990s, consequently contributing considerably to real GDP
growth.
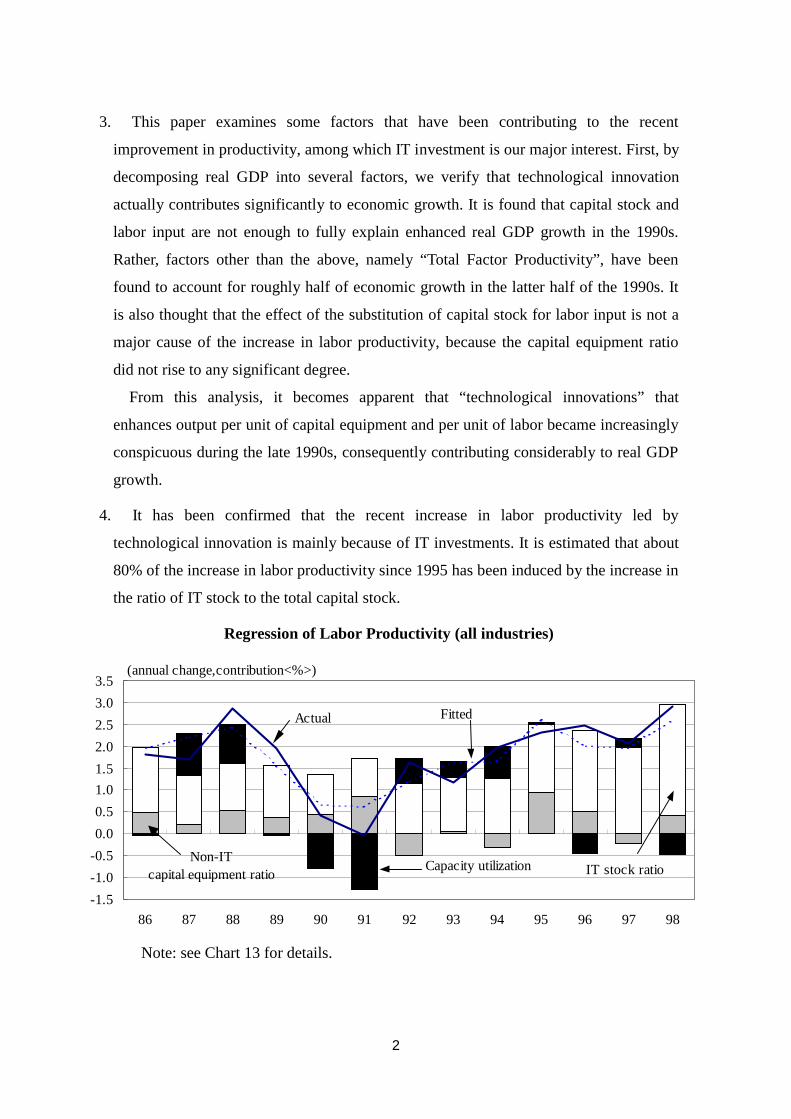
4. It has been confirmed that the recent increase in labor productivity led by
technological innovation is mainly because of IT investments. It is estimated that about
80% of the increase in labor productivity since 1995 has been induced by the increase in
the ratio of IT stock to the total capital stock.
Regression of Labor Productivity (all industries)
Note: see Chart 13 for details.
-1.5
-1.0
-0.5
0.0
0.5
1.0
1.5
2.0
2.5
3.0
3.5
86 87 88 89 90 91 92 93 94 95 96 97 98
(annual change,contribution<%>)
Fitted
IT stock ratioCapacity utilizationNon-IT
capital equipment ratio
Actual

3
5. The fact that active IT investment has led to an increase in productivity partly reflects
the improved efficiency of computers and networks. More importantly, synergies
emanating from IT stock have increased the productivity of other capital stock and labor,
which eventually lead to technological innovation.
To verify this point, the relationship between IT stock and productivity was analyzed
using productivity data for various industries. The following became apparent as a
result:
a) In the retail, durable goods manufacturing (especially industrial machinery and
electronic machinery), and financial industries, both the ratio of IT stock to non-IT
stock and growth rate of labor productivity accelerated in the late 1990s. It can be said
that (1) these industries have benefited from the fruit of IT innovation and (2)
competition with foreign companies has been intense and a reduction in labor costs
has been indispensable.
b) In the service sector, labor productivity is relatively low due to its labor-intensive
nature. However, in some industries like business services, productivity
improvements occasioned by aggressive IT investment stand out.
Correlation between IT stock and Labor Productivity (all industries)
Note: see Chart 19 for details.
0
1
2
3
4
5
6
7
8
9
10
-5 -4 -3 -2 -1 0 1 2 3 4
Changes in productivity growth (1980-94average 1995-97average)
Decelerating productivity growth Accelerating productivity growth
Cha
nges
in IT
sto
ck r
atio
(1990 to1997, % points)
(%points)
Wholesale
Services
Durable manufacturing
Retail
Public utilities
Non durable manufacturing Finance
Mining Construction
Communications
Transportation

4
c) Labor saving was the original aim of IT investment. However, it is noteworthy that
the productivity gains have generated new business opportunities, expanding US
employment significantly in the retail and service areas since the mid-1990s. This
expansion took place supported by an entrepreneurial friendly environment and a
highly flexible labor market. Another notable change during this period is the
increasing proportion of highly skilled jobs stemming from accelerated IT investment.
6. Most US companies are expected to continue IT investment. This is due to the decline
in price of IT goods in comparison with employment cost and increased competition
with foreign economies. Yet, a higher proportion of low skilled workers in some
industries such as construction and the possibility of a shortage in the supply of skilled
labor in the economy may be potential obstacles to a further increase in IT investment.
7. In the process of improving labor productivity after recovering from the recession in
the early 1990s, the US economy has benefited from IT innovation. The background to
this success is as follows:
a) The penetration of corporate governance that ceaselessly demanded the accurate
evaluation of risk and return for each business.
b) The increased competitiveness of financial and capital markets, which enabled the
efficient supply of risk capital.
c) Extensive restructuring and reengineering of business processes that enable the
efficient use of limited capital and human resources.
The experience of the US, where productivity of the overall economy was enhanced
through eliminating structural problems while expanding IT investment, is a meaningful
lesson for Japan and European countries.

5
1. Labor Productivity in the US
The US economy has been booming for almost nine consecutive years after hitting
bottom in March 1991. One notable characteristic of current expansion is the
acceleration of labor productivity growth. Labor productivity in the non-farm business
sector showed average annual growth of only about 1.5% from the late 1980s to early
1990s (Chart 1). There has been a lot of controversy among economists on this
phenomenon where an increase in IT investment did not lead to an expected
improvement in aggregate productivity. This is often referred to as the “IT paradox”.
(discussed later). However, since 1996, the increase in productivity has become
conspicuous: from the first quarter of 1996 to the third quarter of 1999, average growth
reached 2.5%, almost hitting 3% after 1998.
When breaking down labor productivity of the non-farm business sector into
manufacturing and non-manufacturing industries (Chart 2)2, the accelerated increase in
the manufacturing industry is prominent: 3.1% annually during 1990 to 1994. However,
during 1995 to 1998, productivity jumped to 4.4% on an annual basis. Although the
productivity increase in the non-manufacturing industry is lower compared to
manufacturing industry, there has also been a considerable improvement.
Generally, labor productivity shows a strong growth at the beginning of an economic
recovery mainly due to the recovery in the capacity utilization rate. However, in the
later stage of expansion, growth slows down because of the increase in employment.
Past experience confirmed this trend (Chart 3), where the growth rate of labor
productivity slowed down as the economy achieved a long-term expansion. However,
the current economic boom is quite different from the past, in that the increase in labor
productivity is accelerating as economic expansion becomes prolonged.
In line with the benchmark revision of GDP statistics announced in October 1999,
labor productivity statistics have also been revised. This revision3 of GDP statistics4
2 Figures for manufacturing industry are released by the US Department of Labor.Figures for non-manufacturing industry are the author’s estimation from non-farmbusiness sector and manufacturing sector data.3 NIPA (National Income and Product Accounts) Statistics4 See ANNEX for further details on the benchmark revision of GDP statistics.

6
incorporated changes in the treatment of software that had been purchased or self
developed, which previously was regarded as an “input to production” and thus counted
as part of GDP. This resulted in upward revision of real GDP and labor productivity,
especially in the 1990s when software expenditures rapidly increased (changes caused
by the revision : + 0.3% points in the 1980s, + 0.6% points in the 1990s. <Chart 4>).5
2. Background to the Labor Productivity Increase in US
In this section, various factors that are likely to have led to an increase in labor
productivity are examined; (1) changes in the capital equipment ratio, (2) economic
cycle which led to a decrease in average cost, and (3) technological innovation
embodied as an increase in Total Factor Productivity, TFP.
(1) Capital equipment ratio
Capital equipment ratios (=capital stock/number of employment) for manufacturing
and non-manufacturing industries are shown in Chart 5. In manufacturing industry,
active investment in plant and equipment and a continuous reduction in employment
have constantly pushed up the capital equipment ratio. On the other hand, in non-
manufacturing industry, the ratio has leveled off since the 1980s due to the rapid growth
in the share of labor intensive sectors such as service industries.
This increasing gap in the capital equipment ratio may explain the higher growth of
labor productivity in the manufacturing industry than in non-manufacturing industry.
We should note that, in manufacturing industry, labor productivity is likely to be
overestimated because of the active use of outside labor which is not counted as
employment in manufacturing industry; outside labor is counted as employment in non-
manufacturing industry6. Taking this into consideration, the gap between manufacturing
and non-manufacturing industries is likely to narrow.
5 Labor productivity is calculated by dividing output by labor input. Output calculationis based on GDP statistics. Output of the non-farming sector is calculated by subtractingoutput of the government, farm, and non-profit organization sectors from GDP (share ofnon-farm sector in total GDP was about 76%<1996>).6 If manufacturing industry uses outside labor, output is included in manufacturingindustry, while labor input is counted in the service sector.

7
However, the capital equipment ratio of manufacturing industry has not exceeded the
trend in recent years. Therefore, the increase in the capital equipment ratio cannot be the
main cause for the increase in labor productivity.
(2) Cyclical factor and technological innovation
Next, real GDP growth is decomposed into four factors: (1) capital stock7, (2)labor
force, (3) economic cyclical factor such as utilization of capital and labor, and (4) Total
Factor Productivity (TFP).8
Using a Cobb-Douglas production function, it is estimated that9GDP growth since
1995 is largely due to TFP (Chart 6). Real GDP growth from 1995 to 1998 averaged
3.8%, while the contribution of TFP was just under 50% (1.8%). The contribution of the
rise in the utilization of both capital and labor combined during this period as the
business cycle factor was limited to 0.2%.10 This was due to relatively stable capacity
utilization. Since estimation was based on a homogeneous Cobb-Douglas production
function, there is a problem that increasing returns that can usually be observed during
economic expansion cannot be captured; a part of the cyclical factor can not be
excluded from TFP.11 However, the fact that TFP shows the largest increase in the past
7 In statistics on capital stock, “Fixed Reproducible Tangible Wealth in the UnitedStates” released by the US Department of Commerce (the most recent issue waspublished in September 1998 for 1997), software stock is not included in capital stock.However, to achieve consistency with revised GDP statistics, software capital stock isestimated and added to capital stock.8 In principle, economic growth is considered to be achieved by the increase in resourceinput and technological innovation. As technological innovation is difficult to observe,it is generally calculated by subtracting the quantitative change in input, such as capitaland labor, from real GDP growth, “remaining difference”. Yet, some attention is neededto interpret the “remaining difference”, as it incorporates not only technologicalinnovation, but also the business cycle and other factors.9 A Cobb-Douglas production function is used.10 Gordon[1999] has decomposed productivity growth into factors attributable to theeconomic trend and those attributable to the business cycle using econometrictechniques. The outcome shows that with respect of labor productivity growth of 2.17%during the fourth quarter 1995 to first quarter 1999, factors attributable to the businesscycle are estimated to account for 0.30%, whereas factors attributable to the economictrend, 1.85%.11 There is also the possibility of an improvement in the quality of capital stock andlabor (described later), which is captured as an increase in TFP. Fernald and Basu[1999] pointed out four points as the underlying reasons for productivity to exhibit a
8
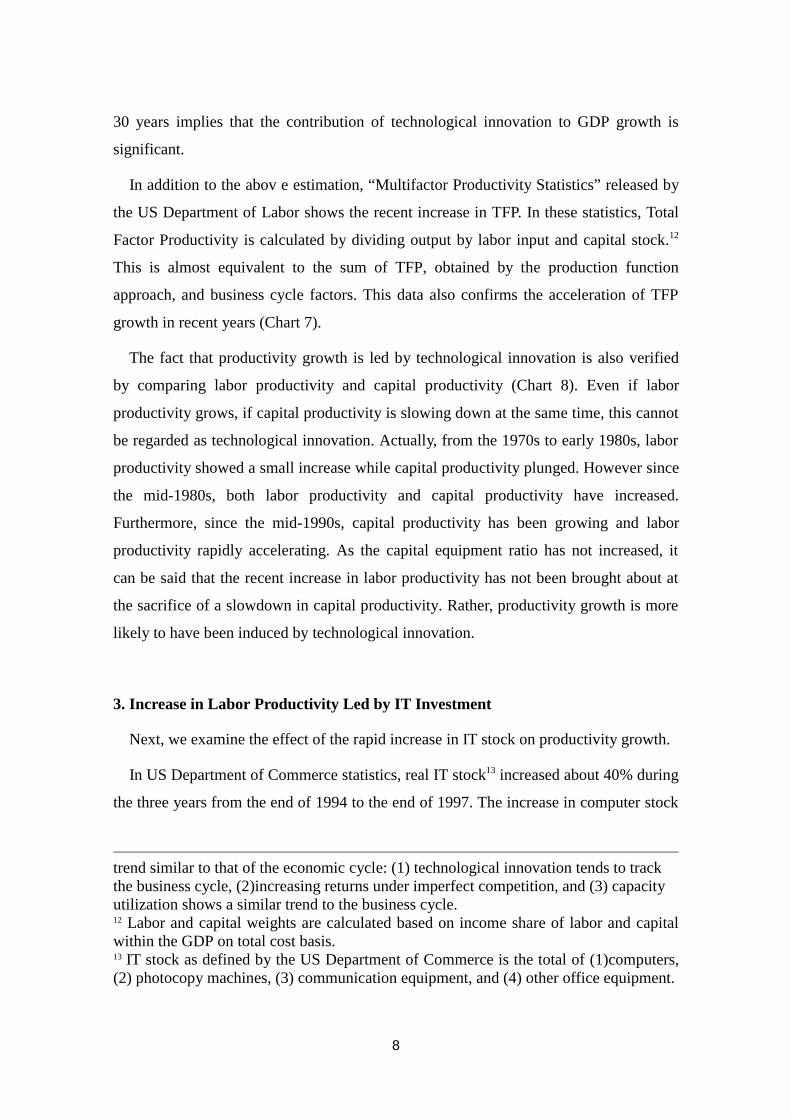
30 years implies that the contribution of technological innovation to GDP growth is
significant.
In addition to the abov e estimation, “Multifactor Productivity Statistics” released by
the US Department of Labor shows the recent increase in TFP. In these statistics, Total
Factor Productivity is calculated by dividing output by labor input and capital stock.12
This is almost equivalent to the sum of TFP, obtained by the production function
approach, and business cycle factors. This data also confirms the acceleration of TFP
growth in recent years (Chart 7).
The fact that productivity growth is led by technological innovation is also verified
by comparing labor productivity and capital productivity (Chart 8). Even if labor
productivity grows, if capital productivity is slowing down at the same time, this cannot
be regarded as technological innovation. Actually, from the 1970s to early 1980s, labor
productivity showed a small increase while capital productivity plunged. However since
the mid-1980s, both labor productivity and capital productivity have increased.
Furthermore, since the mid-1990s, capital productivity has been growing and labor
productivity rapidly accelerating. As the capital equipment ratio has not increased, it
can be said that the recent increase in labor productivity has not been brought about at
the sacrifice of a slowdown in capital productivity. Rather, productivity growth is more
likely to have been induced by technological innovation.
3. Increase in Labor Productivity Led by IT Investment
Next, we examine the effect of the rapid increase in IT stock on productivity growth.
In US Department of Commerce statistics, real IT stock13 increased about 40% during
the three years from the end of 1994 to the end of 1997. The increase in computer stock
trend similar to that of the economic cycle: (1) technological innovation tends to trackthe business cycle, (2)increasing returns under imperfect competition, and (3) capacityutilization shows a similar trend to the business cycle.12 Labor and capital weights are calculated based on income share of labor and capitalwithin the GDP on total cost basis.13 IT stock as defined by the US Department of Commerce is the total of (1)computers,(2) photocopy machines, (3) communication equipment, and (4) other office equipment.

9
was especially remarkable, growing about 2.7 times.14 As a result, the share of IT stock
to total capital stock rose to about 13% by the end of 1997.
It should be noted that the above figures do not include software, which came to be
categorized as capital stock as a result of the revision of GDP statistics in October 1999.
Real IT stock based on software investment data increased by about 25% if software
stock is included. As a result, the share of IT stock to total capital stock is estimated to
be about 16% (Charts 9 and 10).15
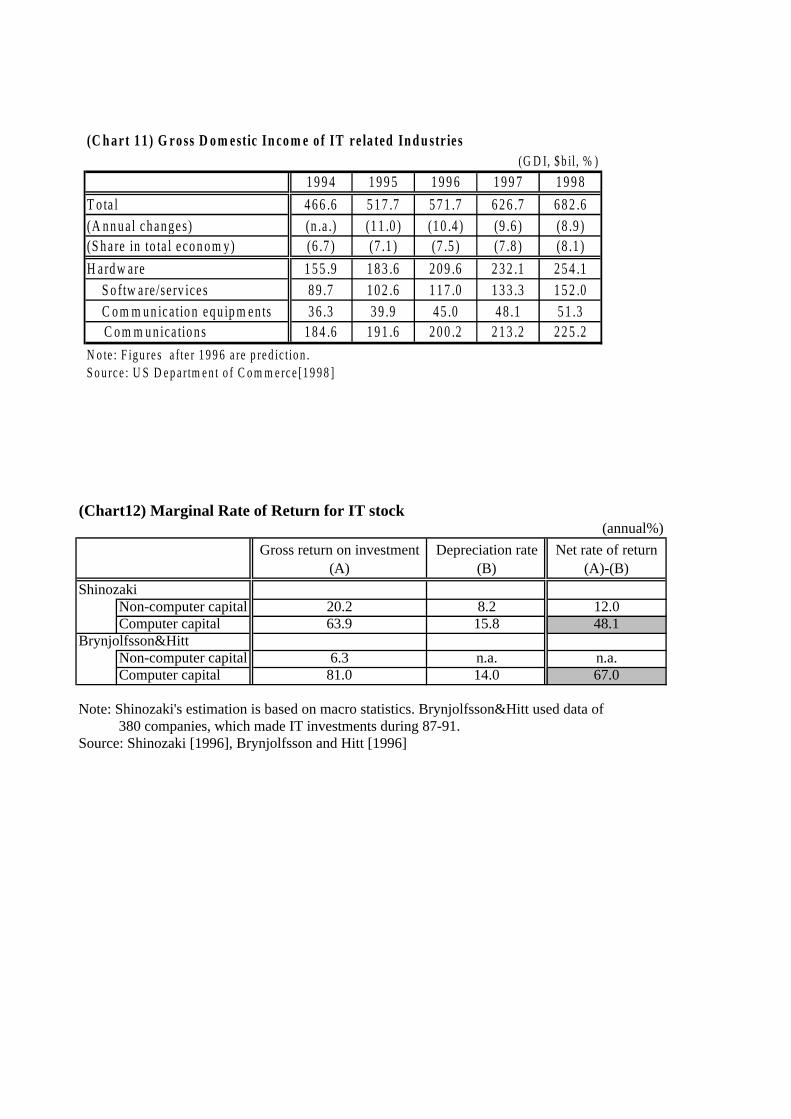
Some empirical research shows that the marginal productivity of IT stock is higher
than that of non-IT stock. For example, Brynjolfsson and Hitt [1996] analyzed 380
companies making IT investments during 1987 and 1991, and found that the marginal
return on IT stock was 81% annually; 67.0% on a net basis when depreciation is
subtracted, while the marginal return on non-IT stock was 6.3%. Also Shinozaki [1996]
showed that the marginal productivity of IT stock was 48.1% on a net basis,
considerably higher than for non-IT capital stock which was 12.0% (Chart 12).
As the proportion of IT stock with higher marginal productivity increases to overall
production resources, productivity is enhanced on a macro basis. To confirm this point
quantitatively, we made a regression on labor productivity by (1) the capital equipment
ratio of non-IT stock, (2) the IT stock ratio (=IT stock/non-IT stock), and (3) the
capacity utilization rate(Chart 13) .16
14 IT stock on a nominal basis increased only about 15% from 1994 to 1997. The drop inprices have contributed to the remarkable increase in the IT stock on a real basis.15 According to the US Department of Commerce [1998], the IT industry market (grossnational income of the industry) has posted around 10% annual growth in recent years.Also, its share within the whole economy has reached around 8% (Chart 11).16 This estimation is based on a Cobb-Douglas production function, which includes ITstock as a production factor (note that values for a and b are estimated from theregression). The following Cobb-Douglas production function is estimated:
( ) ( ) baba t --´´´= 101 KKLTY
where Y= real GDP, L = labor input, K1 = non-IT capital stock, K0= IT stock, andt=capacity utilization ratio.Dividing both sides by L and taking the logarithm of each side, the following equationis obtained:
( ) ( ) ( )tbbaa LnK
KLn
L
KLn
L
YLn **1*)1(constant
1
01 +÷÷ø
öççè
æ--+÷
øö
çèæ-+=÷
øö
çèæ
10
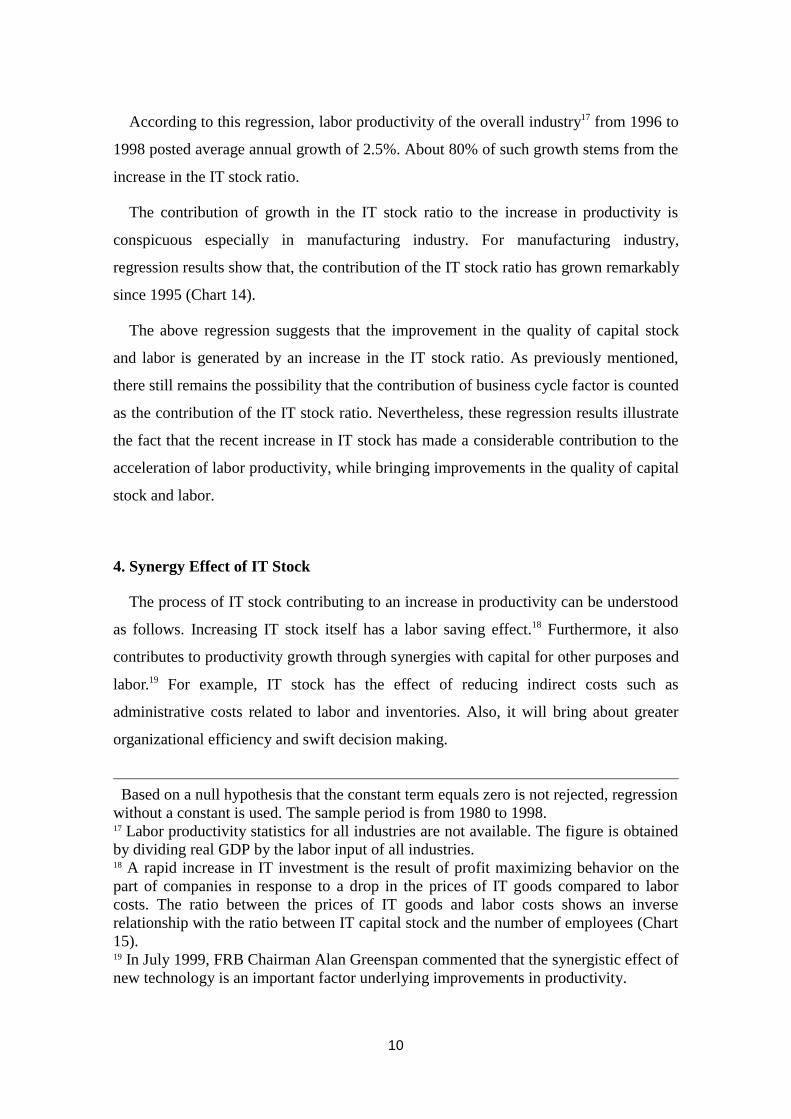
According to this regression, labor productivity of the overall industry17 from 1996 to
1998 posted average annual growth of 2.5%. About 80% of such growth stems from the
increase in the IT stock ratio.
The contribution of growth in the IT stock ratio to the increase in productivity is
conspicuous especially in manufacturing industry. For manufacturing industry,
regression results show that, the contribution of the IT stock ratio has grown remarkably
since 1995 (Chart 14).
The above regression suggests that the improvement in the quality of capital stock
and labor is generated by an increase in the IT stock ratio. As previously mentioned,
there still remains the possibility that the contribution of business cycle factor is counted
as the contribution of the IT stock ratio. Nevertheless, these regression results illustrate
the fact that the recent increase in IT stock has made a considerable contribution to the
acceleration of labor productivity, while bringing improvements in the quality of capital
stock and labor.
4. Synergy Effect of IT Stock
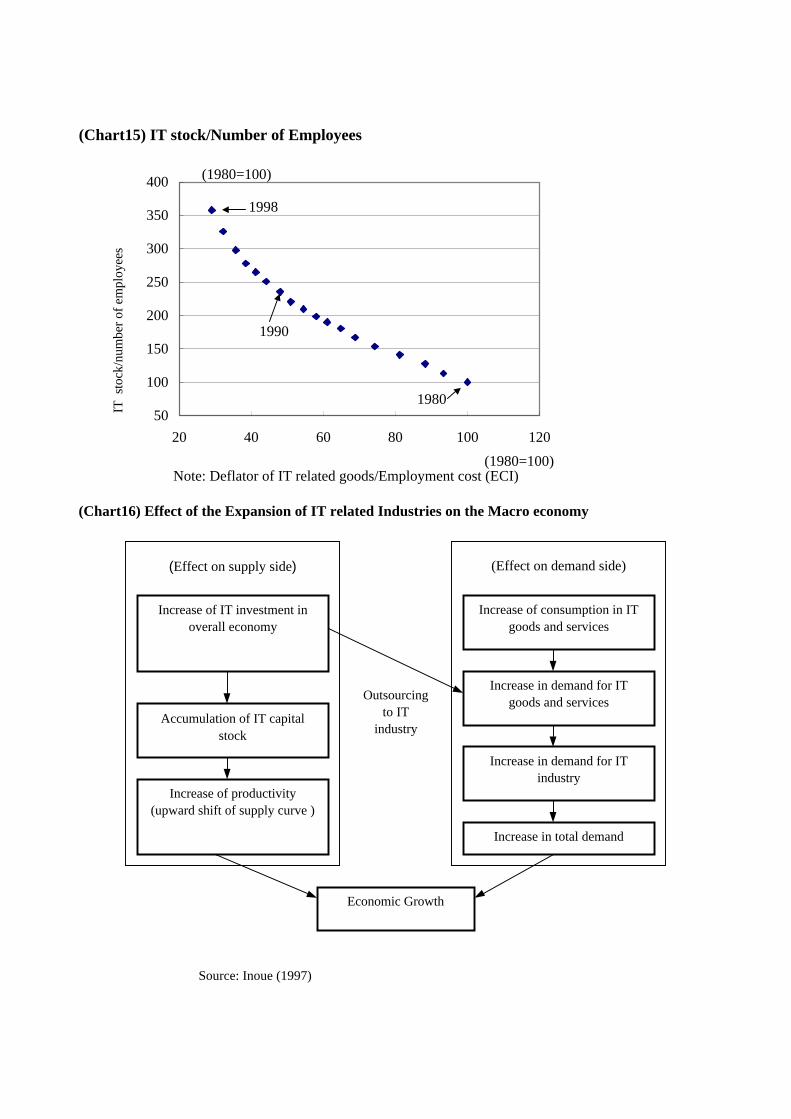
The process of IT stock contributing to an increase in productivity can be understood
as follows. Increasing IT stock itself has a labor saving effect.18 Furthermore, it also
contributes to productivity growth through synergies with capital for other purposes and
labor.19 For example, IT stock has the effect of reducing indirect costs such as
administrative costs related to labor and inventories. Also, it will bring about greater
organizational efficiency and swift decision making.
Based on a null hypothesis that the constant term equals zero is not rejected, regressionwithout a constant is used. The sample period is from 1980 to 1998.17 Labor productivity statistics for all industries are not available. The figure is obtainedby dividing real GDP by the labor input of all industries.18 A rapid increase in IT investment is the result of profit maximizing behavior on thepart of companies in response to a drop in the prices of IT goods compared to laborcosts. The ratio between the prices of IT goods and labor costs shows an inverserelationship with the ratio between IT capital stock and the number of employees (Chart15).19 In July 1999, FRB Chairman Alan Greenspan commented that the synergistic effect ofnew technology is an important factor underlying improvements in productivity.

11
In the process of facilitating organizational efficiency, IT stock is expected to
substitute for low skilled workers. Also, the use of IT will shorten the necessary time for
replacing expensive capital stock and will enable efficient use of existing production
capacity as it will minimize volatility fluctuations in capacity utilization; it will reduce
need for surplus production capacity introduced to meet peak demand. Furthermore,
through the development and introduction of new technologies by more and more
companies, existing goods and services will be provided at lower prices and of higher
quality. This improvement in efficiency is likely to spread to other companies which
purchase goods and services provided by the above mentioned companies, resulting in
the spread of synergistic effects.20
Among those mentioned, effects on the organization of business processes are a
unique characteristic of IT stock. The US Department of Labor [1996] emphasizes that
introduction of IT has the effect of improving the expertise of the workforce by making
the work of each worker less segmented and more integrated as a result of a less
hierarchical organization. Also, Doms, Dunne, and Troske [1997] reports that there is a
positive correlation between IT investment and the skill of workers.
As for effects of IT innovation on the demand side, it is considered that increased
demand for IT goods and services will push up total demand in the economy, thereby
increasing the market size of the IT industry21 (Chart 16). It is often pointed out that the
characteristics of IT innovation in the 1990s were: (1) downsizing, (2) the greater
diffusion of computers among the general public, (3) more networks, and (4) open
systems or prevalence of systems that are inter-connectable with others. Along with the
widespread use of the Internet, these factors have contributed considerably to the
expansion of IT demand. Hence, IT stock is thought to have contributed to the growth
of productivity through demonstrating “network externality” where an increase in the
number of people in demand leads to further enhancement of user utility.
20 See Inoue [1998] on this point. For a comprehensive study on the impact ofinformation technology innovation, see Institute for Monetary and Economic Studies,Bank of Japan [1997].21 For details on the impact of IT innovation on the macroeconomy, see Inoue [1997].

12
5. Labor Productivity and IT Investment by Industry
(1) Labor productivity by industry
To find out how IT investment brings about an increase in productivity, we analyzed
labor productivity by industry.22 First, the private sector was broadly categorized into
ten sectors23and the labor productivity of each was examined. It was found that some
industries such as the construction industry have seen negative growth in labor
productivity since 1995. However, quite a few posted accelerated productivity growth,
i.e. the durable goods manufacturing industry, electric and gas utilities, and the retail
industry (Chart17). Furthermore, detailed analysis of the durable goods manufacturing
industry shows outstanding productivity growth in the electronic machinery and
industrial machinery areas with more than 15% annual growth24 (average annual growth
1995-97: Electronic machinery 22.3%; industrial machinery, 16.8%; Chart 18).
Next, it was found that labor productivity and the IT stock ratio (=IT stock/total
capital stock)25 show a positive correlation by industry. Comparing (1) the gap in
productivity growth between the average of 1995-97 and 1980-94 with (2) differences
in the IT stock ratio from 1990 to 1997 (Charts 19, 20), we found accelerating labor
productivity growth in the durable goods manufacturing industry, especially industrial
22 The labor productivity of each industry is calculated by dividing the real GDP of eachindustry by the number of employed in the industry. However, real GDP used here doesnot include software investment (GDP statistics by each industry under the newframework have not been released yet).23 These industries are construction, durable goods manufacturing, transportation,telecommunication, electric power and gas, finance and insurance and real estate,wholesaling, retailing, and services.24 High growth in the productivity of, electronic machinery and industrial machinery isachieved by rapid growth of GDP and a small increase in the number employed. Thissuggests that there is a high possibility that productivity growth is especiallyaccelerating in the computer-related goods sector (computer and peripheral equipment,electronics parts and others) that has achieved extraordinary high growth during thisperiod. (It should be noted that computer and peripheral equipment are categorizedunder the industrial machinery sector, while electronics parts including semiconductorsare categorized under the electronic machinery sector). Productivity of computer-relatedgoods and electronic parts showed extraordinary high annual growth of 48.5% and47.2 % respectively during 1995-98.25 In this chapter, instead of using IT capital stock/non-IT capital stock, the share of ITstock within total capital stock is defined as the IT stock ratio.
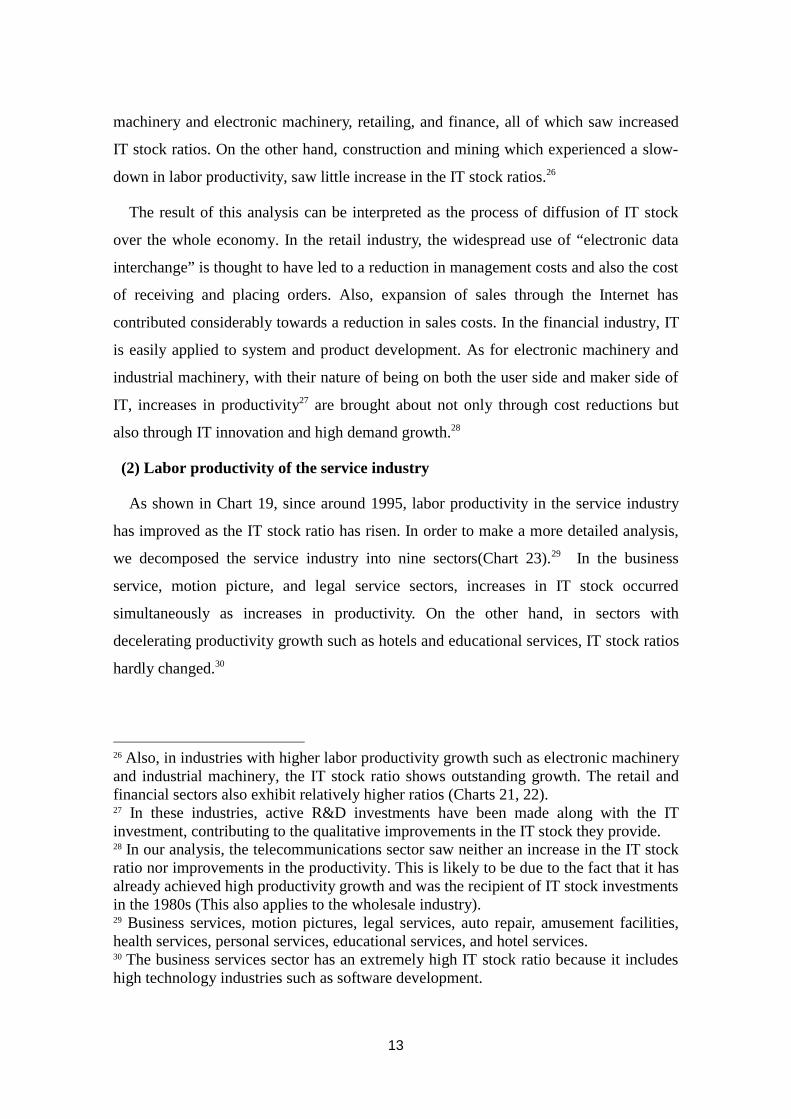
13
machinery and electronic machinery, retailing, and finance, all of which saw increased
IT stock ratios. On the other hand, construction and mining which experienced a slow-
down in labor productivity, saw little increase in the IT stock ratios.26
The result of this analysis can be interpreted as the process of diffusion of IT stock
over the whole economy. In the retail industry, the widespread use of “electronic data
interchange” is thought to have led to a reduction in management costs and also the cost
of receiving and placing orders. Also, expansion of sales through the Internet has
contributed considerably towards a reduction in sales costs. In the financial industry, IT
is easily applied to system and product development. As for electronic machinery and
industrial machinery, with their nature of being on both the user side and maker side of
IT, increases in productivity27 are brought about not only through cost reductions but
also through IT innovation and high demand growth.28
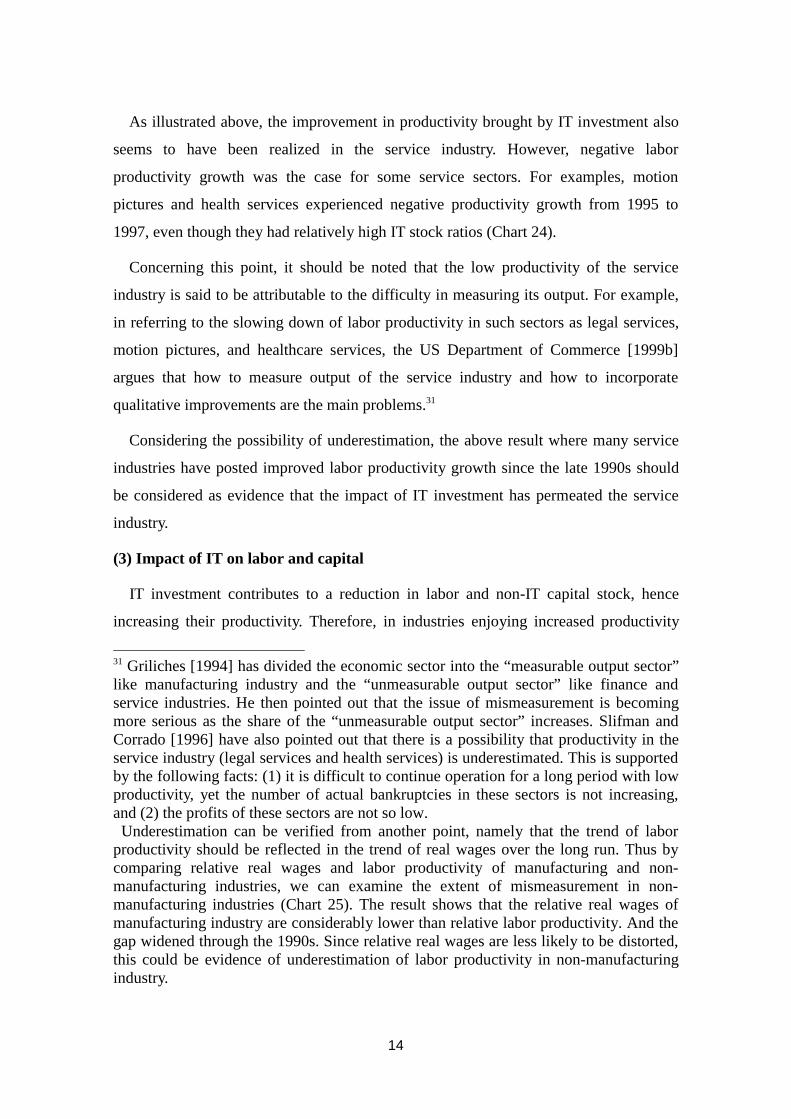
(2) Labor productivity of the service industry
As shown in Chart 19, since around 1995, labor productivity in the service industry
has improved as the IT stock ratio has risen. In order to make a more detailed analysis,
we decomposed the service industry into nine sectors(Chart 23).29 In the business
service, motion picture, and legal service sectors, increases in IT stock occurred
simultaneously as increases in productivity. On the other hand, in sectors with
decelerating productivity growth such as hotels and educational services, IT stock ratios
hardly changed.30
26 Also, in industries with higher labor productivity growth such as electronic machineryand industrial machinery, the IT stock ratio shows outstanding growth. The retail andfinancial sectors also exhibit relatively higher ratios (Charts 21, 22).27 In these industries, active R&D investments have been made along with the ITinvestment, contributing to the qualitative improvements in the IT stock they provide.28 In our analysis, the telecommunications sector saw neither an increase in the IT stockratio nor improvements in the productivity. This is likely to be due to the fact that it hasalready achieved high productivity growth and was the recipient of IT stock investmentsin the 1980s (This also applies to the wholesale industry).29 Business services, motion pictures, legal services, auto repair, amusement facilities,health services, personal services, educational services, and hotel services.30 The business services sector has an extremely high IT stock ratio because it includeshigh technology industries such as software development.
14
As illustrated above, the improvement in productivity brought by IT investment also
seems to have been realized in the service industry. However, negative labor
productivity growth was the case for some service sectors. For examples, motion
pictures and health services experienced negative productivity growth from 1995 to
1997, even though they had relatively high IT stock ratios (Chart 24).
Concerning this point, it should be noted that the low productivity of the service
industry is said to be attributable to the difficulty in measuring its output. For example,
in referring to the slowing down of labor productivity in such sectors as legal services,
motion pictures, and healthcare services, the US Department of Commerce [1999b]
argues that how to measure output of the service industry and how to incorporate
qualitative improvements are the main problems.31
Considering the possibility of underestimation, the above result where many service
industries have posted improved labor productivity growth since the late 1990s should
be considered as evidence that the impact of IT investment has permeated the service
industry.
(3) Impact of IT on labor and capital
IT investment contributes to a reduction in labor and non-IT capital stock, hence
increasing their productivity. Therefore, in industries enjoying increased productivity
31 Griliches [1994] has divided the economic sector into the “measurable output sector”like manufacturing industry and the “unmeasurable output sector” like finance andservice industries. He then pointed out that the issue of mismeasurement is becomingmore serious as the share of the “unmeasurable output sector” increases. Slifman andCorrado [1996] have also pointed out that there is a possibility that productivity in theservice industry (legal services and health services) is underestimated. This is supportedby the following facts: (1) it is difficult to continue operation for a long period with lowproductivity, yet the number of actual bankruptcies in these sectors is not increasing,and (2) the profits of these sectors are not so low. Underestimation can be verified from another point, namely that the trend of laborproductivity should be reflected in the trend of real wages over the long run. Thus bycomparing relative real wages and labor productivity of manufacturing and non-manufacturing industries, we can examine the extent of mismeasurement in non-manufacturing industries (Chart 25). The result shows that the relative real wages ofmanufacturing industry are considerably lower than relative labor productivity. And thegap widened through the 1990s. Since relative real wages are less likely to be distorted,this could be evidence of underestimation of labor productivity in non-manufacturingindustry.
15
growth such as durable goods manufacturing, finance, and retailing, a lowering
proportion of unskilled workers in such areas as administrative support and services due
to substitution by computers is observed. At the same time, the proportion of skilled
workers such as technical jobs is increasing. On the other hand, in the construction and
mining industries where labor productivity growth is declining, the share of skilled
workers is not increasing (Chart 26).
It is notable that in the US the number employed has increased considerably since
the mid-1990s when the increase in productivity growth became conspicuous. The
underlying causes are likely to be the creation of new business opportunities and
increased flexibility of the labor market. Changes in the number employed from early
1995 to end-1998 by industry show (Chart 27) that even in the retail and service
industries, which have been active in making IT investments, the number employed has
increased making a significant contribution to the overall employment increase in the
US.
As seen above, achieving both the expansion of IT investment and an increase in
employment in the overall economy simultaneously is an important factor in ensuring a
productivity increase without having to experience a contraction of the economy
through corporate restructuring.
Also, from the viewpoint of optimization of capital stock, industries with increased
productivity growth have a more stable capacity utilization ratio than those with
decreased productivity growth (Chart 28). This finding reflects stable production and a
reduction in the time necessary for an increase/decrease in capital stock.
6. The “IT Paradox” Controversy
The above results support the hypothesis that IT investment contributes to an increase
in productivity growth. However, there has been a lot of controversy among economists
regarding the relation between IT investment and productivity, which has been termed
the “productivity paradox” or the “IT Paradox”.
Following high labor productivity growth in the 1960s, the US experienced sluggish
labor productivity growth after the first oil crisis, and there has been little improvement

16
since. This phenomenon where productivity of the overall macroeconomy does not
increase despite an increase in IT investment, has been referred to as the “IT paradox”,
and was first discussed in a paper by Baily and Gordon [1988] (although some papers
like that of Nordhaus[1972] pointed out sluggish productivity growth in the 1970s).
A few hypotheses have been put forward to explain this seeming paradox, including:
(1) measurement of output in the service industry is incomplete, (2) IT stock represents
only a small fraction of total capital stock and does not have a large impact on aggregate
production, and (3) it takes time for new technology to be acquired and absorbed by an
economy. Regarding measurement, hypothesis(1), the major problems include
difficulties in correctly measuring output in the service and financial industries and
software expenses not being included in GDP statistics.32 However, official statistics are
showing some improvement. For example, when GDP statistics were comprehensively
revised in October 1999, software expenditure was transformed to be included into
output (as fixed investment). Also, in the banking sector, the output of unpriced services
is now obtained using a wide variety of statistics such as ATM transactions. The small
share of IT stock, hypothesis(2), focuses on the argument that even if computers bring
about high marginal productivity, because the proposition of IT stock in the overall
macroeconomy is too small, the impact is limited. Oliner and Sichel [1994] reported
that the annual contribution of computers to real GDP growth from 1970 to 1992 was
merely 0.16%. As the underlying causes for this, they argue that the share of computers
to total capital stock is significantly small (in 1993, the share of computers to total
capital stock was merely 2%) and also that due to rapid depreciation, growth in
computer stock is not so large on a net basis. The time lag hypothesis(3), applies to such
cases where the introduction of IT by corporations cannot take full effect until such
companies have adopted to new business processes suitable for IT. Furthermore, these
changes are often costly,33 thereby delaying the diffusion of computer technology itself
and taking a long time before they have any significant effect on productivity. On this
32 Papers on measurement error include: Nordhaus [1982], Baily and Gordon [1988],Griliches [1994] and Slifman and Corrado [1996], as well as the Advisory Commissionto Study the Consumer Price Index [1996], Kozicki [1997], Nardhaus [1997].33 For details on adoption cost for the introduction of new technology and itspopularization, see Inoue [1998].

17
point, David [1990] took up electric power technology, which was a major technological
innovation at the time of the second industrial revolution, as an example. He points out
that it took about 30 years for electric power technology to gain more than 50% of the
market share and bring a significant improvement in productivity.
There are still a number of economist who are skeptical about the relation between
productivity and IT investment even after the actual confirmation of growth in labor
productivity. For example, Gordon [1999] categorizes manufacturing industry into the
computer sector and non-computer sector and points out that during the fourth quarter
of 1995 to the first quarter of 1999, the computer sector achieved outstandingly high
productivity growth while the non-computer sector did not show any great improvement.
Also the US Department of Commerce [1999b] categorizes all industries into either the
service sector or goods sector. Each sectors are then classified into those with a
relatively higher share of IT stock per capita (IT users) and those with a relatively lower
share (non-IT users). The Department reports that in the goods sector, high productivity
growth is observed in the IT user group while in the service sector the non-IT user
group shows higher productivity growth.
However, the following facts are found in this paper:
(1) The accelerating growth of labor productivity is confirmed statistically. This trend
has become especially conspicuous since the revision of GDP statistics.
(2) Accelerating productivity growth occurs simultaneously as the share of IT capital
stock rapidly increases.
(3) Analysis by industry also shows that the industries with a higher IT stock ratio attain
higher productivity growth.
(4) Increased productivity is also confirmed in the service industry. Improved
productivity is more conspicuous in industries with a higher IT stock ratio. Although
the growth rate of productivity is still low, many industries have experienced an
improvement since the late 1990s.
These points suggest that the conventional “IT paradox” is not valid anymore34.
34 However, the possibility that it will take some time before the contribution of IT
18
7. The Future of IT Investment in the US and Lessons for Japan and Europe
So far, we have examined the recent trend of labor productivity and its relation with
IT investment. Finally, we discuss prospects for IT investment in the US and lessons of
the US experience for Japan and Europe.
(1)Prospects for IT investment in the US
The fact that active IT investment brought about a notable increase in productivity
will give US companies an incentive to make further IT investments. Looking back at
the 1990s, the following features can be observed: (1) continuous cost reduction efforts
made by US companies to survive within an internationally competitive environment,
and (2) a continuous drop in prices of IT goods. Consequently, demand for IT
investments that substitute for labor is increasing. Furthermore, incentives for more IT
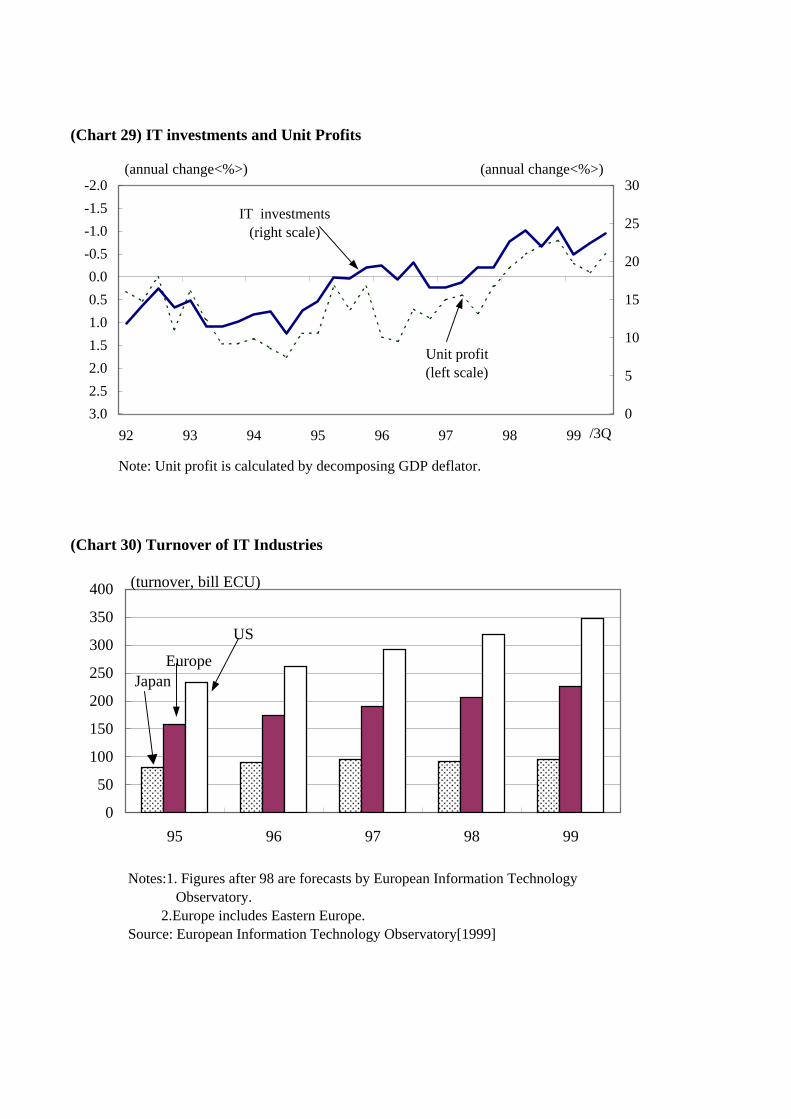
investments are swelling as unemployment decreases and labor costs rise. Actually,
while corporate unit profit has been squeezed due to the increasing cost of labor,35 IT
investment increased (Chart 29). Especially since late 1997, the trend has become
prominent: IT investment has been increasing at a rapid pace, while the unit profit of
US companies dropped caused by the inflow of cheap imported goods from Asian
countries. Also, as seen in Chart 15, there is a relatively stable relation between the ratio
of IT stock/number employed and the ratio of prices for IT stock and labor costs.
Therefore, even if the economy slows down in the future, IT investments are likely to
continue to increase so long as there is cost reduction pressure.36
There may be limits, to some extent, regarding the expansion of IT investment in
certain industries. For example, the construction industry which has a small proportion
of skilled workers and low capital equipment ratio, will have a low incentive for IT
investment to productivity growth becomes apparent is not denied in this paper.35 Unit profit has been calculated by decomposing the GDP deflator of the non-financialbusiness sector.36 If the US economy slows down in the future, upward pressure on employment costswill likely to ease. But, even under such a situation, IT goods prices are expected tocontinue dropping due to technological innovation. Therefore, the ratio of laborcosts/prices of IT goods is not likely to change dramatically. Of course, the importantpoint in discussing the outlook for IT investment is whether it will generate new

19
investment. However, many manufacturing industries such as automobiles and
processed metals are little different from the industrial machinery and electronic
machinery sectors in terms of the composition of employees. Therefore, IT investment
seems to have further room to permeate to various industries in the future thus
promoting labor productivity growth.
On the other hand, attention should be paid to the possibility that if stock prices
plunge, fund raising may become difficult, especially for high-tech industries (such as
computers and software development). As most high-tech companies rely heavily on
equity financing and have also introduced pay schemes such as stock options that are
directly connected to equity market conditions, a drop in share prices may cause serious
problems for expanding operations. Contraction of investment in leading industries can
dampen IT investment demand in the overall economy.37 Attention also needs to be paid
to the possibility that the supply of IT-related workers may be exhausted as the US labor
market tightens.
(2) Lesson for Japan and Europe
IT investment in Japan and Europe is on the rise (Chart 30). There is also a rapid
increase in M&A among corporations with leading information technology. For
example, in the telecommunications area, there is an ongoing trend to form business
alliances to use information networks more efficiently.
However, despite such a trend, accelerated labor productivity growth is not confirmed
in Japan or Europe (Chart 31). Labor productivity growth in Japan and Europe was
higher during 1986 to 1995 than in the US. However, since 1996, while the US has
experienced rapid productivity growth, Japan and Europe have experienced a
deceleration in productivity growth.38 IT innovation has progressed worldwide and the
industries and eventually lead to the expansion of final demand.37 Also, in such an instance, R&D investments may also shrink, which could result in adeterioration of the marginal productivity of IT stock.38 Current Japanese GDP statistics do not count software expenditures as fixedinvestment. This may be one of the causes for the gap in the growth of laborproductivity in Japan and the US.

20
US economy has actually been enjoying the benefits, but not so the Japanese and
European economies. Why not?
It is often said that the United States pioneered the introduction of IT innovation.
However, by its nature, technological knowledge is quickly transferred at marginally
small cost. Therefore, even if US companies hold many basic licenses, it is not the main
factor for the long standing US advantage.
It is not possible either to take an optimistic view that productivity growth will
increase through expansion of IT investments as European economies expand and the
Japanese economy recovers. However, it should be pointed out that some structural
problems prevent IT investment from improving the productivity of the overall
economy in Japan and European countries.
Bearing all this in mind, we can learn much from the US experience in its early stage
of IT innovation. Experiencing recession from 1990 to 1991, the following economic
recovery was rather sluggish. With the end of the Cold War, military expenses were
expected to be cut and redirected towards technological development in the private
sector, but which did not happen. The Council of Economic Advisers to the President
[1993] pointed out that shrinking entrepreneurship as the result of an inflexible tax
system and excessive regulations were the main factors for the sluggish economy. To
solve these structural problems, President Clinton [1993] stated the intention of his
administration to focus on the reactivation of corporate activity as the most important
thrust of economic reform measures. President Clinton proposed changing the tax
system to stimulate the investments of small firms and reducing the huge budget deficit.
Putting these proposals into action, entrepreneurship was again stimulated, leading to
subsequent expansion of the US economy for a long period. This episode shows that
technological innovation alone does not guarantee economic growth, but removing
structural problems which prevent active corporate activity is important.
The above US experience clearly indicates some solutions to the problems in Japan
and Europe where IT innovation does not lead to productivity gains. For IT businesses
to be successful, the following are considered to be important: (1) building corporate
governance system that focuses on business areas with comparative advantage, (2)

21
encouraging competitiveness in financial and capital market so as to distribute risk
capital efficiently to IT businesses; and (3) restructuring and reengineering to make full
use of limited capital and human resources in a competitive environment.
As for corporate governance, US companies have made continuous efforts to
maximize shareholder value by adopting strategies that contributed to reducing costs.
Through the 1990s, US companies continued to pursue reductions in labor costs through
the introduction of computers that were becoming increasingly cheaper. Recently, in
Japan, many companies are starting to adopt clear-cut strategies to maximize
shareholder value.39 But it is often pointed out that priority is still given to on others
such as creditors, customers, and employees.40 As a result, restructuring is sluggish and
not many companies succeed in increasing their productivity through the introduction of
IT stock. The existence of regulations and an uncompetitive environment are the main
obstacles for introducing US-type corporate governance in Japan.41 More efficient
company management is required to survive amid global competition. In adopting
strategies for maximizing shareholder value, accountability, such as explaining
investment decisions to shareholders, is very important.
Regarding competitiveness in financial and capital markets, even the US faced some
difficulties on some occasions despite the existence of a fully developed capital market.
Traditionally, debt financing schemes with fixed interest payments were considered to
be difficult for R&D or IT investment.42 Therefore, a deep and liquid capital market is
indispensable for the growth of IT businesses. In the US, competition in the capital
market became fierce reflecting tax system improvements and stock market growth in
an environment that promoted the starting up of businesses.
39 On this point see Maeda and Yoshida [1999].40 Gibson [1998] gives characteristics of Japanese corporate governance as follows:(1) Corporate management often values internal stakeholders more than generalshareholders.(2) Low presence of institutional investors.(3) Lack of a TOB market.41 As for the development and the impact of deregulation in the US, see Takeuchi andTakeda [1998]. For the current situation and problems regarding deregulation in Japan,see OECD [1999b].42 Myers [1977] explained theoretical issues and Sakuraba [1987] made an empiricalstudy using Japanese corporate data.

22
Consequently, a virtuous cycle has been realized: the capital market has become more
efficient, the supply of risk capital has increased, and investors are increasingly
sophisticated as they search for companies with lower risk and higher return.
Europe, with the introduction of the euro, has seen the rapid transformation of
financial markets such as the opening and expansion of the OTC market. And the same
is true of Japan. However, we should remind ourselves that a new stock market alone
does not promise the efficient supply of risk capital.43 Moreover, in Japan, impairment
of the intermediary function of banks seems to have led to a decline in funds to high-
risk projects like IT investments. Hence, improved management and competitiveness on
the part of financial institutions, tax reform, and introduction of an effective accounting
system are indispensable.
Regarding business restructuring and business process reengineering, US companies
have specialized in businesses in which they have a comparative advantage. Also,
business processes have continuously changed so as to take full use of information
technologies. On the other hand, companies in Japan and Europe are often said to be
reluctant to undergo such drastic management changes against the background of strong
emotional resistance to company acquisitions. According to OECD [1999a], European
companies face much greater difficulty in reducing labor because of strict employment
protection systems in place and complicated dismissal procedures (Chart 33). Such
labor market rigidity is considered to be a reason hindering the flow of labor to the
growing industries and hence an obstacle to economic dynamism.44 With enlargement of
information networks and the outsourcing of internal operations, greater specialty is
required for workers. Therefore, employees are required to constantly upgrade their
skills. Also, in order to survive in a new area where IT is extensively used, replacing
managers with those having a deep knowledge of IT and company acquisitions may be
options for improving competitiveness, even in Japan. As described above, managers as
well as employees are required to take bold action to free themselves from traditions so
43 Although venture capital in Japan has a long history, most such funds flow tocompanies with established creditability (Chart 32). Saga [2000] points out severalissues regarding the recent IPO trend of venture firms.44 Comparing gross job gains and job losses, the US has a high ratio for both, evidencingconsiderable labor market mobility (Chart 34).

23
that optimized resource allocation of labor, capital and technical knowledge stock
appropriate for the IT era can be realized.
The above structural changes cannot be avoided if business management is to be
innovated. As mentioned, such efforts were taken in the early 1990s even in the US.
Japan and Europe can learn much from the past ten years’ experience of the US; namely
the permeation of increasing productivity growth in the overall economy through the
greater efficiency of corporate management employing IT.

24
ANNEX: Main Points of the Comprehensive Revision of US GDP Statistics (October 1999)
The US Department of Commerce [1999a] comprehensively revised GDP statistics in
October 1999. The revision was different from the annual revision in that it included:
(1) definition and classification changes, and (2) statistical changes (a typical case is the
introduction of the Chain Weighted Method in 1996). The following two changes were
effected to measure the effect of IT innovations on GDP statistics:
1. Changes in the Treatment of Software Expenses
The biggest change here is the inclusion of corporate expenditures on software in
GDP statistics as fixed investments. Prior to the revision, only “embedded” software
was counted as fixed investment. Any portion purchased separately from hardware and
also that internally developed were treated as inputs to production and therefore not
included in value added. As a result of revision, portions purchased or internally
developed are included in value added as fixed investments. In the government sector,
software expenditures were previously counted as government consumption, but now
government investment. Furthermore, the depreciation of software stock has been added
to government production and also government consumption. This is because any
services that government assets produce are counted as government production. Since
this is estimated based on input cost, the depreciation of software stock as a cost will
lead to an increase in production. In the household sector, treatment of software
expenditures has not been changed and they are still considered as household
consumption.
2. Change in the method of Calculating Output in the Banking Sector
Revision was made to the calculation of unpriced bank services. Such services were
previously captured based on total labor hours of the financial sector, but following the
revision, they will be estimated based on ATM transactions and electronic fund
transfers, which is expected to enhance the accuracy of productivity statistics in the
banking sector.

25
Bibliography
Inoue, Tetsuya, “Johogijutsu niyoru Keizai eno Impact to Kinyuseisaku no arikata ni
tsuite,” Kinyu Kenkyu, Vol.17, No.4, Institute for Monetary and Economic
Studies, Bank of Japan, 1998
, “Johokakanrensangyo no Seicho to sono Hosokuni okeru Mondai ni tsuite,”
Kinyu Kenkyu, Vol.16, No.4, Institute for Monetary and Economic Studies, Bank
of Japan, 1999
Saga, Takao, “Venture Ikusei no tameno Finance no arikata,” Monthly Kinyu Journal,
Vol.41, No.2, 2000
Sakuraba, Chihiro, “Kigyo no Toushi, Zaimukodo no Bunseki,” in Y. Horie eds., Nihon
no Keikihendo to Kigyokodo, Toyokeizaishinpousha,1987
Shinozaki, Akihiko, “Beikoku ni okeru jyohokanren no Youin, Keizaikoukabunseki to
Nippon no Douko,” Chosa, Vol. 208, Japan Development Bank, 1996
Takeuchi, Junichiro and Takeda Yoko, “Beikoku no Supplyside to Roudoushijou no
Henbou ni tsuite,” Bank of Japan Monthly Bulletin, October, 1998
Small and Medium Enterprise Agency, Chushokigyou Hakusho, 1997
Maeda, Eiji and Yoshida, “Shihonkouritsu wo meguru Mondai ni tsuite,” Bank of Japan
Monthly Bulletin, October, 1999
Institute for Monetary and Economic Studies, “Workshop, Conceptualization wo
megutte,” Kinyu Kenkyu, Vol.16, No.4, Institute for Monetary and Economic
Studies, Bank of Japan, 1997
Yamada, Hisashi, “Akkasuru Roudoushijou to Koyosouzou eno Kadai –Nichibei Koyou
Soushutsu Pattern Hikaku karano implication,” Japan Research Review, Japan
Center for Economic Research, 1998
Advisory Commission to Study the Consumer Price Index, Toward a More Accurate
Measure of the Cost of Living: Final Report to the Senate Finance Committee,
1996
26
Baily, M. and R. Gordon, “The Productivity Slowdown, Measurement Issues, and the
Explosion of Computer Power,” Brookings Paper on Economic Activity (2),
1988
Board of Governors of the Federal Reserve System, Monetary Report to the Congress
Pursuant to the Full Employment and Balanced Growth Act of 1978, 1999
Brynjolfsson, E. and L. M. Hitt, “Paradox Lost? Firm-Level Evidence on the Returns
to Information Systems Spending,” Management Science, April 1996
Clinton, W., A New Direction, Address to Joint Session of Congress, February 1993
Council of Economic Advisers, Economic Report of the President, January 1993
David, P., “The Dynamo and the Computer: An Historical Perspective on the Modern
Productivity Paradox,” AEA Papers and Proceedings, Vol 80 No. 2, 1990
Doms, M., T. Dunne, and K. Troske, “Workers, Wages, and Technology,” Quarterly
Journal of Economics, February 1997
European Information Technology Observatory, European Information Technology
Observatory 99, 1999
Fernald, J. G. and S. Basu, “Why is Productivity Procyclical? Why Do We Care?,”
International Finance Discussion Papers, Board of Governors of the Federal
Reserve System, June 1999
Gibson, M. S., “BIG BANG Deregulation and Japanese Corporate Governance,”
International Finance Discussion Papers, Board of Governors of the Federal
Reserve System, September 1998
Gordon, R., “Has the New Economy Rendered the Productivity Slowdown Obsolete,”
mimeo, Northwestern University, June 1999
Griliches, Z., “Productivity, R&D, and the Data Constraint,” The American Economic
Review, 84(1), 1994
Kozicki, S., “The Productivity Slowdown: Diverging Trends in the Manufacturing and
Service Sectors,” Economic Review, Federal Reserve Bank of Kansas City, First
Quarter 1997

27
Myers, S. C., “Determinants of Corporate Borrowing,” Journal of Financial Economics,
5, 1977
Nordhaus, W., “Traditional Productivity Estimates are Asleep at the Technological
Switch,” Economic Journal, 107, 1997
, “The Recent Productivity Slowdown,” Brookings Papers on Economic
Activity (3), 1972
OECD, Employment Outlook, 1996
, Employment Outlook, 1999a
, Regulatory Reform in Japan, 1999b
Oliner, S. and D. Sichel, “Computers and Output Growth Revisited: How Big is the
Puzzle?,” Brookings Papers on Economic Activity (2), 1994
Slifman, L., and C. Corrado, “Decomposition of Productivity and Unit Costs,” Board of
Governors of the Federal Reserve System, 1996
U. S. Department of Commerce, A Preview of the 1999 Comprehensive Revision of the
National Income and Product Account, 1999a
, The Emerging Digital Economy II, 1999b
, The Emerging Digital Economy, 1998
U.S. Department of Labor, “The Role of Computers in Reshaping the Work Force,”
Monthly Labor Review, August 1996

(Chart1) Labor Productivity (non-farm business sector)
(Chart2) Labor Productivity (manufacturing and non manufacturing sector)
-1.0
0.0
1.0
2.0
3.0
4.0
5.0
80 81 82 83 84 85 86 87 88 89 90 91 92 93 94 95 96 97 98 99
60
70
80
90
100
110
120(1992=100)(annual change<%>)
Note: For 1999, the average for 1Q-3Q is used.
Level of productivity(right scale)
Rate of increase(left scale)
0.0
0.5
1.0
1.5
2.0
2.5
3.0
3.5
4.0
4.5
5.0
70-74 75-79 80-84 85-89 90-94 95-98
(average of annual change<%>)
Note: Data for non-manufacturing are calculated from non-farm sector data and manufacturing data.
(year average)
Manufacturing
Non-manufacturing

(Chart3) Labor Productivity and Economic Cycle
(Chart4) The Revision of Labor Productivity (Nov. 1999)
90
95
100
105
110
115
120
125
130
135
140
0 4 8 12 16 20 24 28 32
(bottom=100)
61/1Q-
82/4Q-
91/1Q-(Current expansion)
75/1Q-
(quarters)Note: The ending point of each line points to the peak of each economic cycle. (As for the current expansion, the ending point points to the data for 99/3Q).
-2.0
-1.0
0.0
1.0
2.0
3.0
4.0
5.0
80 81 82 83 84 85 86 87 88 89 90 91 92 93 94 95 96 97 98 99
(annual change<%>,%point)
Note: For 1999 the average for 1Q-2Q is used.
(<b>Revised figures)
(<a>Previous figures)
Difference between <a> and <b>

(Chart5) Capital Equipment Ratio
(Chart6) Decomposition of real GDP Growth
0.30
0.35
0.40
0.45
0.50
0.55
0.60
0.65
0.70
0.75
0.80
70 71 72 73 74 75 76 77 78 79 80 81 82 83 84 85 86 87 88 89 90 91 92 93 94 95 96 97
Manufacturing
Non-manufacturing
(1992prices<$100million>/1000<person>)
Note: Capital equipment ratio=Capital stock/Number of employees
-1.0
-0.5
0.0
0.5
1.0
1.5
2.0
2.5
3.0
3.5
4.0
4.5
70-74 75-79 80-84 85-89 90-94 95-98
(annual change,<%>)
Cyclical effect TFP Labor
Real GDPCapital stock
Note: Decomposition is based on the following Cobb-Douglas production function:
( ) ( ) aa tr -´´= 1KLTY
where
Y: real GDP, L: labor force ́ working hours, K: real capital stock (including software),T: total factor productivity, r : utilization of labor = (1- unemployment rate),t : capacity utilization, a : Income share of labor
Taking logarithms on both sides and differentiating by time, we obtain
( ) ( )÷÷÷
ø
ö
ççç
è
æ*-+*+*-+*+=
······
tt
arr
aaa 11K
K
L
L
T
T
Y
Y
(Cyclical effects)

(Chart7) Total Factor Productivity (released by Department of Labor)
(Chart8) Labor Productivity and Capital Productivity
-1.0
-0.5
0.0
0.5
1.0
1.5
2.0
2.5
3.0
3.5
70-74 75-79 80-84 85-89 90-94 95-97
(average annual changes<%>)
ManufacturingNon-manufacturing
Non-farm business
Notes: 1. Data for non-manufacturing are calculated from non-farm business data and manufacturing data. 2. For 95-97 TFP, the 95-96 average is used for manufacturing and non-manufacturing.
(year average)
90
92
94
96
98
100
102
104
106
108
110
90 95 100 105 110 115 120 125 130 135 140
Labor productivity
Cap
ital p
rodu
ctiv
ity
(1980=100)
(1980=100)
70
75
80
8
995
98
Notes: 1.Labor productivity=real GDP/number of employees, 2.Capital productivity=real GDP/real capital stock 3.Estimated software stock is included into real capital stock.
90
85

(Chart9) Components of ITstock
(Chart 10) The Share of IT Stock within Total Capital Stock
0
200
400
600
800
1000
1200
1400
80 81 82 83 84 85 86 87 88 89 90 91 92 93 94 95 96 97
(1992 prices,$billion)
Computers and peripheralequipment
Photocopy
Instruments
Other office equipment
Communication equipment
(end of year)
Software
Note: Software stock is an author's estimation.
0
200
400
600
800
1000
1200
1400
70 71 72 73 74 75 76 77 78 79 80 81 82 83 84 85 86 87 88 89 90 91 92 93 94 95 96 97
0
2
4
6
8
10
12
14
16(1992 prices,$billion)(%)
IT stock(left scale)
IT stock / Total capital stock(right scale)
(end of year)Note: Estimated software stock is included into IT stock.
(Chart12) Marginal Rate of Return for IT stock (annual%)
Gross return on investment Depreciation rate Net rate of return(A) (B) (A)-(B)
ShinozakiNon-computer capital 20.2 8.2 12.0Computer capital 63.9 15.8 48.1
Brynjolfsson&HittNon-computer capital 6.3 n.a. n.a.Computer capital 81.0 14.0 67.0
Note: Shinozaki's estimation is based on macro statistics. Brynjolfsson&Hitt used data of 380 companies, which made IT investments during 87-91.Source: Shinozaki [1996], Brynjolfsson and Hitt [1996]
(C h ar t 11 ) G ross D o m estic In co m e o f IT re la ted Ind u str ies(G D I, $ b il , % )
199 4 199 5 199 6 199 7 199 8
T o ta l 466 .6 517 .7 571 .7 626 .7 682 .6(A nn ual changes) (n .a .) (11 .0 ) (10 .4 ) (9 .6 ) (8 .9 )(S hare in to ta l econ omy) (6 .7 ) (7 .1 ) (7 .5 ) (7 .8 ) (8 .1 )
H ardw are 155 .9 183 .6 209 .6 232 .1 254 .1 S o ftw are/serv ices 89 .7 102 .6 117 .0 133 .3 152 .0 C om m un ication equ ipm en ts 36 .3 39 .9 45 .0 48 .1 51 .3
C om m un ica tions 184 .6 191 .6 200 .2 213 .2 225 .2
N o te : F igu res a f te r 1 9 9 6 a re p re d ic t io n .S o u rc e : U S D ep ar tm en t o f C o m m erc e [1 9 9 8 ]

(Chart13) Regression of Labor Productivity (all industries)
(Chart14) Regression of Labor Productivity (manufacturing)
-1.5-1.0-0.50.00.51.01.52.02.53.03.5
86 87 88 89 90 91 92 93 94 95 96 97 98
(annual change,contribution<%>)
Fitted
IT stock ratioCapacity utilizationNon-ITcapital equipment ratio
Actual
-3.0-2.0-1.00.01.02.03.04.05.06.07.0
86 87 88 89 90 91 92 93 94 95 96 97 98
(annual change,contribution<%>)
Fitted
IT stock ratioCapacityNon-ITcapital equipment ratio
Actual
N o te :
(E stim atio n ) ln (L P )= 0 .6 6 5 * ln (K 1/L )+ 0 .2 0 6 * ln (K 0/K 1)+ 0 .2 6 6 *ln (C U )
(2 1 .9 ) (6 1 .9 ) (7 .8 )
w h ere
L P : lab o r p ro d u ctiv ity, C U : cap ac ity u ti liz a tio n ra te
K 1: n o n -IT s to ck , K0: IT s to ck , L : lab o r in p u t, A d jR2= 0 .9 9 8 , D .W .= 1 .3 4 ,
sam p le p erio d : 8 0 -9 8 , f igu res in th e p aren th es is are t-s ta tis tics .
N o te :
(E stim atio n ) ln (L P )= 0 .4 7 8 * ln (K 1/L )+ 0 .3 2 9 * ln (K 0/K 1)+ 0 .4 3 3 *ln (C U )
(9 .4 ) (3 2 .9 ) (9 .8 )
w h ere
L P : lab o r p ro d u ctiv ity, C U : cap ac ity u ti liz a tio n ra te
K 1: n o n -IT s to ck , K0: IT s to ck , L : lab o r in p u t, A d jR2= 0 .9 9 6 , D .W .= 1 .7 2 ,
sam p le p erio d : 8 0 -9 8 , f igu res in th e p aren th es is are t-s ta tis tics .
(Chart15) IT stock/Number of Employees
(Chart16) Effect of the Expansion of IT related Industries on the Macro economy
50
100
150
200
250
300
350
400
20 40 60 80 100 120
1980
1990
1998
IT s
tock
/num
ber
of e
mpl
oyee
s
(1980=100)
Note: Deflator of IT related goods/Employment cost (ECI)(1980=100)
(Effect on supply side)
Increase of IT investment inoverall economy
Accumulation of IT capitalstock
Increase of productivity(upward shift of supply curve )
(Effect on demand side)
Increase of consumption in ITgoods and services
Increase in demand for ITgoods and services
Increase in demand for ITindustry
Increase in total demand
Outsourcingto IT
industry
Economic Growth
Source: Inoue (1997)

(Chart17) Labor Productivity by Industry
(Chart18) Labor Productivity by Industry (durable manufacturing)
-2.0
-1.0
0.0
1.0
2.0
3.0
4.0
5.0
6.0
7.0
80-84 85-89 90-94 95-97
(average annual changes<%>)
-10.0
-5.0
0.0
5.0
10.0
15.0
20.0
25.0
80-84 85-89 90-94 95-97
(average annual changes<%>)
Lumber
Furniture
Glass
Primary metal
Fabricatedmetal
Industrialmachinery
Electronicmachinery
Motor vehicles
ConstructionDurable
manufacturing
Nondurablemanufacturing
Transportation
CommunicationPublic utilities
FinanceWholesale
RetailServices
Note: The labour productivity was calculated by dividing real GDP of each industries by the number of employees(same below).

(Chart19) Correlation between ITstock and Labor Productivity (all industries)
(Chart20) Correlations between IT stock and Labor Productivity (durable manufacturing)
0
1
2
3
4
5
6
7
8
9
10
-5 -4 -3 -2 -1 0 1 2 3 4
Changes in productivity growth (1980-94average 1995-97average)
Decelerating productivity growth Accelerating productivity growth
Cha
nges
inIT
stoc
kra
tio
(1990 to1997, % points)
(%points)
Wholesale
Services
Durable manufacturing
Retail
Public utilities
Non durable manufacturingFinance
Mining Construction
Communicatio
Transportation
0
1
2
3
4
5
6
7
8
9
10
-10 -5 0 5 10 15 20
Changes in productivity growth (1980-94average 1995-97average)(%points)
Cha
nges
in IT
sto
ck r
atio
Industrial machinery
Electronic machinery
Lumber
(1990 to 1997, % points)
Decelerating productivity growth
Furniture
Motor vehicles
Stone and glass products
Fabricated metalproducts
Accelerating productivity growth
Primary metal industries
Notes: 1. Services exclude business services. 2. IT stock ratio= IT stock/ Total capital stock

(Chart21) IT Stock Ratio by Industry (all industries)
(Chart22) IT Stock Ratio (durable manufacturing)
Motor vehiclesPrimary metal
Fabricated metalsGlass
FurnitureLumber
Industrial machinary
Electronicmachinary
0
5
10
15
20
25
30(%)
Decelerating productivity industries Accelerating productivity industries
(as of 1997)
0
5
10
15
20
25
30
35(%)
Accelerating productivity industries Decelerating productivity industries
( as of 1997)
Nondurablemanufacturing
Durablemanufacturing
Communicatio
Minin
Construction Wholesale ServicesTransportation
Publicutilities
Finance Retail

(Chart23) Correlation between IT Stock and Labor Productivity (service industries)
(Chart24) Labor Productivity of Service Sector
-5
0
5
10
15
20
25
30
35
-4 -3 -2 -1 0 1 2 3 4
Business services
IT s
tock
rat
io
Changes in productivity growth (1990-94average 1995-97average)
Accelerating productivity growthDecelerating productivity growth
(% point)
(1990 1997,% point)
Motion pictures
Auto repairs
Legal services
Hotels
Educational services
Personal services
Amusement services
Health services
Business services
Motion pictures
Legal services
Health services
Personal services
Auto repairs
Amusement
Educationalservices
Hotels
-4
-3
-2
-1
0
1
2(95-97 average, %)
Note: IT stock ratio is shown in the parenthesis.
(2.4)(9.5)
(59.1)(5.6)
(29.9)
(4.0)(20.7)(29.3) (3.5)

(Chart 25) Relative Real Wage and Relative Labor Productivity of Manufacturing
(Chart26) The Composition of Occupations( %, %points)
Executive ProfessionalTechnicians Sales Administrative ServiceBlue collarsupport
Durable 12.6--14.3 9.6--10.8 4.1--3.4 2.5--2.5 10.4--9.0 1.4--1.2 59.4--58.9manufacturing (+1.7) (+1.2) (-0.7) (+0.0) (-1.4) (-0.2) (-0.5)
Finance 26.3--28.9 3.1--4.1 2.0--1.9 24.3--24.9 36.9--33.2 3.6--3.8 3.8--3.1(+2.6) (+1.0) (-0.1) (+0.6) (-3.7) (+0.2) (-0.7)
Retail 8.1--8.7 1.7--2.1 0.6--0.9 41.8--42.1 7.7--6.5 23.4--23.2 16.5--16.7(+0.6) (+0.4) (+0.3) (+0.3) (-1.2) (-0.2) (+0.2)
Construction 13.0--16.2 1.9--1.7 0.6--0.6 1.0--0.7 5.4--4.9 0.5--0.3 77.6--75.7(+3.2) (-0.2) (+0.0) (-0.3) (-0.5) (-0.2) (-1.9)
Mining 15.3--16.3 11.2--10.2 3.5--3.1 0.7--1.8 11.0--8.7 1.2--1.4 57.3--58.6(+1.0) (-1.0) (-0.4) (+1.1) (-2.3) (+0.2) (+1.3)
Note: Figures are the occupation share for 1993 and 1998, respectively. (Figures in the parenthesis are the changes in occupation share during this period)
1.00
1.02
1.04
1.06
1.08
1.10
1.12
1.14
1.16
1.18
1.20
707172737475767778798081828384858687888990919293949596979899
0.6
0.7
0.8
0.9
1.0
1.1
1.2
/3Q
Relative Labor productivity(right scale)
Relative Real wage(left scale)
Note: Both wages and productivity are expressed as the ratio of manufacturing to the industry total.
(times) (times)
Pro
du
ctiv
ity a
cce
lera
ting
ind
ust
rie
s P
rod
uct
ivity
de
cele
ratin
g
ind
ust
rie
s

(Chart 27) Changes in the Number of Employees by Industry
(Chart 28) Variance of Capacity Utilization Rate (manufacturing)(%)
Productivity accelerating Productivity decreasing industries industries
Nov.1970-Nov.1973 27.0 25.6
Mar.1975-Jan.1980 32.4 30.0
Nov.1982-Jul.1990 19.2 22.7
Mar.1991-Oct.1999 8.1 13.5
Note: Productivity accelerating industries are; industrial machinery, electronic machinery, lumber, furniture, tobacco, apparel, printing equipment, oil.
Retail Durable
manufacturing
FinanceTransportationServices
WholesaleNon durable
manufacturing
Constructions
Mining
Communications-1
0
1
2
3
4
5
6
Productivity decelerating industries Productivity accelerating industries
Note: The changes between January 1995 and December 1998.
(milllion)
(Chart 29) IT investments and Unit Profits
(Chart 30) Turnover of IT Industries
-2.0
-1.5
-1.0
-0.5
0.0
0.5
1.0
1.5
2.0
2.5
3.0
92 93 94 95 96 97 98 99
0
5
10
15
20
25
30(annual change<%>)
/3Q
IT investments(right scale)
(annual change<%>)
Unit profit(left scale)
Note: Unit profit is calculated by decomposing GDP deflator.
0
50
100
150
200
250
300
350
400
95 96 97 98 99
(turnover, bill ECU)
Japan
US
Europe
Notes:1. Figures after 98 are forecasts by European Information Technology Observatory. 2.Europe includes Eastern Europe.Source: European Information Technology Observatory[1999]

(Chart31) International Comparison of Labor Productivity
(Chart32) Companies Receiving Investment by Venture Capitals
Starting7%
Accelerating55%
Stable34%
Mature5%
Starting56%
Accelerating24%
Stable2%
Mature5%
M&A7%
Seaded6%
Note: The growth stages of venture companies are categorized into the following stages; seaded-- starting--accelerating--stable--mature.Source: Small and Medium Enterprise Agency [1997]
0.0
1.0
2.0
3.0
US Japan Euroarea US Japan Euroarea
( average annual change<%>)
86-95 average 96-98 average
(1.5)
(2.5)
(1.8)
(2.5)
(1.9)
(1.5)
US Japan
Notes: 1. US: real GDP of nonfarm business / labour input (from US Department of Labor)
2. Japan: real GDP / total working hours* number of regularly employed
3. Euro area: real GDP / number of employed (excluding Austria and Luxembourg
<from ECB>)

(Chart 33) Employment Protection System in G7 Countries(point)
Regular procedural Notice for no-fault Difficulty of Aggregateinconveniences dismissals dismissal index
US 0.0 0.0 0.5 0.2Japan 2.0 1.8 4.3 2.7Germany 3.5 1.3 3.5 2.8France 2.8 1.5 2.8 2.3UK 1.0 1.1 0.3 0.8Italy 1.5 2.9 4.0 2.8Canada 0.0 0.8 2.0 0.9Note: The figures show the degree of strictness of the regulations (the larger the more strict).Source: OECD[1999a]
(Chart34) Job Gains and Job Losses
U S Japan G erm any F rance U K(84 -91 ) (85 -92 ) (83 -90 ) (84 -91 ) (85 -91 )
G ro ss jo b g a in s 13 .0 (12 .7 ) 9 .0 12 .7 8 .7O p en in g s 8 .4 (4 .1 ) 2 .5 6 .1 2 .7
E xp an sio n s 4 .6 8 .6 6 .5 6 .6 6 .0G ro ss jo b lo sses 10 .4 (8 .6 ) 7 .5 11 .8 6 .6
clo su res 7 .3 (3 .3 ) 1 .9 5 .5 3 .9co n tractio n s 3 .1 5 .3 5 .6 6 .3 2 .7
N et em p lo ym en t ch an g e 2 .6 (4 .1 ) 1 .5 0 .9 2 .1N o tes: 1 . A nn u a l ra tes as a p ercen t o f to ta l em p lo ym en ts 2 . F o r Jap an th e so u rces o f f ig u res in p a ren th es is a re Y am ad a(1 9 9 8 ) (samplin g period is 91 -94 ).S ou rce: O E C D [1996] , Y am ada [1998 ]