tfp & labor productivity level - regional integration · tfp & labor productivity level ......
TRANSCRIPT
17/11/2014
1
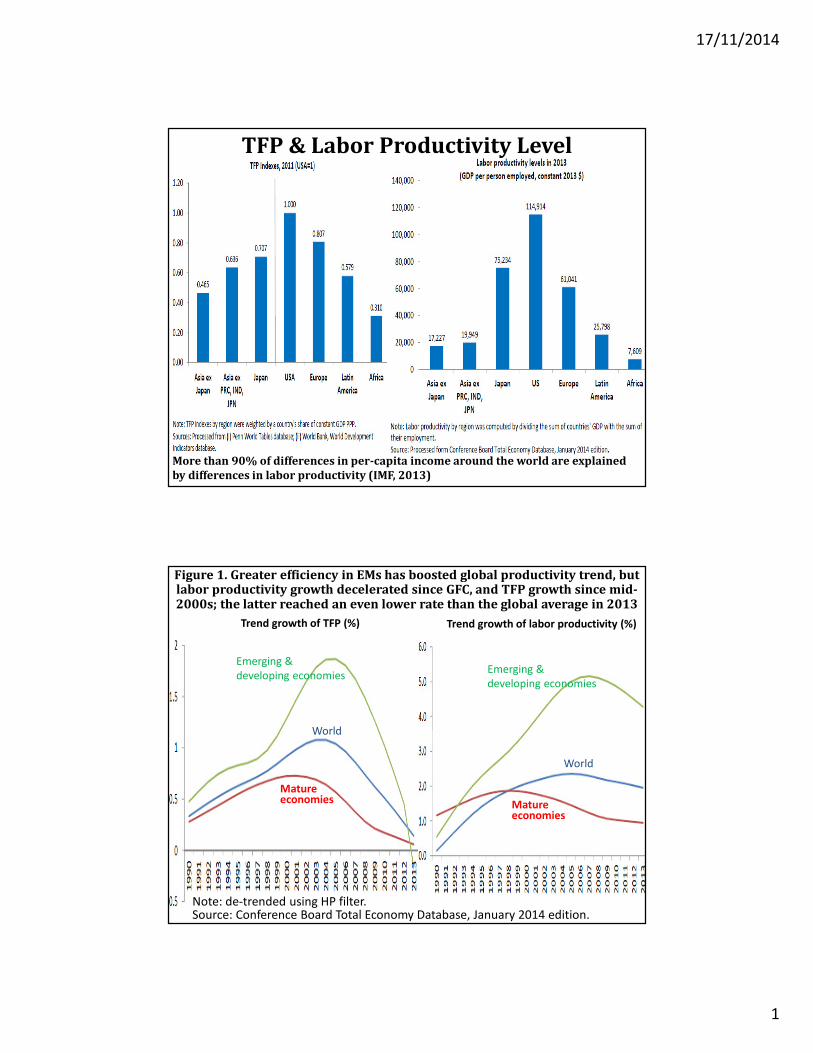
TFP & Labor Productivity Level
More than 90% of differences in per-capita income around the world are explained
by differences in labor productivity (IMF, 2013)
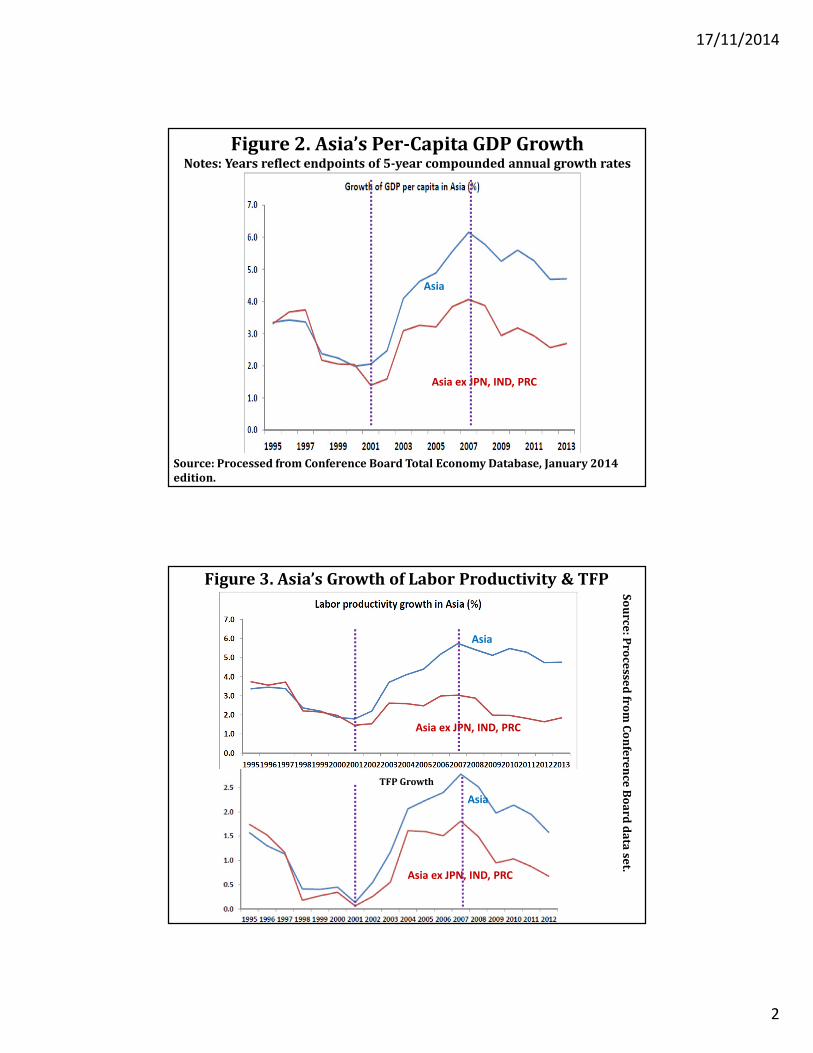
Figure 1. Greater efficiency in EMs has boosted global productivity trend, but labor productivity growth decelerated since GFC, and TFP growth since mid-2000s; the latter reached an even lower rate than the global average in 2013
Note: de-trended using HP filter.Source: Conference Board Total Economy Database, January 2014 edition.
Trend growth of TFP (%) Trend growth of labor productivity (%)
Emerging &
developing economiesEmerging &
developing economies
World
World
Mature economies Mature
economies
17/11/2014
2
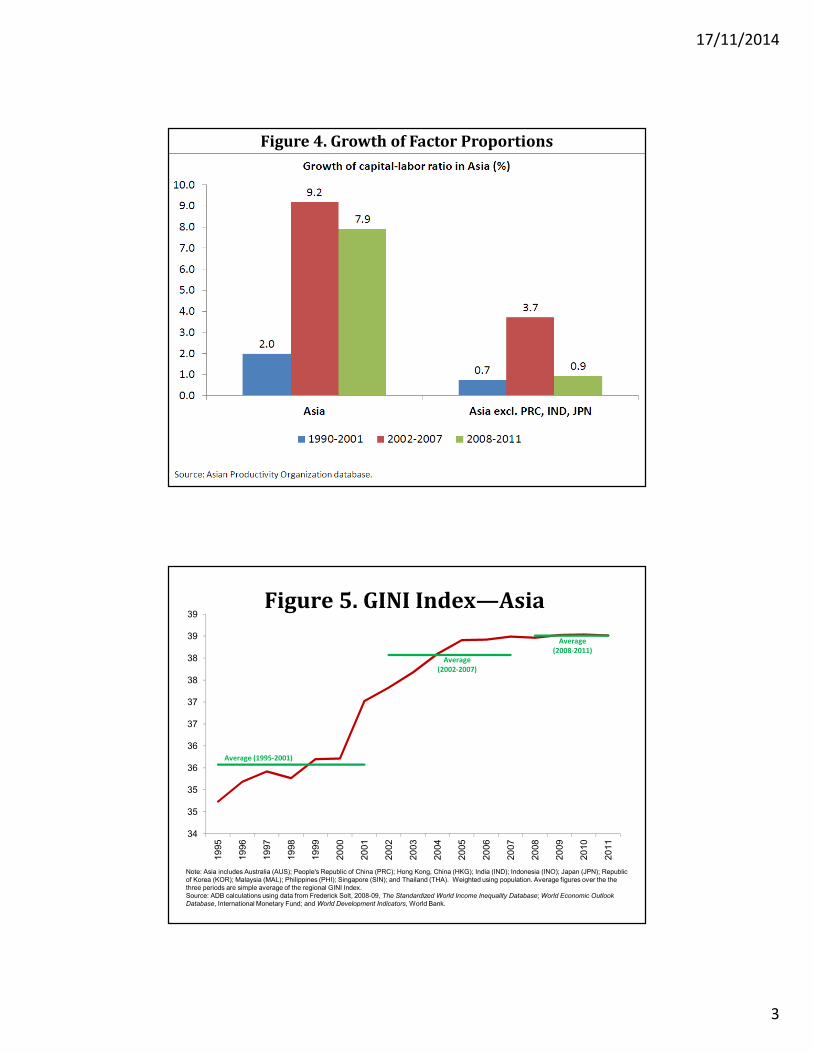
Figure 2. Asia’s Per-Capita GDP GrowthNotes: Years reflect endpoints of 5-year compounded annual growth rates
Asia
Asia ex JPN, IND, PRC
Source: Processed from Conference Board Total Economy Database, January 2014
edition.
Asia
Asia ex JPN, IND, PRC
Figure 3. Asia’s Growth of Labor Productivity & TFP
Asia ex JPN, IND, PRC
Asia
Asia
Asia ex JPN, IND, PRC
TFP Growth
So
urc
e: P
roc
esse
d fro
m C
on
fere
nc
e B
oa
rd d
ata
set.
17/11/2014
3
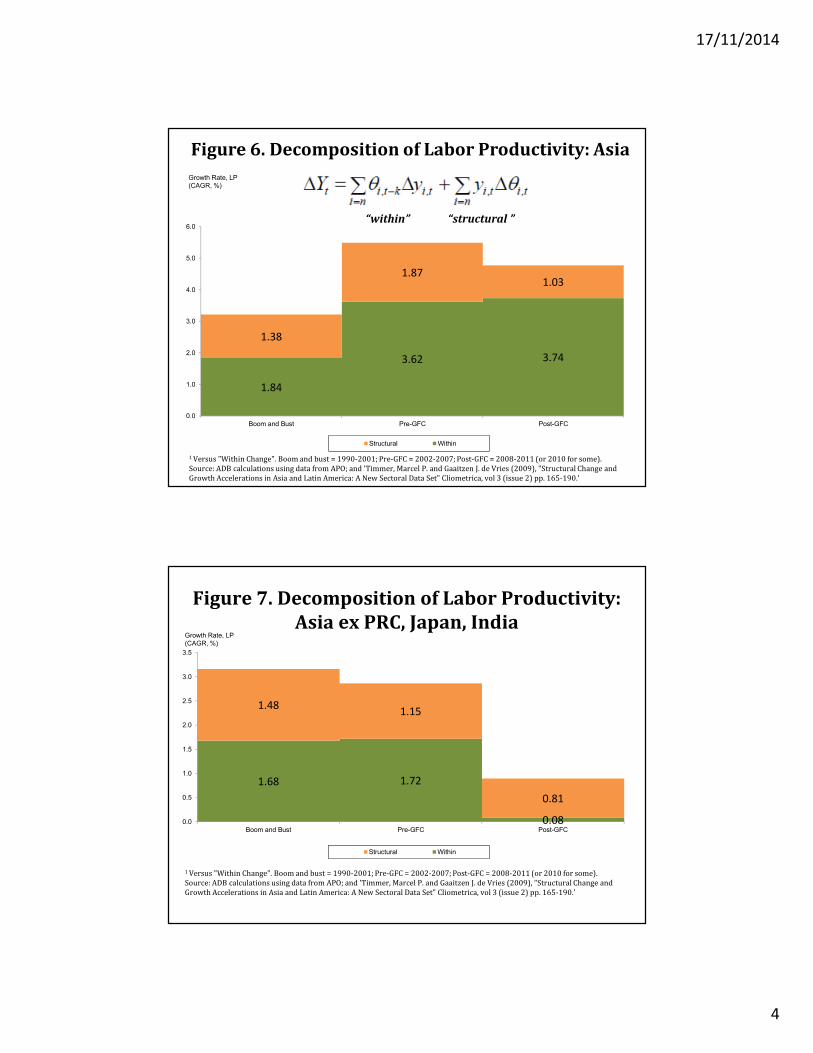
Figure 4. Growth of Factor Proportions
34
35
35
36
36
37
37
38
38
39
39
19
95
19
96
19
97
19
98
19
99
20
00
20
01
20
02
20
03
20
04
20
05
20
06
20
07
20
08
20
09
20
10
20
11
Note: Asia includes Australia (AUS); People's Republic of China (PRC); Hong Kong, China (HKG); India (IND); Indonesia (INO); Japan (JPN); Republic
of Korea (KOR); Malaysia (MAL); Philippines (PHI); Singapore (SIN); and Thailand (THA). Weighted using population. Average figures over the the
three periods are simple average of the regional GINI Index.
Source: ADB calculations using data from Frederick Solt, 2008-09, The Standardized World Income Inequality Database; World Economic Outlook
Database, International Monetary Fund; and World Development Indicators, World Bank.
Figure 5. GINI Index—Asia
Average (1995-2001)
Average
(2002-2007)
Average
(2008-2011)
17/11/2014
4
1.84
3.62 3.74
1.38
1.871.03
0.0
1.0
2.0
3.0
4.0
5.0
6.0
Boom and Bust Pre-GFC Post-GFC
Structural Within
Growth Rate, LP
(CAGR, %)
1 Versus "Within Change". Boom and bust = 1990-2001; Pre-GFC = 2002-2007; Post-GFC = 2008-2011 (or 2010 for some).
Source: ADB calculations using data from APO; and 'Timmer, Marcel P. and Gaaitzen J. de Vries (2009), "Structural Change and
Growth Accelerations in Asia and Latin America: A New Sectoral Data Set" Cliometrica, vol 3 (issue 2) pp. 165-190.'
Figure 6. Decomposition of Labor Productivity: Asia
“within” “structural ”
1.68 1.72
0.08
1.481.15
0.81
0.0
0.5
1.0
1.5
2.0
2.5
3.0
3.5
Boom and Bust Pre-GFC Post-GFC
Structural Within
Figure 7. Decomposition of Labor Productivity:
Asia ex PRC, Japan, IndiaGrowth Rate, LP
(CAGR, %)
1 Versus "Within Change". Boom and bust = 1990-2001; Pre-GFC = 2002-2007; Post-GFC = 2008-2011 (or 2010 for some).
Source: ADB calculations using data from APO; and 'Timmer, Marcel P. and Gaaitzen J. de Vries (2009), "Structural Change and
Growth Accelerations in Asia and Latin America: A New Sectoral Data Set" Cliometrica, vol 3 (issue 2) pp. 165-190.'
17/11/2014
5
AGR
MFG
MIN
TCS
EGW
CON
WRT
FI CSP
AGR
MFG
MIN
TCS
EGW CON
WRTFI
CSP
AGRMFG
MIN
TCS
EGW
CON
WRT
FICSP
-4.0
-2.0
0.0
2.0
4.0
6.0
8.0
10.0
-0.1 -0.08 -0.06 -0.04 -0.02 0 0.02 0.04 0.06
Av
era
ge
An
nu
al G
row
th R
ate
of
Se
cto
ral P
rod
uct
ivit
y
Change in Employment Share
Figure 8. Correlation between Growth of Sectoral
Productivity and Changes in Employment Shares in Asia
Green bubbles/ line = Boom and Bust (1990-2001)
Red bubbles/line = Pre-GFC (2002-2007)
Blue bubbles/line = Post-GFC (2008-2011)
Notes:
1. Size of circle represents employment share in: 1990 (green bubble); red (green bubble); 2008 (blue bubble). Growth rate uses CAGR.
2. Abbreviations: AGR = Agriculture, Hunting, Forestry and Fishing; MIN = Mining and Quarrying; MFG = Manufacturing; EGW = Electricity, Gas and Water Supply; CON =
Construction; WRT = Wholesale and retail trade, hotels and restaurants; TCS = Transport, communication and storage; FI = Financial Intermediation, Real Estate, Renting
and Business Activities; CSP = Community, Social and Personal services.
Source: ADB calculations using data from APO; and 'Timmer, Marcel P. and Gaaitzen J. de Vries (2009).
Pre-GFC vs Post-GFC: Some sectors whose labor productivity accelerated are those that did not
grow fast (MFG, TCS and CSP).
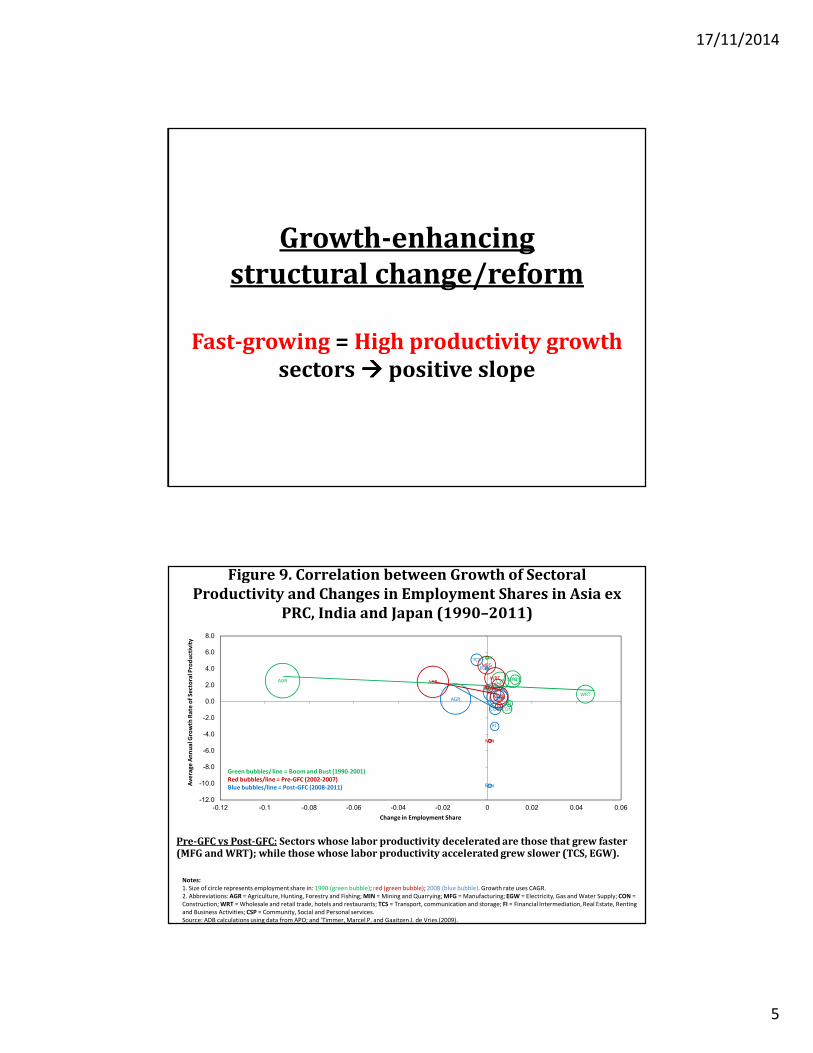
Growth-enhancing
structural change/reform
Fast-growing = High productivity growth
sectors ���� positive slope
AGR
MFG
TCS
MIN
EGW
CON
WRT
FI
CSP
AGR MFGTCS
MIN
EGW
CON
WRT
FI
CSPAGR
MFG
TCS
MIN
EGW
CON
WRT
FI
CSP
-12.0
-10.0
-8.0
-6.0
-4.0
-2.0
0.0
2.0
4.0
6.0
8.0
-0.12 -0.1 -0.08 -0.06 -0.04 -0.02 0 0.02 0.04 0.06
Av
era
ge
An
nu
al G
row
th R
ate
of
Se
cto
ral P
rod
uct
ivit
y
Change in Employment Share
Figure 9. Correlation between Growth of Sectoral
Productivity and Changes in Employment Shares in Asia ex
PRC, India and Japan (1990–2011)
Green bubbles/ line = Boom and Bust (1990-2001)
Red bubbles/line = Pre-GFC (2002-2007)
Blue bubbles/line = Post-GFC (2008-2011)
Pre-GFC vs Post-GFC: Sectors whose labor productivity decelerated are those that grew faster (MFG and WRT); while those whose labor productivity accelerated grew slower (TCS, EGW).
Notes:
1. Size of circle represents employment share in: 1990 (green bubble); red (green bubble); 2008 (blue bubble). Growth rate uses CAGR.
2. Abbreviations: AGR = Agriculture, Hunting, Forestry and Fishing; MIN = Mining and Quarrying; MFG = Manufacturing; EGW = Electricity, Gas and Water Supply; CON =
Construction; WRT = Wholesale and retail trade, hotels and restaurants; TCS = Transport, communication and storage; FI = Financial Intermediation, Real Estate, Renting
and Business Activities; CSP = Community, Social and Personal services.
Source: ADB calculations using data from APO; and 'Timmer, Marcel P. and Gaaitzen J. de Vries (2009).
17/11/2014
6
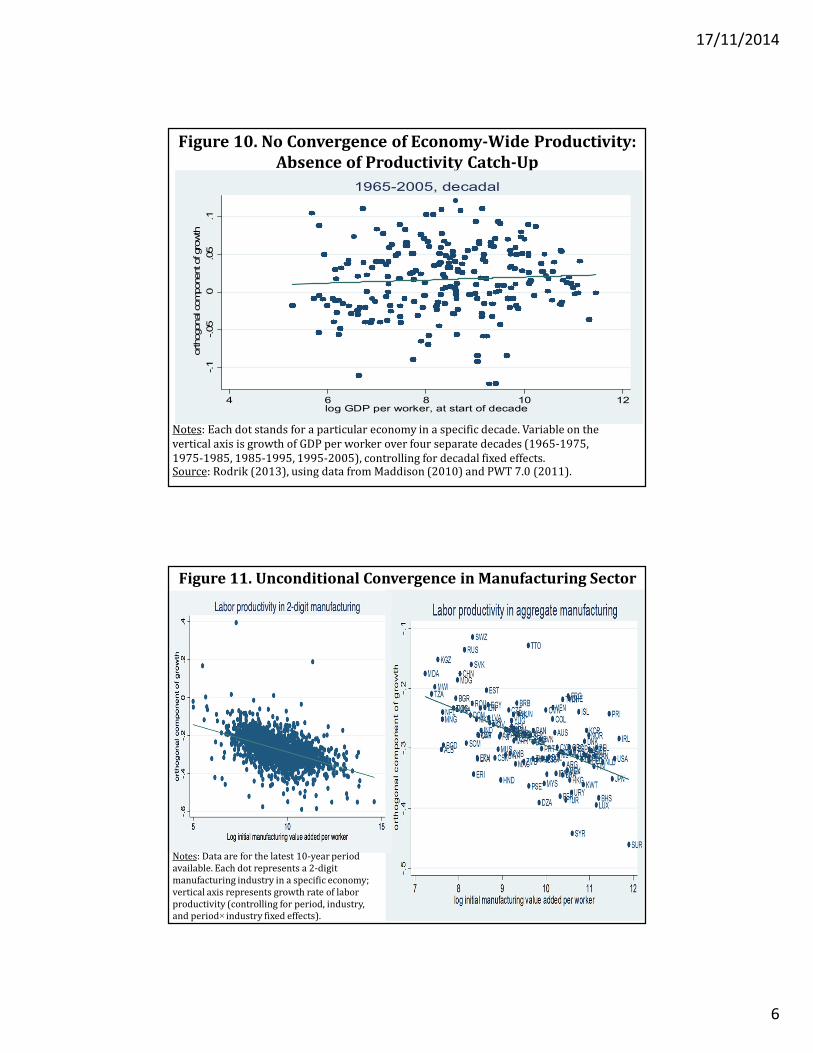
Figure 10. No Convergence of Economy-Wide Productivity:
Absence of Productivity Catch-Up
Notes: Each dot stands for a particular economy in a specific decade. Variable on the
vertical axis is growth of GDP per worker over four separate decades (1965-1975,
1975-1985, 1985-1995, 1995-2005), controlling for decadal fixed effects. Source: Rodrik (2013), using data from Maddison (2010) and PWT 7.0 (2011).
-.1
-.05
0.0
5.1
orthogonal com
ponent of gro
wth
4 6 8 10 12log GDP per worker, at start of decade
1965-2005, decadal
Notes: Data are for the latest 10-year period
available. Each dot represents a 2-digit
manufacturing industry in a specific economy;
vertical axis represents growth rate of labor
productivity (controlling for period, industry,
and period×industry fixed effects).
Figure 11. Unconditional Convergence in Manufacturing Sector
17/11/2014
7
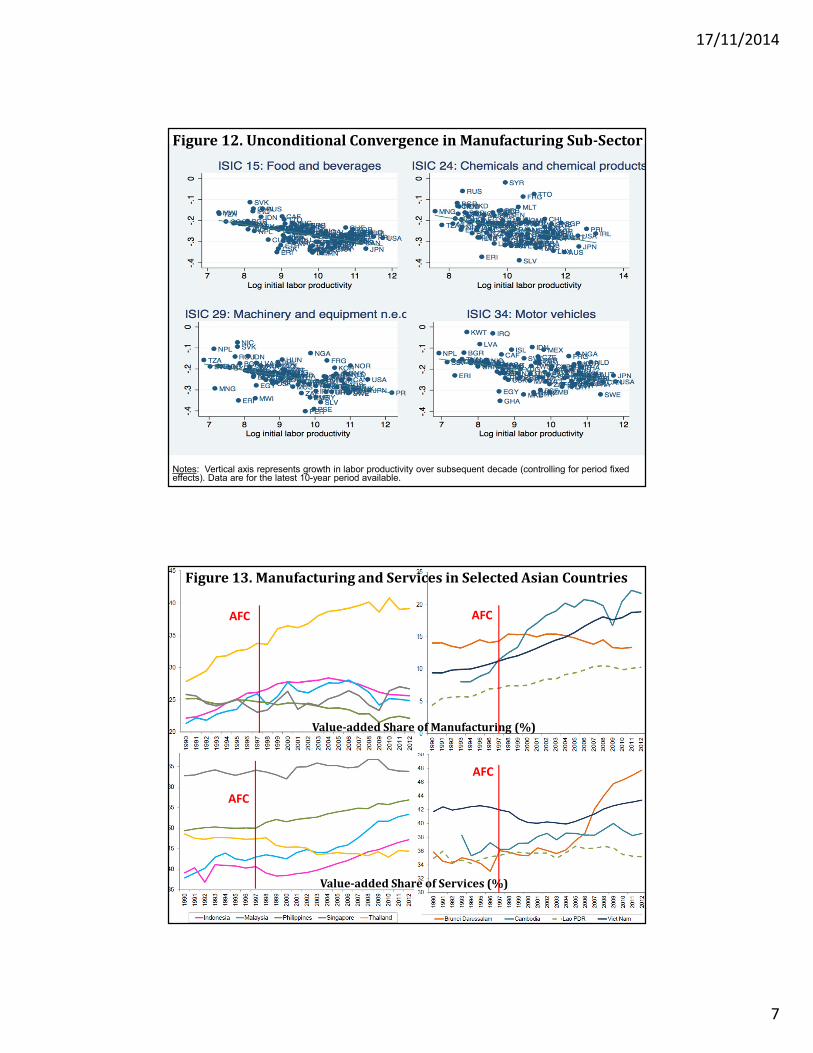
Figure 12. Unconditional Convergence in Manufacturing Sub-Sector
Notes: Vertical axis represents growth in labor productivity over subsequent decade (controlling for period fixed effects). Data are for the latest 10-year period available.
Value-added Share of Services (%)
Value-added Share of Manufacturing (%)
AFC AFC
AFC
AFC
Figure 13. Manufacturing and Services in Selected Asian Countries