ii - india environment portal pradesh state... · well being of humanity by maintaining ecological...
TRANSCRIPT


ii
Andhra PradeshState of Forest Report - 2012
Copyright © AP Forest Department, Hyderabad
AP Forest DepartmentAranya Bhavan, Saifabad,Hyderabad - 500 004Tel : 040- 23231538, Fax: 040-23240541Website : www.forest.ap.nic.in
www.apforest.orgwww. apfdgis.comwww.apforest.gov.in
E-mail : [email protected]
November - 2012
Designed and Printed at Sree Krishnaprasad Graphics Pvt.Ltd., # 2-3-643/B, Near Ali Cafe,Beside H.M.W.S & S. Board , Prem Nagar, Amberpet, Hyderabad - 500 013. Ph: 040-27400671,72.
Cell : 9440155212. E-mail : [email protected]
1000 Copies

iii
CHIEF MINISTER
ANDHRA PRADESH
It gives me immense pleasure to learn that the Andhra Pradesh Forest Department is bringing
out 3rd Annual “Andhra Pradesh State of Forest Report 2012”. The report shows areas of
growth and drain precisely with geographical locations, which greatly helps in protection and
management of Forests and Wildlife. The report includes the analysis of Forest fires in the
State, which has immense importance in creation of a healthy Forest. This, coupled with
analysis of Forest cover in Protected Areas and Vana Samrakshana Samithies (VSS) areas
gives an insight into the conditions of Wildlife areas and impact of involvement of the
communities in the protection of Forests .
I am extremely happy that Andhra Pradesh is the only state in the Country, which is capable of
bringing out such an Annual “State of Forest Report” using LISS III data of Indian Remote
Sensing Satellites.
I congratulate the PCCF (HoFF) and his entire team for bringing out this excellent report.
MESSAGE
N. KIRAN KUMAR REDDY
N. KIRAN KUMAR REDDY
21-11-2012Hyderabad

iv
The second decade of the new millennium is being observed as the United Nations “Decade
on Bio-diversity” and the eleventh meeting of the Conference of Parties (COP) to the
convention on Biological Diversity is organized in the State at Hyderabad in October 2012. It is
an accepted fact that forest is the habitat for the majority of Biodiversity. Against this backdrop
conservation and protection of our forests becomes crucial. The “Andhra Pradesh State of
Forest Report 2012” brought out by Andhra Pradesh Forest Department assumes
significance as it determines the loss and drain of our biological resources using satellite
technology almost in near real-time. I feel happy that such a report is brought out every year
which helps us in Conservation, Protection and Planning of our Natural Resources. I hope the
publication will help every forester, planner and Wildlife enthusiast of the Country.
MESSAGE
SATRUCHARLA VIJAYA RAMA RAJU
SATRUCHARLA VIJAYA RAMA RAJU
MINISTER OF FORESTS, ENVIRONMENT
SCIENCE & TECHNOLOGY
Room No . 326, 2nd Floor,D-Block, A.P. Secretariat,
Phones : 040-23450533 (O)040-23379749 (R)
22-09-2012Hyderabad

v
MESSAGE
M. SAMUEL
M. SAMUEL, I.A.S.,
Special Chief Secretary to Government
ENVIRONMENT, FORESTS, SCIENCE &TECHNOLOGY DEPARTMENTGovernment of Andhra Pradesh
D-Block, 2nd Floor, Room No. 327A,A.P. Secretariat, Hyderabad - 500 022.
Ph : +91-40-23453111, 23451440Fax : +91-40-23451440
Res : +91-40-2339 5500
Forests are Renewable resources and the existence of human beings and their livelihood,
especially people living in rural areas is closely linked to the Forests. The rich diversity of our
forest resources that yield fuel, fodder, timber and edible prouducts, should be studied so that
requirement of dependent communities are met. Forest areas in Andhra Pradesh represent a
varied composition consisting of diverse species. Many of the species are not commercially
viable, but they are part of the forest ecosystem performing their role in Nature. To distinguish
the species and their availability, it is essential to assess their spatial distribution and quantify
the availability.
I am happy to know that our Forest Department is bringing out “Andhra Pradesh State of Forest
Report 2012” which depicts the changes in forest cover in the State between 2009 (October -
December) and 2010 (October - December). Preparation of such periodic reports help the
department in proper planning and fixing the priorities in planned development of our State.
I congratulate the Prl. Chief Conservator of Forests and his team of IT Wing who have toiled
hard to bring out such a good and comprehensive report with proper analysis of the data collected.
21-09-2012Hyderabad

vi
Andhra Pradesh is the 4th largest State of India in terms of geographical area. Approximately
one fourth of this area is occupied by notified forests. Including the trees outside the forests,
approximately 27% of the area is bearing the tree cover. The forests play a crucial role in the
well being of humanity by maintaining ecological balance and there by providing environmental
stability. However the ever growing population of human beings as well as cattle head exerts
heavy biotic pressure on the forests leading to quantitative as well as qualitative degradation
of the forests. Therefore it is necessary to measure and monitor the effects of biotic pressure
on the health of the forests periodically. The Forest Survey of India (FSI) has been undertaking
this task on a two-year cycle, using RS & GIS technology since 1987 and presenting the
results nationwide through its India State of Forest Reports. However these reports have
presented a macro level picture, giving details only up to District level. Whereas for day to day
challenges of management of forest and wildlife protection, details up to Beat and Compartment
levels are necessary. The Geomatics Centre of this Department has been interpreting the
satellite images since 1996 and providing crucial inputs to the field officers. However since
2010 the IT wing has brought out AP State of Forest Reports on par with the India State of
Forest Reports, for the State of Andhra Pradesh. The Geomatics Centre of the Department is
now equipped with latest hardware and software and technically qualified officers and person
power. The present SFR 2012 is the third such report in the series. It gives very precise and
accurate information about the changes in forest cover up to Beat level. The Officers and Staff
of IT Wing have toiled hard to bring out this publication. I congratulate the APCCF (IT) and his
team for this effort.
FOREWORD
S.V. KUMAR, IFSPrl. Chief Conservator of Forests & HoFF
Andhra Pradesh, Hyderabad08-11-2012Hyderabad

vii
The Andhra Pradesh State of Forest Report 2012 is the third SFR produced by IT Wing of Andhra
Pradesh Forest Department using LISS III data of 2009 & 2010 IRS P6 Satellite. The work of
interpretation has been confined to the notified forests only to assess positive and negative changes
in the forest cover. The earlier 2 APSFRs published in 2010 and 2011 were of great help to the field
officers and planners as it gave reliable and accurate details of forest cover change in various
Divisions up to Beat / Compartment level. This was difficult to detect and cumbersome to delineate
by using traditional methods in a short span of period. It is believed that the present Report- APSFR
2012 will also prove to be highly useful to the field officers in improving the forests by way of
devising better and effective strategies for protection and will act as Decision Support System. The
broad contents of the APSFR 2012 are summarized below;
Chapter-I deals with the Introduction wherein a brief about Andhra Pradesh forests and activities
of Geomatics wing are presented.
Chapter-II deals with the satellite data used and the procedure adopted, limitations of technology,
the accuracy aspects and summary of the cost of generation of the APFSR 2012.
Chapter –III deals with State wide results and the extent of various forest canopy cover classes in
various Divisions, VSS areas, Protected Areas (PAs) and a brief analysis of changes between
2009 end & 2010 end.
Chapter-IV lists the Forest Division wise changes in forest canopy cover between various classes
up to Beat level; where changes have occurred.
Chapter -V deals with forest canopy cover change Statistics in Protected Areas.
Chapter – VI deals with forest canopy cover change Statistics in Joint Forest Management or VSS
areas.
Chapter - VII is a new chapter dealing with details of forest fires occurring in Andhra Pradesh.
There has been considerable improvement in the interpretation on account of receiving in
time online feedback through FCCMIS module of APFMIS. It is hoped that this report shall assist
the planners and field Officers in managing the natural resources more effectively.
PREFACE
P.K. SHARMA, IFSAddl. Prl. Chief Conservator of Forests (IT)
01-11-2012Hyderabad

viii
Bringing out a wall to wall mapping and delineating changes in Forest cover in the notifiedforests of Andhra Pradesh on annual basis is a herculean task and this is not possible without theco-operation of all the Officers and staff of the Department. Support and guidance of the Head ofthe Department is crucial in this regard. I gratefully acknowledge the guidance and encouragementgiven by Sri. Hitesh Malhotra, IFS, the then PCCF (HoFF) in bringing out this SFR. Sri. P.K.Sharma,APCCF (IT) led the team from the front and took serious pains in day to day guidance right uptogoing through the entire manuscript himself. His continuous encouragement in bringing out a correctreport is sincerely acknowledged.
The direction and guidance of the Technical Advisory Committee on Geomatics consisting ofDr.Devendra Pandey, IFS (Retd), former Director General FSI, Dr. MSR Murthy, formerly HeadForestry Division, NRSC, Dr.D.M.Reddy, formerly Director General, APSRAC, Dr.S.V.Reddy,Additional Director (Scientific Biosphere Reserve), MoEF are sincerely acknowledged. Their valuablesuggestions have helped to improve the SFR to a great extent.
Sri. A.Kishan,IFS,CF(MIS), Sri. P.Sreenivasa Rao, DCF(GIS), Sri. S. Madhava Rao, ACF(PMU-I), Dr. A. Rama Murthy, ACF (RS) have contributed immensely in shaping up the report andthe same is placed on record. Contribution of Smt. J.P.Sowjanya and Sri. D.V.Reddy, FROs byway of ground truthing of the change locations are sincerely acknowledged.
Geomatics Team of the Project Scientists consisting of Sri. M.Rajeshwar Reddy, Sri. K.BhaskaraRao, Sri. K.Rajashekar Reddy, Sri. B.Rama Krishna, Miss. Ch.Neeraja, Smt. G. Nagamallika, Smt.I.Sheeba, Smt. D.Kavitha, Sri. S.Ashwini Kumar, Sri. A.Srinivasa Rao, Sri. Y.VVDS ChakradharRao, Smt. K.Anuradha, Miss. K.Sravani, Miss. Ayesha Afreen, Sri. G.Venu babu andSri. B. Kishore have worked very hard to bring out this report. The team had sincerely worked rightfrom data browsing, Georeferencing, interpretation and detection of change polygons, ground truthingand report preparation without which the Report could not have been brought out. Hence theircontribution is sincerely acknowledged.
The ground level officers up to ABO level have taken pains in ground verification, withoutwhich this report could not have been possible. At the end I acknowledge all the colleagues in HeadOffice and the field officers for their valuable contribution in bringing out this publication.
ACKNOWLEDGEMENTS
Dr. H.C. MISHRA, IFSAddl. Prl. Chief Conservator of Forests (GIS)
01-11-2012Hyderabad

ix
Contents
Executive Summary 1I. Introduction 3
1. About the State 32. History of Geomatics in AP Forest Department 33. History of Forest Cover Change Monitoring in AP 44. Refinement of Methodology of Forest Cover & Change Assessment 4
II. Methodology 51. Satellite data and its period 52. Technical Advisory Committee 63. Image Processing Technique Adopted 64. Limitations of Technology 75. Accuracy Assessment 86. Cost and Time of bringing out APSFR 2012 8
III. Statewide Results and Analysis 91. Introduction 92. Recorded Forest Area 93. Protected Area 104. Community Forest Management 105. Forest Cover 10
IV. Forest Division - Wise Results 15
V. Forest Cover Statistics in Protected Areas 1501. Introduction 1502. Protected Area Network in AP 1503. Forest Cover in Protected Areas
VI. Forest Cover Statistics in Joint Forest Management Area 1521. Introduction 1522. Joint Forest Protection Committee (JFPCs) 1523. Forest Cover in VSS Areas 152
VII. Forest Fire in Andhra Pradesh 1541. Introduction 1542. Forest Fire Losses 1543. Forest Fire Pattern in Andhra Pradesh 1564. Effects of Fires 156
Glossary of Technical Terms 162
1. Adilabad - 17 2. Bellampally - 20 3. Jannaram WLM - 23 4. Kagaznagar - 265. Mancherial - 29 6. Nirmal - 32 7. Ananthpur - 35 8. Chittoor West - 389. Achampet WLM - 40 10. Atmakur WLM - 42 11. Markapur WLM - 44 12.Nagarjuna Sagar WLM - 4713. Giddalur - 49 14. Guntur - 52 15. Nellore - 55 16. Hyderabad - 5817. Mahabubnagar - 61 18. Nalgonda - 64 19. Bhadrachalam N - 67 20. Bhadrachalam S - 7021. Khammam - 73 22. Kothagudem - 76 23. Paloncha - 79 24. Paloncha WLM - 8225. Kadapa - 85 26. Kurnool - 88 27. Nandyal - 90 28. Proddutur - 9229. Kamareddy - 95 30. Medak - 98 31. Medak WLM - 101 32. Nizamabad - 10333. Eluru - 106 34. Kakinada - 109 35. Krishna - 112 36. Narsipatnam - 11537. Paderu - 118 38. Srikakulam - 121 39. Vizianagaram - 124 40. Vishakhapatnam - 12741. Karim Nagar E - 130 42. Karim Nagar W - 133 43. Warangal N - 135 44. Warangal S - 13845. Warangal WLM - 141 46. Chittoor E WL - 144 47. Tirupati WLM - 146 48. Rajampet WL - 148

x
AE Allowable Error
AVI Advanced Vegetation Index
AOI Area of Interest
AWiFS Advanced Wide Field Sensor
BIL Band Interleaved by Line
BIP Band Interleaved by Pixel
BSQ Band Sequential
CAD Computer Aided Design
CBD Convention on Biodiversity
CFM Community Forest Management
CI Confidence Interval
CV Coefficient of Variation
DBMS Database Management System
DEM Digital Elevation Model
DGPS Differential Global Positioning System
DIP Digital Image Processing
DN Digital Number
DOS Disk Operating System
dpi Dots Per Inch
DTM Digital Terrain Model (or Modeling)
EMR Electromagnetic Radiation
ESRI Environmental Systems Research
Institute
ERDAS Earth Resources Data Analysis System
ETM Enhanced Thematic Mapper
EVI Enhanced Vegetation Index
FAO Food & Agriculture Organization
FCA Forest Conservation Act
FCC False Color Composite
FOV Field Of View
GCP Ground Control Point (s)
GIS Geographic(al) Information System(s);
GPS Global Positioning System(s)
GSDI Global Spatial Data Infrastructure
HDOP Horizontal Dilution of Precision
IFOV Instantaneous Field Of View
IRS Indian Remote Sensing Satellite
JFPC Joint Forest Protection Committee
LAI Leaf Area Index
LCC Lambert Conformal Conic (Projection)
LISS Linear Imaging Self Scanner
LULC Landuse / Landcover
MDF Moderately Dense Forest (In terms of
Canopy Cover)
MODIS Moderate Resolution Imaging
Spectroradiometer (or Spectrometer)
MSS Multi-Spectral Scanner
NAD North American Datum
NASA National Aeronautics and Space
Administration (U.S.)
NDVI Normalized Difference Vegetation Index
NDWI Normalized Difference Water Index
NF Non-Forest
NRSC National Remote Sensing Centre
NIR Near Infrared
NSDI National Spatial Data Infrastructure
NTFP Non Timber Forest Products
OF Open Forest (in terms of Canopy Cover)
PDOP Positional Dilution of Precision
PA Protected Area
PAR Photosynthetically Active Radiation
PCA Principal Component Analysis
PF Protected Forest
PPS Precise Positioning Service
PVI Perpendicular Vegetation Index
RADAR Radio-wave Detection and Ranging
RAR Real Aperture Radar
RDBMS Relational Database Management System
RF Reserved Forest
RGB Red, Green, Blue Colour Space
RS Remote Sensing
RTK Real-Time Kinematic
SAR Synthetic Aperture Radar
SAVI Soil Adjusted Vegetation Index
SD Standard Deviation
SLAR Side-Looking Airborne Radar
SNR S/N Signal to Noise Ratio
SPS Standard Positioning Service
SRTM Shuttle Radar Topography Mission
SWIR Shortwave Infrared
TIR Thermal Infrared
TM Thematic Mapper
TSAVI Transformed Soil Adjusted
Vegetation Index
TVI Transformed Vegetation Index
UTM Universal Transverse Mercator
(Projection)
VDF Very Dense Forest (in terms of Canopy
Cover)
VI Vegetation Indices
VSS Vana Samrakshana Samithi(es)
WGS World Geodetic System
WHS Water Harvesting Structures
WLS Wild Life Sanctuary
Abbreviations
1
EXECUTIVE SUMMARY
1
In the recently concluded Earth Summit held in in Rio de Janeiro, Brazil in June 2012
on “Sustainable development” attended by over 100 Countries of the World, final blue
print “The Future we want” was generated which stresses on the need for green
development, decrease in pollution and global warming. The Conference of Parties (CoP-
11) sponsored by the United Nations Organization (UNO) on “Conservation of Bio-diversity”
held in Hyderabad, Andhra Pradesh in October 2012; is a further step in conservation
efforts. Thus there is global concern these days for conservation and efforts are necessary
in that direction.
“The Andhra Pradesh State of Forest Report” gives a detailed view of the health
of the notified Forests in the State on Annual basis. State of Forest Report 2012 is the
third report in the series. It gives precise locations of the forest cover changes, assessed
using LISS III data of 2009 & 2010 seasons up to Compartment level. It shows that forest
cover has depleted inside notified forests of Andhra Pradesh during the period. The
following are the key results of this assessment:

2
Andhra Pradesh State of Forests - 2012
Key Results:
1. The state had 931.73 Km2 of Very Dense forest, 18418.53 Km2 Moderately dense forest & 22686.57
Km2 Open forest in 2009 and corresponding figures in 2010 are 931.73 Km2 of VDF, 18408.48 Km2
MDF, 22651.28 Km2 Open forest.
2. There is a reduction of 10.05 Km2 in MDF and 35.29 Km2 in open forest. There is net loss of 45.34
Km2 during this period.
3. There is degradation of forests from higher canopy density class to lower canopy density class in an
extent of 69.99 Km2.
4. There is Positive change in an area of 5.85 Km2.
5. 5.48 Km2 of MDF, 28.50 Km2 of open forest and 18.75 Km2 of scrub forest has been converted into
Non-forests. Of this, 36.44 Km2 of forest is lost due to fresh encroachments and 16.29 Km2 due to
clearance of jungle growth for raising of plantations & harvesting of matured plantations and to
some extent diversion of forest land for non-forestry purposes.
6. As negative change in forest cover due to clearance of jungle growth for raising of plantations and
harvesting of plantations is only a management intervention, the same is not considered as loss of
forest cover. Hence, the net loss of forest cover during this period is 36.44 Km2.
7. VSS areas account for 9.57 Km2 of encroachments.
8. Protected Areas account for 4.31 Km2 of encroachments.
9. Most negative change due to encroachments of 19.28 Km2 was found in Khammam Circle followed
by Warangal Circle with 6.66 Km2 and Nizamabad Circle with 2.46 Km2 and Hyderabad Circle showed
the least negative change due to encroachments of 0.42 Km2
10. Encroachments were noticed in 34 Divisions of the state. The Divisions contributing most negative
changes due to encroachments are: Bhadrachalam South (5.41 Km2), Kothagudem (4.89 Km2),
Khammam (3.80 Km2), Warangal South (2.90 Km2), Warangal North (2.73 Km2) and Paloncha (2.35
Km2).
11. No changes were found in 07 Divisions, viz., Atmakur WLM, Achampet WLM, Nagarjuna Sagar
WLM, Nandyal, Medak WLM, Chittoor West and Karim Nagar West.
12. Net positive change was found only in one Division, i.e., Rajampet.

3
Chapter - I
INTRODUCTION
1.1 About the State:
Andhra Pradesh is the 4th largest State in India, geographical area wise; with an area of 2,75,068 Km2. It is bounded
by Maharastra, Chhattisgarh and Orissa in the north, Bay of Bengal in the east, Tamil nadu in the south and Karnataka& Maharastra in the west. The State was formed on 1st November 1956 when States were reorganized on linguistic basis
by Government of India. It has 63,814 Km2 of notified forest land, which is 23.20% of the Goegraphical area.
The population of the State is 84.66 million (2011 census) which is 7.41% of country’s population. Nearly 73% of the
population of the State is rural, which primarily depend on agriculture for livelihoods. Scheduled castes constitute about16% and Scheduled tribes about 6% of the population. Hyderabad, Visakhapatnam and Vijayawada are the principal cities
in the State with over a million population. Traditionally, the State is divided into three regions called Andhra region
consisting of the 9 districts of coastal area, Telengana region consisting of 10 districts of erstwhile Hyderabad State andRayalseema region consisting of 4 southern districts.
1.2 History of Geomatics in AP Forest Department:
Prior to 1996 there was no mechanism to monitor the Forest cover changes in Andhra Pradesh. It used to rely on thedata given by the Forest Survey of India, Dehradun through its bi-ennial “State of Forest Reports”. However, these
reports, which were brought out since 1987, did not provide the statistical information on the forest cover inside the
notified forest under the control of forest Department and outside separately. It presented a Nation wide & State wisepicture of the green cover, inclusive of the areas outside the notified forests. These provide data only upto the district
level and no statistics of forest/tree cover were available below the district level. Therefore a necessity was felt for
generating this data for the notified forest areas, which are under the control of Forest Department, upto the smallest unitof administration, i,e Beat level. This could have been possible only with the setting up of Geomatics center at the State
level. This required procurement of satellite images, Hardware, Software, and technically trained manpower. For doing all
this huge investment was essential.
The opportunity came with the launch of World Bank funded Andhra Pradesh Forestry Project in 1994. A consultancy
for setting up and operationalization of a Geomatics center at Hyderabad was provided in the project and given to FAO,
Rome. Dr K.D.Singh was the principal consultant for this consultancy.
A small Geomatics Center was set up in a small room in the old Aranya Bhavan building with the 386 personalcomputers with 80 MB harddisk and 1 MB RAM. The first software installed was the IDRISI package gifted by the FAO.
In due course of time other required hardware, software were added to the Geomatics Centre.
Few Officers of the Department were picked up for training in the Remote Sensing and GIS and sent to ITCNetehrlands, IIRS Dehradun etc., On their return, after successful completion of the training, these Officers started
working in the Geomatics centre and started sensitizing the other Officers in the use of Remote Sensing, GIS and GPS.
Gradually, the trainings were extended to the personnel of entire Department and to the other members of VSSs etc.
The first thing required for the monitoring of forest cover changes upto Beat level was to create spatial databases
both from Administrative point of view as well as Management point of view. It was decided to create these spatial
databases (Vector layers) on 1:250 K Scale. This work was outsourced by tender process in November- December 1994to a private agency called “Remote Sensing Instruments” Hyderabad for digitization of forest block & administrative
boundaries, rivers, water bodies, villages, roads and forest cover density layers with attribute data. These layers were

4
Andhra Pradesh State of Forests - 2012
generated by the end of 1995. Subsequently ERDAS software and PC Arc Info version 3.4.2 were procured and later alllatest hard ware and software procured Subsequently about 100 basic and derived themes were generated on 1:50 K
Scale, mostly in-house. This data is being used in the monitoring of forest cover changes and several other applications
in the department.
1.3 History of Forest cover change Monitoring in AP:
The Forest cover monitoring in Andhra Pradesh was initiated in 1995 by Mr. Rudi Drigo of FAO who carried out and
demonstrated forest cover change assessment in Adilabad District using IRS IA/IB LISS II images of 1988 and 1994 using“Interdependent Visual Interpretation” method. The results were brought out in 1995-96. Subsequently, for interpreting
the IRS IC and IRS 1D LISS-III data of 1996 & 1998, the task was outsourced. These Agencies digitally interpreted the
canopy densities of the forests and submitted the results to the Forest Department. The notified forests were classifiedinto Waterbodies, Blanks/others, Scrub (0 to 10% Canopy), Open forests (10 to 40% canopy) and Dense forests (>40%
canopy) in line with FSI classification.
There after the forest cover change monitoring was carried out by the officers of the Geomatics centre regularly on
annual basis commencing from 2000 AD using digital interpretation methods of LISS-III data. This method was followedup to 2006 and statistics on various classes of Forest canopy cover were generated by eliminating 0.5 Ha Area.
1.4 Refinement of methodology of Forest Cover & Change Assessment:
The Forests of Andhra Pradesh are mostly deciduous in nature and its canopy density widely changes in different
months. Experience has shown that complete digital interpretation, without input from visual editing doesn’t give asatisfactory level of accuracy. Further, it was noticed that repeated digital classification was prone to interpretational
errors and overlaying two classified images didn’t give proper change image at times. It was therefore decided to use
visual editing after classifying the image of 2007 to get a correct interpretation of areas not properly classified by thedigital methods. NDVI slicing cum limited visual editing was resorted to for Adilabad, Nizamabad, Medak, Warangal,
Karimnagar, Khammam, Nalgonda, Srikakulam, Vijayanagaram, Visakhapatnam, East Godavari, West Godavari, Krishna,
Guntur, Prakasham, Nellore, Chittoor, Anantpur and Kurnool districts. However to check the relative accuracies ofvarious methods, other methods apart from NDVI slicing cum visual editing like Unsupervised classification cum
Supervised classification were also attempted in Mahabubnagar, Kadapa and Hyderabad & RangaReddy and better
method in terms of final accuracy was taken. The 2008 image was compared with 2007 classified image & FCC to discernthe changes apart from using the ERDAS matrix tool. Similarly the 2009 image was compared with 2007 classified image
using ERDAS Matrix tool keeping 2008 changed polygons in the background.This gave the changes between 2008 and
2009. Further 2008 and 2009 FCCs were visually compared compartment wise and all positive and negative changes werepolygonised. Similarly 2009 FCC was compared with 2010 FCC using ERDAS Matrix tool as well as visually and positive
and negative changes were polygonised, while keeping 2007-08 & 2008-09 changed plygons in the back ground. The
changes were to some extent ground truthed by Geomatics wing and the remaining by the field staff for total verification.For easy access to the data, all the change points were kept on the APFD’s website. Feedback was obtained through a
web enabled MIS package developed by the Department called as “Forest Cover Change MIS” and few members of staff
have given their reports using traditional modes – paper reports & e-mails.
Over the years the digital interpretation of Satellite data had been done independently, as a result changes in Forest
cover were prone to interpretational errors. Therefore, APFD has switched over to Vector based approach like the FSIfrom 2007 in which forest cover change is mapped in polygons (Vector) by defining clusters of pixels with boundaries.This improves the cartographic presentation of the output, helps map the changes more accurately and makes the output
available for use by protection staff. Both positive and negative changes were captured for about 1200 locations and
communicated to field staff for verification & feedback.

5
2.1 Satellite data and its period :
The Satellite data for the entire State was procured from the National Remote Sensing Centre (NRSC), Hyderabad indigital form. It was multi spectral (LISS- III Sensor) data of IRS P6 satellite with a resolution of 23.5m.
One scene of LISS – III covers an area of about 20,000 km2 (140 km *140 km); there are considerable overlaps (15 to
20 percent) among adjacent scenes. Also at the borders of the country or for islands, the whole scene has to be procuredeven though the Area of Interest (AOI) may be small. Thus a total of 30 scenes covering the entire state were procured.
The scene wise details of data procured are as follows:-
Chapter - II
METHODOLOGY
Path/Row (P/R)S. No. Date of pass 2010 Date of pass 2009 Remarks
1 99/58 28-10-2010 02-11-2009 Cloud free
2 99/59 15-12-2010 02-11-2009 ,,
3 99/60 15-12-2010 02-11-2009 ,,
4 99/61 15-12-2010 02-11-2009 ,,
5 99/62 08-01-2011 02-11-2009 ,,
6 99/63 21-11-2010 02-11-2009 ,,
7 100/59 20-12-2010 01-12-2009 ,,
8 100/60 20-12-2010 01-12-2009 ,,
9 100/61 20-12-2010 01-12-2009 ,,
10 100/62 13-01-2011 01-12-2009 ,,
11 100/63 13-01-2011 18-01-2010 ,,
12 101/59 14-10-2010 19-10-2009 ,,
13 101/60 14-10-2010 19-10-2009 Partly Cloudy
14 101/61 14-10-2010 19-10-2009 Cloud free
15 101/62 14-10-2010 19-10-2009 ,,
16 101/63 18-01-2011 19-10-2009 ,,
17 101/64 18-01-2011 19-10-2009 ,,
18 102/60 30-12-2010 24-10-2009 ,,
20 102/61 30-12-2010 24-10-2009 ,,
21 102/62 No Data 24-10-2009 ,,
22 102/63 No Data 04-01-2010 ,,
23 102/64 No Data 24-10-2009 ,,
24 103/59 30-09-2010 22-11-2009 ,,
25 103/60 28-01-2011 22-03-2010 ,,
26 103/61 28-01-2011 22-03-2010 ,,
27 104/59 16-12-2010 27-11-2009 ,,
28 104/60 09-01-2011 27-11-2009 ,,
29 105/59 27-11-2010 26-12-2009 ,,
30 105/60 27-11-2010 15-10-2009

6
Andhra Pradesh State of Forests - 2012
2.2 Technical Advisory Committee:
Government of Andhra Pradesh has constituted a Technical Advisory Committee Vide GO Ms No.121, EFS & T-
(For-III) Deptt. Dated 04.12.2009 to aid and advise Andhra Pradesh Forest Department in matters of Remote Sensing &
GIS application. This committee was re-constituted by the Govt. vide G.O.Ms.No. 57, EFS & T- (For-III) Deptt. Dated07.05.2011, with the following Members:
1. Representative from Forest Survey of India, Dehradun Member
2. The Addl. Director (Scientific-Biosphere reserves) – Representative of MoEF, New Delhi. Member
3. The Head, Forestry Division, NRSC, Hyderabad. Member
4. The Director General, APSRAC, Hyderabad Member
5. Dr. Devendra Pandey, IFS (Retd.)Ex-DG of FSI, Dehradun, presently stationed at New Delhi. Member
6. Addl. Prl. CCF (IT), O/o Prl.CCF, Hyderabad. Convener
7. Addl. Prl. CCF (GIS), O/o Prl.CCF, Hyderabad. Member
Accordingly, the Committee met on 11.11.2011 and took the following decisions:-
a) To address the encroachments & greening changes on annual basis using vegetation index methods.
b) To use FSI data for biennial monitoring of Crown density.
c) To use LISS-IV & Cartosat merged data for Working plan preparation, Trees outside Forests estimation etc.
Pursuant to this Andhra Pradesh Forest Department has adopted the Vegetation Index (NDVI) method.
2.3 Image Processing Technique Adopted:
The 2007 image has been previously classified as Very Dense Forest, Moderately Dense Forest, Open Forest, Scrub,
Non-Forests and Water and accuracy of 85%was achieved. This Classified image was taken as the basis for bringing outforest cover changes in future. Simultaneously, 2008 and 2009 changed polygons were also taken into account to
determine the changes between 2009 and 2010.
The ERDAS Autosync module was used to register the 2010 image taking 2007 image as master image. It took only
about 15 minutes to Geo-reference one scene of 2010 image. After this, the 2010 image was roughly classified into variousclasses and the ERDAS matrix tool was used to determine various changes from each class of 2009 to each class of 2010.
The 2008 and 2009 change polygons were overlaid on the 2009 FCC and changes between 2009 and 2010 were determined
by manual Polygonisation.
NDVI slicing demarcating water, Non-Forest, Scrub, Open Forest, Moderately Dense Forest and Very Dense Forest
was done in the ground. All the negative NDVI pixels were treated as Water, whereas low NDVI values were treated as
Non-Forest. It was noticed that December & January have low NDVI values than that of October & November Scenes.Therefore normalization of scenes was done when the scenes were of different months. Normalization of the scenes
refers to changing the histogram of a slave image taking another image as a master. It is used for temporally different and
spatially coincident images.
After completing the NDVI slicing of the images, Ground truthing was done and necessary editing to the images
carried out. It was seen that NDVI slicing gave accuracy between 72 to 95% without editing after the image of 2010 was
roughly classified. ERDAS matrix tool was used to get the change points. The change points were then digitized on the

7
2.4 Limitations of Technology :
The following are the limitations of the technology:
• As the resolution of data from LISS-III is 23.5 m, smaller areas below 0.40 Ha cannot be captured.
• Young plantations and species having less chlorophyll content in their crown, do not give proper reflectance
and as a result correct interpretation of such areas becomes difficult.
• Considerable details on ground could be obscured in areas having clouds and shadows. It is difficult tointerpret such areas without the help of collateral data.
• Variation in spectral response pattern during leafless period poses problems in interpretation.
• Gregarious occurrence of bushy vegetation like Lantana and certain agricultural crops, such as sugarcane,cotton, etc. often pose problems in delineation of forest cover change as their spectral response pattern is
similar to that of tree canopy.
• In encroached areas harvested agriculture crop gives a pseudo change impression.
FCC of 2010 image. The matrix method, sometimes does not give the location of all the change points. To verify otherpossible change points the 2010 FCC was overlaid by swiping over the 2009 FCC and few more change points were
detected.
The lat-long of the change Polygons as well as change classes both (from class & to class) and areas were
communicated to the field officers for verification and reports obtained. About 200 points were checked by the officersof Geomatics Wing. There was good Correlation between the points shown in the lab and the situation on ground.
It was noticed that the change points tallied in area, location and shape on the ground.
The flow diagram of the work carriedout is as follows:
Browsing &
Procurement of
LISS III Data of 2010
Rough NDVI
Classification of 2010
data Scene wise
Determination of
Change area location
by ERDAS Matrix tool
by comparing with
2009 classified Map
Application ofCorrection to changed
Polygons
Determination of finalchanges and area
statistics
Stacking of BSQ data
in ERDAS imagine
Rectification by
Autosync
Polygonisation ofchange areas and area
determination keeping 2008& 2009 change polygons in
background (by visualComparision of 2009 &2010
FCCs)
Ground truthing by
Scientists and field
staff
Methodology

8
Andhra Pradesh State of Forests - 2012
2.5 Accuracy Assessment :
Accuracy was estimated in the monitoring activity restricting to the change polygons only. It was found that thechange polygons given by Geomatics wing were acurate in extent, location and shape. The accuracy achieved was of
extremely high order of about 98%. Occasional errors were found in interpretations showing loss of vegetation because
of inter-ploughing of plantations and weeding of dense weeds in plantations, deciduous nature of our forests and cropharvested areas in encroached forest lands.
2.6 Cost and Time of bringing out APSFR 2012 :
An expenditure of approx. Rs. 29.00 lakh is involved in the entire exercise (execluding the cost of Forest Department
persondays). The details are as follows :
S.No Item of Work Time schedule
1. Browsing ordering and collection September 2010 to March 2011of data from NRSC
2. Geo-referencing, classification and November 2010 to March 2011detection of change polygons.
3. Ground truthing the change polygons January 2011 to June 2011
4. Collection of feedback from field staff. January 2011 to September 2011
5. Preparation of Report October 2011 to June 2012
6. Printing of report November 2012
“What we are doing to the forests of the world is but a mirror reflection of what we are doing to ourselves and to one another.” - Mahatma Gandhi
S.No Item of Work Cost in Rs.
1. Cost of 29 scenes of LISS III data @ 7000/- per scence 2,03,000.00
2. Proportionate cost of Software in average ERDAS packages and 1 autosync is used 3,00,000.00only 20%. Cost is projected.
3. Cost of Hard ware-25% of 6 Computers cost 1,25,000.00
4. Cost of 6 scientists doing lab and field work per 1 year. 12,00,000.00
5. Cost of field trips 50,000.00
6. Cost of printing of SFR (1000 copies) 2,00,000.00
7. Ground truthing expenditure by FBO’s (@ 1 location per day) 7,00,000.00
8. Miscellaneous 22,000.00
Total 29,00,000.00

9
3.1 Introduction:
Andhra Pradesh State lies between latitudes 12.6230 & 19.9170 N and longitudes76.7610 & 84.7660 E. The GeographicalArea of the State is 2,75,068 km2 which is 8.37 % of the landmass of the country and the state has 974 Kilometers of
coastline. The State has three physiographic zones, the hilly region having Nallamalai and Erramalai hills and the Eastern
Ghats having an altitude of 500 to 1400 m; the plateau having an altitude of 100 m to 1000 m and the deltas of riversbetween the Eastern Ghats and the Sea Coast. Godavari, Krishna and Pennar are the 3 principal rivers of the State which
drain into the Bay of Bengal. The River Godavari with its tributaries Pranahita, Manjeera, Maneru, Indravati, Kinnerasani,
Pamuleru and Sileru, drains through the northern parts of the State into Bay of Bengal. The River Krishna with itstributaries Tungabhadra, Vedhavati, Hundri, Musi, Paleru and Munneru flows through the central parts of the State. The
River Pennar, the third biggest river, with its tributaries Chitravati, Papaghni, Cheyyeru and Pincha drains Rayalaseema
region and Nellore district.
Land use pattern of the State is given in Table
3.1.
The climate of this State is generally dry with
temperature ranging from 80 C to 500 C and the annualrainfall is about 500-1300 mm, received mainly from
Southwest and Northeast monsoons. The geologicalformations of the State are: (1) The unclassified
Archaean crystalline rocks are mainly the granite but
in the eastern ghats it comprises of granulite suites(khondalites and kodurites), (2) The Middle–Upper
Proterozoic the Cuddapahs and its equivalents; (3)
The Mesozoic coal bearing Gondwana strata, (4)Eocene lava flows (the Deccan traps) and (5) The semi-
consolidated or unconsolidated tertiary and recent
rocks. The soils of the State are Red, Black, Alluvial,Laterite and Saline/Alkaline. The population of the
State is 84.7 million (2011 Census). The male population
is 42.5 million and female 42.1 million. The Per capita forest area is 0.07 Ha. The population density is 308 persons per Km2.The livestock population is 150.5 million.
3.2 Recorded Forest Area:
The total notified forest area of the State is 63,814 Km2, which is 23.2
% of the geographical area. Reserved, Protected and Un-classed forestsoccupy 50,478.63 Km2 (79.10%), 12,365.34 Km2 (19.38%) and 969.76 Km2
(1.52%) of the total forest area respectively. The Khammam District has
the highest notified forest area of 8,436.94 Km2 and the Krishna has thelowest notified forest area of 664.28 Km2 in the State. As regards the ratio
of notified forest to geographical area, Khammam District has the highest
Chapter - III
STATEWIDE RESULTS AND ANALYSIS
Scrub21.23%
NF11.94%
Water1.02%
VDF1.46% MDF
28.85%
OF35.50%
(Source : NRSC)
Forest including Scrub 55664.31 20.23
Agriculture 168821.46 61.37
Land with Scrub 17137.66 6.23
Fallow Lands 10333.94 3.76
Grasslands 652.17 0.24
Settlements 2633.41 0.96
Vegetation outside Forest 9132.87 3.32
Water Bodies 10343.00 3.76
Total 275068.00 100.00
Land use Area in Sqkm Percentage
Table 3.1 : Land use Pattern

10
Andhra Pradesh State of Forests - 2012
– 52.64 % and Nalgonda the lowest - 5.9 %. As per Champion and Seth’s classification the Forests of State fall underSouthern Moist Mixed Deciduous Forest, Littoral Swamp Forest, Dry Teak Forest, Dry Red Sanders Bearing Forest,
Southern Dry Mixed Deciduous Forest, Dry Deciduous Scrub, Dry Savannah Forest, Hardwickia Forest, Dry Bamboo
Brakes, Southern Thorn Forest, Dry Scrub Forest, Tropical Dry Evergreen Forest types.
3.3 Protected Area :
The State has 27 Protected Areas – 20 Wildlife Sanctuaries, 6 National Parks and 2 Tiger Reserves. Nagarjuna Sagar–
Srisailam Tiger Reserve (NSTR) is the biggest Tiger Reserve of India and the Kawal Tiger Reserve in Adilabad District is
the latest to be notified as Tiger Reserve in A.P. Out of 63814 Km2 of notified forest area, 15280.92 Km2 is included in thePA network.
3.4 Community Forest Management :
There are 7,718 Vana Samrakshana Samities (VSSs) or Joint Forest Protection Committees (JFPCs) in the State. An
area of 15,199.8 Km2 of notified forests, which is 23.8 % of the forest area, is under Community Forest Management(CFM). 15.39 Lakh members are involved in CFM. This includes 4.65 Lakh members belonging to Scheduled Tribes (S.Ts)
and 3.23 Lakh members belonging to Scheduled castes (S.Cs).
3.5 Forest Cover :
The forest cover in the State based on the interpretation of IRS P6 LISS-III 2010 data (October 10 - March 11) is
42163.18 Km2, which is 15.32% of the Geographical area. In terms of the forest canopy cover density classes the State has
931.73 Km2 of Very Dense Forest, 18408.48 Km2 of Moderately Dense Forest and 22651.28 Km2 of Open Forest. The areaof the Scrub is 13550.31 Km2, Non-Forest 7622.49 Km2 and Water Bodies 649.86 Km2. The distribution of the forest cover
of the State is shown in above pie chart and Figure 3.1.
The distribution of Forest Cover in the CFM areas is 76.78 Km2 in Very Dense Forest, 3774.55 Km2 in ModeratelyDense Forest and 5402.96 Km2 in Open Forest. The area of Scrub is 3797.88 Km2, Non-Forest 2099.42 Km2 and Water
bodies 48.47 Km2.
The distribution of Forest Cover in the Protected Areas is 208.37 Km2 in Very Dense Forest, 3927.50 Km2 in
Moderately Dense Forest and 5907.76 Km2 in Open Forest. The area of Scrub is 2919.79 Km2, Non-Forest 1371.99 Km2 &Water bodies 945.47 Km2.
Change in Forest Cover (Including Scrub and Non-Forest): An analysis of the total extent of Forests between 2009
and 2010 shows that degradation is seen in an area of 69.99 Km2 and positive change in 5.85 Km2. Thus an area of 52.73Km2 of forests (5.48 Km2 of MDF, 28.5 Km2 of open forests and 18.75 Km2of scrub) is converted to Non forest during the
year.
On further analysis it is seen that out of this 52.73 Km2 of loss of forest cover an area of 36.44 Km2 is due to attemptson encroachments in the State and 16.29 Km2 is due to harvesting of matured plantations and clearance of jungle growth
for raising of plantations. The later are management interventions and hence cannot be considered as loss of forest
cover. Hence loss of forest cover due to encroachments is taken as net loss of forest cover, which is 36.44 Km2.Out of thisan area of 9.57 Km2 is inside VSS areas and 4.31 Km2 inside the Protected Areas.
Encroachments were noticed in 34 Divisions, positive changes in 11 Divisions and no changes in 07 Divisions
(Atmakur, Achampet, Nagarjuna Sagar, Nandyal, WLM Medak, Chittoor West, Karimnagar West).
Change in Forest Cover (Excluding Scrub and Non-Forest): The forest cover in VDF, MDF and OF in 2009 was931.73 Km2, 18418.53 Km2 and 22686.57 Km2 respectively. However in 2010 it is 931.73 Km2, 18408.48 Km2 and 22651.28 Km2

11
Figure 3.1 Vegetation Cover Map ofAndha Pradesh - 2010
respectively. Thus there was a reduction of 10.05 Km2 in MDF and 35.29 Km2 in OF. The net loss of forest cover in MDFand OF put together is 45.34 Km2 in the State during the year.
Divisions with most loss of Forest Cover due to encroachments are Bhadrachalam South, Kothagudem, Khammam,
Warangal South and Warangal North.
In CFM areas, there is a net loss of 10.84 Km2 of forest cover. In Protected Areas, there is a net loss of 4.31 Km2 offorest cover. The change locations are shown in Figure 3.2.
The forest cover change matrix, showing changes from one class to other, is given in Table 3.2. It reveals that there
has been a decrease of 10.05 Km2 of moderately dense forest and 35.29 Km2 of open forest.
On the basis of ground truthing conducted by the officers of the Geomatics Center and the field officers, the mainreasons for decrease in the forest cover are management interventions like harvesting(clear felling) of matured plantations,
clearance of bush growth and preparation of land for raising of plantations and fresh attempts on encroachmentstriggered by recognition of rights of occupation.
Division wise forest cover in different forest canopy density classes along with the changes compared to 2009
assessment is given in Table 3.3.
Statewide Results and Analysis

12
Andhra Pradesh State of Forests - 2012
Figure 3.2
Very Dense Forest 931.73 0.00 0.00 0.00 0.00 0.00 931.73
Moderately Dense Forest 0.00 18408.32 0.45 4.28 5.48 0.00 18418.53
Open Forest 0.00 0.00 22645.54 11.99 28.50 0.54 22686.57
Scrub 0.00 0.13 1.02 13533.64 18.75 0.00 13553.54
Non-Forest 0.00 0.03 4.27 0.40 7569.76 0.00 7574.46
Water 0.00 0.00 0.00 0.00 0.00 649.32 649.32
Total of 2010 931.73 18408.48 22651.28 13550.31 7622.49 649.86 63814.15
Net Change 0.00 -10.05 -35.29 -3.23 48.03 0.54
2009 (Data ofDec 2009 - March
2010)
2010 (Data of Sep 2010 - Jan 2011)
VDF MDF OF Scrub NF WBTotal of
2009
Table 3.2 Forest cover change matrix (Area in Km2)

13
Table 3.3 Division wise Forest Cover Changes
S.No & Division VDF MDF OF Scrub NF WB Total Encroa- chments
I. ADILABAD 1.ADILABAD 52.31 925.03 337.82 382.16 194.26 7.37 1898.95 0.892.BELLAMPALLY 172.82 867.22 240.97 107.25 130.65 5.88 1524.79 0.153.JANNARAM 41.22 222.25 228.78 64.41 85.37 1.71 643.74 0.044.KAGAZNAGAR 159.17 377.26 162.05 75.33 116.39 3.09 893.29 0.315.MANCHERIAL 50.23 576.63 280.03 115.28 82.79 10.41 1115.37 0.006.NIRMAL 7.18 650.23 200.43 68.55 92.40 6.37 1025.16 0.59
Total 482.93 3618.62 1450.08 812.98 701.86 34.83 7101.30 1.97
II. ANANTHAPUR
7.ANANTHAPUR 0.00 0.87 348.95 710.24 885.04 0.50 1945.60 0.008.CHITOOR WEST 0.03 197.72 962.68 646.34 280.62 2.37 2089.76 0.00Total 0.03 198.59 1311.63 1356.58 1165.66 2.87 4035.36 0.00
III. FDPT SRISAILAM 9.ACHAMPET 0.33 479.11 1032.14 782.23 69.60 59.96 2423.37 0.0010.ATMAKUR 5.53 229.08 374.45 259.74 346.94 70.03 1285.77 0.0011.MARKAPUR 1.93 372.31 951.35 685.04 247.73 14.50 2272.86 1.4212.NAGARJUNASAGAR 0.00 8.49 181.98 441.72 133.29 29.50 794.98 0.00
Total 7.79 1088.99 2539.92 2168.73 797.56 173.99 6776.98 1.42
IV. GUNTUR
13.GIDDALUR 22.10 746.57 729.07 444.58 260.57 5.31 2208.20 0.1814.GUNTUR 0.00 0.08 315.19 887.62 235.76 38.26 1476.91 0.3515.NELLORE 0.00 191.55 954.46 723.16 480.84 29.95 2379.96 0.04
Total 22.10 938.20 1998.72 2055.36 977.17 73.52 6065.07 0.57
V. HYDERABAD 16.HYDERABAD 0.00 121.95 212.94 385.44 35.79 2.75 758.87 0.3217.MAHABUBNAGAR 0.00 16.20 291.26 308.98 2.88 0.16 619.48 0.0618.NALGONDA 0.00 1.57 38.35 241.36 158.36 2.36 442.00 0.03Total 0.00 139.72 542.55 935.78 197.03 5.27 1820.35 0.42VI.KHAMMAM 19.BHADRACHALAM_N 9.26 377.05 545.93 368.15 131.44 3.74 1435.57 1.2720.BHADRACHALAM_S 83.57 619.16 369.35 179.74 38.84 3.00 1293.66 5.4121.KHAMMAM 0.41 349.97 507.73 355.00 106.65 2.58 1322.34 3.8022.KOTHAGUDEM 0.04 353.96 584.54 451.79 290.04 3.51 1683.88 4.8923.PALVONCHA 38.77 415.78 640.16 292.36 132.43 4.02 1523.52 2.3524.PALVONCHA WLM 1.43 220.64 271.44 125.84 54.28 12.75 686.38 1.56
Total 133.48 2336.56 2919.15 1772.88 753.68 29.60 7945.35 19.28
VII KURNOOL 25.KADAPA 0.03 164.81 973.38 484.76 91.25 2.32 1716.55 0.0026.KURNOOL 0.00 0.56 269.09 364.04 565.97 2.89 1202.55 0.0027.NANDYAL 40.71 595.10 293.98 67.67 65.57 3.43 1066.46 0.0028.PRODDATUR 3.58 426.38 552.15 301.70 282.35 8.95 1575.11 0.00
Total 44.32 1186.85 2088.60 1218.17 1005.14 17.59 5560.67 0.00
(Area in Km2)Statewide Results and Analysis
14
Andhra Pradesh State of Forests - 2012
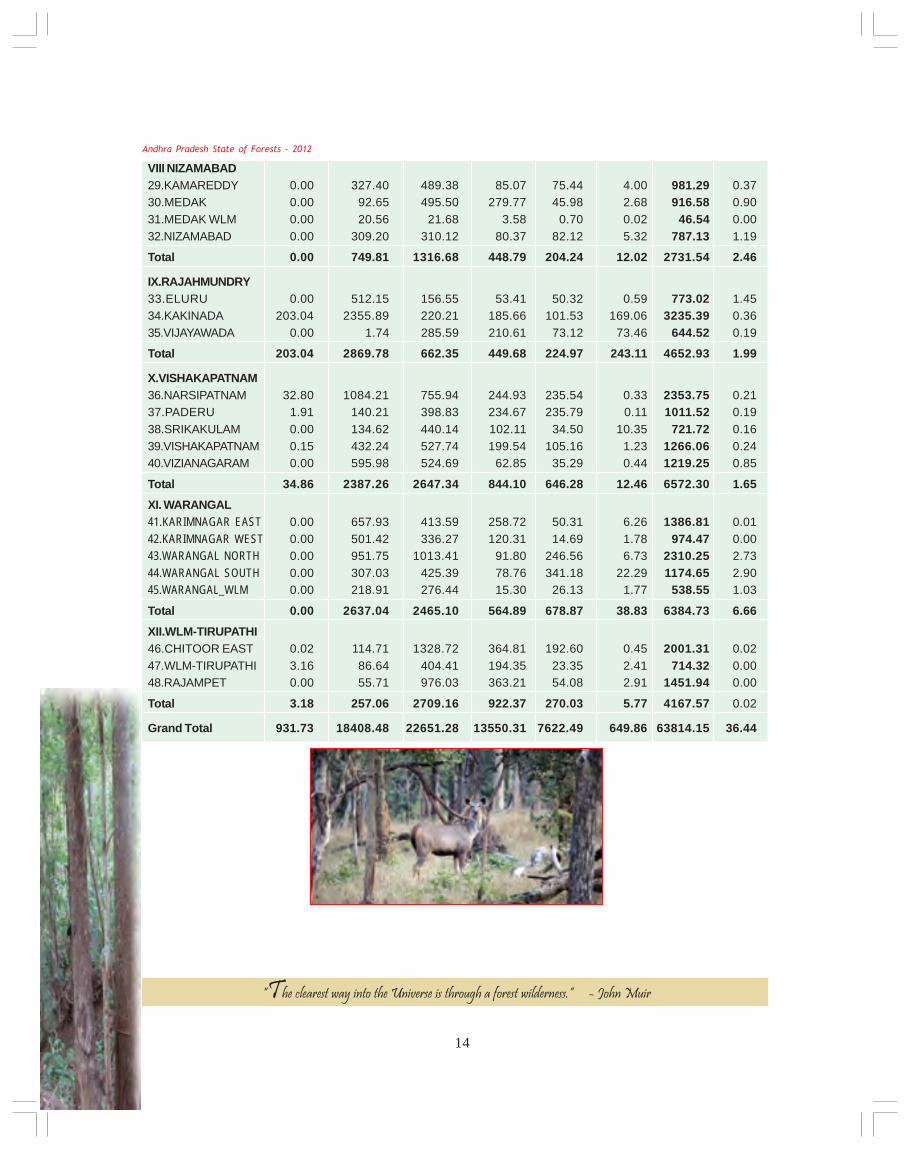
VIII NIZAMABAD 29.KAMAREDDY 0.00 327.40 489.38 85.07 75.44 4.00 981.29 0.3730.MEDAK 0.00 92.65 495.50 279.77 45.98 2.68 916.58 0.9031.MEDAK WLM 0.00 20.56 21.68 3.58 0.70 0.02 46.54 0.0032.NIZAMABAD 0.00 309.20 310.12 80.37 82.12 5.32 787.13 1.19
Total 0.00 749.81 1316.68 448.79 204.24 12.02 2731.54 2.46
IX.RAJAHMUNDRY 33.ELURU 0.00 512.15 156.55 53.41 50.32 0.59 773.02 1.4534.KAKINADA 203.04 2355.89 220.21 185.66 101.53 169.06 3235.39 0.3635.VIJAYAWADA 0.00 1.74 285.59 210.61 73.12 73.46 644.52 0.19
Total 203.04 2869.78 662.35 449.68 224.97 243.11 4652.93 1.99
X.VISHAKAPATNAM 36.NARSIPATNAM 32.80 1084.21 755.94 244.93 235.54 0.33 2353.75 0.2137.PADERU 1.91 140.21 398.83 234.67 235.79 0.11 1011.52 0.1938.SRIKAKULAM 0.00 134.62 440.14 102.11 34.50 10.35 721.72 0.1639.VISHAKAPATNAM 0.15 432.24 527.74 199.54 105.16 1.23 1266.06 0.2440.VIZIANAGARAM 0.00 595.98 524.69 62.85 35.29 0.44 1219.25 0.85
Total 34.86 2387.26 2647.34 844.10 646.28 12.46 6572.30 1.65
XI. WARANGAL 41.KARIMNAGAR EAST 0.00 657.93 413.59 258.72 50.31 6.26 1386.81 0.0142.KARIMNAGAR WEST 0.00 501.42 336.27 120.31 14.69 1.78 974.47 0.0043.WARANGAL NORTH 0.00 951.75 1013.41 91.80 246.56 6.73 2310.25 2.7344.WARANGAL SOUTH 0.00 307.03 425.39 78.76 341.18 22.29 1174.65 2.9045.WARANGAL_WLM 0.00 218.91 276.44 15.30 26.13 1.77 538.55 1.03
Total 0.00 2637.04 2465.10 564.89 678.87 38.83 6384.73 6.66
XII.WLM-TIRUPATHI 46.CHITOOR EAST 0.02 114.71 1328.72 364.81 192.60 0.45 2001.31 0.0247.WLM-TIRUPATHI 3.16 86.64 404.41 194.35 23.35 2.41 714.32 0.0048.RAJAMPET 0.00 55.71 976.03 363.21 54.08 2.91 1451.94 0.00
Total 3.18 257.06 2709.16 922.37 270.03 5.77 4167.57 0.02
Grand Total 931.73 18408.48 22651.28 13550.31 7622.49 649.86 63814.15 36.44
“The clearest way into the Universe is through a forest wilderness.” - John Muir

15
CHAPTER - IV
FOREST DIVISION - WISE RESULTS

16
Andhra Pradesh State of Forests - 2012
Nallamala forest
Chamala forest
East Godavari forest

17
4.1.1 Introduction:
Adilabad Forest Division lies in Northern Part of Adilabad District between latitudes 190 9’ 50’’ and 190 54’ 59’’ N andlongitudes 780 7’ 28’’ and 790 5’ 37’’ E. The Geographical Area of the Division is 4409.41 Km2 which constitutes 27.34 % of
the total area of the District. The highest hill ranges are situated in the southeast corner of the Division. They are
Kuchanpally 646M above MSL and Tummidipally gutta 634M above MSL. The important rivers of the Division areKadam , Penuganga and Peddavagu; which are tributaries of Godavari.
Land use pattern of the Division is given in Table 4.1.1
The climate of the Division is characterized by hotsummer and is generally dry except during the south-
west monsoon season. The temperature varies from 150C
to 400C. The average annual rainfall of the Division is1051mm, received mainly from south-west monsoons.
The soils vary with underlying rock formation. Black
cotton soils, Chalka and Red, Sandy loams, Saline andAlkaline soils. The District is well endowed with rich
reserves of coal, iron ore, lime stone and clays.
The total population of the Division is 0.71 million(2011 Census). The Per capita forest area is 0.27 Ha. The
population density is 148 persons per Km2.
4.1.2 Recorded Forest Area:
The notified forest area of the Division is 1830.35 Km2 which is 41.51 % of the geographical area. The area underReserved, Protected and Un-classed Forests is 996.47 Km2 (54.45%), 820.32 Km2 (44.8%) and 13.56 Km2 (0.7%) respectively.
As per Champion and Seth’s classification the Forests of Division fall under Tropical Dry Deciduous & Bamboo
Mixed Forests (Dry Teak bearing Forests, Dry Mixed Forests).
4.1.3 Protected Area:
There is no Protected Area in the Division.
4.1.4 Community Forest Management:
There are 390 Vana Samrakshana Samities (VSSs) or Joint Forest
Protection Committees (JFPCs) in the Division. An area of 359.34 Km2 forests,which is 21.06 % of the notified forests, is under the management of the
VSSs.
4.1.5 Forest Cover:
The forest cover in the Division based on the interpretation of IRS P6LISS III 2010 data (Dec 2010) is 1315.16 Km2 which is 29.83% of the
4.1 ADILABAD DIVISION
Land use Area in SqKm PercentageForest including Scrub 1699.55 38.54
Agriculture 2153.17 48.83
Land with Scrub 293.57 6.66Fallow Lands 84.42 1.91
Grasslands 0.00 0.00
Settlements 20.03 0.46Vegetation outside Forest 108.2 2.46
Water Bodies 50.47 1.14
Total 4409.41
Table 4.1.1: Land use Pattern
Fig 4.1.1
Adilabad Circle

18
Andhra Pradesh State of Forests - 2012
There are 75 Beats in the Division. Negative changes in forest cover are noticed in 17 Beats only. There are nochanges in the remaining 58 Beats.
Details of forest cover changes in the 17 Beats mentioned above are shown in Table 4.1.3.
Geographical area. In terms of the forest canopy density classes the Division has 52.31Km2 of Very Dense Forests,925.03Km2 of Moderately Dense Forests and 337.82 Km2 of Open Forests. The area of the Scrub is 382.16 Km2, Non-Forest
194.26Km2 and Water Bodies 7.37 Km2. The distribution of the forest cover of the Division is shown in Fig 4.1.1
4.1.6 Change in Forest Cover:
The Satellite images of 2009 and 2010 have been shown in Fig (4.1.2 & 4.1.3) and the changes between this periodare shown on the image of 2010.
Comparison of the current forest cover with that of previous assessment year shows a negative change of 84.99 Ha.The forest cover change matrix given in Table 4.1.2 reveals that there is a decrease of 25.88 Ha of moderately dense forestand 59.11 Ha of open forest.
The total Negative change (including scrub) is 92.62 Ha in which 3.59 Ha is on account of diversion of forest landfor non-forestry purpose and 89.03 Ha is on account of encroachments. Diversion of forest land is to be compensatedand hence not considered as loss of forest cover. Therefore the negative change on account of encroachment alone istaken as loss of forest cover. Hence the net loss of forest cover in the Division is 89.03 Ha only.
Map Showing Change Locations of Adilabad Divisionon IRS P6 LISS III Imagery of Dec - 2010
Fig 4.1.2 Fig 4.1.3
Table 4.1.2: Forest Cover change matrix (Area in Km2)
VDF MDF OF Scrub NF WB
Very Dense Forest 52.31 0.00 0.00 0.00 0.00 0.00 52.31
Moderately Dense Forest 0.00 925.03 0.00 0.26 0.00 0.00 925.29
Open Forest 0.00 0.00 337.82 0.37 0.18 0.04 338.41
Scrub 0.00 0.00 0.00 381.53 0.08 0.00 381.61
Non-Forest 0.00 0.00 0.00 0.00 194.00 0.00 194.00
Water 0.00 0.00 0.00 0.00 0.00 7.33 7.33
Total of 2010 52.31 925.03 337.82 382.16 194.26 7.37 1898.95
Net Change 0.00 -0.26 -0.59 0.55 0.26 0.04
2009Total of
2009
2010
Map Showing LISS III Imagery of Adilabad Divisionof Nov - 2009 to Dec - 2009

19
Longitude 78.313680 ELatitude 19.51380 NArea in Ha 2.35Change MDF to ScrubCompt No 121Beat DedraRange EchodaDivision Adilabad
Table 4.1.3: List of Beats with negative change in Forest Cover
ADILABAD RANGE
Arli(S) 0.00 217.63 300.04 257.12 411.08 3.59 1189.46 -3.59 0.00
Total 0.00 217.63 300.04 257.12 411.08 3.59 1189.46 -3.59 0.00
BOATH RANGE
Arepally 1.12 1411.60 612.25 729.30 560.52 0.00 3314.79 -2.63 2.63
Marlapally 0.00 3221.21 1536.62 489.41 608.72 3.20 5859.16 -2.60 2.60
Neradigonda 0.00 647.94 383.45 684.18 452.94 0.00 2168.51 -3.16 3.16
Pisra 18.32 2023.76 406.94 249.52 180.57 37.08 2916.19 -26.11 26.11
Wadoorpet 0.00 965.42 619.21 428.49 520.80 0.00 2533.92 -2.32 2.32
Total 19.44 8269.93 3558.47 2580.90 2323.55 40.28 16792.57 -36.82 36.82
ECHODA RANGE
Dedra 0.00 2094.28 752.69 788.84 1415.71 0.01 5051.53 -6.65 6.65
Dignoor 0.00 408.22 198.89 497.59 395.69 0.00 1500.39 -3.53 3.53
Madhapur 185.75 864.61 290.25 532.63 49.58 0.01 1922.83 -2.31 2.31
Sirchalma 47.69 1976.58 249.24 595.11 59.04 3.38 2931.04 -7.52 7.52
Sirkonda 22.33 692.87 221.32 831.72 131.31 0.01 1899.56 -2.97 2.97
Talamadri 128.90 1260.04 203.39 672.81 53.88 0.00 2319.02 -1.78 1.78
Waipet 14.60 1571.83 310.87 608.42 126.65 0.00 2632.37 -12.90 12.90
Total 399.27 8868.43 2226.65 4527.12 2231.86 3.41 18256.74 -37.66 37.66
INDERVELLY RANGE
Pochampally(S) 32.63 1734.40 611.97 1036.36 194.07 43.17 3652.60 -2.56 2.56
Shampur 85.94 1833.56 776.11 1022.21 175.69 66.40 3959.91 -1.50 1.50
Waipet[South] 2.75 2558.32 387.78 412.25 62.92 162.46 3586.48 -8.51 8.51
Total 121.32 6126.28 1775.86 2470.82 432.68 272.03 11198.99 -12.57 12.57
UTNOOR RANGE
Utnoor 133.72 3460.72 916.89 237.83 229.44 3.80 4982.40 -1.98 1.98
Total 133.72 3460.72 916.89 237.83 229.44 3.80 4982.40 -1.98 1.98
Grand Total 673.75 26942.99 8777.91 10073.79 5628.61 323.11 52420.16 -92.62 89.03
(Area in ha)
BeatEncroach
mentsVDF MDF OF Scrub NF WB Total
Net
Change
Satellite Images
Forest division wise results

20
Andhra Pradesh State of Forests - 2012
4.2.1 Introduction:
Bellampalli Forest Division lies in Adilabad District between latitudes 180 56’ 16’’ and 190 36’ 58’’ N and longitudes 780
56’ 8’’ and 790 56’ 53’’ E. Geographical Area of the Division is 3293.30km2 which is 20.41 % of the area of the District. The
terrain is undulating with a fringe of low hills in different directions. The general elevation of hill ranges varies from 125
M to 570 M above MSL. Deccan gutta is the highest peak with an elevation of 633 m above MSL.
Land use pattern of the Division is given in Table 4.2.1
The temperature varies from 150C to 400C. The
average annual rainfall of the Division is 1051 mm received
mainly from south-west monsoons.
The soils are predominantly black cotton and red
and the sandy loams are found mostly in the middle and
eastern portion of the Division. The Saline and Alkaline
soils are also found but to a lesser extent.
The prominent geological formations are Archean
Granites and Gneisses, the Deccan trap and the Gondwana
sand stones. The lower Gondwanas bear some coal seams
which are being mined by Singareni Collieries Company
Limited in the Bellampalli-Mancherial belt. The Division
has rich reserves of coal, lime stone and clays.
The population of the Division is 0.40 million (2011 Census). The per capita forest area is 0.37 Ha. The population
density is 116 persons per Km2.
4.2.2 Recorded Forest Area:
The area of notified forests of the Division is 1540.56 Km2 which is 46.77 % of the geographical area. Reserved,
Protected and un-classed forests comprise of 1337.74 Km2 (86.8 %), 163.58 Km2 (10.64%) and 39.24 Km2 (2.5 %) of the
forest area respectively.
As per Champion and Seth’s classification the Forests of Division fall under Tropical Dry Deciduous forests but for
the convenience of forest management classified as Teak forests and Mixed forests.
4.2.3 Protected Area:
There is no Protected Area in the Division.
4.2.4 Community Forest Management:
There are 228 Vana Samrakshana Samities (VSSs) or Joint Forest Protection
Committees (JFPCs) in the Division. An area of 206.92Km2 forests, which is 13.43%of the notified forests, is under the management of the VSSs.
4.2.5 Forest Cover:
The forest cover in the Division based on the interpretation of IRS P6 LISS
III 2010 data (Oct/Dec 2010) is 1281.01 Km2 which is 38.89% of the geographical
area. In terms of the forest canopy density classes the Division has 172.82 Km2 of
4.2 BELLAMPALLY DIVISION
Adilabad Circle
Fig 4.2.1
Land use Area in SqKm Percentage
Forest including Scrub 1392.19 42.27
Agriculture 1563.56 47.48
Land with Scrub 141.66 4.30
Fallow Lands 7.24 0.22
Grasslands 0.10 0.00
Settlements 11.68 0.36
Vegetation outside Forest 95.62 2.90
Water Bodies 81.25 2.47
Total 3293.3
Table 4.2.1: Land use Pattern

21
4.1.6 Change in Forest Cover:
The Satellite images of 2009 and 2010 are shown in Figures (4.2.2 & 4.2.3) and the changes between this period areshown on the image of 2010.
Comparison of the current forest cover with that of previous assessment year shows a positive change of 51.08Ha and negative change of 164.30 Ha. The forest cover change matrix given in Table 4.2.2 reveals that there is a decreaseof 10.42 Ha of moderately dense forest and 102.80 Ha of open forest and 23.24 Ha of scrub.
The positive change is 51.08 Ha on account of growth in raised plantations. The total negative change (includingscrub) is 195.98 Ha. Out of this 168.94 Ha is on account of harvesting of plantations, 11.83 Ha is on account of diversionof forest land for non-forestry purposes and 15.21 Ha on account of encroachments. As harvesting of plantations anddiversion of forests are Forest management interventions and hence not considered as loss of forest cover. Thus onlythe negative change due to encroachments is taken as loss of forest cover. Therefore the net loss of forest cover is 15.21Ha only.
There are 60 Beats in the Division. Negative changes in forest cover are noticed in 10 Beats and positive change in1 Beat. There are no changes in remaining 49 Beats.
Details of forest cover changes in the 11 Beats mentioned above are shown in Table 4.2.3.
Table 4.2.2: Forest Cover change matrix
VDF MDF OF Scrub NF WB
Very Dense Forest 172.82 0.00 0.00 0.00 0.00 0.00 172.82
Moderately Dense Forest 0.00 867.09 0.00 0.05 0.19 0.00 867.33
Open Forest 0.00 0.00 240.59 0.17 1.24 0.00 242.00
Scrub 0.00 0.13 0.00 107.03 0.32 0.00 107.48
Non-Forest 0.00 0.00 0.38 0.00 128.90 0.00 129.28
Water 0.00 0.00 0.00 0.00 0.00 5.88 5.88
Total of 2010 172.82 867.22 240.97 107.25 130.65 5.88 1524.79
Net Change 0.00 -0.11 -1.03 -0.23 1.37 0.00
2009Total of
2009
2010
(Area in Km2)
Forest division wise results
Very Dense Forests, 867.22 Km2 of Moderately Dense Forests and 240.97 Km2 of Open Forests. The area of the Scrub is107.25 Km2, Non-Forest 130.65 Km2 and Water Bodies 5.88 Km2. The distribution of the forest cover of the Division is
shown in Fig 4.2.1
Fig 4.2.2 Fig 4.2.3

22
Andhra Pradesh State of Forests - 2012
BELLAMPALLI RANGE
Bellampally 2.36 656.11 590.58 590.64 894.86 7.10 2741.65 -11.83 0.00
Madaram 431.86 1066.47 294.78 108.18 73.10 0.00 1974.39 -2.96 2.96
Murliguda 574.92 1699.13 289.43 141.64 122.82 0.00 2827.94 -1.74 1.74
Narwaipet 4.14 717.01 559.89 184.60 552.14 16.81 2034.59 -23.63 0.00
Tandur 34.66 513.95 317.51 122.93 124.71 1.10 1114.86 -6.56 0.00
Total 1047.94 4652.67 2052.19 1147.99 1767.63 25.01 10693.43 -46.72 4.70
KUSHNEPALLY RANGE
Rangapet 60.08 993.47 402.04 435.14 1077.04 56.50 3024.27 -84.12 0.00
Total 60.08 993.47 402.04 435.14 1077.04 56.50 3024.27 -84.12 0.00
REBBENA RANGE
Dharmaram 0.00 144.06 901.68 392.14 1439.02 2.40 2879.30 24.27 0.00
Rebbena 20.27 579.02 253.06 305.24 276.18 3.99 1437.76 -7.35 7.35
Takkallapally 122.02 625.04 244.11 128.96 218.76 4.93 1343.82 -27.82 0.00
Total 142.29 1348.12 1398.85 826.34 1933.96 11.32 5660.88 -10.90 7.35
TIRYANI RANGE
Gopera 300.54 2705.62 213.01 261.70 69.39 5.84 3554.69 -1.41 1.41
Kannepally 530.76 2214.49 304.87 63.70 46.16 0.00 3159.98 -1.75 1.75
Total 831.30 4920.11 517.88 325.40 115.55 5.84 6714.67 -3.16 3.16
Grand Total 2081.61 11914.37 4370.96 2734.87 4894.18 98.67 26093.25 -144.90 15.21
BeatEncroach
mentsVDF MDF OF Scrub NF WB Total
Net
Change
Table 4.2.3: List of Beats with change in Forest Cover (Area in Ha)
Satellite Images
Longitude 79.151 990 E
Latitude 19.180230 N
Area in Ha 1.42
Change MDF to Scrub
Compt No 156
Beat Gopera
Range Tiryani
Division Bellampally
“Forests may be gorgeous but there is nothing more alive than a tree that learns how to grow in a cemetery.”

23
4.3.1 Introduction:
Jannaram WLM Forest Division lies in the central portion of Adilabad District between latitudes 180 55’ 21’’ and 190
21’ 5’’ N and longitudes 780 45’ 10’’ and 790 14’ 5’’ E. Geographical Area of the Division is 925.27Km2 which is 5.7 % of the
area of the District. The northwestern corner of this Division is Birsaipet plateau which is 396 M above MSL. This plateau
is all undulating and drains from either side into Peddavagu stream which runs across the plateau from north-east to
south-west.
Land use pattern of the Division is given in Table 4.3.1
The temperature varies from 150C to 400C. Average
annual Rainfall of the Division is 750mm, received mainly
from south-west monsoons.
In this Division about 30 seasonal streams are
identified. The area serves as a catchment for many
streams, which drain into Kadem reservoir and Godavari
River. There are a large number of small, medium and big
tanks scattered through out the Division inside and
outside the Reserve Forest.
Red soils are extensive, followed by Black soils.
Alluvial and laterite soils are found occasionally to a small
extent.
Population of the Division is 0.10 million (2011 Census); Per capita forest area is 0.63 Ha and the population density
is 144 persons per Km2.
4.3.2 Recorded Forest Area:
The notified forest area of the Division is 617.94 Km2 which is 66.78 % of the geographical area. Reserved and
Protected Forests constitute 80.82 Km2 (13.2 %) and 537.12 Km2 (86.8 %) of the forest area respectively.
As per Champion and Seth’s classification the forests of Division fall under Tropical Dry Deciduous & Bamboo
Mixed Forests (Dry Teak bearing Forests and Dry Mixed Forests).
4.3.3 Protected Area:
Large part of the Kawal Wildlife Sanctuary & Tiger Reserve (TR) falls in this Division. The entire notified forest area
of the Division is included in Kawal WLS & TR.
4.3.4 Community Forest Management:
There are 75 Vana Samrakshana Samities (VSSs) or Joint Forest Protection Committees (JFPCs) in the Division. An
area of 122.02 Km2 forests which is 19.74 % of of the notified forests, is under the management of the VSSs.
4.3 JANNARAM WLM DIVISION
Land use Area in SqKm Percentage
Forest including Scrub 631.29 68.23
Agriculture 236.33 25.54
Land with Scrub 9.53 1.03
Fallow Lands 3.91 0.42
Grasslands 0.00 0.00
Settlements 13.03 1.41
Vegetation outside Forest 13.90 1.50
Water Bodies 17.28 1.87
Total 925.27
Table 4.3.1: Land use Pattern
Adilabad CircleForest division wise results

24
Andhra Pradesh State of Forests - 2012
4.3.6 Change in Forest Cover:
The Satellite images of the Division of 2009 and 2010 are shown in Figures 4.3.2 & 4.3.3 respectively and the changes
during this period are shown on the image of 2010.
Comparison of the current forest cover with that of previous assessment year shows a negative change inforest cover of 3.61 Ha. The forest cover change matrix given in Table 4.3.2 reveals that this decrease is in Open forest.
The entire negative change of 3.61Ha is on account of encroachments. Therefore the net loss of forest cover is 3.61 Ha.
4.3.5 Forest Cover:
The forest cover in the Division, based on the interpretation of IRS P6
LISS III 2010 data (Dec 10) is 618.51 Km2 which is 66.85 % of the Geographical
area. In terms of the forest canopy density classes the Division has 41.22 Km2
of Very Dense Forests, 222.25 Km2 of Moderately Dense Forests and 228.78
Km2 of Open Forests. The area of the Scrub is 64.41 Km2, Non-Forest 85.37
Km2 and Water Bodies 1.71 Km2. The distribution of the forest cover of theDivision is shown in Fig 4.3.1
VDF MDF OF Scrub NF WB
Very Dense Forest 41.22 0.00 0.00 0.00 0.00 0.00 41.22
Moderately Dense Forest 0.00 222.25 0.00 0.00 0.00 0.00 222.25
Open Forest 0.00 0.00 228.78 0.04 0.00 0.00 228.82
Scrub 0.00 0.00 0.00 64.37 0.00 0.00 64.37
Non-Forest 0.00 0.00 0.00 0.00 85.37 0.00 85.37
Water 0.00 0.00 0.00 0.00 0.00 1.71 1.71
Total of 2010 41.22 222.25 228.78 64.41 85.37 1.71 643.74
Net Change 0.00 0.00 -0.04 0.04 0.00 0.00
2009
Table 4.3.2: Forest Cover change matrix
Total of
2009
2010
(Area in Km2)
There are 34 Beats in the Division. Negative change in forest cover is noticed only in 1 Beat. There are no changes
in the remaining 33 Beats.
Details of forest cover change in the 1 Beat, viz., Dantanpalli West is shown in Table 4.3.3.
Map Showing LISS III Imagery of Jannaram Divisionof Nov - 2009 to Dec - 2009
Map Showing Change Locations of Jannaram Divisionon IRS P6 LISS III Imagery of Dec - 2010
Fig 4.3.3Fig 4.3.2
Fig 4.3.1

25
Table 4.3.3: List of Beats with change in Forest Cover
Birsaipet Range
Dantanpalli-w 9.34 167.01 87.66 31.37 1104.19 0.00 1399.57 -3.61 3.61
Total 9.34 167.01 87.66 31.37 1104.19 0.00 1399.57 -3.61 3.61
BeatEncroa-
chmentsVDF MDF OF Scrub NF WB Total Net
Change
Satellite Images
(Area in Ha)
Longitude 78.775620 E
Latitude 19.30320 N
Area in Ha 3.61
Change OF to Scrub
Compt No 4
Beat Dantanpalli - W
Range Birsaipet
Division Jannaram
Forest division wise results

26
Andhra Pradesh State of Forests - 2012
4.4.1 Introduction:
Kagaz Nagar Forest Division lies in the North Eastern side of Adilabad District between latitudes 190 11’ 51’’ and 190
36’ 20’’N and longitudes 790 22’ 28’’ and 790 58’ 21’’ E. Geographical area of the Division is 1645.83 Km2 which is 10.20%
of the area of the District. The important rivers and streams of the Division are Wardha, Pranahitha and Peddavagu;
which finally join River Godavari.
Land use pattern of the Division is given in Table 4.4.1
The climate of the Division is generally dry and hot.
The temperatures vary from 150C to 400C. The normal
Annual rainfall of the Division is 904 mm, received mainly
from south-west monsoons.
The rock formations in the Division are Archean
Granites and Gneisses, the Deccan trap and the Gondwana
sand stones. Soils formed from these rocks support good
Teak forests. Soil types are Black cotton, Chalka and Red
loams, Sandy loams, Saline and Alkaline.
The total population of the Division is 0.25 million
(2011 Census). The Per capita forest area is 0.35 ha. The
population density is 155 persons per Km2.
4.4.2 Recorded Forest Area:The notified forest area of the Division is 858.81 Km2 which is 52.18 % of the geographical area. Reserved,
Protected and Un-classed Forests constitute 650.62 Km2 (75.74 %), 206.58 Km2 (24 %) and 1.61 Km2 (0.18 %) of the forestarea respectively.
As per Champion and Seth’s classification the forests of Division fall under Tropical Dry Deciduous & Bamboo
Mixed Forests.
4.4.3 Protected Area:There is no Protected Area in the Division.
4.4.4 Community Forest Management:
There are 113 Vana Samrakshana Samities (VSSs) in the
Division. 148.42 Km2 forest area, which is 17.27% of the forest area,is under the management of the VSSs.
4.4.5 Forest Cover:
The forest cover in the Division, based on the interpretation of
IRS P6 LISS III 2010 data (Oct-Dec 10) is 698.48 Km2 which is 42.43
% of the Geographical area. In terms of the forest canopy densityclasses, the Division has 159.17 Km2 of Very Dense Forests, 377.26
Km2 of Moderately Dense Forests and 162.05 Km2 of Open Forests.
The area of the Scrub is 75.33 Km2, Non-Forests 116.39 Km2 andWater Bodies 3.09 Km2. The distribution of the forest cover of the
Division is shown in Fig 4.4.1
4.4 KAGAZNAGAR DIVISION
Land use Area in SqKm Percentage
Forest including Scrub 777.61 47.25
Agriculture 706.05 42.90
Land with Scrub 73.15 4.44
Fallow Lands 11.61 0.71
Grasslands 0.00 0.00
Settlements 8.51 0.52
Vegetation outside Forest 34.68 2.10
Water Bodies 34.22 2.08
Total 1645.83
Table 4.4.1: Land use Pattern
Fig 4.4.1
Adilabad Circle

27
4.4.6 Change in Forest Cover:
The Satellite images of 2009 and 2010 are shown in Figures 4.4.2 & 4.4.3 respectively and the changes during thisperiod are shown on the image of 2010.
Comparison of the current forest cover with that of previous assessment year shows a negative change of 108.91Ha. The forest cover change matrix given in Table 4.4.2 reveals that there is a decrease of 44.70 Ha of moderately dense
forest and 64.21 Ha of open forest.
The negative change of 27.35 Ha is on account of clearance of jungle growth for raising of plantations, 50.47 Ha on
account of diversion of forest land for non-forestry purposes and 31.09 Ha is on account of encroachments. As raising
of plantations and diversion of forest land are forest management interventions; the same are not considered as loss offorest cover. Thus only the negative change due to encroachment is taken as loss of forest cover, which is 31.09 Ha only.
Table 4.4.2: Forest Cover change matrix (Area in Km2)
VDF MDF OF Scrub NF WB
Very Dense Forest 159.17 0.00 0.00 0.00 0.00 0.00 159.17
Moderately Dense Forest 0.00 377.26 0.00 0.12 0.32 0.00 377.70
Open Forest 0.00 0.00 162.05 0.10 0.04 0.50 162.69
Scrub 0.00 0.00 0.00 75.11 0.00 0.00 75.11
Non-Forest 0.00 0.00 0.00 0.00 116.03 0.00 116.03
Water 0.00 0.00 0.00 0.00 0.00 2.59 2.59
Total of 2010 159.17 377.26 162.05 75.33 116.39 3.09 893.29
Net Change 0.00 -0.44 -0.64 0.22 0.36 0.50
2009Total of
2009
2010
There are 39 Beats in the Division. Negative changes in forest cover are noticed in 11 Beats. There are no changesin remaining 28 Beats.
Details of forest cover changes in the 11 Beats mentioned above are shown in Table 4.4.3
Forest division wise results
Fig 4.4.2 Fig 4.4.3
28
Andhra Pradesh State of Forests - 2012
Satellite Images
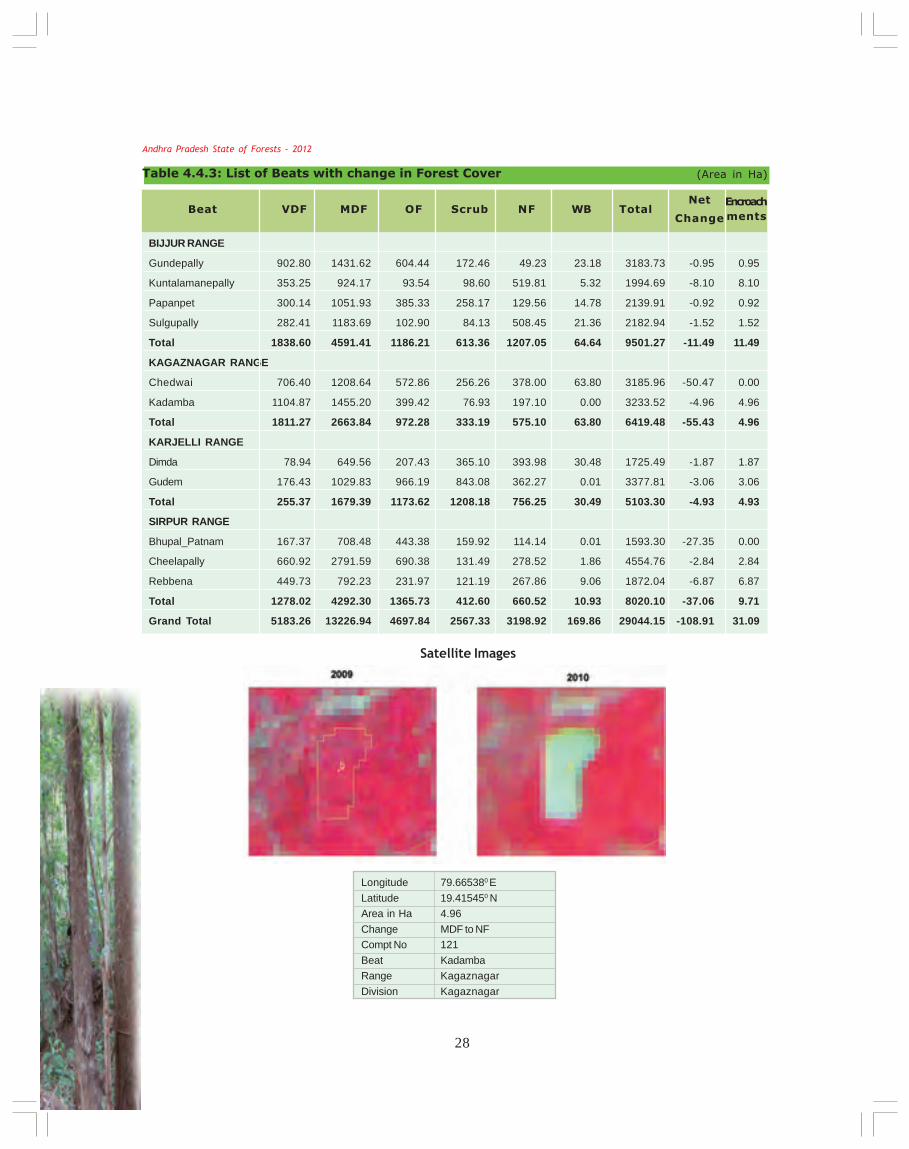
Table 4.4.3: List of Beats with change in Forest Cover (Area in Ha)
BIJJUR RANGE
Gundepally 902.80 1431.62 604.44 172.46 49.23 23.18 3183.73 -0.95 0.95
Kuntalamanepally 353.25 924.17 93.54 98.60 519.81 5.32 1994.69 -8.10 8.10
Papanpet 300.14 1051.93 385.33 258.17 129.56 14.78 2139.91 -0.92 0.92
Sulgupally 282.41 1183.69 102.90 84.13 508.45 21.36 2182.94 -1.52 1.52
Total 1838.60 4591.41 1186.21 613.36 1207.05 64.64 9501.27 -11.49 11.49
KAGAZNAGAR RANGE
Chedwai 706.40 1208.64 572.86 256.26 378.00 63.80 3185.96 -50.47 0.00
Kadamba 1104.87 1455.20 399.42 76.93 197.10 0.00 3233.52 -4.96 4.96
Total 1811.27 2663.84 972.28 333.19 575.10 63.80 6419.48 -55.43 4.96
KARJELLI RANGE
Dimda 78.94 649.56 207.43 365.10 393.98 30.48 1725.49 -1.87 1.87
Gudem 176.43 1029.83 966.19 843.08 362.27 0.01 3377.81 -3.06 3.06
Total 255.37 1679.39 1173.62 1208.18 756.25 30.49 5103.30 -4.93 4.93
SIRPUR RANGE
Bhupal_Patnam 167.37 708.48 443.38 159.92 114.14 0.01 1593.30 -27.35 0.00
Cheelapally 660.92 2791.59 690.38 131.49 278.52 1.86 4554.76 -2.84 2.84
Rebbena 449.73 792.23 231.97 121.19 267.86 9.06 1872.04 -6.87 6.87
Total 1278.02 4292.30 1365.73 412.60 660.52 10.93 8020.10 -37.06 9.71
Grand Total 5183.26 13226.94 4697.84 2567.33 3198.92 169.86 29044.15 -108.91 31.09
BeatEncroach
mentsVDF MDF OF Scrub NF WB Total
Net
Change
Longitude 79.665380 E
Latitude 19.415450 N
Area in Ha 4.96
Change MDF to NF
Compt No 121
Beat Kadamba
Range Kagaznagar
Division Kagaznagar

29
4.5.1 Introduction:
Mancherial Forest Division lies in the south-eastern part of Adilabad District between latitudes 180 40’ 10’’ and 190
8’ 42’’ N and longitudes 790 10’ 15’’ and 790 57’ 53’’ E. Geographical area of the Division is 2328.55 Km2 which is 14.4% of
the area of the District. The elevation of hill ranges varies from 135 M – 540 M above MSL. The highest point in the
Division is 556 M above MSL. Godavari and Pranahita are the major rivers of the Division. River Pranahita forms easternboundary- and the River Godavari forms southern boundary of the Division.
Land use pattern of the Division is given in Table 4.5.1
The temperature varies from 150C to 400C. The
average annual rainfall of the Division is 1100mm received
mainly from south-west monsoon.
The soils of Mancherial Division range from Black
cotton, Chalka, Sandy loam, Red loam to Saline andAlkaline. The Black cotton, Chalka and Red loamy soils
are found throughout the Division and the sandy loams
are found mostly in the middle portion of the Division.Coal is found in the Barakar sand stone of Gondwanas
and the limestone deposits are found in Rally block, well
suited for cement manufacture.
Population of the Division is 0.56 million (2011 Census), per capita forest area is 0.20 Ha and the population density
is 261 persons per Km2.
4.5.2 Recorded Forest Area:
The notified forest area of the Division is 1205.83 Km2 which is 51.85 % of the geographical area. Reserved,
Protected and Un-classed Forests constitute 1180.64 Km2 (97.92 %), 24.09 Km2 (0.0199 %) and 1.10 Km2 (0.09 %) of theforest area respectively.
As per Champion and Seth’s classification the Forests of Division fall under Tropical Dry Deciduous & BambooMixed Forests (Dry Teak bearing Forests, Dry Mixed Forests).
4.5.3 Protected Area:
There are 2 Protected Areas in the Division. The first one is Pranahita
Wild Life Sanctuary with an area of 68.37 Km2 or 2.9% of the geographic
area of the Division. The second one is a part of Shivaram Wild LifeSanctuary which includes 2 Beats of the Division with an area of 14.23 km2.
4.5.4 Community Forest Management:
There are 113 Vana Samrakshana Samities (VSSs) in the Division.137.67 Km2 or 11.41 % of notified forest area is under the management of
VSSs.
4.5.5 Forest Cover:
The forest cover in the Division based on the interpretation of IRS P6
LISS III 2010 data (Oct 2010-Dec 2010) is 906.89 Km2 which is 38.95 % of
4.5 MANCHERIAL DIVISION
Fig. 4.5.1.
Adilabad Circle
Table 4.5.1: Land use Pattern
Land use Area in SqKm Percentage
Forest including Scrub 1026.02 44.06
Agriculture 983.23 42.22
Land with Scrub 115.78 4.97
Fallow Lands 63.42 2.72
Grasslands 0.00 0.00
Settlements 13.76 0.59
Vegetation outside Forest 65.25 2.81
Water Bodies 61.1 2.63
Total 2328.56
Forest division wise results

30
Andhra Pradesh State of Forests - 2012
4.5.6 Change in Forest Cover:
The Satellite images of 2009 and 2010 are shown in Figures 4.5.2 & 4.5.3 respectively and the changes during this
period are shown on the image of 2010.
Comparison of the current forest cover with that of previous assessment year shows a negative change of 63.68 Ha.The forest cover change matrix given in Table 4.5.2 reveals that there is a decrease of 51.44 Ha of moderately dense forest,
12.24 Ha of open forest and 51.36 Ha of Scrub.
The entire negative change (including scrub) of 115.04 Ha is on account of clearance of growth for raising ofplantations. As clearance of growth for raising of plantations is a forest management intervention, the same is not
considered as loss of forest cover. Therefore, there is no net loss of forest cover.
VDF MDF OF Scrub NF WB
Very Dense Forest 50.23 0.00 0.00 0.00 0.00 0.00 50.23
Moderately Dense Forest 0.00 576.63 0.00 0.00 0.51 0.00 577.14
Open Forest 0.00 0.00 280.43 0.00 0.12 0.00 280.55
Scrub 0.00 0.00 0.00 114.88 0.52 0.00 115.40
Non-Forest 0.00 0.00 0.00 0.00 81.64 0.00 81.64
Water 0.00 0.00 0.00 0.00 0.00 10.41 10.41
Total of 2010 50.23 576.63 280.43 114.88 82.79 10.41 1115.37
Net Change 0.00 -0.51 -0.12 -0.52 1.15 0.00
2009
Table 4.5.2: Forest Cover change matrix (Area in km2)
Total of
2009
2010
Fig : 4.5.2 Fig : 4.5.3
There are 50 Beats in the Division. Negative changes in the forest cover are noticed in 4 Beats only. There are nochanges in remaining 46 Beats.
Details of forest cover changes in the 4 Beats mentioned above are shown in Table 4.5.3
the Geographical area. In terms of the forest canopy density classes, the Division has 50.23 Km2 of Very Dense Forests,
576.63 Km2 of Moderately Dense Forests and 280.03 Km2 of Open Forests. The area of the Scrub is 115.28 Km2, Non-
Forest 82.79 Km2 and Water Bodies 10.41 Km2. The distribution of the forest cover of the Division is shown in Fig 4.5.1

31
Table 4.5.3: List of Beats with negative change in Forest Cover
MANCHERIAL RANGE
Dampur 0.00 1443.32 309.22 23.44 73.60 0.00 1849.58 -51.44 0.00
Indaram 0.00 441.30 769.01 503.89 520.53 0.16 2234.89 -12.24 0.00
Jaipur 5.23 568.43 313.81 112.47 159.33 7.07 1166.34 -11.57 0.00
Kundaram 2.42 1298.98 543.17 22.07 174.30 0.00 2040.94 -39.79 0.00
Total 7.65 3752.03 1935.21 661.87 927.76 7.23 7291.75 -115.04 0.00
Grand Total 7.65 3752.03 1935.21 661.87 927.76 7.23 7291.75 -115.04 0.00
(Area in Ha)
BeatEncroach
mentsVDF MDF OF Scrub NF WB Total
Net
Change
Satellite Images
A nation that destroys its soils destroys itself. Forests are the lungs of our land, purifying the air and giving fresh strength to our people.- Franklin D. Roosevelt
Longitude 79.624690 E
Latitude 18.901440 N
Area in Ha 51.44
Change MDF to NF
Compt No 73
Beat Dampur
Range Mancherial
Division Mancherial
Forest division wise results

32
Andhra Pradesh State of Forests - 2012
4.6.1 Introduction:
Nirmal Forest Division lies in the south-western part of Adilabad District between latitudes 180 50’ 39’’ and 190 20’
31’’N and longitudes 770 45’ 45’’ and 780 56’ 34’’ E. Geographical area of the Division is 3525.62 Km2 which is 21.8% of the
area of the District. Godavari is the major river of the Division and forms its southern boundary. Siddha and Kaddam are
other important rivers, which are tributaries of River Godavari.
Land use pattern of the Division is given in Table 4.6.1
The temperature varies from 150C to 400C. The
normal Annual rainfall of the Division is 800 mm received
mainly from south-west monsoons.
Soils found in the Division are black, chalka and
red, sandy loams, saline and alkaline. The Division has
reserves of iron ore, lime stone and clays.
Population of the Division is 0.69 million (2011
Census), per capita forest area is 0.15 Ha and the
population density is 209 persons per Km2.
4.6.2 Recorded Forest Area:
The total notified forest area of the Division is 1178.4
Km2, which is 33.42 % of the total geographical area. Reserved, Protected and Un-classed Forests Constitute 354.57 Km2
(30%), 743.17 Km2 (63%) and 80.66 Km2 (7%) of the total forest area respectively.
As per Champion and Seth’s classification the forests of Division fall under Tropical Dry Deciduous & Bamboo
Mixed Forests (Dry Teak bearing Forests, Dry Mixed Forests).
4.6.3 Protected Area:
A part of the Kawal Wildlife Sanctuary & Tiger Reserve, with an area of 315.01 km2 of notified forests or 30.27 % of
Division Forest area; is included in the Division.
4.6.4 Community Forest Management:
There are 205 Vana Samrakshana Samities (VSSs) in the Division.
An area of 282.48 Km2 forests, which is 23.97 % of the notified forests,
is under the management of the VSSs.
4.6.5 Forest Cover:
The forest cover in the Division, based on the interpretation of IRS
P6 LISS III 2010 data (Dec 2010) is 857.84 Km2 which is 24.33 % of the
geographical area. In terms of the forest canopy density classes the
Division has 7.18 Km2 of Very Dense Forests, 650.23 Km2 of Moderately
4.6 NIRMAL DIVISION
Land use Area in SqKm Percentage
Forest including Scrub 927.25 26.30
Agriculture 1951.56 55.35
Land with Scrub 81.76 2.32
Fallow Lands 75.74 2.15
Grasslands 0.46 0.01
Settlements 32.49 0.92
Vegetation outside Forest 144.85 4.11
Water Bodies 311.52 8.84
Total 3525.63
Table 4.6.1: Land use Pattern
Fig 4.6.1
Adilabad Circle

33
Fig 4.6.2 Fig 4.6.3
Dense Forests and 200.43 Km2 of Open Forests. The area of the Scrub is 68.55 Km2, Non-Forest 92.40 Km2 and WaterBodies 6.37 Km2. The distribution of the forest cover of the Division is shown in Fig 4.6.1
4.6.6 Change in Forest Cover:
The Satellite images of 2009 and 2010 are shown in Fig 4.6.2 & Fig 4.6.3 respectively and the changes during this
period are shown on the image of 2010.
Comparison of the current forest cover with that of previous assessment year shows a negative change in forestcover of 76.24 Ha. The forest cover change matrix given in Table 4.6.2 reveals that there is a decrease of 53.57 Ha ofmoderately dense forest and 22.67 Ha of open forest.
Negative change (including scrub) of 1.16 Ha is on account of diversion of forest land for non-forestry purpose,
16.55 Ha is on account of clearance of growth for raising of plantations and 58.53 Ha is on account of encroachments. Asdiversion of forest land and clearance of growth for raising of plantations are management interventions and hence not
considered as loss of forest cover. Therefore the negative change on account of encroachment is considered as loss of
forest cover. Therefore, the net loss of forest cover is 58.53 Ha in the Division.
Table 4.6.2: Forest Cover change matrix (Area in Km2)
VDF MDF OF Scrub NF WB
Very Dense Forest 7.18 0.00 0.00 0.00 0.00 0.00 7.18
Moderately Dense Forest 0.00 650.23 0.04 0.44 0.06 0.00 650.77
Open Forest 0.00 0.00 200.39 0.20 0.03 0.00 200.62
Scrub 0.00 0.00 0.00 67.91 0.00 0.00 67.91
Non-Forest 0.00 0.00 0.00 0.00 92.31 0.00 92.31
Water 0.00 0.00 0.00 0.00 0.00 6.37 6.37
Total of 2010 7.18 650.23 200.43 68.55 92.40 6.37 1025.16
Net Change 0.00 -0.54 -0.19 0.64 0.09 0.00
2009Total of
2009
2010
There are 56 Beats in the Division. Negative changes in forest cover are noticed in 13 Beats. There are no changes
in the remaining 43 Beats.
Details of forest cover changes in these 43 Beats are shown in Table 4.6.3.
Forest division wise results

34
Andhra Pradesh State of Forests - 2012
Satellite Images
Table No: 4.6.3 List of Beats with negative change in Forest Cover (Area in Ha)
KADAM RANGE
Alampally_east 50.11 1866.77 248.20 55.72 188.62 0.00 2409.41 -8.64 8.64
Alampally_west 5.53 1648.19 491.54 27.10 84.85 11.63 2268.84 -13.81 13.81
Total 516.79 14268.18 3655.83 648.84 948.43 273.39 20311.48 -22.45 22.45
KHANAPUR RANGE
Nagapur 19.32 2026.00 184.09 3.04 4.55 3.79 2240.79 -1.90 1.90
Pochampally 4.97 1056.40 322.75 74.57 229.78 0.16 1688.63 -11.28 11.28
Rajura 1.13 1314.01 133.47 24.32 70.81 9.33 1553.07 -4.10 4.10
Singapur 12.01 1557.02 218.68 17.41 28.85 12.47 1846.44 -1.86 1.86
Somwarpet 2.40 1149.44 203.03 51.87 228.81 26.22 1661.77 -1.47 1.47
Total 73.30 14886.05 2492.96 338.02 898.03 131.76 18820.10 -20.61 20.61
MAMDA RANGE
Medpally 0.00 1480.81 197.14 128.96 152.88 3.09 1962.88 -21.84 5.29
Total 29.06 10349.91 3939.84 1852.91 1150.51 118.20 17440.42 -21.84 5.29
NIRMAL RANGE
Chincholi 0.00 817.19 209.69 94.13 50.45 5.78 1177.24 -1.16 0.00
Dhani 0.00 1146.72 266.52 159.94 85.14 11.40 1669.72 -1.62 1.62
Total 0.00 9403.53 5067.90 3347.05 4555.58 54.63 22428.72 -2.78 1.62
PEMBI RANGE
Domdhari 4.08 2736.56 690.55 37.78 179.63 49.73 3698.33 -2.82 2.82
Paspula 17.00 2682.75 331.17 75.36 280.93 0.00 3387.21 -3.30 3.30
Raidhari 61.40 1495.83 291.99 127.65 308.80 0.00 2285.67 -2.44 2.44
Total 98.38 16169.38 4905.25 604.49 1678.75 59.09 23515.30 -8.56 8.56
Division Total 717.53 65077.05 20061.78 6791.31 9231.30 637.05 102516.02 -76.24 58.53
BeatEncroach
mentsVDF MDF OF Scrub NF WB Total
Net
Change
Longitude 78.534940 E
Latitude 19.178990 N
Area in Ha 5.61
Change MDF to NF
Compt No 799
Beat Pochampally
Range Khana Pur
Division Nirmal
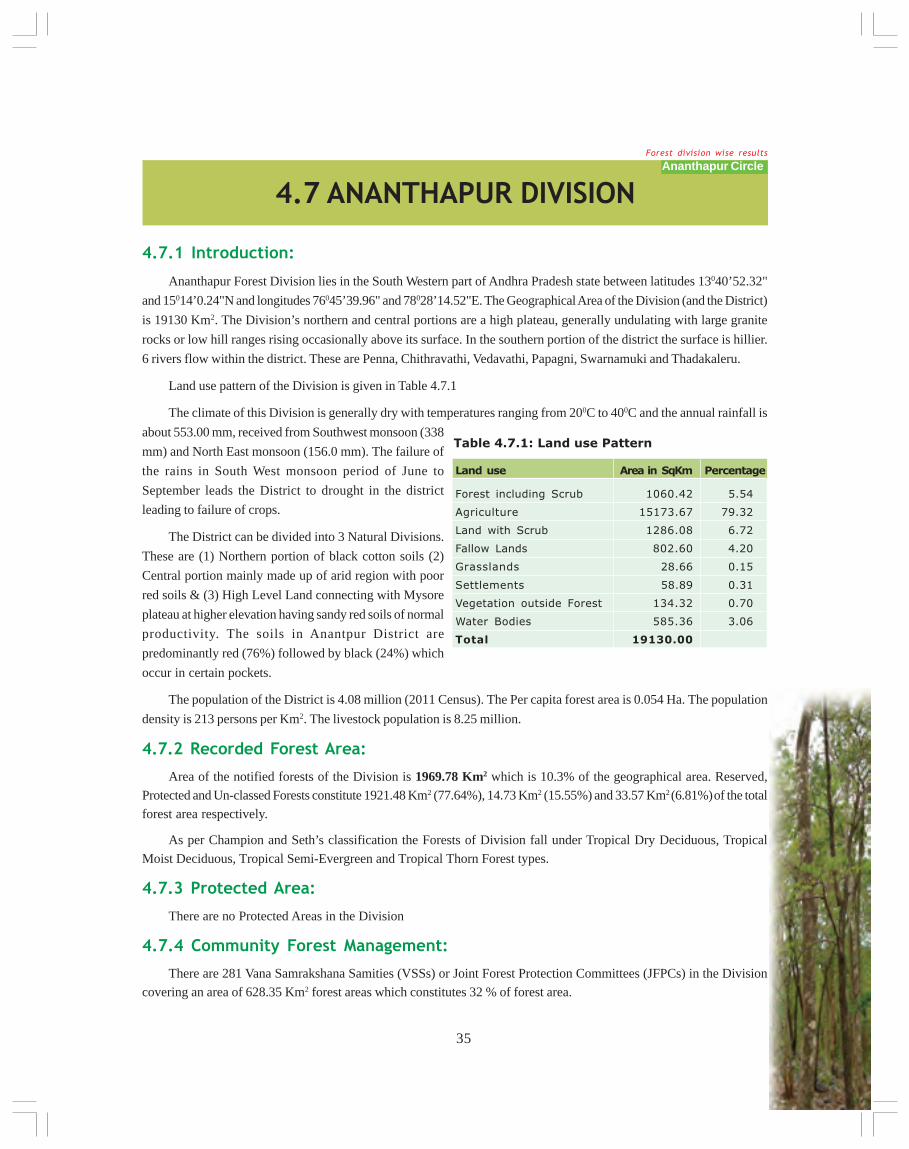
35
4.7.1 Introduction:
Ananthapur Forest Division lies in the South Western part of Andhra Pradesh state between latitudes 13040’52.32"
and 15014’0.24"N and longitudes 76045’39.96" and 78028’14.52"E. The Geographical Area of the Division (and the District)
is 19130 Km2. The Division’s northern and central portions are a high plateau, generally undulating with large granite
rocks or low hill ranges rising occasionally above its surface. In the southern portion of the district the surface is hillier.
6 rivers flow within the district. These are Penna, Chithravathi, Vedavathi, Papagni, Swarnamuki and Thadakaleru.
Land use pattern of the Division is given in Table 4.7.1
The climate of this Division is generally dry with temperatures ranging from 200C to 400C and the annual rainfall is
about 553.00 mm, received from Southwest monsoon (338
mm) and North East monsoon (156.0 mm). The failure of
the rains in South West monsoon period of June to
September leads the District to drought in the district
leading to failure of crops.
The District can be divided into 3 Natural Divisions.
These are (1) Northern portion of black cotton soils (2)
Central portion mainly made up of arid region with poor
red soils & (3) High Level Land connecting with Mysore
plateau at higher elevation having sandy red soils of normal
productivity. The soils in Anantpur District are
predominantly red (76%) followed by black (24%) which
occur in certain pockets.
The population of the District is 4.08 million (2011 Census). The Per capita forest area is 0.054 Ha. The population
density is 213 persons per Km2. The livestock population is 8.25 million.
4.7.2 Recorded Forest Area:
Area of the notified forests of the Division is 1969.78 Km2 which is 10.3% of the geographical area. Reserved,
Protected and Un-classed Forests constitute 1921.48 Km2 (77.64%), 14.73 Km2 (15.55%) and 33.57 Km2 (6.81%) of the total
forest area respectively.
As per Champion and Seth’s classification the Forests of Division fall under Tropical Dry Deciduous, Tropical
Moist Deciduous, Tropical Semi-Evergreen and Tropical Thorn Forest types.
4.7.3 Protected Area:
There are no Protected Areas in the Division
4.7.4 Community Forest Management:
There are 281 Vana Samrakshana Samities (VSSs) or Joint Forest Protection Committees (JFPCs) in the Division
covering an area of 628.35 Km2 forest areas which constitutes 32 % of forest area.
4.7 ANANTHAPUR DIVISION
Land use Area in SqKm Percentage
Forest including Scrub 1060.42 5.54
Agriculture 15173.67 79.32
Land with Scrub 1286.08 6.72
Fallow Lands 802.60 4.20
Grasslands 28.66 0.15
Settlements 58.89 0.31
Vegetation outside Forest 134.32 0.70
Water Bodies 585.36 3.06
Total 19130.00
Table 4.7.1: Land use Pattern
Ananthapur CircleForest division wise results
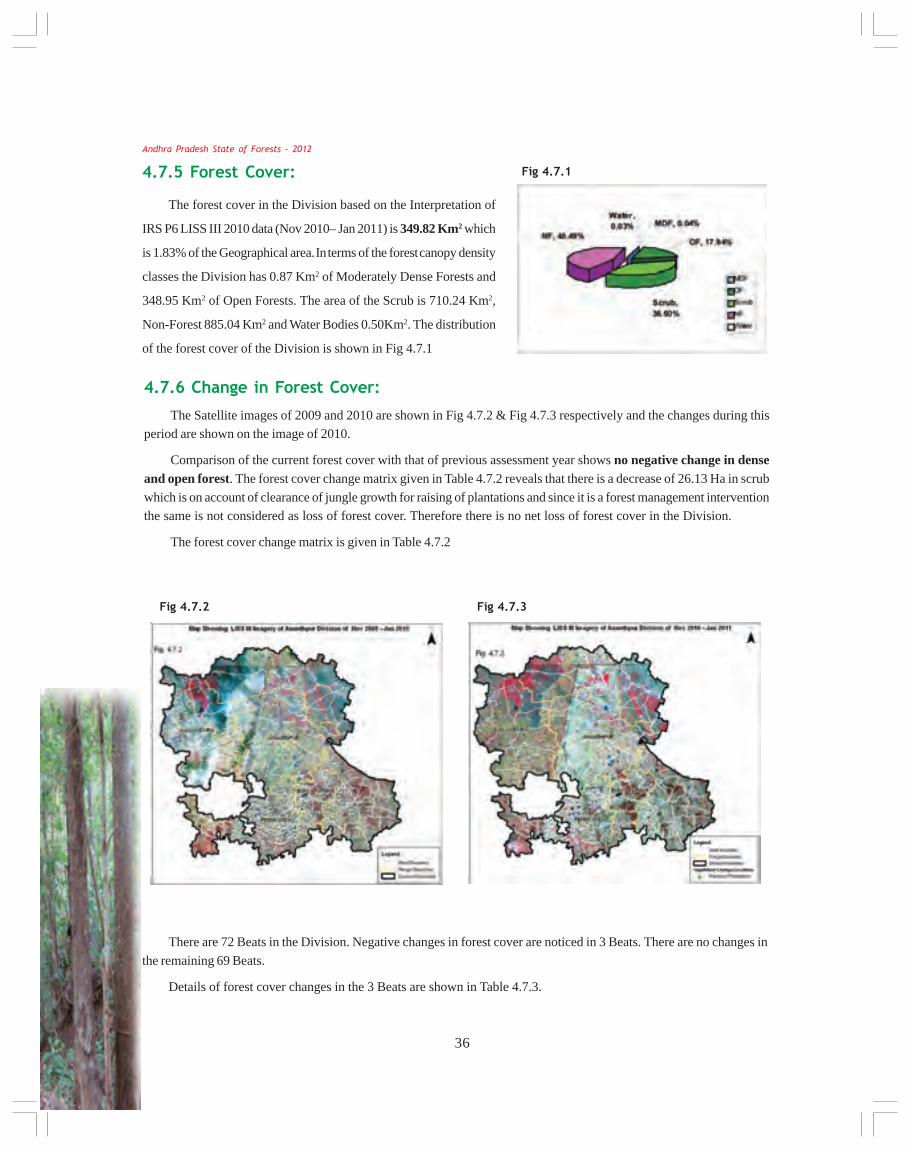
36
Andhra Pradesh State of Forests - 2012
4.7.6 Change in Forest Cover:
The Satellite images of 2009 and 2010 are shown in Fig 4.7.2 & Fig 4.7.3 respectively and the changes during thisperiod are shown on the image of 2010.
Comparison of the current forest cover with that of previous assessment year shows no negative change in denseand open forest. The forest cover change matrix given in Table 4.7.2 reveals that there is a decrease of 26.13 Ha in scrub
which is on account of clearance of jungle growth for raising of plantations and since it is a forest management interventionthe same is not considered as loss of forest cover. Therefore there is no net loss of forest cover in the Division.
The forest cover change matrix is given in Table 4.7.2
4.7.5 Forest Cover:
The forest cover in the Division based on the Interpretation of
IRS P6 LISS III 2010 data (Nov 2010– Jan 2011) is 349.82 Km2 which
is 1.83% of the Geographical area. In terms of the forest canopy density
classes the Division has 0.87 Km2 of Moderately Dense Forests and
348.95 Km2 of Open Forests. The area of the Scrub is 710.24 Km2,
Non-Forest 885.04 Km2 and Water Bodies 0.50Km2. The distribution
of the forest cover of the Division is shown in Fig 4.7.1
Fig 4.7.1
Fig 4.7.2 Fig 4.7.3
There are 72 Beats in the Division. Negative changes in forest cover are noticed in 3 Beats. There are no changes in
the remaining 69 Beats.
Details of forest cover changes in the 3 Beats are shown in Table 4.7.3.

37
Table 4.7.2: Forest Cover change matrix (Area in Km2)
VDF MDF OF Scrub NF WB
Very Dense Forest 0.00 0.00 0.00 0.00 0.00 0.00 0.00
Moderately Dense Forest 0.00 0.87 0.00 0.00 0.00 0.00 0.87
Open Forest 0.00 0.00 348.95 0.00 0.00 0.00 348.95
Scrub 0.00 0.00 0.00 710.24 0.26 0.00 710.50
Non-Forest 0.00 0.00 0.00 0.00 884.78 0.00 884.78
Water 0.00 0.00 0.00 0.00 0.00 0.50 0.50
Total of 2010 0.00 0.87 348.95 710.24 885.04 0.50 1945.60
Net Change 0.00 0.00 0.00 -0.26 0.26 0.00
2009Total of
2009
2010
Table 4.7.3: List of Beats with negative change in Forest Cover (Area in Ha)
KALYANDURG RANGE
Beluguppa 0.00 0.00 13.94 321.31 854.02 0.72 1,189.99 -4.93 0.00
Dharmapuri 0.00 0.00 99.95 1,103.08 1,398.73 0.00 2,601.76 -10.66 0.00
Kalyanadurg 0.00 0.00 37.57 984.42 2,083.36 0.00 3,105.35 -10.54 0.00
Total 0.00 0.00 151.46 2,408.81 4,336.11 0.72 6,897.10 -26.13 0.00
Grand Total 0.00 0.00 151.46 2,408.81 4,336.11 0.72 6,897.10 -26.13 0.00
BeatEncroach
mentsVDF MDF OF Scrub NF WB Total
Net
Change
Forest division wise results

38
Andhra Pradesh State of Forests - 2012
Fig 4.8.1
4.8.1 Introduction:
Chittoor West Forest Division lies in the Southern Part of Andhra Pradesh state between latitudes 120 37’ 22" and 130
59’ 37.76"N and longitudes 780 40’ 12" and 790 08’ 35.52" E. Geographical area of the Division is 7944 Km2 which is 52.32%
of the geographical area of the District. Terrain can be roughly divided in to Hills and plateaus and Outer slopes and
Outliners. The Eastern Ghats traverse this Division from South-West to North – east. Palmaner, Punganur, Madanapalli
Plateaus are constituents of the Mysore Plateau. The elevation of the Division varies from 305M on plains to 1377M on
the hills. One of the prominent hills in the Division is Horsley Hills 1314M above MSL.
Land use pattern of the Division is given in Table 4.8.1
The climate of the Division is equable, healthy and
pleasant. The temperatures ranging from 120C to 380C
and the average rainfall of the Division is 730 mm.
The soils in the Division are red loamy, red sandy,
black clay, black loamy, black sandy and red clay.
The population of the Division is 2.07 million (2011
Census). The per capita forest area is 0.10 Ha &
population density is 262 persons per Km2.
4.8.2 Recorded Forest Area:
The notified forest area of the Division is 2068 Km2
which is 26% of the geographical area. Reserved,
Protected and Un-classed Forests constitute 1510.5 Km2 (73%), 550.85 Km2 (26.64%) and 6.72 Km2 (0.32%) of the forest
area respectively.
As per Champion and Seth’s classification the Forests of Division fall under Dry Tropical South Indian Mixed
Deciduous Forests, Southern Cutch Thorn Forest Groups & Tropical Dry Evergreen Forests.
4.8.3 Protected Area:
There is one Protected Area in the Division, viz., Koundinya Wildlife Sanctuary with an extent of 815.50 Km2.
4.8.4 Community Forest Management:
There are 119 Joint-Forest Protection Committees (JFPCs) or Vana
Samrakshana Samities (VSSs) in the Division. An area of 222.34 Km2 forests
which is 10.8% of the notified forests is under the management of the
VSSs.
4.8.5 Forest Cover:
The forest cover in the Division, based on the interpretation of IRS
P6 LISS III 2010 data (Jan 2011) is 1160.43 Km2 which is 14.61% of the
4.8 CHITTOOR WEST DIVISION
Land use Area in SqKm Percentage
Forest including Scrub 1807.19 22.75
Agriculture 4377.76 55.11
Land with Scrub 855.53 10.77
Fallow Lands 593.37 7.47
Grasslands 11.69 0.15
Settlements 11.63 0.14
Vegetation outside Forest 88.07 1.11
Water Bodies 198.77 2.50
Total 7944.00
Table 4.8.1: Land use Pattern
Ananthapur Circle

39
There are 84 Beats in the Division. There is no change in the forest cover in any of the Beats.
Geographical area. In terms of forest canopy cover density classes the Division has 0.03 Km2 of Very Dense Forests,
197.72 Km2 of Moderately Dense Forests and 962.68 Km2 of Open Forests. The area of the Scrub is 646.34Km2, Non-
Forest 280.62 Km2 and Water Bodies 2.37 Km2. The distribution of the forest cover of the Division is shown in Fig 4.8.1.
4.8.6 Change in Forest Cover:
The Satellite images of 2009 and 2010 are shown in Fig 4.8.2 and Fig 4.8.3 respectively.
Comparison of the current forest cover with that of previous assessment year does not show any change in the
forest cover. The forest cover change matrix is given in Table 4.8.2.
Fig : 4.8.3Fig : 4.8.2
Table 4.8.2: Forest Cover change matrix (Area in Km2)
VDF MDF OF Scrub NF WB
Very Dense Forest 0.03 0.00 0.00 0.00 0.00 0.00 0.03
Moderately Dense Forest 0.00 197.72 0.00 0.00 0.00 0.00 197.72
Open Forest 0.00 0.00 962.68 0.00 0.00 0.00 962.68
Scrub 0.00 0.00 0.00 646.34 0.00 0.00 646.34
Non-Forest 0.00 0.00 0.00 0.00 280.62 0.00 280.62
Water 0.00 0.00 0.00 0.00 0.00 2.37 2.37
Total of 2010 0.03 197.72 962.68 646.34 280.62 2.37 2089.76
Net Change 0.00 0.00 0.00 0.00 0.00 0.00 0.00
2009Total of
2009
2010
Forest division wise results

40
Andhra Pradesh State of Forests - 2012
4.9.1 Introduction:
Achampet WLM Forest Division lies in the south eastern part of Mahabubnagar District between latitudes 160 08’
50’’ and 160 37’ 45’’ N and longitudes 780 4’ 30’’ and 780 58’ 50’’ E. The Geographical Area of the Division is 4303.47 Km2,
which is 23.35 % of the geographical area of the District. The Division has two physiographic zones, the Amrabad plateau
of Nallamalai hills having an altitude of 500 to 876 M and the plains having an altitude of 200 to 500 M. The River Krishna
forms Southern boundary of the Division as well as the District. Major tributaries of Krishna falling in Division are Dindi,
Bhumunikolanu vagu, Nallavagu, Buggavagu and Yemulapayavagu.
Land use pattern of the Division is given in Table 4.9.1
The climate of this Division is generally
dry with temperatures ranging from 150C to
410C. The annual rainfall is about 700 mm
received mainly from Southwest monsoons.
Srisailam quartzite occupies most part of
the Division. The soil types found mainly are
Black cotton, Red and Brown sandy loam.
The total population of the Division is
0.49 million (2011 Census) which constitutes
12.25 % of the total population of the District.
The per capita forest area is 0.49 Ha. The
population density is 106 persons per Km2.
The livestock population is 4.82 million.
4.9.2 Recorded Forest Area:
The notified forest area of the Division is 2423.36 Km2, which is 56.31% of the geographical area. Extents of
Reserved, Protected and Un-classed forests are 1881.51 Km2 (77.64%), 376.72 Km2 (15.55%) and 165.03 Km2 (6.81%)respectively of the total forest area.
As per Champion and Seth’s classification the Forests of Division fall under Tropical Dry Deciduous, Tropical
Moist Deciduous, Tropical Semi-Evergreen and Tropical Thorn Forest types.
4.9.3 Protected Area:
The Division is one of the 4 constituent Divisions of Nagarjuna Sagar–Srisailam Tiger Reserve (NSTR). Out of
2,423.36 Km2 of forest area an area of 1750 Km2 is included in the NSTR.
4.9.4 Community Forest Management:
There are 79 Vana Samrakshana Samities (VSSs) or JFPCs in the Division. 216.73 Km2 or 8.95 % of forest area of theDivision is under management of the VSSs.
4.9 ACHAMPET WLM DIVISION
Land use Area in SqKm Percentage
Forest including Scrub 2293.29 53.29
Agriculture 804.03 18.68
Land with Scrub 236.07 5.49
Fallow Lands 102.87 2.39
Grasslands 127.72 2.97
Settlements 4.03 0.09
Not available for cultivation 645.24 14.99
Water Bodies 90.22 2.10
Total 4303.47
Table 4.9.1: Land use Pattern
Srisailam Circle

41
4.9.5 Forest Cover:
The forest cover in the Division based on the interpretation of IRS P6 LISS
III 2010 data (Oct 2010-Dec 2010) is 1511.58 Km2 which is 35.13% of the
Geographical area. In terms of the forest canopy density classes the Divisionhas 0.33 Km2 of Very Dense Forests, 479.11 Km2 of Moderately Dense Forests
and 1032.14 Km2 of Open Forests. The area of the Scrub is 782.23 Km2,that of
Non-Forest 69.60 Km2 and Water Bodies 59.96 Km2. The distribution of theforest cover of the Division is shown in Fig 4.9.1
4.9.6 Change in Forest cover:
The satellite images of 2009 and 2010 are shown in Figs 4.9.2 & 4.9.3 respectively.
Comparison of the current forest cover with that of previous assessment year shows that there is no change in theforest cover between this period. The simplified forest cover change matrix is given in Table 4.9.2.
There are 70 Beats in the Division and there is no change in forest cover in any of the 70 Beats during this period.
VDF MDF OF Scrub NF WB
Very Dense Forest 0.33 0.00 0.00 0.00 0.00 0.00 0.33
Moderately Dense Forest 0.00 479.11 0.00 0.00 0.00 0.00 479.11
Open Forest 0.00 0.00 1032.14 0.00 0.00 0.00 1032.14
Scrub 0.00 0.00 0.00 782.23 0.00 0.00 782.23
Non-Forest 0.00 0.00 0.00 0.00 69.60 0.00 69.60
Water 0.00 0.00 0.00 0.00 0.00 59.96 59.96
Total of 2010 0.33 479.11 1032.14 782.23 69.60 59.96 2423.37
Net Change 0.00 0.00 0.00 0.00 0.00 0.00 0.00
2009
Table 4.9.2: Forest Cover change matrix
Total of
2009
2010
(Area in Km2)
Fig : 4.9.3Fig : 4.9.2
Fig : 4.9.1
Forest division wise results

42
Andhra Pradesh State of Forest - 2012
4.10.1 Introduction:
Atmakur WLM Forest Division lies in the north-eastern part of Kurnool District between latitudes 150 39’ 3.6’’ and
160 8’ 52.8’’ N and longitudes 780 15’ 1.8’’ and 780 55’ 57’’ E. Geographical Area of the Division is 2154 Km2 which is 12.20
% of the total area of the District.
Land use pattern of the Division is given in Table 4.10.1.
The climate of this Division is generally dry with temperatures ranging from 200C to 400C and the annual rainfall is
about 670 mm, received mainly from Southwest monsoons.
Important minerals and rocks found in the District are iron, lime stone, steatite, barytes, quartz, asbestos, diamond
and black & pink granite. The soil types found mainly are
Black cotton (East and North Western), Red (South
Eastern) and Brown sandy loam.
The population of the Division is 0.30 million (2011
Census). The per capita forest area is 0.42 Ha. The
Population density is 141 persons per Km2.
4.10.2 Recorded Forest Area:
Area of the notified forest of the Division is 1288.81
Km2 which is 59.83 % of the geographical area. Reserved
and Un-classed Forests constitute 1204.44 Km2 (93.45%)
and 84.37 Km2 (6.54%) of the forest area respectively.
As per Champion and Seth’s classification the Forests of Division fall under Tropical Dry Deciduous, Tropical
Moist Deciduous and Tropical Thorn Forest types.
4.10.3 Protected Area:
The Atmakur Division comprises of Gundla Brahmeswaram Wildlife Sanctuary (GBM), Nagarjuna Sagar Tiger
Reserve (NTSR) and Rollapadu WLS. Out of 1288.81 Km2 of forest area an area of 536.16 Km2 is included in Nagarjuna
Sagar Tiger Reserve (NTSR), 277.88 Km2 in Gundla Brahmeswaram Wildlife Sanctuary (GBM) & 5.20 Km2 in Rollapadu
Wild Life Sanctuary.
4.10.4 Community Forest Management:
There are 47 Vana Samrakshana Samities (VSSs) in the Division. An area of 135.31 Km2 forests, which is 10.5 % of the
notified forests, is under the management of the VSSs.
4.10.5 Forest Cover:
The forest cover in the Division based on the interpretation of IRS P6 LISS III 2010 data (Jan-2011) is 609.06 Km2
which is 28.27 % of the Geographical area. In terms of the forest canopy cover density classes the Division has 5.53 Km2
of Very Dense Forests, 229.08 Km2 of Moderately Dense Forests and 374.45 Km2 of Open Forests. The area of the Scrub
Land use Area in SqKm Percentage
Forest including Scrub 868.80 40.33
Agriculture 784.92 36.44
Land with Scrub 77.13 3.58
Fallow Lands 22.93 1.07
Grasslands 30.68 1.42
Settlements 12.89 0.60
Vegetation outside Forest 103.96 4.83
Water Bodies 252.69 11.73
Total 2154.00
Table 4.10.1: Land use Pattern
4.10 ATMAKUR WLM DIVISIONSrisailam Circle

43
There are 30 Beats in the Division and there are no changes in any of the 30 Beats.
The simplified forest cover change matrix is given in Table 4.10.2.
VDF MDF OF Scrub NF WB
Very Dense Forest 5.53 0.00 0.00 0.00 0.00 0.00 5.53
Moderately Dense Forest 0.00 229.08 0.00 0.00 0.00 0.00 229.08
Open Forest 0.00 0.00 374.45 0.00 0.00 0.00 374.45
Scrub 0.00 0.00 0.00 259.74 0.00 0.00 259.74
Non-Forest 0.00 0.00 0.00 0.00 346.94 0.00 346.94
Water 0.00 0.00 0.00 0.00 0.00 70.03 70.03
Total of 2010 5.53 229.08 374.45 259.74 346.94 70.03 1285.77
Net Change 0.00 0.00 0.00 0.00 0.00 0.00
2009
Table 4.10.2: Forest Cover change matrix (Area in Km2)
Total of
2009
2010
is 259.74 Km2, Non-Forests 346.94 Km2 and Water Bodies is 70.03Km2. The distribution of the forest cover of the Division is shown in
Fig 4.10.1
4.10.6. Change in Forest cover:
The satellite image of 2009 and 2010 seasons are shown in Fig
4.10.2 & 4.10.3.
Comparison of the current forest cover with that of previousassessment year shows that there is no change in forest cover between
this period.
Fig : 4.10.1
Fig : 4.10.2 Fig : 4.10.2
Forest division wise results

44
Andhra Pradesh State of Forest - 2012
4.11.1 Introduction:
Markapur WLM Forest Division lies in the south-eastern part of Prakasham district between latitudes 150 23’ 1’’ and
160 18’ 16’’ N and longitudes 780 47’ 48’’ and 790 57’ 56’’ E. Geographical area of the Division is 7,218 Km2 which is 25.1 %
of the area of the District. The seasonal rivers like Gundlakamma, Sagileru, Musi, Paleru and Manneru flow through theDivision. The Gundlakamma River rises in Nallamala hills and the famous Cumbum Tank is formed across this river.
Land use pattern of the Division is given in Table 4.11.1
The climate of this Division is dry and salubrious, temperatures ranging from 190C to 400C; the annual rainfall is
about 871 mm, received mainly from Southwest monsoons.
Sandstone mixed with quartzite and occasional shales are the characteristic rock formations on the Veligondas and
at their extremes, bordering Kanigiri, the rocks graduallychange into Gneisses or Granite composition. Outcrops
of Barytes and Manganese ores occur in Veligondas. The
soil types found mainly are red loamy, black cotton, sandyloam and sandy.
Population of the Division is 0.86 million (2011
Census), per capita forest area is 0.26 Ha and thepopulation density is 155 persons per Km2.
4.11.2 Recorded Forest Area:
The notified forest area of the Division is 2476.39Km2 which is 34.30% of the geographical area. The status
of entire forest area is Reserved Forest.
As per Champion and Seth’s classification the forests
of Division fall under Southern Tropical Dry Deciduous, as the predominant and climatic climax forest in the Division.The Southern Tropical Thorn Forest also occurs in low elevations and in plains.
4.11.3 Protected Area:
Parts of 2 Protected Areas, viz., the Nagarjuna Sagar Srisailam Tiger Reserve (NSTR) and Gundla Brahmeswaram(GBM) Wild Life Sanctuary, fall in the Division. An area of 1039.51 Km2 is included in the Nagarjuna Sagar Srisailam Tiger
Reserve and 55.45 Km2 in the Gundla Brahmeswaram Wild Life Sanctuary (GBM).
4.11.4 Community Forest Management:
There are 93 Vana Samrakshana Samities (VSSs) in the Division.
An area of 347.14 Km2 forests, which is 14.01 % of the notifiedforests, is under the management of VSSs.
4.11.5 Forest Cover:
The forest cover in the Division based on the interpretation of
IRS P6 LISS III 2010 data (Oct 2010) is 1325.59 Km2 which is 18.36%
of the geographical area. In terms of the forest cover canopy densityclasses the Division has 1.93 Km2 of Very Dense Forests, 372.31 Km2
Land use Area in SqKm Percentage
Forest including Scrub 2014.3 27.91
Agriculture 4267.32 59.12
Land with Scrub 534.29 7.40
Fallow Lands 111.67 1.55
Grasslands 13.84 0.19
Settlements 31.10 0.43
Vegetation outside Forest 188.96 2.62
Water Bodies 56.53 0.78
Total 7218.00
Table 4.11.1: Land use Pattern
Fig : 4.11.1
4.11 MARKAPUR WLM DIVISIONSrisailam Circle

45
of Moderately Dense Forests and 951.35 Km2 of Open Forests. The area of the Scrub is 685.04 Km2, Non-Forest 247.73 Km2
and Water Bodies 14.50 Km2. The distribution of the forest cover of the Division is shown in Fig 4.11.1
4.11.6 Change in Forest Cover:
The satellite images of 2009 and 2010 are shown in Fig 4.11.2 & 4.11.3 respectively and the changes between thisperiod are shown on the image of 2010.
Comparison of the current forest cover with that of previous assessment year shows a negative change of 9.97 Ha.The forest cover change matrix given in Table 4.11.2 reveals that there is a decrease of 9.97 Ha of open forest and 221.93
Ha of scrub.
The negative change (including scrub) of 89.72 Ha is on account clearance of jungle growth for raising of plantations
and 142.18 Ha on account clearance of growth of encroachment. As raising of plantations is a forest management
intervention the same is not considered as loss of forest cover. Thus only the negative change on account of encroachmentsis taken as loss of forest cover. Therefore the net loss of forest cover is 142.18 Ha only.
There are 40 Beats in the Division. Negative changes in forest cover are noticed in 8 Beats. There are no changes inthe remaining 32 Beats.
Details of forest cover changes in these 8 Beats mentioned above are shown in Table 4.11.3.
VDF MDF OF Scrub NF Water
Very Dense Forest 1.93 0.00 0.00 0.00 0.00 0.00 1.93
Moderately Dense Forest 0.00 372.31 0.00 0.00 0.00 0.00 372.31
Open Forest 0.00 0.00 951.35 0.00 0.10 0.00 951.45
Scrub 0.00 0.00 0.00 685.04 2.22 0.00 687.26
Non-Forest 0.00 0.00 0.00 0.00 245.41 0.00 245.41
Water 0.00 0.00 0.00 0.00 0.00 14.50 14.5
Total of 2010 1.93 372.31 951.35 685.04 247.73 14.50 2272.86
Net Change 0.00 0.00 -0.10 -2.22 2.32 0.00
2009Total of
2009
2010
Fig : 4.11.2 Fig : 4.11.3
Forest division wise results
Table 4.11.2: Forest Cover change matrix (Area in Km2)

46
Andhra Pradesh State of Forest - 2012
Table 4.11.3 : List of Beats with negative change in Forest Cover (Area in Ha)
G.V.PALLI RANGE
G.V.Palli 11.26 1710.29 5101.89 707.54 67.83 9.41 7608.22 -4.32 4.32
Total 11.26 1710.29 5101.89 707.54 67.83 9.41 7608.22 -4.32 4.32
MARKAPUR RANGE
Gundamcherla 3.21 1227.8 3233.67 1488.64 143.61 0.00 6096.93 -11.28 0.00
Kaluzuvvalapadu 0.00 6.77 103.14 2324.67 1373.04 11.29 3818.91 -27.51 0.00
Potlapadu 4.85 198.41 723.63 1873.96 4105.13 24.5 6930.48 -116.01 116.01
Total 8.06 1432.98 4060.44 5687.27 5621.78 35.79 16846.32 -154.8 116.01
Y.PALEM RANGE
Akkapalem 0.00 691.01 3029 3171.18 292.29 1.56 7185.04 -1.5 1.5
Komarolu 0.00 430.23 2201.63 2445.2 1781.35 6.02 6864.43 -11.72
Mallapalem 0.00 7.38 679.36 2779.29 1420.01 2.73 4888.77 -53.25 14.04
Pullalacheruvu 0.00 309.48 2839.57 2519.78 81.15 0.00 5749.98 -6.31 6.31
Total 0.00 1438.1 8749.56 10915.5 3574.8 10.31 24688.22 -72.78 21.85
Grand Total 19.32 4581.37 17911.9 17310.3 9264.41 55.51 49142.76 -231.9 142.18
BeatEncroach
mentsVDF MDF OF Scrub NF WB Total
Net
Change
The development of civilization and industry in general has always shown itself so active in the destruction of forests that everythingthat has been done for their conservation and production is completely insignificant in comparison. - Karl Marx

47
4.12.1 Introduction:
Nagarjuna Sagar WLM Forest Division spreads over parts of 2 districts, i.e., Nalgonda and Guntur. It is located
between latitudes 160 09’ 45’’ and 160 55’ 04’’ N and longitudes 780 51’ 04’’ and 780 31’ 12’’ E. Geographical area of the
Division is 2323.46 Km2. The Division has an average altitude of 615 M above MSL. The River Krishna is Main River ofthe Division.
Land use pattern of the Division is given in Table 4.12.1
The climate of this Division is extreme hot and arid. It experiences very hot summers with temperatures soaring up
as high as 400C especially during March and June. The winters are comparatively pleasant and cool. The winter temperaturesfall down to 100C.The Nagarjuna Sagar Wildlife Sanctuary
experiences heavy rainfall caused by the south west
monsoons from the month of June to October.
This Division contains very rich minerals like
Limestone, Quartzite, Granite, Feldspar etc. The soil types
found mainly are black cotton, red and brown sandy loam.
Population of the Division is 0.62 million (2001
Census), per capita forest area is 0.15 Ha and the population
density is 266 persons per Km2.
4.12.2 Recorded Forest Area:
The notified forest area of the Division is 818.57Km2 which is 35.2% of the geographical area. Reserved, Protected and Un-classed forests constitute 818.57 Km2 (99.44%),
0.2 Km2 (0.03%) and 4.12 Km2 (0.53%) of the forest area respectively.
As per Champion and Seth’s classification the forests of the Division fall under Tropical Dry Deciduous andTropical Thorn Forest types.
4.12.3 Protected Area:
Nagarjuna Sagar WL Division is one of the 4 constituent Divisions of Nagarjuna Sagar – Srisailam Tiger Reserve
(NSTR), the biggest Tiger Reserve of India. An area of 440.89Km2 is included in the Tiger Reserve.
4.12.4 Community Forest Management:
There are 79 Vana Samrakshana Samities (VSSs) in the
Division. An area of 176.23 Km2 forests which is 21.19% of thenotified forests is under the management of the VSSs.
4.12.5 Forest Cover:
The forest cover in the Division based on the interpretation
of IRS P6 LISS III 2010 data (Oct 2010) is 632.19 Km2 which is
Land use Area in SqKm Percentage
Forest including Scrub 638.04 27.46
Agriculture 850.64 36.61
Land with Scrub 295.83 12.73
Fallow Lands 168.83 7.27
Grass Lands 21.96 0.95
Settlements 6.50 0.28
Vegetation outside Forest 171.76 7.39
Water Bodies 169.90 7.31
Total 2323.46
Table 4.12.1: Land use Pattern
4.12 NAGARJUNA SAGAR WLM DIVISIONSrisailam Circle
Forest division wise results
Fig : 4.12.1

48
Andhra Pradesh State of Forest - 2012
27.21% of the geographical area. In terms of the forest canopy density classes the Division has 8.49 Km2 of ModeratelyDense Forest and 181.98 Km2 of Open Forest. The area of the Scrub is 441.72 Km2, Non-Forest 133.29 Km2 and Water
Bodies 29.50 Km2.The distribution of the forest cover of the Division is shown in Fig 4.12.1
4.12.6 Change in Forest Cover:
The Satellite images of 2009 and 2010 are shown in Figs 4.12.2 and Fig 4.12.3 respectively.
Comparison of the current forest cover with that of previous assessment year shows no change in forest cover.
The forest cover change matrix is given in Table 4.12.2.
There is no loss of forest cover in this Division during the period.
Fig : 4.12.3
VDF MDF OF Scrub NF WB
Very Dense Forest 0.00 0.00 0.00 0.00 0.00 0.00 0.00
Moderately Dense Forest 0.00 8.49 0.00 0.00 0.00 0.00 8.49
Open Forest 0.00 0.00 181.98 0.00 0.00 0.00 181.98
Scrub 0.00 0.00 0.00 441.72 0.00 0.00 441.72
Non-Forest 0.00 0.00 0.00 0.00 133.29 0.00 133.29
Water 0.00 0.00 0.00 0.00 0.00 29.50 29.50
Total of 2010 0.00 8.49 181.98 441.72 133.29 29.50 794.98
Net Change 0.00 0.00 0.00 0.00 0.00 0.00
2009
Table 4.12.2 : List of Beats with negative change in Forest Cover (Area in Ha)
Total of
2009
2010
Fig : 4.12.2
The creation of a thousand forests is in one acorn. - Ralph Waldo Emerson

49
4.13.1 Introduction:
Giddalur Forest Division lies in the south-eastern part of Prakasham District between latitudes 140 57’ 46’’ and 160
09’ 48’’ N and longitudes 780 44’ 16’’ and 800 28’ 35’’ E. Geographical Area of the Division is 10,408.00 Km2 which is59.04% of the area of the District. The Rivers in this Division are Gundlakamma, Sagileru, Musi, Paleru and Manneru. TheGundlakamma River rises in Nallamala hills and the Cumbum Tank is formed across this river.
Landuse pattern of the Division is given in Table 4.13.1.
The climate of this Division is dry and salubrious; the temperatures ranging from 190C to 400C and the annualrainfall is about 871 mm received mainly from Southwest monsoons.
The rocks in the Division are Sandstone mixed withquartzite and occasional shales are the characteristic rockformations on the Veligonda and at their extremesbordering Kanigiri the rocks gradually change intoGneisses or Granite composition. Outcrops of Barytes andManganese ores also occur in Veligonda. The soil typesfound mainly are red loamy, Black cotton, sandy loam andsandy soils.
Population of the Division is 2.53 million (2011
Census); Per capita forest area 0.09 Ha and the population
density 209 persons per Km2.
4.13.2 Recorded Forest Area:
The notified forest area of the Division is 1948.60
Km2 which is 18.72% of the geographical area. Reserved, Protected and Un-classed Forests constitute 1908.69 Km2
(97.95%) and 39.91 Km2 (2.09%) of the forest area respectively.
As per Champion and Seth’s classification the forests of Division fall under Southern Tropical Dry Deciduous and
Southern Tropical Thorn Forests.
4.13.3 Protected Area:
A part of one Protected Area, the Gundla Brahmeswaram (GBM) Wildlife Sanctuary falls in the Division. An area of
444.76 Km2 of the Division is included in this WLS.
4.13.4 Community Forest Management:
There are 110 Vanasamrakshana Samities (VSSs) in the Division. An area of 287.08 Km2 forests, which is 19.16 % of
the notified forests, is under the management of VSSs.
4.13.5 Forest Cover:
The forest cover in the Division based on the interpretation of IRS P6 LISS III 2010 data (Oct 2010) is 1497.74 Km2
which is 14.39 % of the Geographical area. In terms of the forest canopy cover density classes the Division has 22.10 Km2
of Very Dense Forests, 746.57 Km2 of Moderately Dense Forests and 729.07 Km2 of Open Forests. The area of the Scrub
is 444.58 Km2, Non-Forests 260.57 Km2 and Water Bodies 5.31 Km2. The distribution of the forest cover of the Division
is shown in Fig 4.13.1.
4.13 GIDDALUR DIVISION
Land use Area in SqKm Percentage
Forest including Scrub 1944.51 18.68
Agriculture 7164.53 68.84
Land with Scrub 618.70 5.94
Fallow Lands 100.77 0.97
Grasslands 22.17 0.21
Settlements 103.26 0.99
Vegetation outside Forest 192.62 1.85
Water Bodies 261.44 2.51
Total 10408.00
Table 4.13.1: Land use Pattern
Guntur CircleForest division wise results

50
Andhra Pradesh State of Forest - 2012
Table 4.13.2: Forest Cover change matrix
VDF MDF OF Scrub NF WB
Very Dense Forest 22.10 0.00 0.00 0.00 0.00 0.00 22.10
Moderately Dense Forest 0.00 746.57 0.00 0.00 0.00 0.00 746.57
Open Forest 0.00 0.00 729.07 0.00 0.00 0.00 729.07
Scrub 0.00 0.00 0.00 444.58 0.52 0.00 445.10
Non-Forest 0.00 0.00 0.00 0.00 260.05 0.00 260.05
Water 0.00 0.00 0.00 0.00 0.00 5.31 5.31
Total of 2010 22.10 746.57 729.07 444.58 260.57 5.31 2208.20
Net Change 0.00 0.00 0.00 -0.52 0.52 0.00
2009Total of
2009
2010
4.13.6 Change in Forest Cover:
The satellite images of 2009 and 2010 are shown in Figs
4.13.2 & 4.13.3 respectively and in Forest cover changes
during this period are shown on the image of 2010.
Comparison of the current forest cover with that ofprevious assessment year does not show any change in the
canopy cover. The forest cover change matrix is given in
Table 4.13.2. It reveals that there is a decrease of 52.46 Ha inscrub.
A negative change of 34.72 Ha is on account of clearing
of jungle growth for raising of plantations and 17.74 Ha is on account of encroachments. Raising of plantations is a forestmanagement intervention and hence not considered as loss of forest cover. Thus negative change on account of
encroachments is taken as loss of forest cover. Therefore the net loss of forest cover is 17.74 Ha only.
(Area in Km2)
Fig 4.13.2 Fig 4.13.3
There area 62 Beats in the Division. Negative changes are noticed in 4 Beats only. There are no changes in the forestcover in the remaining 58 Beats.
Details of forest cover changes in the 4 Beats mentioned above is shown in Table 4.13.3.
Fig 4.13.1

51
Table 4.13.3: List of Beats with negative change in Forest Cover (Area in Ha)
GIDDALUR RANGE
Chinaobenenipalli 0.00 209.66 1867.77 1643.49 298.72 0.00 4019.64 -5.89 5.89
Total 0.00 209.7 1867.77 1643.49 298.72 0.00 4019.64 -5.89 5.89
KANIGIRI RANGE
Gudipatipalli 20.96 1469.2 3143.67 2026.89 254.69 0.00 6915.38 -24.06 0.00
Kodigampalli 0.00 3.92 30.24 715.12 2819.12 110.74 3679.14 -5.02 5.02
Peddirlapadu 0.00 0.81 580.79 1942.32 862.95 0.00 3386.87 -17.49 6.83
Total 20.96 1474 3754.7 4684.33 3936.76 110.74 13981.4 -46.57 11.85
Grand Total 20.96 1684 5622.47 6327.82 4235.48 110.74 18001 -52.46 17.74
BeatEncroach
mentsVDF MDF OF Scrub NF WB Total
Net
Change
51
Forest division wise results

52
Andhra Pradesh State of Forest - 2012
4.14.1 Introduction:
Guntur Forest Division comprises of the entire District and lies in the south-eastern part of Prakasham District
between latitudes 150 42’ 13.68’’ and 160 49’ 23.52’’ N and longitudes 790 12’ 34.56’’ and 800 54’ 16.92’’ E. Geographical area
of the Division (and District) is 11,391.00 Km2. The Division has four physiographic zones- the sea board, the plains,
ghats and hills rising gently to an altitude of 500 M and the ‘U” shaped Nallamalai hills skirting Macherla to its west and
Markapur and Kurnool Divisions to the east. The other hill ranges of the Division are Venkatayyapalem and Kondaveedu
of Sattenapalli and Narasaraopet. The important rivers draining the Division are the Krishna and Gundlakamma with
tributaries Chandravanka, Goli and Naguleru in Macherla.
Landuse pattern of the Division is given in Table 4.14.1
The climate of this Division is dry and salubrious;
temperature ranging from 170C to 400C and the annual
rainfall is about 989 mm received both from the South-
West and North-East monsoons.
The Common rocks are Shales, Slates, Lime-stone,
Quartzite, Gneisses and Schist. Soils of all kinds occur in
the Division, Swampy in the Krishna estuary, Sandy along
the coast, Alluvial on the banks of Krishna, Red Gravelly
in the interior and Loamy of rather rare occurrence.
Population of Guntur Division is 4.88 million (2011
Census); the per capita forest area is 0.04 Ha and the
population density is 429 persons per Km2. The livestock
population is 2.3 million.
4.14.2 Recorded Forest Area:
The notified forest area of the Division is 1411.10 Km2, which is 13.28 % of the geographical area. The entire forest
area is Reserved Forest.
As per Champion and Seth’s classification, the major Forest types of Division are Coastal Forests and Inland
Forests. In Coastal Forests Mangroves Forests and Dry evergreen Forests are present. Whereas Inland Forests contain
Southern Dry Mixed Deciduous, Hardwickia binata and Acacia arabica forests.
4.14.3 Protected Area:
The Division contains a part of the Krishna Wildlife Sanctuary (KWS). An area of 81.99 Km2 of the Division is
included in the Krishna Wildlife Sanctuary (KWS).
4.14.4 Community Forest Management:
There are 180 Vana Samrakshana Samities (VSSs) in the Division. An area of 260.80 Km2 forests, which constitutes
16.10 % of the notified forests, is under the management of the VSSs.
4.14 GUNTUR DIVISION
Land use Area in SqKm Percentage
Forest including Scrub 1112.92 10.48
Agriculture 8446.28 79.51
Land with Scrub 80.08 0.75
Fallow Lands 314.65 2.96
Grasslands 0.71 0.01
Settlements 287.41 2.71
Vegetation outside Forest 107.88 1.02
Water Bodies 273.26 2.57
Total 10623.19
Table 4.14.1: Land use Pattern
Guntur Circle

53
4.14.5 Forest Cover:
The forest cover in the Division based on theinterpretation of IRS P6 LISS III 2010 data (Dec 10–Jan 11) is
315.27 Km2 which is 21.34% of the Geographical area. In
terms of the forest canopy cover density classes the Divisionhas 0.08 Km2 of Moderately Dense Forests and 315.19 Km2
of Open Forests. The area of the Scrub is 887.62 Km2, Non-
Forest 235.76 Km2 and Water Bodies 38.26 Km2. Thedistribution of the forest cover of the Division is shown in
Fig 4.14.1.
4.14.6 Change in Forest Cover:
The satellite images of 2009 and 2010 are shown in Figs 4.14.2 & 4.14.3 respectively. The changes between thisperiod are shown on the image of 2010.
Comparison of the current forest cover with that of previous assessment year shows a positive change of 12.69 Haand negative change of 195.46 Ha. The forest cover change matrix given in Table 4.14.2 reveals that there is a decreaseof 10.99 Ha of open forest.
The positive change in forest cover (including scrub) of 12.69 Ha is on account of raising of plantations. The
negative change of 160.17 Ha is on account of clearance of jungle growth for raising of plantations and 35.29 Ha on
account of encroachments. As raising of plantations is a forest management intervention and hence not considered asloss of forest cover. Thus only the negative change due to encroachments is taken as loss of forest cover. Therefore the
net loss of forest cover is 35.29 Ha only.
There are 57 Beats in the Division. Negative changes in forest cover are noticed in 14 Beats and positive change inonly 1 Beat. There are no changes in the remaining 42 Beats.
Details of forest cover changes in the 15 Beats mentioned above, are shown in Table 4.14.3.
Fig 4.14.1
Fig 4.14.3Fig 4.14.2
Forest division wise results

54
Andhra Pradesh State of Forest - 2012
VDF MDF OF Scrub NF WB
Very Dense Forest 0.00 0.00 0.00 0.00 0.00 0.00 0.00
Moderately Dense Forest 0.00 0.08 0.00 0.00 0.00 0.00 0.08
Open Forest 0.00 0.00 315.19 0.00 0.11 0.00 315.30
Scrub 0.00 0.00 0.00 887.49 1.84 0.00 889.33
Non-Forest 0.00 0.00 0.00 0.13 233.81 0.00 233.94
Water 0.00 0.00 0.00 0.00 0.00 38.26 38.26
Total of 2010 0.00 0.08 315.19 887.62 235.76 38.26 1476.91
Net Change 0.00 0.00 -0.11 -1.71 1.82 0.00
2009
Table 4.14.2: Forest Cover change matrix (Area in Km2)
Total of
2009
2010
Table 4.14.3: List of Beats with change in Forest Cover (Area in Ha)
GUNTUR RANGE
Bodanam 0.00 0.00 117.00 1114.24 489.5 0.00 1720.74 -4.42 4.42
Guthikonda 0.00 0.00 1586.14 2360.82 75.05 1.80 4023.81 -34.10 10.91
Nekarikal 0.00 0.00 560.17 1820.70 313.82 1.95 2696.64 -2.52 2.52
Tripurapuram 0.00 0.00 1154.13 2790.65 69.30 1.48 4015.56 -10.99 10.99
Total 0.00 0.00 3417.44 8086.41 947.67 5.23 12456.8 -52.03 28.84
MACHERLA RANGE
Adigoppula 0.00 0.00 1405.90 1673.29 110.95 0.00 3190.14 12.69 0.00
Madugula 0.00 0.00 0.00 211.96 451.86 3.09 666.91 -12.28 0.00
Veldurthi 0.00 0.00 30.57 615.86 2533.55 12.30 3192.28 -19.86 0.00
Total 0.00 0.00 1436.47 2501.11 3096.36 15.39 7049.33 -19.45 0.00
VINUKONDA RANGE
Domalagudem 0.00 0.00 293.58 2619.25 113.47 0.00 3026.3 -13.44 0.00
Epuru East 0.00 0.00 3.90 1293.8 560.56 0.00 1858.26 -9.06 0.00
Kandrika 0.00 0.00 618.23 3402.69 160.16 0.00 4181.08 -7.88 0.00
Karempudi 0.00 0.00 815.55 1948.89 193.43 0.00 2957.87 -6.45 6.45
Naidupalem 0.00 0.00 177.82 2652.68 318.93 1.50 3150.93 -11.11 0.00
Ravulapuram 0.00 0.00 449.49 2375.19 50.78 0.00 2875.46 -3.68 0.00
Ravvaram 0.00 3.57 17.48 1554.04 135.75 1.80 1712.64 -38.65 0.00
Vaddemgunta 0.00 0.00 0.39 2027.43 726.91 0.00 2754.73 -21.02 0.00
Total 0.00 3.57 2376.44 17874 2259.99 3.3 22517.3 -111.29 6.45
Grand Total 0.00 3.57 7230.35 28461.5 6304.02 23.92 42023.4 -182.77 35.29
BeatEncroach
mentsVDF MDF OF Scrub NF WB Total
Net
Change
Forests, lakes and rivers, clouds and winds, stars and flowers, stupendous glaciers and crystal snowflakes - every form of animateor inanimate existence, leaves its impress upon the soul of man. - Orison Swett Marden

55
4.15.1 Introduction:
Nellore Forest Division comprises of the entire District of Nellore and lies in the south-eastern part of Andhra
Pradesh between latitudes 130 48’ 49.58’’ and 150 4’ 58.59’’ N and longitudes 790 6’ 4.36’’ and 800 14’ 46.71’’ E. Geographical
area of the Division is 13,076 Km2.
Land use pattern of the Division is given in Table 4.15.1.
The Division is bordered by the Bay of Bengal on the east, state of Tamil Nadu on the south, the district of Kadapa
on the west and the district of Prakasham on the north.
The eastern side consists of area of low lying landextending from the base of the Eastern Ghats to the sea.
The western side of the district is separated from Kadapa
district by Veligonda hills. The district is split by theRiver Pennar and is located on both south and north
banks of it. This Division has 4 physiographic zones -
the sea board, the plains, foothills and Ghats reaching upto 800 M above MSL. The principal rivers in the district
are Pennar in the centre, Kandaleru, Swarnamukhi and
Kalinga in the south and Uppuvagu in the north.
The climate of this Division is hot and exhausting
for most part of the year. Temperature ranges from 150 to410 C. Annual rainfall ranges from 700-1040 mm received
from south-west and north-east monsoons.
The Division is under laid by two types of the oldest rocks, Schistose and Quartzite’s of the Dharwar System. ThePeninsular gneisses, Closepet granite and Pegmatite are also found intruding into the Schistose series, the north-west
portion of the Dharwarian belt of Nellore devoid of Pegmatite intrusions but the south eastern portion, Gudur, Rapur
areas is traversed by many intrusions and they contain deposits of Muscovite mica. The soil types found mainly areSandy, Red, Lateritic, Murram, Clayey and Alluvial soils.
Population of the Division is 2.96 million (2011 Census), per capita forest area is 0.08 Ha and the population densityis 226 persons per Km2. The livestock population is 2.5 million.
4.15.2 Recorded Forest Area:
The notified forest area of the Division is 2519.37 Km2 which is 19.26% of the geographical area. Reserved,Protected and un-classed forests constitute 2,500.01 Km2 (99.23%), 14.46 Km2 (0.57%) and 4.90 Km2 (0.19%) of the forestarea respectively.
As per Champion and Seth’s classification this Division has 5 major forest types - Dry Red Sanders bearing forest,Southern Tropical Dry Mixed Deciduous forests, Hardwickia binata forest, Southern Tropical Thorn Forest and SouthernTopical Dry evergreen forest.
4.15.3 Protected Area:
The Nellore Division is en-compassing 3 Wild Life Sanctuaries namely the Penchala Narasimha Swami (PNS) WLSwith an area of 1030 Km2, Pulicat Bird Sanctuary (PBS)- a RAMSAR wetland, with an area of 500 Km2 and Nelapattu BirdSanctuary (NBS) with an extent of 4.58 Km2.
4.15 NELLORE DIVISION
Land use Area in SqKm Percentage
Forest including Scrub 1879.83 14.53
Agriculture 6610.72 51.11
Land with Scrub 2126.77 16.44
Fallow Lands 621.88 4.81
Grasslands 21.02 0.16
Settlements 84.33 0.65
Vegetation outside Forest 141.98 1.10
Water Bodies 1448.19 11.20
Total 12934.72
Table 4.15.1: Land use Pattern
Guntur CircleForest division wise results

56
Andhra Pradesh State of Forest - 2012
There are 85 Beats in the Division. Negative changes in forest cover are noticed in 21 Beats. There are no changesin the remaining 64 Beats.
Details of forest cover changes in the 21 Beats mentioned above are shown in Table 4.15.3.
4.15.4 Community Forest Management:
There are 292 Vana Samrakshana Samities (VSSs) in the Division. An area of 645.93 Km2 of forests which is 25.63 %of the notified forests, is under the management of the VSSs.
4.15.5 Forest Cover:
The forest cover in the Division based on the
interpretation of IRS P6 LISS III 2010 data (Sep 2010 – Jan2011) is 1146.01 Km2 which is 8.85% of the geographical
area. In terms of the forest cover canopy density classes
the Division has 191.55 Km2 of Moderately Dense Forestsand 954.46 Km2 of Open Forests. The area of the Scrub is
723.16 Km2, Non-Forest 480.84 Km2 and Water Bodies 29.95
Km2. The distribution of the forest cover of the Division isshown in Fig 4.15.1
4.15.6 Change in Forest Cover:
The Satellite images of 2009 and 2010 are shown in Figs 4.15.2 & 4.15.3 respectively and the changes between this
period, on the image of 2010.
Comparison of the current forest cover with that of previous assessment year shows a negative change of 130.68Ha. The forest cover change matrix given in Table 4.15.2 reveals that there is a decrease of 130.68 Ha of Open forest and
252.62 Ha of scrub.
Further analysis shows that the negative change (including scrub loss) of 370.98 Ha is on account of raising of
plantations and 3.83 Ha is on account of encroachments and 8.49 Ha is on account of forest fires. As raising of plantations
is a forest management intervention the same is not considered as loss of forest cover. Thus, the negative change due toencroachment alone is taken as loss of forest cover. Therefore the net loss of forest cover is 3.83 Ha only.
Fig 4.15.2 Fig 4.15.3
Fig 4.15.1

57
VDF MDF OF Scrub NF WB
Very Dense Forest 0.00 0.00 0.00 0.00 0.00 0.00 0.00
Moderately Dense Forest 0.00 191.55 0.00 0.00 0.00 0.00 191.55
Open Forest 0.00 0.00 954.46 0.00 1.31 0.00 955.77
Scrub 0.00 0.00 0.00 723.16 2.53 0.00 725.69
Non-Forest 0.00 0.00 0.00 0.00 477.00 0.00 477.00
Water 0.00 0.00 0.00 0.00 0.00 29.95 29.95
Total of 2010 0.00 191.55 954.46 723.16 480.84 29.95 2379.96
Net Change 0.00 0.00 -1.31 -2.53 3.84 0.00
2009
Table 4.15.2: Forest Cover change matrix (Area in Km2)
Total of
2009
2010
Table 4.15.5: List of Beats with negative change in Forest Cover (Area in Ha)
ATMAKUR RANGE
Brahmanapalli 0.00 434.67 1167.48 451.32 139.8 9.5 2202.77 -21.18 0.00
Gudigunta 0.00 971.6 3432.03 1367.4 52.82 33.57 5857.42 -15.12 0.00
Kampasamudram 0.00 0.00 17.78 519.95 226.51 6.89 771.13 -5.9 0.00
Ponguru 0.00 0.34 783.29 2959.65 423.06 13.11 4179.45 -32.88 0.00
Rajavolu 0.00 0.58 102.9 1239.22 554.04 1.29 1898.03 -3.87 0.00
T. Talupur 0.00 104.34 2087.69 1188.51 109.39 7.97 3497.9 -4.18 0.00
Total 0.00 1511.53 7591.2 7726.05 1505.62 72.33 18406.7 -83.13 0.00
KAVALI RANGE
Kavali 0.00 10.46 141.02 324.88 2143.18 6.66 2626.2 -90.91 0.00
Total 0.00 10.46 141.02 324.88 2143.18 6.66 2626.2 -90.91 0.00
RAPUR RANGE
Chipini 0.00 412.21 1636.38 764.01 179.6 9.99 3002.19 -37.49 0.00
Pulikollu 0.00 0.00 65.05 590.24 134.78 569.16 1359.23 -18.29 0.00
Rajupalem-Rapur 0.00 133.07 1834.77 1323.87 219.16 25.79 3536.66 -7.5 0.00
Thumaya 0.00 1.4 414.91 1103.63 261.39 831.53 2612.86 -31.53 0.00
Vavintaparthi 0.00 1.79 510.15 1150.42 552.43 143.4 2358.19 -2.55 0.00
Total 0.00 548.47 4461.3 4932.17 1347.36 1579.9 12869.13 -97.36 0.00
UDAYAGIRI RANGE
Arlapadia 0.00 712.37 3885.39 3345.17 274.37 0.00 8217.3 -9.6 0.00
Duttalur 0.00 5.42 776.02 2666.91 440.61 0.00 3888.96 -3.01 0.00
Varikuntapadu 0.00 2.44 528.21 2042.45 753.75 0.00 3326.85 -9.53 0.00
Total 0.00 720.23 5189.6 8054.53 1468.73 0.00 15433.11 -22.14 0.00
VENKATAGIRI RANGE
Alturpad 0.00 1096.99 3804.6 1018.1 636.37 1.28 6557.34 -8.49 0.00
Attiwaram 0.00 80.87 184.56 545.23 1373.05 3.6 2187.31 -12.03 0.00
Chaganam 0.00 22.64 1976.52 2463.98 135.97 16.19 4615.3 -3.83 3.83
Gilakapadu 0.00 75.41 1344.86 978.95 308.26 1.8 2709.28 -10.84 0.00
Jayampu 0.00 138.8 522.99 831.35 1120.95 82.81 2696.9 -2.33 0.00
Uggumudi 0.00 32.19 571.64 825.28 1505.92 1.45 2936.48 -52.24 0.00
Total 0.00 1446.9 8405.2 6662.89 5080.52 107.13 21702.61 -89.76 3.83
Grand Total 0.00 4227.13 25647 27375.6 9402.23 1759.3 68411.55 -383.3 3.83
BeatEncroach
mentsVDF MDF OF Scrub NF WB Total
Net
Change
Forest division wise results

58
Andhra Pradesh State of Forest - 2012
4.16.1 Introduction:
Hyderabad Forest Division consists of Hyderabad & Rangareddy Districts. Hyderabad Forest Division lies between
latitudes 160 50’ 39" to 170 42’ 28" in the North & Longitudes 770 21’ 49" to 780 49’ 49" in the East. The Geographical Area of
the Division is 7,710 Km2. The average altitude is 536 M above MSL. Twin cities of Hyderabad and Secunderabad fall in this
Division which is the capital of the state. The highest point in the city is Banjara Hills, which is 665 M above MSL. The
contour level falls gradually from west to east creating almost a trough near the Musi River which runs through the city.
Landuse pattern of the Division is given in Table 4.16.1
The climate of this Division is generally dry with temperatures ranging from 140C to 450C and the normal rain fall of
the District is 786.8 mm, received mainly from Southwest monsoons.
Granites are found in the Division. The soil types
mainly are Black cotton, Red and Brown sandy loam.
The population of the Division is 9.30 millions (2011
Census). The per capita forest area is 0.01 Ha and the
population density is 1207 persons per Km2.The livestock
population is 1.6 million.
4.16.2 Recorded Forest Area:
The notified forest area of the Division is 730.75Km2 which is 9.48% of the geographical area. Reserved,
Protected and Un-classed Forests Constitute 379.96 Km2
(52%), 244.70 Km2 (33.49%) and 106.09 Km2 (14.52%) of
the forest area respectively.
As per Champion and Seth’s classification the
forests of Division fall under Tropical Dry Deciduous and Tropical Thorn Forest types.
4.16.3 Protected Area:
There are 3 Protected Areas in the Division. These are Chilkur National Park (4.87 Km2), KBR National Park (1.70
Km2) and of Mahaveer Harina Vanasthali Deer Park (14.12 Km2).
4.16.4 Community Forest Management:
There are 123 Vana Samrakshana Samities (VSSs) in the Division. An area of 353.49 Km2 forests, which is 48.37 % of
the notified forests, is under the management of the VSSs.
4.16.5 Forest Cover:
The forest cover in the Division based on the interpretation of IRS
P6 LISS III 2010 data (Dec 2010) is 334.89 Km2 which is 4.343% of the
Geographical area. In terms of the forest canopy density classes the
Division has 121.95 Km2 of Moderately Dense Forest and 212.94 Km2 of
Open Forest. The area of the Scrub is 385.44 Km2, Non-Forest 35.79 Km2
and Water Bodies 2.75 Km2. The distribution of the forest cover of the
Division is shown in Fig 4.16.1
4.16 HYDERABAD DIVISION
Land use Area in SqKm Percentage
Forest including Scrub 730.75 9.48
Agriculture 5916.47 76.77
Land with Scrub 435.56 5.64
Fallow Lands 14.15 0.18
Grasslands 0.79 0.01
Settlements 424.91 5.50
Not available for cultivation 27.36 0.35
Water Bodies 160.01 2.07
Total 7710.00
Table 4.16.1: Landuse Pattern
Fig 4.16.1
Hyderabad Circle

59
4.16.6 Change in Forest Cover:
The Satellite images of 2009 and 2010 are shown in Figs 4.16.2 & 4.16.3 respectively and the changes between thisperiod are shown on the image of 2010.
Comparison of the current forest cover with that of previous assessment year shows a negative change of 184.30Ha. The forest cover change matrix given in Table 4.16.2 reveals that there is a decrease of 11.26 Ha of moderately dense
forest, 173.05 Ha of open forest and 175.53 Ha of scrub.
Of the total negative change (including scrub) of 359.84 Ha; 100.02 Ha is on account of clearing of jungle growth for
raising of plantations, 76.95 Ha on account of harvesting of mature plantations, 150.68 Ha on account of diversion of
forest lands for non-forestry purposes and 32.19 Ha on account of encroachments. As clearance of jungle growth forraising of plantations, harvesting of plantation and diversion forest lands are forest management interventions the same
are not considered as loss of forest cover. Thus only the negative change due to encroachment is taken as loss of forest
cover. Therefore the net loss of forest cover is 32.19 Ha only.
There are 62 Beats in the Division. Negative changes in forest cover are noticed in only 8 Beats. There are no
changes in the remaining 54 Beats.
Details of forest cover changes in these 8 Beats are shown in Table 4.16.3
VDF MDF OF Scrub NF WB
Very Dense Forest 0.00 0.00 0.00 0.00 0.00 0.00 0.00
Moderately Dense Forest 0.00 121.95 0.00 0.00 0.11 0.00 122.06
Open Forest 0.00 0.00 212.94 0.00 1.73 0.00 214.67
Scrub 0.00 0.00 0.00 385.44 1.76 0.00 387.20
Non-Forest 0.00 0.00 0.00 0.00 32.19 0.00 32.19
Water 0.00 0.00 0.00 0.00 0.00 2.75 2.75
Total of 2010 0.00 121.95 212.94 385.44 35.79 2.75 758.87
Net Change 0.00 -0.11 -1.73 -1.76 3.60 0.00
2009
Table 4.16.2: Forest Cover change matrix (Area in Km2)
Total of
2009
2010
Fig 4.16.3Fig 4.16.2
Forest division wise results

60
Andhra Pradesh State of Forest - 2012
Satellite Images
2009 2010
Table 4.16.3: List of Beats with negative change in Forest Cover (Area in Ha)
HYDERABAD-NORTH RANGE
Amberpet 0.00 10.32 72.44 1,770.68 337.68 0.00 -10.07 0.00
Mudmiyal 0.00 9.71 89.05 1,192.90 140.41 0.00 -40.82 0.00
Pochampally 0.00 22.26 233.46 604.76 183.25 0.00 -76.34 0.00
Shamirpet 0.00 5.21 144.8 587.19 114.05 0.00 -77.30 0.00
Suraram 0.00 0.00 9.28 439.46 164.35 0.00 -21.96 17.97
Turkapally 0.00 320.28 406.81 849.06 308.7 0.00 -94.44 0.00
Total 0.00 367.78 955.84 5444.05 1248.44 0.00 -320.93 17.97
HYDERABAD-SOUTH RANGE
Ibrahimpatnam 0.00 0.67 10.2 870.86 124.16 0.00 -24.70 0.00
Kongrakalan 0.00 31.08 173.61 1,333.64 68.18 0.00 -14.22 14.22
Total 0.00 31.75 183.81 2204.5 192.34 0.00 -38.92 14.22
Grand Total 0.00 399.53 1139.65 7648.55 1440.78 0.00 -359.84 32.19
BeatEncroach
mentsVDF MDF OF Scrub NF WB
Net
Change
Nature is a temple in which living columns sometimes emit confused words. Man approaches it through forests of symbols, whichobserve him with familiar glances. - Charles Baudelaire
Longitude 78.421340 E 78.428110 ELatitude 17.556330 N 17.554630 N
Area in Ha 13.14 4.83Change OF to NF Scrub to NFCompt No 206 206Beat Suraram Suraram
Range Hyd North Hyd NorthDivision Hyderbad Hyderbad

61
4.17.1 Introduction:
Mahabubnagar Forest Division lies in the western part of Mahabubnagar District between latitudes 150 50’ 12’’ and
170 14’ 13’’ N and longitudes 770 14’ 55’’ and 780 48’ 07’’ E. Geographical area of the Division is 13,802.75 Km2 which is 74.88
% of the area of the District. The Division has an average altitude of 498 M above MSL. The district can be physiographicallydivided into more or less 2 distinct regions; the plains with low lying scattered hills and the extensive Amarabad-
Farhabad plateau- a continuous range of hills of an average elevation of about 800 M above MSL extending more or less
east-west along the Krishna river on the southern boundary of the district. The hill range is interspersed by several deepvalleys which are almost inaccessible from the plains. Two important rivers, viz. Krishna and Tungabhadra flow through
the district.
Land use pattern of the Division is given in Table 4.17.1
The climate of this Division is generally dry withtemperatures ranging from 16.90 C to 450C and the annual
rainfall is about 754 mm received mainly from south-west
monsoons. The soils found in the Division are red sandy,black cotton and loamy.
Population of the Division is 3.54 million (2011 Census)which constitutes about 77.75 % of the population of the
district, per capita forest area is 0.02 Ha and the population
density is 257 persons per Km2. The livestock populationis 4.82 million.
4.17.2 Recorded Forest Area:
The notified forest area of the Division is 573.18 Km2 which 4.15% of the geographical area. Reserved, Protectedand Un-classed forests constitute 442.44 Km2 (77.19%), 118.77 Km2 (20.72%) and 11.97 Km2 (2.09%) of the forest area
respectively.
As per Champion and Seth’s classification the Forests of Division fall under Tropical Dry Deciduous, Tropical
Moist deciduous, Tropical Semi-evergreen and Tropical Thorn Forest types.
4.17.3 Protected Area:
There is no Protected Area in the Division.
4.17.4 Community Forest Management:
There are 207 Vana Samrakshana Samities (VSSs) in the Division.An area of 455.62 Km2 forests which is 79.49 % of the notified forests,
is under the management of the VSSs.
4.17.5 Forest Cover:
The forest cover in the Division based on the interpretation of
IRS P6 LISS III 2010 (Data of Dec 2010 to Jan 2011) is 307.46 Km2
which is 2.23% of the geographical area. In terms of the forest canopydensity classes the Division 16.20 Km2 of Moderately Dense Forest
and 291.26 Km2 Open Forest. The area of the Scrub is 308.98 Km2,
4.17 MAHABUBNAGAR DIVISION
Land use Area in SqKm Percentage
Forest including Scrub 616.85 4.47
Agriculture 11560.48 83.76
Land with Scrub 436.22 3.36
Fallow Lands 412.62 2.99
Settlements 36.58 0.26
Not available for cultivation 250.11 3.35
Water Bodies 462.38 1.81
Total 13802.75
Table 4.17.1: Land use Pattern
Hyderabad CircleForest division wise results
Fig. 4.17.1

62
Andhra Pradesh State of Forest - 2012
Non-Forest 2.88 Km2 and Water Bodies 0.16 Km2. The distribution of the forest cover of the Division is shown in Fig4.17.1
4.17.6 Change in Forest Cover:
The satellite images of 2009 and 2010 are shown in Figs 4.17.2 & 4.17.3 respectively and the changes during this
period on the image of 2010.
Comparison of the current forest cover with that of previous assessment year shows no change. The forest cover
change matrix given in Table 4.17.2 reveals that there is a decrease of 18.69 Ha of scrub.
Out of the total negative change (including scrub) of 18.69 Ha, loss of 12.37 Ha is on account of clearance of jungle
growth for raising of plantations and 6.32 Ha is on account of encroachments. As clearance of jungle growth for raisingof plantation is a management intervention the same is not considered as loss of forest cover. Thus only the negative
change due to encroachment is taken as loss of forest cover. Therefore the net loss of forest cover is 6.32 Ha only.
There are 51 Beats in the Division. Negative changes in forest cover are seen in 2 Beats and there are no changes in
remaining 49 Beats.
Details of forest cover changes in these 2 Beats are shown in Table 4.17.3
VDF MDF OF Scrub NF WB
Very Dense Forest 0.00 0.00 0.00 0.00 0.00 0.00 0.00
Moderately Dense Forest 0.00 16.20 0.00 0.00 0.00 0.00 16.20
Open Forest 0.00 0.00 291.26 0.00 0.00 0.00 291.26
Scrub 0.00 0.00 0.00 308.98 0.19 0.00 309.17
Non-Forest 0.00 0.00 0.00 0.00 2.69 0.00 2.69
Water 0.00 0.00 0.00 0.00 0.00 0.16 0.16
Total of 2010 0.00 16.20 291.26 308.98 2.88 0.16 619.48
Net Change 0.00 0.00 0.00 -0.19 0.19 0.00
2009
Table 4.17.2: Forest Cover change matrix
Total of
2009
2010
(Area in Km2)
Fig. 4.17.3Fig. 4.17.2

63
Satellite Images2009 2010
Table 4.17.3 : List of Beats with negative change in Forest Cover (Area in Ha)
KODANGAL RANGE
Kothur 0.00 87.06 1289.29 498.25 8.64 1883.24 -6.32 6.32
MAHABUBNAGR RANGE
Appannapally 0.00 239.2 1130.01 58.85 12.37 1440.43 -12.37 0.00
Grand Total 0.00 326.26 2419.3 557.1 21.01 3323.67 -18.69 6.32
BeatEncroach
mentsVDF MDF OF Scrub NF WB
Net
Change
Longitude 77.982140 E
Latitude 16.804110 N
Area in Ha 12.37
Change Scrub to NF
Compt No 7295
Beat Kothur
Range Kodangal
Division Mahabubnagar
Forest division wise results

64
Andhra Pradesh State of Forest - 2012
4.18.1 Introduction:
Nalgonda Forest Division and District lies in the southern part of Telangana region of the State between latitudes
160 21’ 19’’ and 170 48’ 42’’ N and longitudes 780 36’ 43’’ and 800 04’ 27’’ E. Geographical area of the Division is 12553.70
Km2. The Division has an average altitude of 421 M above MSL. Major streams falling in Division are Musi, Dindi, Peggavadu, Kangal, Alair, and Halia, which are tributaries of Krishna river.
Landuse pattern of the Division is given in Table 4.18.1
The climate of this Division is generally dry with temperatures ranging from 170C to 400C and the annual rainfall is
about 772 mm, received mainly from south-west monsoons.
Much of the soil is of red yellow type. Many areas have deep red soil derived from the decomposition of the graniticbase rock. Riverine tracts have alluvial soil where paddy is grown. Due to the semi-arid climate, poor soils and lack of
adequate irrigation, dry land farming is widely prevalent.
Horticulture is also practiced; there are a number ofCitrus and Mango plantations.
Population of the Division is 3.48 million (2011
Census), per capita forest area is 0.03 Ha and thepopulation density is 244 persons per Km2.
4.18.2 Recorded Forest Area:
The notified forest area of the Division is 450.29Km2 which is 3.6% of the geographical area.
As per Champion and Seth’s classification the
forests of Division fall under Tropical Dry DeciduousForest type.
4.18.3 Protected Area:
There is no Protected Area in the Division.
4.18.4 Community Forest Management:
There are 95 Vana Samrakshana Samities (VSSs) in the Division. An area of 188.41 Km2 forests, which is 21.19% ofthe notified forests , is under the management of the VSSs.
4.18.5 Forest Cover:
The forest cover in the Division based on the interpretation
of IRS P6 LISS III 2010 data (Oct / Dec 2010) is 39.92 Km2 which is0.317% of the geographical area. In terms of the forest canopy
density classes the Division has 1.57 Km2 of Moderately Dense
Forest and 38.35 Km2 of Open Forest. The area of the Scrub is241.36 Km2, Non- Forest 158.36 Km2 and Water Bodies 2.36 Km2.The
distribution of the forest cover of the Division is shown in Fig
4.18.1.
Land use Area in SqKm Percentage
Forest including Scrub 281.41 2.24
Agriculture 10714.96 85.35
Land with Scrub 837.29 6.67
Fallow Lands 171.14 1.36
Settlements 104.70 0.83
Not available for cultivation 30.79 0.25
Water Bodies 413.41 3.29
Total 12553.70
Table 4.18.1: Land use Pattern
4.18 NALGONDA DIVISION
Fig 4.18.1
Hyderabad Circle

65
4.18.6 Change in Forest Cover:
The Satellite images of 2009 and 2010 are shown in Figs 4.18.2 & 4.18.3 respectively and the changes during thisperiod are shown on the image of 2010.
Comparison of the current forest cover with that of previous assessment year does not show any change during the
period. The forest cover change matrix given in Table 4.18.2 reveals that there is a decrease of 3.19 Ha of Scrub.
The negative change of 3.19 Ha is on account of encroachments, hence the same taken as loss of forest cover.Therefore the net loss of forest cover is 3.19 Ha.
There are 36 Beats in the Division. Negative changes in forest cover are noticed in only 2 Beats. There are nochanges in remaining 34 Beats.
Details of forest cover changes in these 2 Beats is shown in Table 4.18.3
Fig 4.18.3Fig 4.18.2
VDF MDF OF Scrub NF WB
Very Dense Forest 0.00 0.00 0.00 0.00 0.00 0.00 0.00
Moderately Dense Forest 0.00 1.57 0.00 0.00 0.00 0.00 1.57
Open Forest 0.00 0.00 38.35 0.00 0.00 0.00 38.35
Scrub 0.00 0.00 0.00 241.36 0.03 0.00 241.39
Non-Forest 0.00 0.00 0.00 0.00 158.33 0.00 158.33
Water 0.00 0.00 0.00 0.00 0.00 2.36 2.36
Total of 2010 0.00 1.57 38.35 241.36 158.36 2.36 442.00
Net Change 0.00 0.00 0.00 -0.03 0.03 0.00
2009
Table 4.18.2: Forest Cover change matrix
Total of
2009
2010
(Area in Km2)
Forest division wise results

66
Andhra Pradesh State of Forest - 2012
Table 4.18.3: Beat wise Forest Cover (Area in Ha)
MIRYALGUDA RANGE
Adavidevulapally 0.00 34.43 130.19 1007.92 108.47 0.00 1315.64 -1.74 1.74
Damercherla 0.00 1.58 35.29 1069.62 676.07 0.00 1797.98 -1.45 1.45
Grand Total 0.00 36.01 165.48 2077.54 784.54 0.00 3113.62 -3.19 3.19
BeatEncroach
mentsVDF MDF OF Scrub NF WB Total
Net
Change
Man becomes then not the lord and master of all creation but he is its servant.- Old letters 25 April 1925, 43 CWMG vol 26,546.
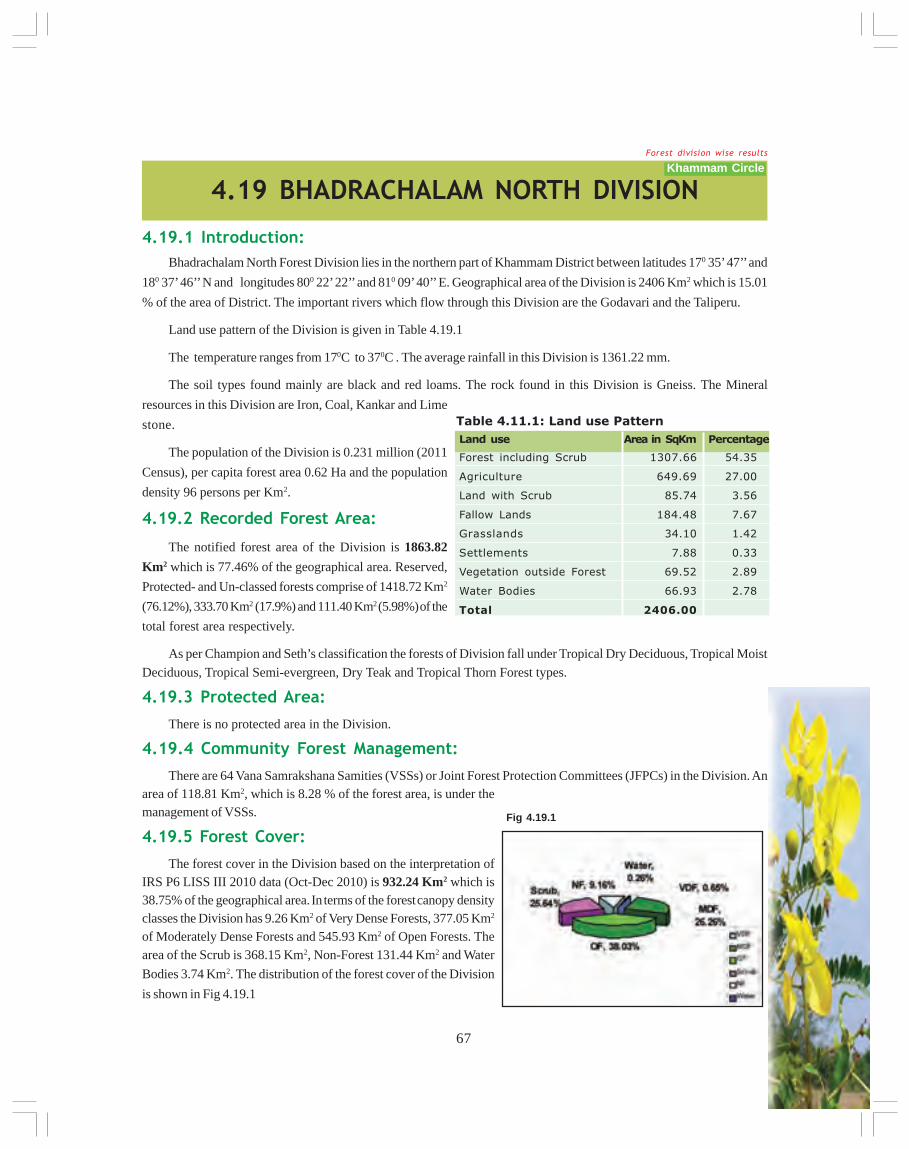
67
4.19.1 Introduction:
Bhadrachalam North Forest Division lies in the northern part of Khammam District between latitudes 170 35’ 47’’ and
180 37’ 46’’ N and longitudes 800 22’ 22’’ and 810 09’ 40’’ E. Geographical area of the Division is 2406 Km2 which is 15.01
% of the area of District. The important rivers which flow through this Division are the Godavari and the Taliperu.
Land use pattern of the Division is given in Table 4.19.1
The temperature ranges from 170C to 370C . The average rainfall in this Division is 1361.22 mm.
The soil types found mainly are black and red loams. The rock found in this Division is Gneiss. The Mineral
resources in this Division are Iron, Coal, Kankar and Lime
stone.
The population of the Division is 0.231 million (2011
Census), per capita forest area 0.62 Ha and the population
density 96 persons per Km2.
4.19.2 Recorded Forest Area:
The notified forest area of the Division is 1863.82
Km2 which is 77.46% of the geographical area. Reserved,
Protected- and Un-classed forests comprise of 1418.72 Km2
(76.12%), 333.70 Km2 (17.9%) and 111.40 Km2 (5.98%) of the
total forest area respectively.
As per Champion and Seth’s classification the forests of Division fall under Tropical Dry Deciduous, Tropical Moist
Deciduous, Tropical Semi-evergreen, Dry Teak and Tropical Thorn Forest types.
4.19.3 Protected Area:
There is no protected area in the Division.
4.19.4 Community Forest Management:
There are 64 Vana Samrakshana Samities (VSSs) or Joint Forest Protection Committees (JFPCs) in the Division. Anarea of 118.81 Km2, which is 8.28 % of the forest area, is under themanagement of VSSs.
4.19.5 Forest Cover:
The forest cover in the Division based on the interpretation ofIRS P6 LISS III 2010 data (Oct-Dec 2010) is 932.24 Km2 which is38.75% of the geographical area. In terms of the forest canopy densityclasses the Division has 9.26 Km2 of Very Dense Forests, 377.05 Km2
of Moderately Dense Forests and 545.93 Km2 of Open Forests. Thearea of the Scrub is 368.15 Km2, Non-Forest 131.44 Km2 and Water
Bodies 3.74 Km2. The distribution of the forest cover of the Division
is shown in Fig 4.19.1
4.19 BHADRACHALAM NORTH DIVISION
Land use Area in SqKm Percentage
Forest including Scrub 1307.66 54.35
Agriculture 649.69 27.00
Land with Scrub 85.74 3.56
Fallow Lands 184.48 7.67
Grasslands 34.10 1.42
Settlements 7.88 0.33
Vegetation outside Forest 69.52 2.89
Water Bodies 66.93 2.78
Total 2406.00
Table 4.11.1: Land use Pattern
Fig 4.19.1
Khammam CircleForest division wise results

68
Andhra Pradesh State of Forest - 2012
VDF MDF OF Scrub NF WB
Very Dense Forest 9.26 0.00 0.00 0.00 0.00 0.00 9.26
Moderately Dense Forest 0.00 377.05 0.00 0.12 0.00 0.00 377.17
Open Forest 0.00 0.00 545.93 1.14 0.00 0.00 547.07
Scrub 0.00 0.00 0.00 366.89 0.00 0.00 366.89
Non-Forest 0.00 0.00 0.00 0.00 131.44 0.00 131.44
Water 0.00 0.00 0.00 0.00 0.00 3.74 3.74
Total of 2010 9.26 377.05 545.93 368.15 131.44 3.74 1435.57
Net Change 0.00 -0.12 -1.14 1.26 0.00 0.00
2009
Table 4.19.2: Forest Cover change matrix
Total of
2009
2010
4.19.6 Change in Forest Cover:The satellite images of 2009 and 2010 are shown in Fig 4.19.2 & 4.19.3 respectively and the changes between this
period on the image of 2010.
Comparison of the current forest cover with that of previous assessment year shows a negative change of 126.92Ha. The forest cover change matrix given in Table 4.19.2 reveals that there is a decrease of 12.44 Ha of moderately denseforest and 114.48 Ha of open forest.
The total negative change of 126.92 Ha is on account of encroachments; hence the same is taken as loss of forest
cover. Therefore, the net loss of forest cover is 126.92 Ha.
There are 52 Beats in the Division. Negative changes are noticed in 5 Beats. There is no change in the remaining 47Beats.
Details of forest cover changes in these 5 Beats is shown in Table 4.19.3
(Area in Km2)
Fig 4.19.3Fig 4.19.2

69
Satellite Images
2009 2010
Table 4.19.3: List of Beats with negative change in Forest Cover (Area in Ha)
BHADRACHALAM RANGE
Arlagudem 0.00 434.19 559.46 230.15 198.06 1.78 1423.64 -25.56 25.56
Singaram 0.00 444.83 273.66 399.76 489.92 0.00 1608.17 -57.66 57.66
Total 0.00 879.02 833.12 629.91 687.98 1.78 3031.81 -83.22 83.22
DUMMUGUDEM RANGE
Anjubaka 0.00 230.06 69.90 104.46 94.58 0.00 499.00 -37.14 37.14
Kothuru 0.00 726.40 599.01 712.24 229.44 1.12 2268.21 -3.48 3.48
Uyyalamadugu 31.80 2189.52 2201.75 1719.78 148.39 70.10 6361.34 -3.08 3.08
Total 31.80 3145.98 2870.66 2536.48 472.41 71.22 9128.55 -43.70 43.70
Grand Total 31.80 4025.00 3703.78 3166.39 1160.39 73.00 12160.36 -126.92 126.92
BeatEncroach
mentsVDF MDF OF Scrub NF WB Total
Net
Change
Establish and safeguard viable nature and biosphere reserves, including wet lands and marine areas, to protect Earth’s life supportsystem, maintain biodiversity and preserve our heritage. - Earth Charter & Gandhi page 21
Longitude 80.985000 E
Latitude 17.821470 N
Area in Ha 14.11
Change OF to Scrub
Compt No 44
Beat Arlagudem
Range Bhadrachalam
Division Bhadrachalam North
Forest division wise results

70
Andhra Pradesh State of Forest - 2012
4.20.1 Introduction:
Bhadrachalam South Forest Division lies in the eastern part of Khammam District between latitudes 170 27’ 42’’ and
170 54’ 05’’ N and longitudes 810 05’ 45’’ and 810 48’ 47’’ E. Geographical Area of the Division is 1737.52 Km2 which is 10.84
% of the area of the District. The main rivers of the Division are Godavari, Sabari and Sileru. The Godavari river forms the
southern boundary and Sileru river forms the northern boundary of the Division.
Land use pattern of the Division is given in Table 4.20.1
The climate of this Division is generally cool and pleasant with temperatures ranging from 170C to 370C and theannual rainfall is about 1362 mm, received mainly from Southwest monsoons.
The soil types found mainly are Black and Red loams.The Rock found in this Division is Gneiss. The Mineral
resources in this Division are Iron, Coal, Kankar and Lime
stone.
Population of the Division is 0.092 million (2011
Census), per capita forest area 1.4 Ha and the population
density 53 persons per Km2.
4.20.2 Recorded Forest Area:
The notified forest area of the Division is 1632.27
Km2 which is 93.92% of the geographical area. Reserved,
Protected and Un-classed forests comprise of 1076.69 Km2
(65.96%), 479.53 Km2 (29.38%) and 76.05 Km2 (4.66%) of
the forest area respectively.
As per Champion and Seth’s classification the Forests of Division fall under Tropical Dry Deciduous, Tropical
Moist Deciduous, Tropical Semi-evergreen, Dry Teak and Tropical Thorn Forest types.
4.20.3 Protected Area:
The Division is one of the 4 constituent Divisions of Papikonda Wildlife Sanctuary. An area of 271.94 Km2 of the
Division is included in the Papikonda Wildlife Sanctuary.
4.20.4 Community Forest Management:
There are 40 Vana Samrakshana Samities (VSSs) or Joint- Forest
Protection Committees (JFPCs) in the Division. An area of 86.88 Km2
forests, constituting 6.72 % of the forest area, is under the management
of the VSSs.
4.20.5 Forest Cover:
The forest cover in the Division based on the interpretation of IRS
P6 LISS III 2010 data (Dec 2010-Jan 2011) is 1072.08 Km2, which is
61.68% of the geographical area. In terms of the forest canopy density
classes the Division has 83.57 Km2 of Very Dense Forests, 619.16 Km2
4.20 BHADRACHALAM SOUTH DIVISION
Land use Area in SqKm Percentage
Forest including Scrub 1255.59 72.24
Agriculture 203.03 11.68
Land with Scrub 37.40 2.15
Fallow Lands 178.75 10.28
Grasslands 1.04 0.06
Settlements 0.49 0.03
Vegetation outside Forest 37.34 2.15
Water Bodies 24.35 1.40
Total 1738.00
Table 4.20.1: Land use Pattern
Fig 4.20.1
Khammam Circle

71
VDF MDF OF Scrub NF WB
Very Dense Forest 83.57 0.00 0.00 0.00 0.00 0.00 83.57
Moderately Dense Forest 0.00 619.16 0.00 0.62 0.13 0.00 619.91
Open Forest 0.00 0.00 369.35 3.06 0.53 0.00 372.94
Scrub 0.00 0.00 0.00 176.06 1.07 0.00 177.13
Non-Forest 0.00 0.00 0.00 0.00 37.11 0.00 37.11
Water 0.00 0.00 0.00 0.00 0.00 3.00 3.00
Total of 2010 83.57 619.16 369.35 179.74 38.84 3.00 1293.66
Net Change 0.00 -0.75 -3.59 2.61 1.73 0.00
2009
Table 4.20.2: Forest Cover change matrix
Total of
2009
2010
of Moderately Dense Forests and 369.35 Km2 of Open Forests. The area of the Scrub is 179.74 Km2, Non-Forest 38.84 Km2
and Water Bodies 3.00 Km2. The distribution of the forest cover of the Division is shown in Fig 4.20.1
4.20.6 Change in Forest Cover:-
The satellite imageries of 2009 and 2010 are shown in Figs 4.20.2 & 4.20.3 respectively and the changes between the
periods on the image of 2010.
Comparison of the current forest cover with that of previous assessment year shows a negative change in forestcover of 434.12 Ha. The forest cover change matrix, given in Table 4.20.2 reveals that there is a decrease of 75.22 Ha of
moderately dense forest, 358.9 Ha of open forest.
The total negative change (including scrub) of 541.36 Ha is on account of encroachments and as the negative
change due to encroachment is taken as loss of Forest cover, the net loss of forest cover is 541.36 Ha in the Division.
There are 48 Beats in the Division. Negative changes in forest cover are seen in 26 Beats.There are no changes in the
forest cover of the remaining 22 Beats.
Details of forest cover changes in these 26 Beats is shown in Table 4.20.3
(Area in Km2)
Fig 4.20.3Fig 4.20.2
Forest division wise results

72
Andhra Pradesh State of Forest - 2012
Satellite Images
2009 2010
Table 4.20.3 : List of Beats with negative change in Forest Cover (Area in Ha)
CHINTUR RANGEChadalawada 325.55 1063.56 469.45 237.58 38.86 0.00 2135.00 -1.84 1.84Kansulur 28.66 845.21 565.32 213.33 29.08 0.00 1681.60 -4.32 4.32
Kondapalli 77.69 669.54 754.20 333.78 57.15 1.75 1894.11 -4.13 4.13Kundulur 464.51 1138.07 461.14 313.80 64.65 0.00 2442.17 -1.68 1.68Tellavarigudem 38.09 741.91 999.95 690.86 168.11 0.00 2638.92 -33.18 33.18Total 934.50 4458.29 3250.06 1789.35 357.85 1.75 10791.80 -45.15 45.15KUNAVARAM RANGE Bodanuru 5.81 533.24 565.45 270.67 72.09 1.78 1449.04 -22.41 22.41Buradagudem 58.55 825.86 814.07 825.24 203.44 3.29 2730.45 -8.68 8.68Chinanarsingapet 0.00 1074.83 1083.68 238.88 99.70 8.36 2505.45 -15.20 15.20
E.D. Pally 16.16 1542.27 1873.85 2402.03 856.00 6.55 6696.86 -58.18 58.18G.K.Gudem 0.00 263.17 288.54 208.21 28.96 0.00 788.88 -3.14 3.14Kuturu 170.88 1112.51 824.20 552.46 74.86 1.62 2736.53 -26.83 26.83Maddigudem 324.39 1380.23 1064.04 269.17 29.72 0.00 3067.55 -42.63 42.63
Murumuru 1.06 1352.16 724.46 241.36 43.86 0.00 2362.90 -41.28 41.28Narakonda 86.24 1293.04 872.37 1322.70 171.86 3.99 3750.20 -3.27 3.27Pochavaram 3.18 1177.74 958.75 220.28 11.85 3.10 2374.90 -16.01 16.01Sarivela 192.16 982.20 1256.88 1083.99 95.73 2.25 3613.21 -27.10 27.10
Singannagudem 1.66 406.45 394.67 80.29 1.22 0.00 884.29 -2.87 2.87Tekulabore 21.76 876.92 318.29 130.22 18.36 0.00 1365.55 -1.79 1.79Thatilanka 21.08 1528.22 1110.37 279.80 45.86 2.03 2987.36 -9.99 9.99Uppanapalli 218.28 1441.97 940.08 211.68 45.36 0.00 2857.37 -17.33 17.33Total 1121.21 15790.81 13089.70 8336.98 1798.87 32.97 40170.54 -296.71 296.71LAKKAVARAM RANGE Lakkavaram 353.42 1541.37 747.17 471.76 104.03 1.39 3219.14 -3.46 3.46Mittawada 206.42 948.72 463.58 25.00 24.50 0.15 1668.37 -4.30 4.30Total 559.84 2490.09 1210.75 496.76 128.53 1.54 4887.51 -7.76 7.76V.R.PURAM RANGE Chintaregupalli 0.00 214.24 331.00 218.83 76.52 0.00 840.59 -71.99 71.99Darapalli 95.87 1285.04 561.94 45.24 3.10 0.00 1991.19 -10.01 10.01Peddamattapalli 0.00 512.11 1040.30 485.36 341.67 3.07 2382.51 -101.17 101.17
Ummadivaram 1.50 669.81 750.48 165.55 13.71 1.76 1602.81 -8.57 8.57Total 97.37 2681.20 2683.72 914.98 435.00 4.83 6817.10 -191.74 191.74Grand Total 2712.92 25420.39 20234.23 11538.07 2720.25 41.09 62666.95 -541.36 541.36
BeatEncroach
mentsVDF MDF OF Scrub NF WB Total
Net
Change
Longitude 81.371570 E
Latitude 17.559500 N
Area in Ha 10.01
Change OF to Scrub
Compt No 62
Beat Darapalli
Range V.R.Puram
Division Bhadrachalam South

73
4.21.1 Introduction:
Khammam Forest Division lies in the southern part of Khammam district between latitudes 160 46’ 2’’ and 170 33’ 35’’N and longitudes 790 48’ 10’’ and 810 16’ 37’’ E. Geographical area of the Division is 6027 Km2 which is 37.6% of the area
of the district. The rivers in this Division are Munneru, Paleru, Akheru and Wyra.
Land use pattern of the Division is given in Table
4.21.1
The average highest temperature in the summer is
470 and the minimum average temperature in December is
140 and the average annual rainfall is 997.96mm, receivedmainly from Southwest monsoons.
The soil types found mainly in this Division are sandy
soils, black, red loamy and skeletal. The rock formationsfound in this Division are Archeans, Puranas and
Gondwanas. The Mineral resources in this Division are
coal, iron ore, lime stone, marble, barytes, graphite,chromite, mica, garnet, kyanite and building stones.
Population of the Division is 1.58 million (2011
Census), per capita forest area is 0.08 Ha and the population density is 263 persons per Km2.
4.21.2 Recorded Forest Area:
The notified forest area of the Division is 1246.19 Km2 which is 20.68% of the geographical area. Reserved,
Protected and Un-classed forests constitute 1131.25 Km2 (90.78 %), 112.74 Km2 (9.04%) and 2.2 Km2 (0.18%) of the forest
area respectively.
As per Champion and Seth’s classification the Forests of Division fall under Tropical Dry Deciduous, Tropical
Moist Deciduous, Tropical Semi-evergreen, Dry Teak and Tropical Thorn Forest types.
4.21.3 Protected Area:
There is no Protected Area in the Division.
4.21.4 Community Forest Management:
There are 110 Vana Samrakshana Samithies (VSSs) in the
Division. 238.76 Km2 forest area, which constitutes 18.06 % of the
forest area, is under the management of VSSs.
4.21.5 Forest Cover:
The forest cover in the Division based on the interpretation
of IRS P6 LISS III 2010 data (Dec 2010) is 858.11 Km2 which is14.23% of the geographical area. In terms of the forest canopy
density classes the Division has 0.41 Km2 Very Dense Forests,
4.21 KHAMMAM DIVISION
Land use Area in SqKm Percentage
Forest including Scrub 1242.49 20.62
Agriculture 4166.08 69.12
Land with Scrub 126.96 2.11
Fallow Lands 18.75 0.31
Grasslands 0.00 0.00
Settlements 78.02 1.29
Vegetation outside Forest 303.10 5.03
Water Bodies 91.61 1.52
Total 6027
Table 4.21.1: Land use Pattern
Fig 4.21.1
Khammam CircleForest division wise results

74
Andhra Pradesh State of Forest - 2012
349.97 Km2 Moderately Dense Forests and 507.73 Km2 Open Forest. The area of the Scrub is 355 Km2, Non-Forest 106.65Km2 and Water Bodies 2.58 Km2. The distribution of the forest cover of the Division is shown in Fig 4.21.1.
4.21.6 Change in Forest Cover:
The satellite images of 2009 and 2010 are shown in Figs. 4.21.2 & 4.21.3 respectively and the changes during this
period are shown on the image of 2010.
Comparison of the current forest cover with that of previous assessment year shows a negative change of 562.94Ha. The forest cover change matrix given in Table 4.21.2 reveals that there is a decrease of 108.26 Ha of moderately dense
forest, 454.68 Ha of open forest and 84.96 Ha of scrub.
The total negative change (including scrub) is 647.9 Ha. Out of this 202.80 Ha is on account of clearance of jungle
growth for raising of plantations, 65.02 Ha is on account of diversion of forest lands for on-forestry purposes and 380.08
Ha is on account of encroachments. As clearance of jungle growth for raising of plantations and diversion land are forestmanagement interventions the same are not considered as loss of forest cover. Thus only the negative change due to
encroachments is taken as loss of forest cover. Therefore the net loss of forest cover is 380.08 Ha in the Division.
There are 82 Beats in the Division. Negative changes are noticed in 22 Beats. There are no changes in the remaining
60 Beats.
Details of forest cover changes in these 22 Beats are shown in Table 4.21.3.
Fig 4.21.2 Fig 4.21.3
VDF MDF OF Scrub NF WB
Very Dense Forest 0.41 0.00 0.00 0.00 0.00 0.00 0.41
Moderately Dense Forest 0.00 349.97 0.00 0.00 1.08 0.00 351.05
Open Forest 0.00 0.00 507.73 0.00 4.55 0.00 512.28
Scrub 0.00 0.00 0.00 355.00 0.85 0.00 355.85
Non-Forest 0.00 0.00 0.00 0.00 100.17 0.00 100.17
Water 0.00 0.00 0.00 0.00 0.00 2.58 2.58
Total of 2010 0.41 349.97 507.73 355.00 106.65 2.58 1322.34
Net Change 0.00 -1.08 -4.55 -0.85 6.48 0.00
2009
Table 4.21.2: Forest Cover change matrix
Total of
2009
2010
(Area in Km2)
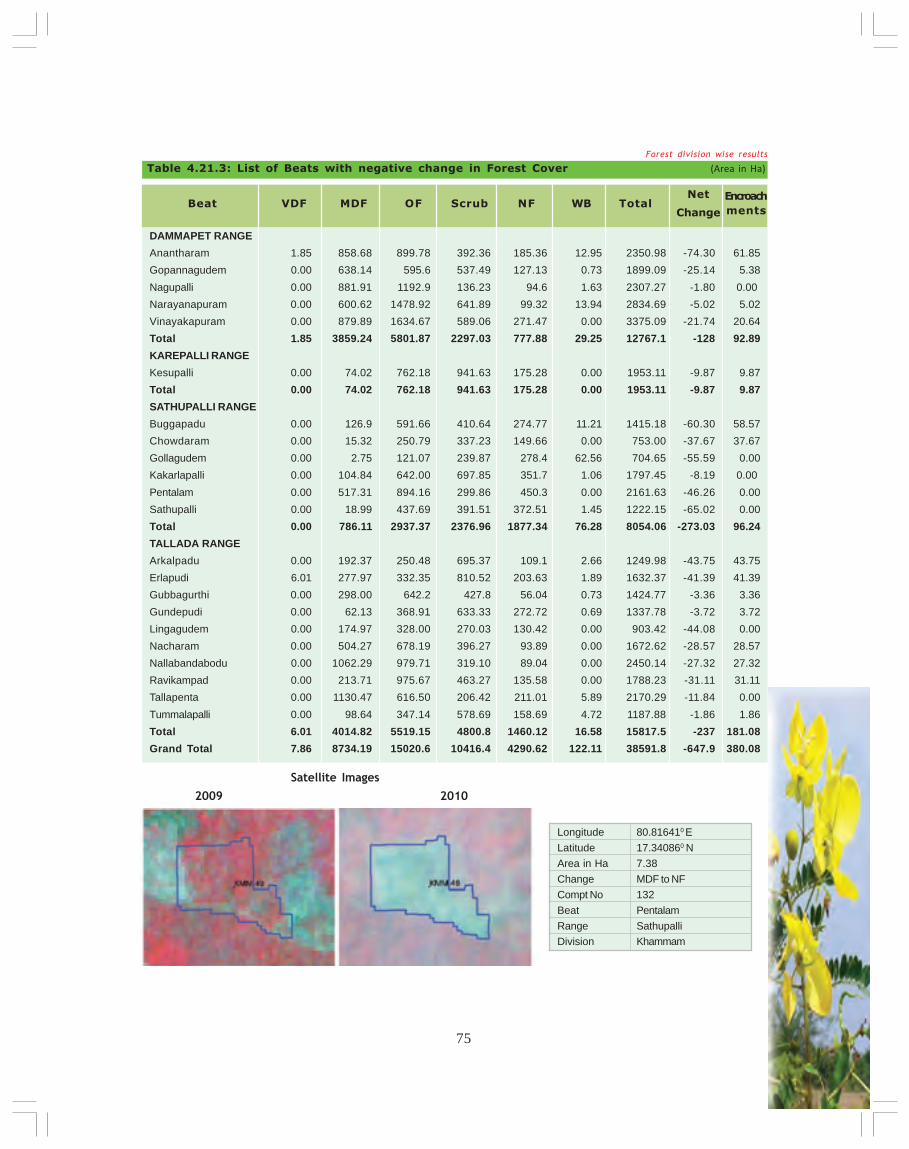
75
Table 4.21.3: List of Beats with negative change in Forest Cover (Area in Ha)
DAMMAPET RANGE
Anantharam 1.85 858.68 899.78 392.36 185.36 12.95 2350.98 -74.30 61.85
Gopannagudem 0.00 638.14 595.6 537.49 127.13 0.73 1899.09 -25.14 5.38
Nagupalli 0.00 881.91 1192.9 136.23 94.6 1.63 2307.27 -1.80 0.00
Narayanapuram 0.00 600.62 1478.92 641.89 99.32 13.94 2834.69 -5.02 5.02
Vinayakapuram 0.00 879.89 1634.67 589.06 271.47 0.00 3375.09 -21.74 20.64
Total 1.85 3859.24 5801.87 2297.03 777.88 29.25 12767.1 -128 92.89
KAREPALLI RANGE
Kesupalli 0.00 74.02 762.18 941.63 175.28 0.00 1953.11 -9.87 9.87
Total 0.00 74.02 762.18 941.63 175.28 0.00 1953.11 -9.87 9.87
SATHUPALLI RANGE
Buggapadu 0.00 126.9 591.66 410.64 274.77 11.21 1415.18 -60.30 58.57
Chowdaram 0.00 15.32 250.79 337.23 149.66 0.00 753.00 -37.67 37.67
Gollagudem 0.00 2.75 121.07 239.87 278.4 62.56 704.65 -55.59 0.00
Kakarlapalli 0.00 104.84 642.00 697.85 351.7 1.06 1797.45 -8.19 0.00
Pentalam 0.00 517.31 894.16 299.86 450.3 0.00 2161.63 -46.26 0.00
Sathupalli 0.00 18.99 437.69 391.51 372.51 1.45 1222.15 -65.02 0.00
Total 0.00 786.11 2937.37 2376.96 1877.34 76.28 8054.06 -273.03 96.24
TALLADA RANGE
Arkalpadu 0.00 192.37 250.48 695.37 109.1 2.66 1249.98 -43.75 43.75
Erlapudi 6.01 277.97 332.35 810.52 203.63 1.89 1632.37 -41.39 41.39
Gubbagurthi 0.00 298.00 642.2 427.8 56.04 0.73 1424.77 -3.36 3.36
Gundepudi 0.00 62.13 368.91 633.33 272.72 0.69 1337.78 -3.72 3.72
Lingagudem 0.00 174.97 328.00 270.03 130.42 0.00 903.42 -44.08 0.00
Nacharam 0.00 504.27 678.19 396.27 93.89 0.00 1672.62 -28.57 28.57
Nallabandabodu 0.00 1062.29 979.71 319.10 89.04 0.00 2450.14 -27.32 27.32
Ravikampad 0.00 213.71 975.67 463.27 135.58 0.00 1788.23 -31.11 31.11
Tallapenta 0.00 1130.47 616.50 206.42 211.01 5.89 2170.29 -11.84 0.00
Tummalapalli 0.00 98.64 347.14 578.69 158.69 4.72 1187.88 -1.86 1.86
Total 6.01 4014.82 5519.15 4800.8 1460.12 16.58 15817.5 -237 181.08
Grand Total 7.86 8734.19 15020.6 10416.4 4290.62 122.11 38591.8 -647.9 380.08
BeatEncroach
mentsVDF MDF OF Scrub NF WB Total
Net
Change
Satellite Images
2009 2010
Longitude 80.816410 E
Latitude 17.340860 N
Area in Ha 7.38
Change MDF to NF
Compt No 132
Beat Pentalam
Range Sathupalli
Division Khammam
Forest division wise results
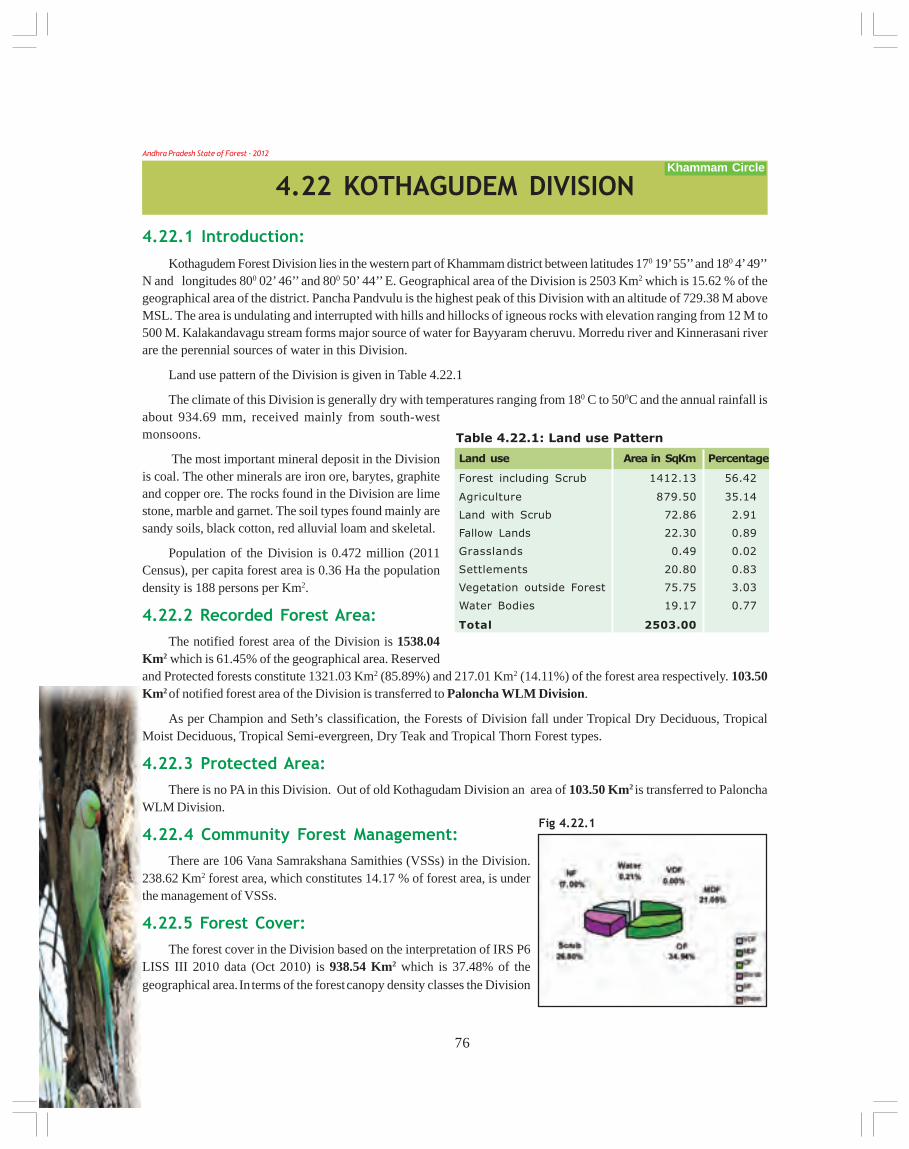
76
Andhra Pradesh State of Forest - 2012
4.22.1 Introduction:
Kothagudem Forest Division lies in the western part of Khammam district between latitudes 170 19’ 55’’ and 180 4’ 49’’N and longitudes 800 02’ 46’’ and 800 50’ 44’’ E. Geographical area of the Division is 2503 Km2 which is 15.62 % of thegeographical area of the district. Pancha Pandvulu is the highest peak of this Division with an altitude of 729.38 M aboveMSL. The area is undulating and interrupted with hills and hillocks of igneous rocks with elevation ranging from 12 M to500 M. Kalakandavagu stream forms major source of water for Bayyaram cheruvu. Morredu river and Kinnerasani riverare the perennial sources of water in this Division.
Land use pattern of the Division is given in Table 4.22.1
The climate of this Division is generally dry with temperatures ranging from 180 C to 500C and the annual rainfall isabout 934.69 mm, received mainly from south-westmonsoons.
The most important mineral deposit in the Divisionis coal. The other minerals are iron ore, barytes, graphiteand copper ore. The rocks found in the Division are limestone, marble and garnet. The soil types found mainly aresandy soils, black cotton, red alluvial loam and skeletal.
Population of the Division is 0.472 million (2011Census), per capita forest area is 0.36 Ha the populationdensity is 188 persons per Km2.
4.22.2 Recorded Forest Area:
The notified forest area of the Division is 1538.04Km2 which is 61.45% of the geographical area. Reservedand Protected forests constitute 1321.03 Km2 (85.89%) and 217.01 Km2 (14.11%) of the forest area respectively. 103.50Km2 of notified forest area of the Division is transferred to Paloncha WLM Division.
As per Champion and Seth’s classification, the Forests of Division fall under Tropical Dry Deciduous, TropicalMoist Deciduous, Tropical Semi-evergreen, Dry Teak and Tropical Thorn Forest types.
4.22.3 Protected Area:
There is no PA in this Division. Out of old Kothagudam Division an area of 103.50 Km2 is transferred to PalonchaWLM Division.
4.22.4 Community Forest Management:
There are 106 Vana Samrakshana Samithies (VSSs) in the Division.238.62 Km2 forest area, which constitutes 14.17 % of forest area, is underthe management of VSSs.
4.22.5 Forest Cover:
The forest cover in the Division based on the interpretation of IRS P6LISS III 2010 data (Oct 2010) is 938.54 Km2 which is 37.48% of thegeographical area. In terms of the forest canopy density classes the Division
Land use Area in SqKm Percentage
Forest including Scrub 1412.13 56.42
Agriculture 879.50 35.14
Land with Scrub 72.86 2.91
Fallow Lands 22.30 0.89
Grasslands 0.49 0.02
Settlements 20.80 0.83
Vegetation outside Forest 75.75 3.03
Water Bodies 19.17 0.77
Total 2503.00
Table 4.22.1: Land use Pattern
4.22 KOTHAGUDEM DIVISION
Fig 4.22.1
Khammam Circle
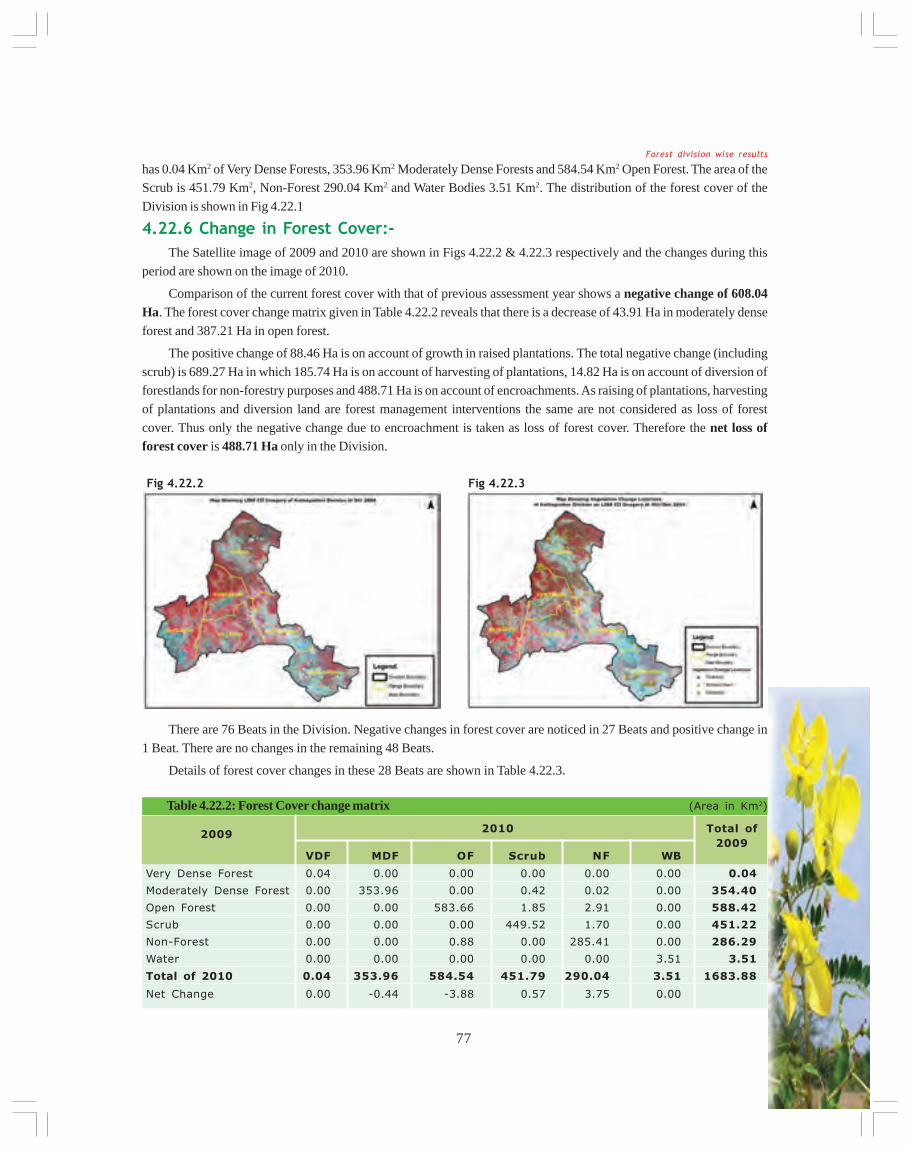
77
has 0.04 Km2 of Very Dense Forests, 353.96 Km2 Moderately Dense Forests and 584.54 Km2 Open Forest. The area of theScrub is 451.79 Km2, Non-Forest 290.04 Km2 and Water Bodies 3.51 Km2. The distribution of the forest cover of the
Division is shown in Fig 4.22.1
4.22.6 Change in Forest Cover:-
The Satellite image of 2009 and 2010 are shown in Figs 4.22.2 & 4.22.3 respectively and the changes during this
period are shown on the image of 2010.
Comparison of the current forest cover with that of previous assessment year shows a negative change of 608.04Ha. The forest cover change matrix given in Table 4.22.2 reveals that there is a decrease of 43.91 Ha in moderately dense
forest and 387.21 Ha in open forest.
The positive change of 88.46 Ha is on account of growth in raised plantations. The total negative change (including
scrub) is 689.27 Ha in which 185.74 Ha is on account of harvesting of plantations, 14.82 Ha is on account of diversion offorestlands for non-forestry purposes and 488.71 Ha is on account of encroachments. As raising of plantations, harvesting
of plantations and diversion land are forest management interventions the same are not considered as loss of forest
cover. Thus only the negative change due to encroachment is taken as loss of forest cover. Therefore the net loss offorest cover is 488.71 Ha only in the Division.
There are 76 Beats in the Division. Negative changes in forest cover are noticed in 27 Beats and positive change in
1 Beat. There are no changes in the remaining 48 Beats.
Details of forest cover changes in these 28 Beats are shown in Table 4.22.3.
Fig 4.22.3Fig 4.22.2
VDF MDF OF Scrub NF WB
Very Dense Forest 0.04 0.00 0.00 0.00 0.00 0.00 0.04
Moderately Dense Forest 0.00 353.96 0.00 0.42 0.02 0.00 354.40
Open Forest 0.00 0.00 583.66 1.85 2.91 0.00 588.42
Scrub 0.00 0.00 0.00 449.52 1.70 0.00 451.22
Non-Forest 0.00 0.00 0.88 0.00 285.41 0.00 286.29
Water 0.00 0.00 0.00 0.00 0.00 3.51 3.51
Total of 2010 0.04 353.96 584.54 451.79 290.04 3.51 1683.88
Net Change 0.00 -0.44 -3.88 0.57 3.75 0.00
2009
Table 4.22.2: Forest Cover change matrix
Total of
2009
2010
(Area in Km2)
Forest division wise results

78
Andhra Pradesh State of Forest - 2012
Satellite Images
2009 2010
Table 4.22.3: List of Beats with change in Forest Cover (Area in Ha)
BAYYARAM RANGEKachanpalli 0.00 599.62 427.76 209.73 131.55 0.61 1369.27 -14.37 14.37Karukonda 0.00 216.04 701.62 1123.44 735.45 3.00 2779.55 -20.63 20.63Total 0.00 815.66 1129.38 1333.17 867 3.61 4148.82 -35.00 35.00GUNDAL RANGEDamaratogu West 0.00 1364.77 1146.57 387.01 58.61 0.00 2956.96 -9.17 9.17Dongatogu 0.00 3317.84 1479.16 525.78 207.53 10.76 5541.07 -27.98 27.98Gundala 0.00 390.42 2894.59 1341.82 933 13.52 5573.35 -9.81 9.81Jinnelagudem 0.00 73.81 637.76 387.56 133.2 0.00 1232.33 -26.55 26.55Karnigudem 0.00 2498.52 995.6 754.13 596.39 1.77 4846.41 -40.85 40.85Kodavatancha 0.00 322.51 1230.61 1207.71 999.64 12.09 3772.56 -11.17 11.17Narsapuram 0.00 76.47 1377.99 1004.63 254.56 0.00 2713.65 -6.87 6.87Ravigudem 0.00 76.08 691.94 252.46 71.45 0.00 1091.93 -4.77 4.77Sayanpalli 0.00 127.87 422.56 1096.61 1289.95 21.38 2958.37 -3.11 3.11Valasala 0.00 181.79 608.12 1117.63 1000.97 10.37 2918.88 -5.32 5.32Total 0.00 8430.08 11484.9 8075.34 5545.3 69.89 33605.5 -145.6 145.6KOMARARAM RANGEManikyaram 0.00 853.16 798.64 392.01 482.64 0.00 2526.45 -12.06 12.06Shammunigudem 0.00 1110.46 645.34 190.01 44.8 1.43 1992.04 -2.25 2.25Vennelbail 0.00 612 1363.94 261.49 115.35 0.55 2353.33 -27.38 27.38Total 0.00 2575.62 2807.92 843.51 642.79 1.98 6871.82 -41.69 41.69KOTHAGUDEM RANGEChatakonda 0.00 0.00 140.8 1085.25 603.86 2.79 1832.7 -37.70 0.00Koppurai 0.00 409.73 660.3 942.74 483.61 11.68 2508.06 -2.96 2.96Medlamadugu 0.00 115.64 937.62 588.59 320.63 0.00 1962.48 -97.15 0.00Murlipad 0.00 317.51 1032.44 483.72 187.62 3.63 2024.92 -11.77 11.77Total 0.00 842.88 2771.16 3100.3 1595.72 18.1 8328.16 -149.58 14.73RAMAVARAM RANGEAbbugudem 0.00 12.74 350.49 303.9 226.17 0.00 893.3 -120.19 120.19Damarachrla 0.00 2.12 310.57 477.76 254.72 49.55 1094.72 -38.30 38.30Gareebpet 0.00 0.00 415.35 734.58 419.28 0.00 1569.21 -14.82 0.00Marrigudem 0.00 19.11 700.38 478.06 299.52 0.00 1497.07 -17.08 17.08Penagadapa 0.00 2.28 239.19 140.74 714.33 0.00 1096.54 -27.77 27.77Penuballi 0.00 165.64 1272.85 891.85 347.41 0.00 2677.75 -50.89 0.00Satyampet 0.00 470.08 1797.79 282.15 91.03 0.00 2641.05 -14.96 14.96Thippanpalli 0.00 0.00 231.43 795.36 790.57 0.00 1817.36 58.22 30.24Total 0.00 671.97 5318.05 4104.40 3143.03 49.55 13287.00 -225.79 248.54YELLANDU RANGEDharmapur 0.00 549.55 1339.49 546.41 278.96 1.72 2716.13 -3.15 3.15Total 0.00 549.55 1339.49 546.41 278.96 1.72 2716.13 -3.15 3.15Grand Total 0.00 13885.76 24850.90 18003.13 12072.80 144.85 68957.44 -600.81 488.71
BeatEncroach
mentsVDF MDF OF Scrub NF WB Total
Net
Change
Longitude 80.696750 E
Latitude 17.399540 N
Area in Ha 38.30
Change OF to Scrub
Compt No 34
Beat Damaracharla
Range Ramavaram
Division Kothagudem

79
4.23 PALONCHA DIVISION
4.23.1 Introduction:
Paloncha Forest Division lies in the central part of Khammam district between latitudes 170 19’ 4’’ and 180 09’ 10’’ N
and longitudes 800 25’ 56’’ and 810 30’ 17’’ E. Geographical Area of the Division is 2530 Km2 which is 15.78 % of the
geographical area of the District. The elevation varies from 12 M to 600 M above MSL in this Division. Godavari River
forms the north-eastern boundary of the Division. Other rivers in the Division are Kinnerasani, Pamleru and Morredu
which almost dry up in summer. Besides these rivers few big tanks like Tummalachervu, Parentalacheruvu also exist in
this Division.
Land use pattern of the Division is given in Table 4.23.1
The climate of this Division is generally cool, fresh
and pleasant with the maximum temperature of 480 C and
the minimum of 120C. The annual rainfall is ranging from
934.96 to 1334 mm, received mainly from south-west
monsoons.
The soil types found in this Division mainly are red
sandy loam, red loam, black-cotton, alluvial and saline.
The rock formations found in this Division are Quartzite,
Gneiss, Sandstone, Granite, Schist and Marble. The
important mineral deposit in this Division is coal. The
other minerals are Barytes, Graphite, Hematite and
soapstone.
Population of the Division is 0.42 million (2011 Census), per capita forest area is 0.53 Ha and the population density
is 123 persons per Km2.
4.23.2 Recorded Forest Area:
The notified forest area of the Division is 2156.62 Km2 which is 85.24% of the geographical area. Reserved,
Protected and Un-classed forests constitute 1545.8 Km2 (71.68%), 498.04 Km2 (23.09%) and 112.78 Km2 (5.23%) of the
forest area respectively. However an area of 582.88 Km2 of notified forests of the Division has since been transferred to
constitute Paloncha WLM Division.
As per Champion and Seth’s classification the forests of Division fall under Tropical Dry Deciduous, Tropical Moist
Deciduous, Tropical Semi-evergreen, Dry Teak and Tropical Thorn Forest types.
4.23.3 Protected Area:
No Protected Area exists in this Division after carving out of WLM Paloncha Division.
4.23.4 Community Forest Management:
There are 137 Vana Samrakshana Samithies (VSSs) in the Division. An area of 284.24 Km2 of forests, which is
18.66 % of notified forests , is under the management of VSSs.
Land use Area in SqKm Percentage
Forest including Scrub 1413.37 55.86
Agriculture 813.73 32.16
Land with Scrub 54.10 2.14
Fallow Lands 77.87 3.08
Grasslands 2.06 0.08
Settlements 31.88 1.26
Vegetation outside Forest 72.76 2.88
Water Bodies 64.22 2.54
Total 2530.00
Table 4.23.1: Land use Pattern
Khammam CircleForest division wise results

80
Andhra Pradesh State of Forest - 2012
Fig 4.23.14.23.5 Forest Cover:
The forest cover in the Division based on the interpretation of IRS
P6 LISS III 2010 data (Dec 2010) is 1094.71 Km2 which is 43.27% of the
geographical area. In terms of the forest canopy density classes the
Division has 38.77 Km2 of Very Dense Forests, 415.78 Km2 of Moderately
Dense Forests and 640.16 Km2 of Open Forests. The area of the Scrub is
292.36 Km2, Non-Forest 132.43 Km2 and Water Bodies 4.02 Km2. The
distribution of the forest cover of the Division is shown in Fig 4.23.1.
4.23.6 Change in Forest Cover:
The satellite images of 2009 and 2010 are shown in Figs 4.23.2 &
4.23.3 respectively and the changes during this period are shown on the image of 2010.
Comparison of the current forest cover with that of previous assessment year shows a negative change of 540.86
Ha. The forest cover change matrix given in Table 4.23.2 reveals that there is a decrease of 94.68 Ha of moderately dense
forest, 446.18 Ha of open forest and 156.85 Ha of scrub.
Of the total negative change (including scrub) of 697.71 Ha; 431.53 Ha is on account of clearance of growth for
raising of plantations, 31 Ha on account of diversion of forest lands for non-forestry purposes and 235.18 Ha on account
of encroachments. As clearance of growth for raising of plantations and diversion under Forest Conservation Act are
forest management interventions the same are not considered as loss of forest cover. Thus the negative change due to
encroachment alone is taken as loss of forest cover and the net loss of forest cover is 235.18 Ha.
There are 65 Beats in the Division. Negative changes in forest Cover are noticed in 27 Beats. There are no changes
in the remaining 38 Beats.
Details of forest cover changes in these 27 Beats are shown in Table 4.23.3.
Fig 4.23.2 Fig 4.23.3

81
Table 4.23.3 : List of Beats with negative change in Forest Cover (Area in Ha)
AMARARAM RANGEAmararam 95.63 2316.75 2122.37 344.84 75.34 0.00 4954.93 -3.14 3.14Gundalapadu 4.69 914.51 1216.77 191.64 13.49 0.00 2341.10 -4.04 4.04
Kothur 0.00 1041.51 1746.28 402.70 140.70 2.12 3333.31 -18.13 0.00Sridhara 0.00 12.70 1256.76 388.16 195.63 0.00 1853.25 -15.42 0.00Timmampet 4.91 102.11 1439.54 780.48 196.00 0.00 2523.04 -16.53 16.53Total 105.23 4387.58 7781.72 2107.82 621.16 2.12 15005.63 -57.26 23.71ASWAPURAM RANGEAswapuram 6.70 738.21 1350.18 542.88 150.22 2.42 2790.61 -2.79 2.79Chintriyala 0.00 3.22 87.86 441.38 195.57 0.00 774.49 -62.65 0.00Kistasagar 0.00 444.66 1070.72 462.51 142.49 0.00 2120.38 -7.25 7.25Manuguru West 0.00 54.15 1113.44 1585.14 2033.98 19.70 4911.19 -127.83 0.00
Total 6.70 1240.24 3622.20 3031.91 2522.26 22.12 10596.67 -200.52 10.04BAYYARAM RANGEAnantharam 1.07 52.96 393.08 579.86 431.52 4.76 1468.86 -10.40 10.40Dugnepally 0.00 92.28 97.98 254.68 116.35 0.00 561.29 -43.98 0.00
Gopalraopet 4.75 502.95 857.71 231.22 140.20 0.00 1736.83 -2.40 2.40Janampet 0.00 598.17 675.19 584.16 445.22 14.46 2317.20 -76.10 47.87Kalvalnagaram 1.73 227.30 842.57 1038.71 317.38 9.87 2437.56 -4.59 4.59Karakagudem 5.72 764.29 825.25 413.77 184.36 0.00 2193.39 -9.24 9.24
Kondaigudem 0.00 147.58 1385.35 552.39 280.42 34.79 2400.53 -11.06 0.00Seethampet 0.00 942.75 1100.44 348.74 336.16 4.77 2732.86 -90.41 0.00Total 13.27 3328.28 6177.57 4003.53 2251.61 68.65 15848.52 -248.18 74.50KUKUNOOR RANGEChigurumamidi 82.90 1571.34 1322.61 135.22 11.62 0.00 3123.69 -3.11 3.11Goparaju Gudem 0.00 105.80 473.26 191.14 98.56 0.00 868.76 -45.26 0.00Gundambore 0.00 127.39 860.58 422.98 64.46 2.65 1478.06 -9.39 9.39Kavadigundla North 10.21 979.16 260.08 173.42 57.69 0.69 1481.25 -11.74 11.74
Kukunoor 0.00 457.87 1127.21 268.06 49.52 0.00 1902.66 -6.64 6.64Lankalapally 0.00 167.88 565.29 238.89 64.54 1.06 1037.66 -7.16 7.16Total 93.11 3409.44 4609.03 1429.71 346.39 4.40 9892.08 -83.30 38.04PALONCHA RANGEDantalaboru 0.00 0.00 552.42 328.21 289.79 0.00 1170.42 -54.64 35.08Mulakalapally 0.00 35.37 1002.21 857.00 525.08 1.17 2420.83 -9.98 9.98Muthyalampadu 0.00 940.31 1486.95 737.05 251.85 15.44 3431.60 -23.74 23.74Pogadlapally 0.00 -3.91 290.38 315.88 157.17 1.73 761.25 -20.09 20.09
Total 0.00 971.77 3331.96 2238.14 1223.89 18.34 7784.10 -108.45 88.89Grand Total 218.31 13337.31 25522.48 12811.11 6965.31 115.63 59127.00 -697.71 235.18
BeatEncroach
mentsVDF MDF OF Scrub NF WB Total
Net
Change
VDF MDF OF Scrub NF WB
Very Dense Forest 38.77 0.00 0.00 0.00 0.00 0.00 38.77
Moderately Dense Forest 0.00 415.78 0.00 0.89 0.06 0.00 416.73
Open Forest 0.00 0.00 640.16 2.45 2.01 0.00 644.62
Scrub 0.00 0.00 0.00 289.02 1.57 0.00 290.59
Non-Forest 0.00 0.00 0.00 0.00 128.79 0.00 128.79
Water 0.00 0.00 0.00 0.00 0.00 4.02 4.02
Total of 2010 38.77 415.78 640.16 292.36 132.43 4.02 1523.52
Net Change 0.00 -0.95 -4.46 1.77 3.64 0.00
2009
Table 4.23.2: Forest Cover change matrix
Total of
2009
2010
(Area in Km2)
Forest division wise results
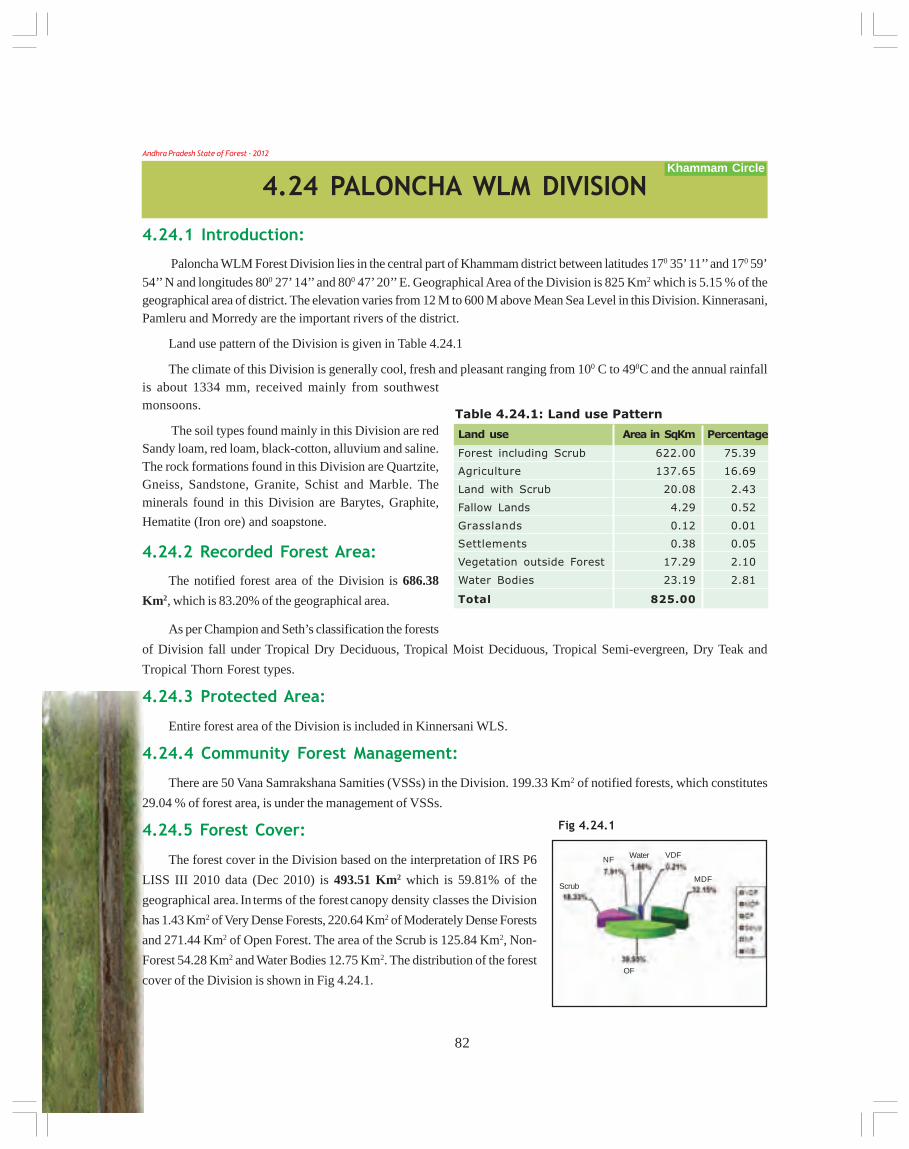
82
Andhra Pradesh State of Forest - 2012
4.24.1 Introduction:
Paloncha WLM Forest Division lies in the central part of Khammam district between latitudes 170 35’ 11’’ and 170 59’
54’’ N and longitudes 800 27’ 14’’ and 800 47’ 20’’ E. Geographical Area of the Division is 825 Km2 which is 5.15 % of thegeographical area of district. The elevation varies from 12 M to 600 M above Mean Sea Level in this Division. Kinnerasani,Pamleru and Morredy are the important rivers of the district.
Land use pattern of the Division is given in Table 4.24.1
The climate of this Division is generally cool, fresh and pleasant ranging from 100 C to 490C and the annual rainfallis about 1334 mm, received mainly from southwestmonsoons.
The soil types found mainly in this Division are redSandy loam, red loam, black-cotton, alluvium and saline.The rock formations found in this Division are Quartzite,Gneiss, Sandstone, Granite, Schist and Marble. Theminerals found in this Division are Barytes, Graphite,
Hematite (Iron ore) and soapstone.
4.24.2 Recorded Forest Area:
The notified forest area of the Division is 686.38
Km2, which is 83.20% of the geographical area.
As per Champion and Seth’s classification the forests
of Division fall under Tropical Dry Deciduous, Tropical Moist Deciduous, Tropical Semi-evergreen, Dry Teak and
Tropical Thorn Forest types.
4.24.3 Protected Area:
Entire forest area of the Division is included in Kinnersani WLS.
4.24.4 Community Forest Management:
There are 50 Vana Samrakshana Samities (VSSs) in the Division. 199.33 Km2 of notified forests, which constitutes
29.04 % of forest area, is under the management of VSSs.
4.24.5 Forest Cover:
The forest cover in the Division based on the interpretation of IRS P6
LISS III 2010 data (Dec 2010) is 493.51 Km2 which is 59.81% of the
geographical area. In terms of the forest canopy density classes the Division
has 1.43 Km2 of Very Dense Forests, 220.64 Km2 of Moderately Dense Forests
and 271.44 Km2 of Open Forest. The area of the Scrub is 125.84 Km2, Non-
Forest 54.28 Km2 and Water Bodies 12.75 Km2. The distribution of the forest
cover of the Division is shown in Fig 4.24.1.
4.24 PALONCHA WLM DIVISION
Land use Area in SqKm Percentage
Forest including Scrub 622.00 75.39
Agriculture 137.65 16.69
Land with Scrub 20.08 2.43
Fallow Lands 4.29 0.52
Grasslands 0.12 0.01
Settlements 0.38 0.05
Vegetation outside Forest 17.29 2.10
Water Bodies 23.19 2.81
Total 825.00
Table 4.24.1: Land use Pattern
Khammam Circle
Fig 4.24.1
Scrub
NF Water VDF
MDF
OF
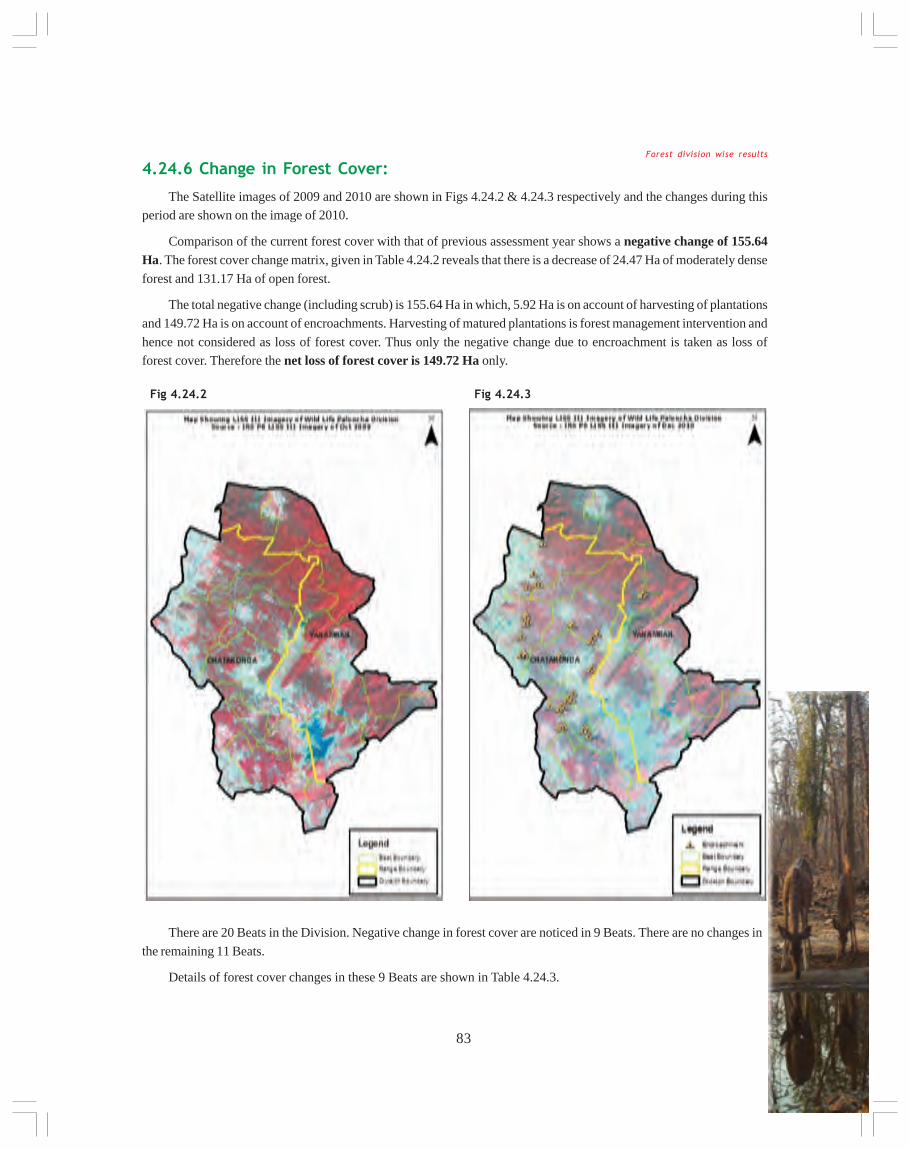
83
There are 20 Beats in the Division. Negative change in forest cover are noticed in 9 Beats. There are no changes in
the remaining 11 Beats.
Details of forest cover changes in these 9 Beats are shown in Table 4.24.3.
4.24.6 Change in Forest Cover:
The Satellite images of 2009 and 2010 are shown in Figs 4.24.2 & 4.24.3 respectively and the changes during thisperiod are shown on the image of 2010.
Comparison of the current forest cover with that of previous assessment year shows a negative change of 155.64Ha. The forest cover change matrix, given in Table 4.24.2 reveals that there is a decrease of 24.47 Ha of moderately dense
forest and 131.17 Ha of open forest.
The total negative change (including scrub) is 155.64 Ha in which, 5.92 Ha is on account of harvesting of plantations
and 149.72 Ha is on account of encroachments. Harvesting of matured plantations is forest management intervention and
hence not considered as loss of forest cover. Thus only the negative change due to encroachment is taken as loss offorest cover. Therefore the net loss of forest cover is 149.72 Ha only.
Fig 4.24.2 Fig 4.24.3
Forest division wise results
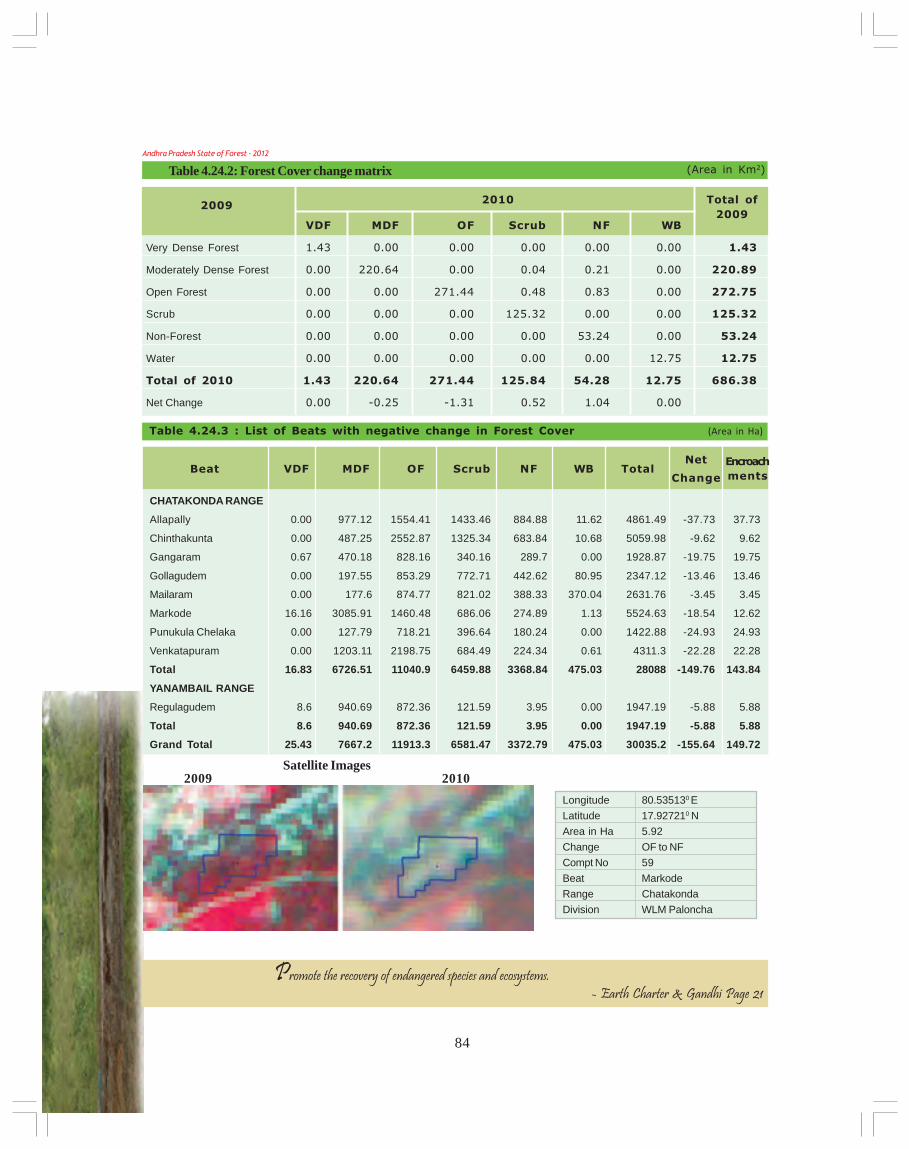
84
Andhra Pradesh State of Forest - 2012
VDF MDF OF Scrub NF WB
Very Dense Forest 1.43 0.00 0.00 0.00 0.00 0.00 1.43
Moderately Dense Forest 0.00 220.64 0.00 0.04 0.21 0.00 220.89
Open Forest 0.00 0.00 271.44 0.48 0.83 0.00 272.75
Scrub 0.00 0.00 0.00 125.32 0.00 0.00 125.32
Non-Forest 0.00 0.00 0.00 0.00 53.24 0.00 53.24
Water 0.00 0.00 0.00 0.00 0.00 12.75 12.75
Total of 2010 1.43 220.64 271.44 125.84 54.28 12.75 686.38
Net Change 0.00 -0.25 -1.31 0.52 1.04 0.00
2009
Table 4.24.2: Forest Cover change matrix
Total of
2009
2010
(Area in Km2)
Table 4.24.3 : List of Beats with negative change in Forest Cover (Area in Ha)
CHATAKONDA RANGE
Allapally 0.00 977.12 1554.41 1433.46 884.88 11.62 4861.49 -37.73 37.73
Chinthakunta 0.00 487.25 2552.87 1325.34 683.84 10.68 5059.98 -9.62 9.62
Gangaram 0.67 470.18 828.16 340.16 289.7 0.00 1928.87 -19.75 19.75
Gollagudem 0.00 197.55 853.29 772.71 442.62 80.95 2347.12 -13.46 13.46
Mailaram 0.00 177.6 874.77 821.02 388.33 370.04 2631.76 -3.45 3.45
Markode 16.16 3085.91 1460.48 686.06 274.89 1.13 5524.63 -18.54 12.62
Punukula Chelaka 0.00 127.79 718.21 396.64 180.24 0.00 1422.88 -24.93 24.93
Venkatapuram 0.00 1203.11 2198.75 684.49 224.34 0.61 4311.3 -22.28 22.28
Total 16.83 6726.51 11040.9 6459.88 3368.84 475.03 28088 -149.76 143.84
YANAMBAIL RANGE
Regulagudem 8.6 940.69 872.36 121.59 3.95 0.00 1947.19 -5.88 5.88
Total 8.6 940.69 872.36 121.59 3.95 0.00 1947.19 -5.88 5.88
Grand Total 25.43 7667.2 11913.3 6581.47 3372.79 475.03 30035.2 -155.64 149.72
BeatEncroach
mentsVDF MDF OF Scrub NF WB Total
Net
Change
Satellite Images2009 2010
Promote the recovery of endangered species and ecosystems.- Earth Charter & Gandhi Page 21
Longitude 80.535130 E
Latitude 17.927210 N
Area in Ha 5.92
Change OF to NF
Compt No 59
Beat Markode
Range Chatakonda
Division WLM Paloncha

85
4.25.1 Introduction:
Kadapa Forest Division lies in the middle of Kadapa district between latitudes 130 50’ 40’’ and 140 40’ 37’’ N and
longitudes 780 13’ 9’’ and 790 14’ 39’’ E. Geographical area of the Division is 4521 Km2 which is 29.44 % of the area of
district. This Division lies on the Deccan Plateau. Altitude of northern, eastern and south-eastern region is less while that
of the southern and south-western regions is more with altitude of 760 M. The main rivers that flow through Kadapa
Division are Penna, Papagni and Mandavi.
Land use pattern of the Division is given in Table 4.25.1
The climate of this Division is generally dry with temperatures ranging from 250C to 400C and the annual rainfall is
about 661.22mm.
The soil types found mainly are red loamy, black cotton
and red sandy. The minerals resources in this Division
are granites, barytes, asbestos and lime stone.
Population of the Division is 0.903 million (2011
Census), per capita forest area is 0.19 Ha and the population
density is 202 persons per Km2.
4.25.2 Recorded Forest Area:
The notified forest area of the Division is 1928.69
Km2 which is 25.63% of the geographical area. Reserved
and Protected Forests constitute 1,914.08 Km2 (99.24%) and 14.61 Km2 (0.76%) of the forest area respectively.
As per Champion and Seth’s classification the forests of Division fall under Southern Tropical Dry Deciduous,
Southern Tropical Thorn Mixed, Tropical Dry ever green and Dry Red Sanders bearing forest types. Red Sanders
(Pterocarpus santalinus), an endemic tree species, is available in plenty in this Division.
4.25.3 Protected Area:
Parts of Sri Lankamalleswara Wildlife Sanctuary (LWS) and Sri Penisula Narasimha Wildlife Sanctuary (PNS) each
fall in this Division. An area of 246.30 Km2 is included in Sri Lankamalleswara WLS and an area of 272.53 Km2 is included
in Sri Penisula Narasimha WLS.
4.25.4 Community Forest Management:
There are 118 Vana Samrakshana Samithies (VSSs) in the Division. 394.08
Km2 forest area, which constitutes 22.96 % of the forest area, is under themanagement of the VSSs.
4.25.5 Forest Cover:
The forest cover in the Division, based on the interpretation of IRS P6
LISS III (Jan 2011) is 1138.22 Km2 which is 25.17% of the geographical area.In terms of the forest canopy density classes the Division consists of 0.03
Km2 of Very Dense Forest, 164.81 Km2 of Moderately Dense Forest and 973.38
4.25 KADAPA DIVISION
Land use Area in SqKm Percentage
Forest including Scrub 1625.45 35.95
Agriculture 1721.55 38.08
Land with Scrub 359.63 7.95
Fallow Lands 602.52 13.33
Grasslands 0.25 0.01
Settlements 19.64 0.43
Vegetation outside Forest 140.98 3.12
Water Bodies 50.97 1.13
Total 4521.00
Table 4.25.1: Land use Pattern
Kurnool CircleForest division wise results
Fig 4.25.1

86
Andhra Pradesh State of Forest - 2012
There are 44 Beats in the Division. Negative changes in forest cover are noticed in 9 Beats. There are no changes inthe remaining 35 Beats.
Details of forest cover changes in these 9 Beats are shown in Table 4.25.3
Km2 of Open Forest. The area of the Scrub is 484.76 Km2, Non-Forest is 91.25 Km2 and Water Bodies is 2.32 Km2. Thedistribution of the forest cover of the Division is shown in Fig 4.25.1
4.25.6 Change in Forest Cover:
The satellite images of 2009 and 2010 are shown in Figs 4.25.2 & 4.25.3 respectively and the changes between this
period are shown on the image of 2010.
Comparison of the current forest cover with that of previous assessment year shows a negative change in forestcover of 25.71 Ha and positive change of 9.36 Ha. The forest cover change matrix given in Table 4.25.2 reveals that there
is a decrease of 3.43 Ha of Moderately dense forest, 22.28 Ha of open forest and 44.30 Ha of scrub.
The positive change is on account of raising of plantations and the negative change (including scrub) of 60.65 Ha
is on account of clearance of growth for raising of plantations. As raising of plantations is a forest management intervention
the same is not considered as loss of forest cover. Therefore there is no loss of forest cover in this Division.
VDF MDF OF Scrub NF WB
Very Dense Forest 0.03 0.00 0.00 0.00 0.00 0.00 0.03
Moderately Dense Forest 0.00 164.81 0.00 0.00 0.03 0.00 164.84
Open Forest 0.00 0.00 973.29 0.00 0.22 0.00 973.51
Scrub 0.00 0.00 0.00 484.76 0.44 0.00 485.20
Non-Forest 0.00 0.00 0.09 0.00 90.56 0.00 90.65
Water 0.00 0.00 0.00 0.00 0.00 2.32 2.32
Total of 2010 0.03 164.81 973.38 484.76 91.25 2.32 1716.55
Net Change 0.00 -0.03 -0.13 -0.44 0.60 0.00
2009
Table 4.25.2: Forest Cover change matrix
Total of
2009
2010
(Area in Km2)
Fig. 4.25.3Fig. 4.25.2

87
Table 4.25.3: List of Beats with change in Forest Cover (Area in Ha)
KADAPA RANGE
Bhakarapet 0.00 243.87 2,639.27 132.38 7.66 0.00 3023.18 -3.43 0.00
Maddimadgu_East 0.00 203.11 3,064.94 1,302.16 161.77 22.27 4754.25 -4.81 0.00
Total 0.00 446.98 5,704.21 1,434.54 169.43 22.27 7777.43 -8.24 0.00
RAYACHOTI RANGE
Saraswathipally 0.00 753.74 3,180.99 1,139.52 137.14 0.00 5211.39 -23.68 0.00
Total 0.00 753.74 3,180.99 1,139.52 137.14 0.00 5211.39 -23.68 0.00
SIDHOUT RANGE
Muthukur 0.00 65.66 2,027.10 1,632.52 503.08 0.00 4228.36 -11.39 0.00
Total 0.00 65.66 2,027.10 1,632.52 503.08 0.00 4228.36 -11.39 0.00
VEMPALLY RANGE
Yellatur 0.00 446.67 3,282.67 677.81 39.23 0.01 4446.39 -4.55 0.00
Total 0.00 446.67 3,282.67 677.81 39.23 0.01 4446.39 -4.55 0.00
VONTIMITTA RANGE
Mantapampalli 0.00 4.3 1,263.92 978.61 39.29 5.75 2291.87 -4.96 0.00
Nadimpally 0.00 16.86 1,920.43 849.22 113.62 0.00 2900.13 -9.23 0.00
Nandalur 0.00 42.8 1,787.45 899.57 206.83 0.45 2937.1 7.28 0.00
Vontimitta 0.00 4.62 2,183.33 1,963.55 50.8 5.89 4208.19 -5.88 0.00
Total 0.00 68.58 7,155.13 4,690.95 410.54 12.08 12337.29 -12.79 0.00
Grand Total 0.00 1,781.63 21,350.10 9,575.34 1,259.42 34.35 34000.85 -60.65 0.00
BeatEncroach
mentsVDF MDF OF Scrub NF WB Total
Net
Change
87
Forest division wise results

88
Andhra Pradesh State of Forest - 2012
4.26.1 Introduction:
Kurnool Forest Division lies in the western part of Kurnool district between latitudes 14056’49.56" and 15057’49.68"N
and longitudes 76058’26.04" and 78029’22.56"E. Geographical area of the Division is 12,904 Km2 which is 73.07 % of the
area of district. The rock formation consists of shales, limestone and quartzite. The elevation in the Division varies from
305 to 579.5 M above MSL. The elevation of Kurnool town is about 288 M above MSL. The River Tungabhadra, a
tributary of River Krishna, forms the northern boundary of the Division.
Land use pattern of the Division is given in Table 4.26.1
The climate of this Division is inland tropical
monsoonic type with 3 distinct seasons. Temperature
ranges from 120C to 450C and the average annual rainfall in
the Division is about 523.24 mm.
Important minerals and rocks found in the Division
are limestone, iron, red and yellow ochres, barytes,
diamond, black and pink granite. The soil types found
mainly are black cotton, red and saline.
Population of the Division is 3.12 million (2011
Census). The per capita forest area is 0.04 Ha and the
population density is 241 persons per Km2.
4.26.2 Recorded Forest Area:
The notified forest area of the Division is 1202.55 Km2 which is 9.58 % of the geographical area. Reserved,Protected and Un-classed forests constitute 1154.45 Km2 (96%), 37.17 Km2 (3.09%) and 10.93 Km2 (0.91%) of the forest
area respectively.
As per Champion and Seth’s classification the forests of Division fall under Tropical Dry Deciduous and Tropical
Thorn Forest types.
4.26.3 Protected Area:
There is no Protected Area in the Division.
4.26.4 Community Forest Management:
There are 149 VSSs in the Division. An area of 392.62 Km2 forests, whichconstitutes 32.65 % of forest area, is under CFM.
4.26.5 Forest Cover:
The forest cover in the Division based on the interpretation of IRS P6 LISS
III 2010 data (Jan 2011) is 269.65 Km2 which is 2.15 % of the geographical area.In terms of the forest canopy cover density classes the Division has 0.56 Km2 of
Moderately Dense Forests and 269.09 Km2 of Open Forests. The area of the
Scrub is 364.04 Km2, Non-Forests 565.97 Km2 and Water Bodies 2.89 Km2. Thedistribution of the forest cover of the Division is shown in Fig 4.26.1
4.26 KURNOOL DIVISION
Land use Area in SqKm Percentage
Forest including Scrub 634.11 4.92
Agriculture 10048.40 77.84
Land with Scrub 705.85 5.47
Fallow Lands 1031.6 7.99
Grasslands 83.82 0.65
Settlements 113.53 0.88
Vegetation outside Forest 71.55 0.55
Water Bodies 215.14 1.67
Total 12904.00
Table 4.26.1: Land use Pattern
Kurnool Circle
Fig 4.26.1

89
There are 40 Beats in the Division. Negative change in forest cover is noticed only in 1 Beat. There are no changes
in the remaining 39 Beats.
Details of forest cover changes in the Beat Ramallakote is shown in Table 4.26.3.
4.26.6 Change in Forest cover:
The satellite images of 2009 and 2010 are shown in Figs 4.26.2 & 4.26.3 respectively and the changes between thisperiod are shown on the image of 2010.
Comparison of the current forest cover with that of previous assessment year shows no change in the forest cover.
The forest cover change matrix given in Table 4.26.2 reveals that there is a loss of 6.67 Ha of scrub.
The negative change of 6.67 Ha is on account of diversion of forest land for non-forestry purpose. As diversion offorest land is permitted under the Forest Conservation Act, 1980 duly following the procedure and as would be compensated
with CA & CA plantation, hence the same is not considered as loss of forest cover. Therefore there is no net loss of forestcover in the Division.
Fig : 4.26.3Fig : 4.26.2
VDF MDF OF Scrub NF WB
Very Dense Forest 0.00 0.00 0.00 0.00 0.00 0.00 0.00
Moderately Dense Forest 0.00 0.56 0.00 0.00 0.00 0.00 0.56
Open Forest 0.00 0.00 269.09 0.00 0.00 0.00 269.09
Scrub 0.00 0.00 0.00 364.04 0.07 0.00 364.11
Non-Forest 0.00 0.00 0.00 0.00 565.90 0.00 565.90
Water 0.00 0.00 0.00 0.00 0.00 2.89 2.89
Total of 2010 0.00 0.56 269.09 364.04 565.97 2.89 1202.55
Net Change 0.00 0.00 0.00 -0.07 0.07 0.00
2009
Table 4.26.2: Forest Cover change matrix (Area in Km2)
Total of
2009
2010
Forest division wise results
Table 4.26.3 : List of Beats with negative change in Forest Cover (Area in Ha)
KURNOOL RANGE
Ramallakota 0.00 1.37 955.6 662.63 348.73 0.00 1968.33 -6.67 0.00
Total 0.00 1.37 955.6 662.63 348.73 0.00 1968.33 -6.67 0.00
Grand Total 0.00 1.37 955.6 662.63 348.73 0.00 1968.33 -6.67 0.00
BeatEncroach
mentsVDF MDF OF Scrub NF WB Total
Net
Change

90
Andhra Pradesh State of Forest - 2012
4.27.1 Introduction:
Nandyal Forest Division lies in the south-eastern part of Kurnool district between latitudes 14053’58.56" and
15040’58.08"N and longitudes 78020’27.6" and 78046’40.08" E. Geographical area of the Division is 2,600 Km2 which is
14.73 % of the geographical area of district. The rock formation consists of purple shaley lime stone, shale flags, grey
limestone and flags. The maximum elevation in the Division is 908.68 M above MSL. Important Rivers in this Division are
Kundu & Gundlakamma.
Land use pattern of the Division is given in Table 4.27.1
The climate of this Division is generally dry with temperatures ranging from 200C to 400C and the average annual
rainfall is about 914 mm received mainly from south-west
monsoons.
The soil types found mainly are black cotton, alluvial,
brown loamy and Red.
Population of the Division is 0.62 million (2011
Census). The per capita forest area is 0.17 Ha and the
population density is 239 persons per Km2.
4.27.2 Recorded Forest Area:
The notified forest area of the Division is 1066.46Km2 which is 41.02 % of the geographical area. The entire
forest area is Reserved Forest.
As per Champion and Seth’s classification, the
forests of Division fall under Tropical Dry Deciduous, Tropical Moist Deciduous and Tropical Thorn Forest types.
4.27.3 Protected Area:
A part of Gundla Brahmeswaram (GBM) Wildlife Sanctuary falls in this Division. Out of the total area 1,066.46 Km2
of notified forests, an area of 371.81 Km2 is included in the GBM WLS.
4.27.4 Community Forest Management:
There are 51 Vana Samrakshana Samities (VSSs) or Joint Forest
Protection Committees (JFPCs) in the Division. An area of 166.84
Km2 forests, which is 15.64 % of the notified forests, is under
management of the VSSs.
4.27.5 Forest Cover:
The forest cover in the Division based on the interpretation of
IRS P6 LISS III 2010 data (Jan-2011) is 929.79 Km2 which is 35.76 %
of the geographical area. In terms of the forest canopy density
classes the Division has 40.71 Km2 of Very Dense Forests, 595.10
4.27 NANDYAL DIVISION
Land use Area in SqKm Percentage
Forest including Scrub 999.59 38.45
Agriculture 1498.64 57.63
Land with Scrub 48.75 1.87
Fallow Lands 7.41 0.29
Grasslands 0.00 0.00
Settlements 11.86 0.46
Vegetation outside Forest 14.21 0.55
Water Bodies 19.54 0.75
Total 2600.00
Table 4.27.1: Land use Pattern
Kurnool Circle
Fig.4.27.1

91
There are 29 Beats in the Division and there are no changes in the forest cover during the period in any of the 29Beats.
Km2 of Moderately Dense Forests and 293.98 Km2 of Open Forests. The area of the Scrub is 67.67 Km2, Non-Forest 65.57
Km2 and Water Bodies 3.43 Km2. The distribution of the forest cover of the Division is shown in Fig 4.27.1
4.27.6 Change in Forest Cover:
The Satellite images of 2009 and 2010 are shown in Figs 4.27.2 & Fig 4.27.3 respectively.
Comparison of the current forest cover with that of previous assessment year shows that there is no change in theforest cover during the period .The forest cover change matrix is given in Table 4.27.2.
Fig.4.27.2 Fig.4.27.3
VDF MDF OF Scrub NF WB
Very Dense Forest 40.71 0.00 0.00 0.00 0.00 0.00 40.71
Moderately Dense Forest 0.00 595.10 0.00 0.00 0.00 0.00 595.1
Open Forest 0.00 0.00 293.98 0.00 0.00 0.00 293.98
Scrub 0.00 0.00 0.00 67.67 0.00 0.00 67.67
Non-Forest 0.00 0.00 0.00 0.00 65.57 0.00 65.57
Water 0.00 0.00 0.00 0.00 0.00 3.43 3.43
Total of 2010 40.71 595.10 293.98 67.67 65.57 3.43 1066.46
Net Change 0.00 0.00 0.00 0.00 0.00 0.00
2009
Table 4.27.2: Forest Cover change matrix (Area in Km2)
Total of
2009
2010
Forest division wise results

92
Andhra Pradesh State of Forest - 2012
4.28.1 Introduction:
Proddutur Forest Division lies in the northern part of Kadapa district between latitudes 140 19’ 37’’ and 150 13’ 43’’
N and longitudes 770 56’ 43’’ and 790 17’ 38’’ E. Geographical area of the Division is 7,524 Km2 which is 48.99 % of the
geographical area of district. The main rivers that flow through the Division are Penna, Chitravathi, Kunderu, Papaghni,
Sagileru and Mogamneru.
Land use pattern of the Division is given in Table 4.28.1
The climate of this Division is generally dry with temperatures ranging from 250C to 400C and the annual rainfall is
about 661.22mm, received mainly from south-west
monsoons.
The soil types found mainly are red loamy, black
cotton & red sandy. The important minerals available
are granites, barytes, asbestos and limestone.
Population of the Division is 1.34 million (2011
Census), the per capita forest area is 0.12 Ha and the
population density is 184 persons per Km2.
4.28.2 Recorded Forest Area:
The notified forest area of the Division is 1663.35Km2 which is 39.13% of the geographical area.
Reserved and Protected Forests constitute 1,549.48
Km2 (93.15%) and 114.07 Km2 (6.86%) of the forest area respectively.
As per Champion and Seth’s classification the Forests of Division fall under Southern Tropical Dry Deciduous,
Southern Tropical Thorn Mixed, Tropical Dry Ever green and Dry Red Sanders bearing forest types. Red Sanders
(Pterocarpus santalanus), a highly endemic tree species, is found in plenty in this Division.
4.28.3 Protected Area:
Parts of two PAs fall in this Division. An area of 218.12 Km2 is included in Sri Lankamalleswara WLS and an area of133.74 Km2 is included in Sri Penisula Narasimha WLS. Besides, Rajiv Gandhi National Park is also located in this
Division. It covers an area of 3.82 Km2.
4.28.4 Community Forest Management:
There are 128 Vana Samrakshana Samities (VSSs) in the Division. An area of 456.38 Km2, which is 28.97% of thenotified forest area, is under the management of the VSSs.
4.28.5 Forest Cover:
The forest cover in the Division based on the Interpretation of IRS P6 LISS III 2010 data (Oct 2010) is 982.11 Km2
which is 13.05% of the geographic area. In terms of the forest canopy density classes the Division has 3.58 Km2 of VeryDense Forests and 426.38 Km2 of Moderately Dense Forests and 552.15 Km2 of Open Forests. The area of the Scrub is
Land use Area in SqKm Percentage
Forest including Scrub 1285.95 17.09
Agriculture 4343.95 57.73
Land with Scrub 500.77 6.66
Fallow Lands 1101.21 14.64
Grasslands 1.56 0.02
Settlements 31.78 0.42
Vegetation outside Forest 115.58 1.54
Water Bodies 143.20 1.90
Total 7524.00
Table 4.28.1: Land use Pattern
4.28 PRODDUTUR DIVISIONKurnool Circle
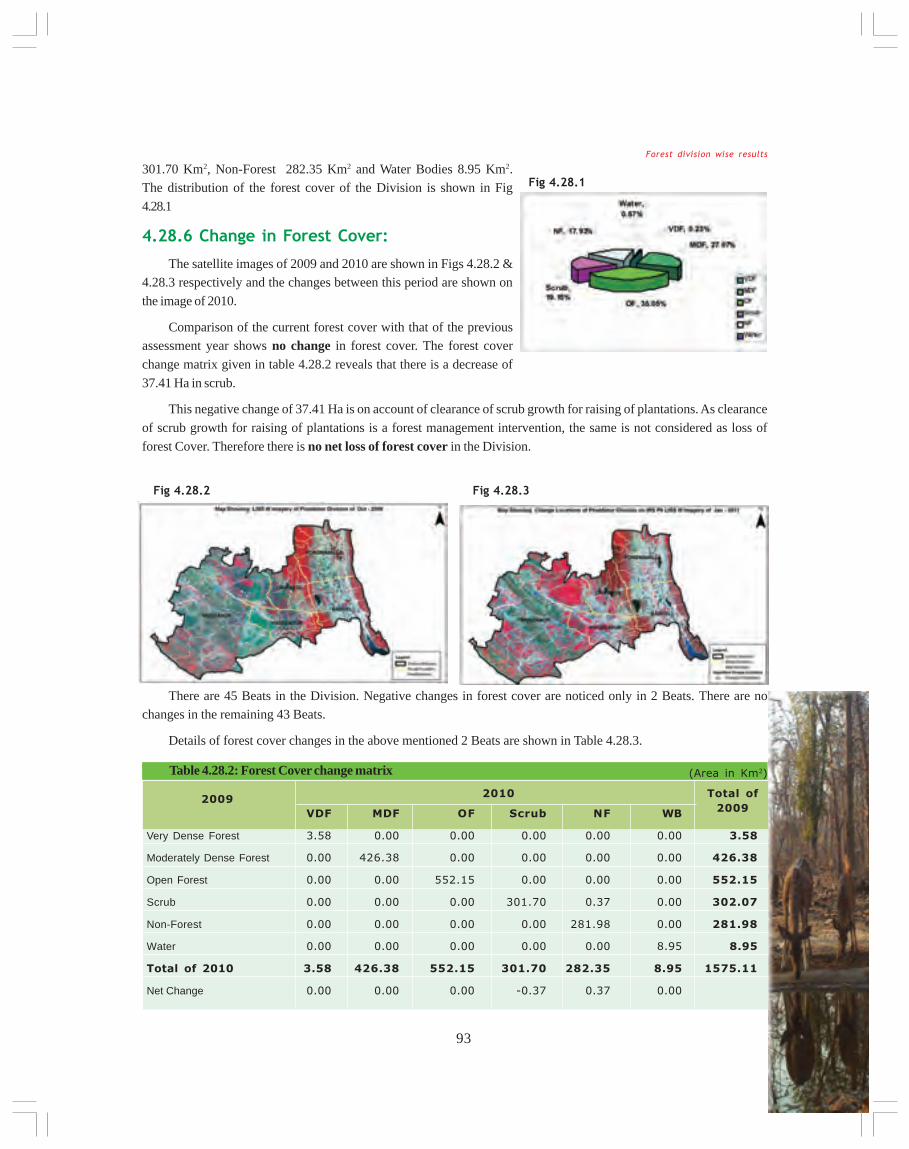
93
There are 45 Beats in the Division. Negative changes in forest cover are noticed only in 2 Beats. There are nochanges in the remaining 43 Beats.
Details of forest cover changes in the above mentioned 2 Beats are shown in Table 4.28.3.
301.70 Km2, Non-Forest 282.35 Km2 and Water Bodies 8.95 Km2.The distribution of the forest cover of the Division is shown in Fig
4.28.1
4.28.6 Change in Forest Cover:
The satellite images of 2009 and 2010 are shown in Figs 4.28.2 &4.28.3 respectively and the changes between this period are shown on
the image of 2010.
Comparison of the current forest cover with that of the previousassessment year shows no change in forest cover. The forest cover
change matrix given in table 4.28.2 reveals that there is a decrease of
37.41 Ha in scrub.
This negative change of 37.41 Ha is on account of clearance of scrub growth for raising of plantations. As clearance
of scrub growth for raising of plantations is a forest management intervention, the same is not considered as loss of
forest Cover. Therefore there is no net loss of forest cover in the Division.
Fig 4.28.3Fig 4.28.2
VDF MDF OF Scrub NF WB
Very Dense Forest 3.58 0.00 0.00 0.00 0.00 0.00 3.58
Moderately Dense Forest 0.00 426.38 0.00 0.00 0.00 0.00 426.38
Open Forest 0.00 0.00 552.15 0.00 0.00 0.00 552.15
Scrub 0.00 0.00 0.00 301.70 0.37 0.00 302.07
Non-Forest 0.00 0.00 0.00 0.00 281.98 0.00 281.98
Water 0.00 0.00 0.00 0.00 0.00 8.95 8.95
Total of 2010 3.58 426.38 552.15 301.70 282.35 8.95 1575.11
Net Change 0.00 0.00 0.00 -0.37 0.37 0.00
2009Total of
2009
2010
Table 4.28.2: Forest Cover change matrix (Area in Km2)
Fig 4.28.1
Forest division wise results

94
Andhra Pradesh State of Forest - 2012
ONIPENTA RANGE
Kothapalli 6.06 2195.04 1377.53 209.65 169.26 46.81 4004.35 -34.28 0.00
Total 6.06 2195.04 1377.53 209.65 169.26 46.81 4004.35 -34.28 0.00
PORUMAMILLA RANGE
Balayapalli 79.83 2396.78 2006 1323.19 656.74 72.67 6535.21 -3.13 0.00
Total 79.83 2396.78 2006 1323.19 656.74 72.67 6535.21 -3.13 0.00
Grand Total 85.89 4591.82 3383.53 1532.84 826.00 119.48 10539.56 -37.41 0.00
Table 4.28.3: List of Beats with negative change in Forest Cover (Area in Ha)
BeatEncroach
mentsVDF MDF OF Scrub NF WB Total
Net
Change
94

95
4.29.1 Introduction:
Kamareddy Forest Division lies in the south-eastern part of Nizamabad district between latitudes 180 3’ 34’’ and 180
42’ 11’’ N and longitudes 770 53’ 45’’ and 780 34’ 17’’ E. Geographical area of the Division is 2,732 Km2 which is 34.04% ofthe geographical area of district. This Division lies on the Deccan plateau. Manjira River flowing from Medak Districtenters Kamareddy Division at Nizam sagar reservoir and flows in northern direction to join river Godavari at the north-western corner of the district. Kappalavagu and Peddavagu are other two important streams of the Division. The riversand streams of the district form part of Godavari basin. The altitude varies from 335M to 490M above MSL. The highestpeak is 635M above MSL situated in Gandhari block.
Land use pattern of the Division is given in Table 4.29.1
The climate of this Division is generally dry withtemperatures ranging from 130C to 470C. The north andnorth-western regions of the Division receive above 1000mm of rainfall while north-eastern, south-eastern andsouthern regions receive less than 900 mm of rainfall fromsouth-west monsoons.
The soil types found mainly are black cotton andsandy loams. The economic minerals known from thisDivision are the building material-clay, ironore,manganese ore, mica, semi-precious stones, talc and soap-stones.
Population of the Division is 1.01 million (2011Census), per capita forest area is 0.1 Ha and the population
density is 371 persons per Km2.
4.29.2 Recorded Forest Area:
The notified forest area of the Division is 940 Km2 which is 34.40% of the geographical area. Reserved, Protected
and Un-classed forests constitute 598.56 Km2 (63.71%), 252 Km2 (26.84%) and 88.84 Km2 (9.45%) of the forest area
respectively.
As per Champion and Seth’s classification the Forests of Division fall under Tropical Dry Deciduous type.
4.29.3 Protected Area:
One PA, viz., Pocharam WLS is situated in this Division. An area of 86.76 Km2 is included in the PA.
4.29.4 Community Forest Management:
There are 112 Vana Samrakshana Samities (VSSs) in the Division. An area of 325.66 Km2, which is 33.19% of thenotified forest area, is under management of VSSs.
4.29.5 Forest Cover:
The forest cover in the Division based on the interpretation of IRS P6 LISS III 2010 data (Dec 2010) is 816.78 Km2
which is 29.9% of the geographical area. In terms of the forest canopy density classes the Division has 327.4 Km2 ofModerately Dense Forests and 489.38 Km2 of Open Forests. The area of the Scrub is 85.07 Km2, Non-Forest 75.44 Km2 and
Land use Area in SqKm Percentage
Forest including Scrub 903.57 33.01
Agriculture 1613.07 58.94
Land with Scrub 84.61 3.09
Fallow Lands 22.45 0.82
Grasslands 0.00 0.00
Settlements 3.00 0.11
Vegetation outside Forest 32.42 1.18
Water Bodies 77.88 2.85
Total 2732.00
Table 4.29.1: Land use Pattern
4.29 KAMAREDDY DEVISIONNizamabad Circle
Forest division wise results

96
Andhra Pradesh State of Forest - 2012
Water Bodies 4.00 Km2. The distribution of the forest cover of the Division isshown in Fig 4.29.1
4.29.6 Change in Forest Cover:
The Satellite images of 2009 and 2010 are shown in Figs 4.29.2 & Fig4.29.3 respectively and the changes between this period are shown on theimage of 2010.
Comparison of the current forest cover with that of previous assessmentyear shows a negative change of 34.47 Ha. The forest cover change matrixgiven in Table 4.29.2 reveals that there is a decrease of 7.05 Ha of moderatelydense forest, 27.42 Ha of open forest.
The entire negative change (including scrub) of 36.7 Ha is on account of encroachments. Therefore the net loss offorest cover is 36.7 Ha.
There are 66 Beats in the Division. Negative changes in forest cover are noticed in 5 Beats. There are no changes in
the remaining 61 Beats.
Details of forest cover changes in the above mentioned 5 Beats are shown in Table 4.29.3
Fig 4.29.1
Fig 4.29.3Fig 4.29.2
VDF MDF OF Scrub NF WB
Very Dense Forest 0.00 0.00 0.00 0.00 0.00 0.00 0.00
Moderately Dense Forest 0.00 327.40 0.00 0.07 0.00 0.00 327.47
Open Forest 0.00 0.00 489.38 0.19 0.08 0.00 489.65
Scrub 0.00 0.00 0.00 84.81 0.02 0.00 84.83
Non-Forest 0.00 0.00 0.00 0.00 75.34 0.00 75.34
Water 0.00 0.00 0.00 0.00 0.00 4.00 4.00
Total of 2010 0.00 327.40 489.38 85.07 75.44 4.00 981.29
Net Change 0.00 -0.07 -0.27 0.24 0.10 0.00
2009Total of
2009
2010
Table 4.29.2: Forest Cover change matrix (Area in Km2)

97
GANDHARI RANGE
Gandivate 0.00 743.87 1547.47 162.36 172.02 22.76 2648.48 -3.76 3.76
Total 0.00 743.87 1547.47 162.36 172.02 22.76 2648.48 -3.76 3.76
INDALWAI RANGE
Dubbak 0.00 276.29 1124.13 306.66 313.93 4.76 2025.77 -2.23 2.23
Gowraram 0.00 433.97 996.46 100.63 128.41 2.33 1661.80 -6.42 6.42
Indalwai 0.00 871.08 1002.64 113.54 38.05 3.89 2029.20 -1.97 1.97
Pipri 0.00 618.23 116.18 37.61 33.02 0.01 805.05 -22.32 22.32
Total 0.00 2199.57 3239.41 558.44 513.41 10.99 6521.82 -32.94 32.94
Grand Total 0.00 2943.44 4786.88 720.80 685.43 33.75 9170.30 -36.70 36.70
Table 4.29.3: List of Beats with negative change in Forest Cover (Area in Ha)
BeatEncroach
mentsVDF MDF OF Scrub NF WB Total
Net
Change
Satellite Images
2009 2010
I do believe that all God’s creatures have the right to live as much as we have.- Harijan of January 1937 CWMG vol 64, 215
Longitude 78.525270 E
Latitude 18.634940 N
Area in Ha 15.27
Change OF to Scrub
Compt No 388
Beat Pipri
Range Indalwai
Division Kamareddy
Forest division wise results

98
Andhra Pradesh State of Forest - 2012
4.30.1 Introduction:
Medak is located in the north-western part of Andhra Pradesh State between latitudes 170 25’ 36’’ and 180 17’ 7’’ Nand longitudes 770 26’ 43’’ and 790 7’ 37’’ E. Geographical area of the Division (& District) is 9,699 Km2. District forms a partof the table land of Deccan plateau and is crisscrossed by different ranges of hills. The ground is mostly flat andundulating with gentle slope. The elevation of ground varies from 500 M to 600M above MSL with occasional hills up to638M above MSL. Medak falls under semi-arid region of peninsular India.
Land use pattern of the Division is given in Table 4.30.1
The climate of this Division is generally dry with temperatures ranging from 60C to 460C and the annual rainfall isabout 700 mm, received mainly from Southwest monsoons.
Red earths comprising loamy sands, sandy loams and sandy clay loams; regar or black cotton soil comprising clayloams, clay and silt clay are present.
Manjeera River, which is a tributary of Godavari River,is the main source of water supply. Haldivagu orPasupuvagu- a tributary of Manjeera and Kudlair- atributary of Manair River, are also water sources in thedistrict and all these remains dry in the summer.
Population of the Division is 3.03 million (2011Census), per capita forest area is 0.03Ha and the populationdensity is 312 persons per Km2.
4.30.2 Recorded Forest Area:
The notified forest area of the Division is 905.94 Km2
which is 9.96% of the geographical area. Reserved,Protected and Un-classed forests constitute 634.22 Km2
(70%), 255.63 Km2 (28.2%) and 16.09 Km2 (0.018%) of the forest area respectively.
As per Champion and Seth’s classification the forests of Division fall under Tropical Dry Deciduous and Tropical
Thorn Forest types.
4.30.3 Protected Area:
A part of Pocharam WLS falls in this Division. An area of 55.47 Km2 is included in Pocharam WLS.
4.30.4 Community Forest Management:
There are 251 Vana Samrakshana Samities (VSSs) in the Division. An area of 678.04 Km2 of forests, which is 75% of
notified forest area, is under the management of VSSs.
4.30.5 Forest Cover:
The forest cover in the Division based on the interpretation of IRSP6 LISS III 2010 data (Dec 2010) is 588.15 km2 which is 6.06% of thegeographical area. In terms of the forest canopy density classes theDivision has 92.653 Km2 of Moderately Dense Forests and 495.50 Km2 ofOpen Forests. The area of the Scrub is 279.77 Km2, Non-Forests 45.98Km2 and Water Bodies 2.68 Km2. The distribution of the forest cover of
the division is shown in Fig 4.30.1
Land use Area in SqKm Percentage
Forest including Scrub 923.13 9.52
Agriculture 7591.99 78.28
Land with Scrub 561.88 5.79
Fallow Lands 11.42 0.12
Settlements 50.71 0.52
Vegetation outside Forest 293.88 3.03
Water Bodies 265.99 2.74
Total 9699.00
Table 4.30.1: Land use Pattern
Fig 4.30.1
4.30 MEDAK DIVISIONNizamabad Circle

99
4.30.6 Change in Forest Cover:
The Satellite image of 2009 and 2010 are shown in Figs 4.30.2 & 4.30.3 respectively and the changes between this
period are shown on the image of 2010.
Comparison of the current forest cover with that of previous assessment year shows a negative change of 179.11Ha and positive change of 2.94 Ha. The forest cover change matrix given in Table 4.30.2 reveals that there is an increase
of 0.32 Ha in Moderately dense forest and a decrease of 176.49 Ha in open forest.
Out of the total negative change (including scrub) of 320.54 Ha, a change of 25.23 Ha is on account of clearance of
jungle growth for raising of plantations, 203.55 Ha on account of harvesting of matured plantation, 1.29 Ha is on account
of diversion of forest land for non-forestry purposes and 90.47 Ha on account of encroachments. As harvesting of
plantations and clearance of jungle growth for raising of plantations and diversion of forestlands are forest management
interventions the same are not considered as loss of forest cover. Thus only the negative change due to encroachment
is taken as loss of forest cover. Therefore the net loss of forest cover is 90.47 Ha only.
There are 92 Beats in the Division. Negative changes in forest cover are noticed in 12 Beats. There are no changes
in remaining 80 Beats.
Details of forest cover changes in the 12 Beats mentioned above are shown in Table 4.30.3
VDF MDF OF Scrub NF WB
Very Dense Forest 0.00 0.00 0.00 0.00 0.00 0.00 0.00
Moderately Dense Forest 0.00 92.624 0.00 0.00 0.026 0.00 92.65
Open Forest 0.00 0.000 495.50 0.22 1.54 0.00 497.26
Scrub 0.00 0.000 0.00 279.55 1.38 0.00 280.93
Non-Forest 0.00 0.029 0.00 0.00 43.03 0.00 43.06
Water 0.00 0.00 0.00 0.00 0.00 2.68 2.68
Total of 2010 0.00 92.653 495.50 279.77 45.98 2.68 916.58
Net Change 0.00 0.003 -1.76 -1.16 2.92 0.00
2009Total of
2009
2010
Table 4.30.2: Forest Cover change matrix (Area in Km2)
Forest division wise results
Fig 4.30.3Fig 4.30.2

100
Andhra Pradesh State of Forest - 2012
Satellite Images
2009 2010
MEDAK RANGE
Annaram 0.00 118.36 815.57 257.74 27.87 2.00 1,221.54 -4.85 0.00
Total 0.00 118.36 815.57 257.74 27.87 2.00 1221.54 -4.85 0.00
NARSAPUR RANGE
Narayanapoor 0.00 3.1 292.02 266.93 15.91 0.00 577.96 -18.12 18.12
Nathinaipally 0.00 10.64 332.94 375.39 85.57 0.00 804.54 -11.37 11.37
Tirumalpur 0.00 0.5 349.77 433.44 26.42 0.00 810.13 -20.84 20.84
Wailal 0.00 74.25 518.24 294.28 76.21 0.00 962.98 -23.21 0.00
Total 0.00 88.49 1492.97 1370.04 204.11 0.00 3155.61 -73.54 50.33
SIDDIPET RANGE
Chilasagar 0.00 9.4 348.25 470.00 7.93 11.9 847.48 -50.89 0.00
Gajwel 0.00 1.79 774.32 668.18 26.41 9.40 1,480.10 -49.93 0.00
Induprial 0.00 1.79 801.85 1,158.66 86.37 13.58 2,062.25 -1.29 0.00
Jagdevpur 0.00 0.00 780.99 360.71 9.27 1.00 1,151.97 -3.92 3.92
Meenajipet 0.00 1.79 880.97 1,053.20 55.00 0.36 1,991.32 -59.68 0.00
Mulugu 0.00 24.22 882.02 541.62 96.13 4.70 1,548.69 -21.86 0.00
Total 0.00 38.99 4468.4 4252.37 281.11 40.94 9081.81 -187.57 3.92
ZAHEERABAD RANGE
Gudgarpally 0.00 398.05 705.63 223.81 58.05 24.32 1,409.86 -48.70 36.22
Total 0.00 398.05 705.63 223.81 58.05 24.32 1409.86 -48.70 36.22
Grand Total 0.00 643.89 7482.57 6103.96 571.14 67.26 14868.8 -314.66 90.47
Table 4.30.3: List of Beats with negative change in Forest Cover (Area in Ha)
BeatEncroach
mentsVDF MDF OF Scrub NF WB Total
Net
Change
Control and eradicate non-native or genetically modified organisms harmful to native species and the environment and preventintroduction of such harmful organisms. - Earth charter & Gandhi page 59
Longitude 78.304860 E
Latitude 17.695290 N
Area in Ha 6.71
Change OF to NF
Compt No 332
Beat Nathinaipally
Range Narsapur
Division Medak
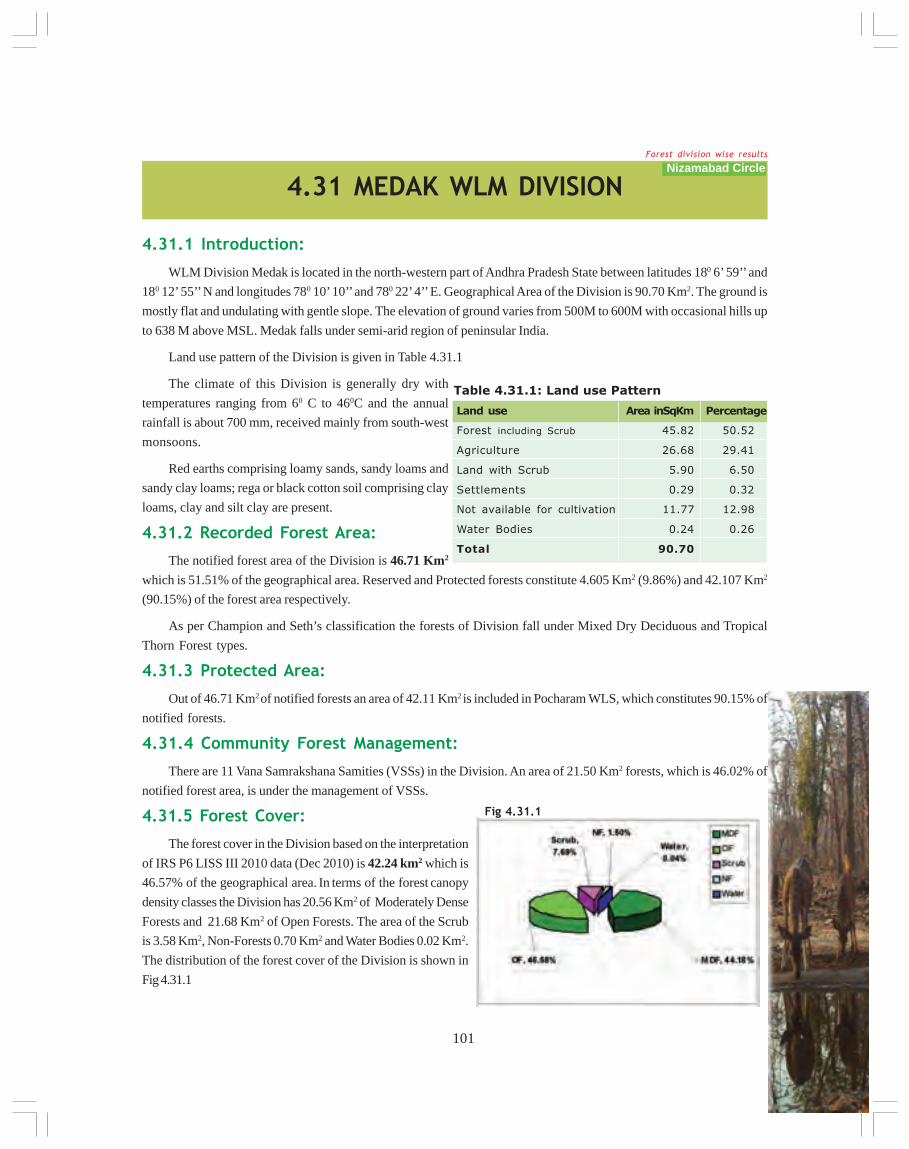
101
4.31 MEDAK WLM DIVISION
4.31.1 Introduction:
WLM Division Medak is located in the north-western part of Andhra Pradesh State between latitudes 180 6’ 59’’ and
180 12’ 55’’ N and longitudes 780 10’ 10’’ and 780 22’ 4’’ E. Geographical Area of the Division is 90.70 Km2. The ground is
mostly flat and undulating with gentle slope. The elevation of ground varies from 500M to 600M with occasional hills up
to 638 M above MSL. Medak falls under semi-arid region of peninsular India.
Land use pattern of the Division is given in Table 4.31.1
The climate of this Division is generally dry with
temperatures ranging from 60 C to 460C and the annual
rainfall is about 700 mm, received mainly from south-west
monsoons.
Red earths comprising loamy sands, sandy loams and
sandy clay loams; rega or black cotton soil comprising clay
loams, clay and silt clay are present.
4.31.2 Recorded Forest Area:
The notified forest area of the Division is 46.71 Km2
which is 51.51% of the geographical area. Reserved and Protected forests constitute 4.605 Km2 (9.86%) and 42.107 Km2
(90.15%) of the forest area respectively.
As per Champion and Seth’s classification the forests of Division fall under Mixed Dry Deciduous and Tropical
Thorn Forest types.
4.31.3 Protected Area:
Out of 46.71 Km2 of notified forests an area of 42.11 Km2 is included in Pocharam WLS, which constitutes 90.15% of
notified forests.
4.31.4 Community Forest Management:
There are 11 Vana Samrakshana Samities (VSSs) in the Division. An area of 21.50 Km2 forests, which is 46.02% of
notified forest area, is under the management of VSSs.
4.31.5 Forest Cover:
The forest cover in the Division based on the interpretation
of IRS P6 LISS III 2010 data (Dec 2010) is 42.24 km2 which is
46.57% of the geographical area. In terms of the forest canopy
density classes the Division has 20.56 Km2 of Moderately Dense
Forests and 21.68 Km2 of Open Forests. The area of the Scrub
is 3.58 Km2, Non-Forests 0.70 Km2 and Water Bodies 0.02 Km2.
The distribution of the forest cover of the Division is shown in
Fig 4.31.1
Fig 4.31.1
Nizamabad Circle
Land use Area inSqKm Percentage
Forest including Scrub 45.82 50.52
Agriculture 26.68 29.41
Land with Scrub 5.90 6.50
Settlements 0.29 0.32
Not available for cultivation 11.77 12.98
Water Bodies 0.24 0.26
Total 90.70
Table 4.31.1: Land use Pattern
Forest division wise results

102
Andhra Pradesh State of Forest - 2012
4.31.6 Change in Forest Cover:
The Satellite images of 2009 and 2010 are shown in Figs 4.31.2 & 4.31.3 respectively. Comparison of the current forestcover with that of previous assessment year shows that there is no change in the forest cover during this period. The
forest cover change matrix is given in Table 4.31.2.
There are 3 Beats in the Division.There are no changes in forest cover in any of the 3 Beats.
VDF MDF OF Scrub NF Water
Very Dense Forest 0.00 0.00 0.00 0.00 0.00 0.00 0.00
Moderately Dense Forest 0.00 20.56 0.00 0.00 0.00 0.00 20.56
Open Forest 0.00 0.00 21.68 0.00 0.00 0.00 21.68
Scrub 0.00 0.00 0.00 3.58 0.00 0.00 3.58
Non-Forest 0.00 0.00 0.00 0.00 0.70 0.00 0.70
Water 0.00 0.00 0.00 0.00 0.00 0.02 0.02
Total of 2010 0.00 20.56 21.68 3.58 0.70 0.02 46.54
Net Change 0.00 0.00 0.00 0.00 0.00 0.00 0.00
2009Total of
2009
2010
Table 4.31.2: Forest Cover change matrix (Area in Km2)
Fig 4.31.2 Fig 4.31.3
We should feel a more living bond between ourselves and the rest of the animate world. - ( CWMG vol 42, 238)

103
4.32 NIZAMABAD DIVISION
4.32.1 Introduction:
Nizamabad Forest Division lies in the north-western part of Nizamabad district between latitudes 180 10’ 10’’ and 190
00’ 55’’ N and longitudes 770 31’ 17’’ and 780 40’ 17’’ E. Geographical Area of the Division is 5,219 Km2 which is 65.59 %
of the area of district. This region lies on deccan plateau. Godavari river enters Andhra Pradesh at Kandhakurthi inNizamabad Division. Manjira River, which flows in north-west direction through thick forests of Nizamabad and Kamareddy
Divisions, joins Godavari at Kandhakurthi.
Land use pattern of the Division is given in Table 4.32.1
The climate of this Division is generally dry with temperatures ranging from 130C to 470C and the annual rainfall isabout 1033.7mm, received mainly from south-west monsoons.
Red soils are extensive followed by black soils in
Nizamabad Division. Alluvial and lateritic soils are foundoccasionally and in small extent. Along the banks of
Godavari and other big streams soil is loamy or alluvial
and more fertile, hence support better forests. Most ofthe soils have morrum underneath at different depths,
which support some of the good Teak forests in the
Division. Variety of colored granites and the deccan traprocks and economically valuable minerals are available in
this Division.
Population of the Division is 1.54 million (2011Census), per capita forest area is 0.05 Ha and the
population density is 294 persons per Km2.
4.32.2 Recorded Forest Area:
The notified forest area of the Division is 872 Km2 which is 16.7% of the geographical area. Reserved, Protected andUn-classed forests constitute 530.36 Km2 (60.84%), 319 Km2 (36.61%) and 22.26 Km2 (2.5%) of the forest area respectively.
As per Champion and Seth’s classification the forests of Division fall under Tropical Dry Deciduous type.
4.32.3 Protected Area:
There is no Protected Area in the Division.
4.32.4 Community Forest Management:
There are 148 Vana Samrakshana Samities (VSSs) in the Division. An area of 423.48Km2 forests, which is 48.56% of
forest area, is under the management of VSSs.
4.32.5 Forest Cover:
The forest cover in the Division based on the interpretation of IRS P6 LISS III 2010 data (Dec 2010) is 619.32 Km2
which is 11.87% of the geographical area. In terms of the forest canopy density classes the Division has 309.20 Km2 of
Moderately Dense Forests and 310.12 Km2 of Open Forests. The area of the Scrub is 80.37 Km2, Non-forests 82.12 Km2
Land use Area in SqKm Percentage
Forest including Scrub 705.71 13.52
Agriculture 3809.14 72.99
Land with Scrub 192.54 3.69
Fallow Lands 31.84 0.61
Grasslands 0.00 0.00
Settlements 31.74 0.61
Vegetation outside Forest 45.00 0.86
Water Bodies 402.76 7.72
Total 5219.00
Table 4.32.1: Land use Pattern
Nizamabad CircleForest division wise results

104
Andhra Pradesh State of Forest - 2012
and Water Bodies 5.32 Km2. The distribution of the forest cover of the Divisionis shown in Fig 4.32.1.
4.32.6 Change in Forest Cover:
The Satellite images of 2009 and 2010 are shown in Figs. 4.32.2 & Fig 4.32.3
respectively and the changes between this period are shown on the image of2010.
Comparison of the current forest cover with that of previous assessment
year shows a negative change in forest cover of 113.05 Ha. The forest coverchange matrix given in Table 4.32.2 reveals that there is a decrease of 60.33 Ha of moderately dense forest, 52.72 Ha of
open forest.
The entire negative change (including scrub) of 119.17 Ha, is on account of encroachments, which is a loss of forestcover. Therefore, the net loss of forest cover in this Division is 119.17 Ha.
Fig 4.32.1
Fig 4.32.3Fig 4.32.2
There are 55 Beats in the Division. Negative changes in forest cover are noticed in 13 Beats. There are no changesin the remaining 42 Beats.
Details of forest cover changes in these 13 Beats are shown in Table 4.32.3
VDF MDF OF Scrub NF WB
Very Dense Forest 0.00 0.00 0.00 0.00 0.00 0.00 0.00
Moderately Dense Forest 0.00 309.20 0.00 0.32 0.28 0.00 309.80
Open Forest 0.00 0.00 310.12 0.09 0.44 0.00 310.65
Scrub 0.00 0.00 0.00 79.96 0.06 0.00 80.02
Non-Forest 0.00 0.00 0.00 0.00 81.34 0.00 81.34
Water 0.00 0.00 0.00 0.00 0.00 5.32 5.32
Total of 2010 0.00 309.20 310.12 80.37 82.12 5.32 787.13
Net Change 0.00 -0.60 -0.53 0.35 0.78 0.00
2009Total of
2009
2010
Table 4.32.2: Forest Cover change matrix (Area in Km2)

105
Satellite Images
2009 2010
BANSWADA RANGE
Chandur 0.00 294.24 478.27 103.90 153.14 0.01 1029.56 -7.67 7.67
Medpally(n) 0.00 544.02 231.66 61.09 57.76 0.70 895.23 -2.31 2.31
Total 0.00 838.26 709.93 164.99 210.90 0.71 1924.79 -9.98 9.98
KAMMARPALLI RANGE
Bheemgal 0.00 962.16 864.44 328.60 238.94 13.67 2407.81 -1.47 1.47
Bheemnagar 0.00 1363.60 490.97 101.42 205.03 20.92 2181.94 -11.15 11.15
Karepally 0.00 991.43 369.00 121.59 113.06 7.62 1602.70 -28.68 28.68
Konapur (n) 0.00 1452.88 1339.56 70.17 39.28 34.07 2935.96 -4.52 4.52
Konapur (s) 0.00 1202.23 1031.82 83.49 109.34 9.39 2436.27 -3.76 3.76
Konasamundar 0.00 506.27 609.42 193.98 119.18 56.46 1485.31 -4.33 4.33
Mendora 0.00 418.99 229.55 61.50 102.50 -0.01 812.53 -3.07 3.07
Tadlapally 0.00 1332.13 408.43 92.03 195.80 -0.01 2028.38 -37.82 37.82
Tatpally 0.00 1455.64 632.93 106.01 33.89 0.00 2228.47 -1.40 1.40
Total 0.00 9685.33 5976.12 1158.79 1157.02 142.11 18119.37 -96.20 96.20
NIZAMABAD RANGE
Mudakpally 0.00 780.54 487.16 34.77 48.32 0.00 1350.79 -11.20 11.20
Thanakalan 0.00 316.35 1194.53 340.15 125.30 30.04 2006.37 -1.79 1.79
Total 0.00 1096.89 1681.69 374.92 173.62 30.04 3357.16 -12.99 12.99
Grand Total 0.00 11620.48 8367.74 1698.70 1541.54 172.86 23401.32 -119.17 119.17
Table 4.32.3: List of Beats with negative change in Forest Cover (Area in Ha)
BeatEncroach
mentsVDF MDF OF Scrub NF WB Total
Net
Change
Longitude 78.585780 E
Latitude 18.622960 N
Area in Ha 8.34
Change MDF to NF
Compt No 47
Beat Tadlapally
Range Kammarpalli
Division Nizamabad
Forest division wise results

106
Andhra Pradesh State of Forest - 2012
4.33 ELURU DIVISION
4.33.1 Introduction:
Eluru Forest Division lies in the north-eastern part of Andhra Pradesh between latitude160 18’ 05’’ and 170 28’ 52’’N
and longitude 800 52’ 04’’and 810 51’ 31’’. Geographical area of the Division (and the District) is 7742 km2. The Division has
two physiographic zones, the Plains and Hills. The climate of Eluru Division is characterized by high humidity nearly all
the year round with oppressive summer and good seasonal rainfall. The major rivers falling in the Division are Godavari,
Gauthami and Vasita.
Land use pattern of the Division is given in Table 4.33.1
Deccan traps, Alluvial deposits, lower or upper Gondwana sediments, Khondalites and Charcolites occupy the
district. Loamy soils, Lateritic and Black cotton soils are
found in the District. Temperature ranges from 170C to
450C and the annual rainfall is about 1076mm. South-West
monsoon gives more rain than North-East monsoon.
The population of the Division (District) is 3.93
million (2011 census), per capita forest is 0.02 Ha and the
population density is 508 per Km2.
4.33.2 Recorded Forest Area:
The notified forest area of the Division is 773.03
Km2 which is 10% of the geographical area. Reserved
and Protected forests constitute 732.11 Km2 (95%) and
Km2 40.9(5%) of the forest area respectively.
As per the Champion and Seth’s classification forest types found in the Division are Tropical Moist Mixed Deciduous
Forests, Tropical Dry Deciduous Scrub Forests and Tropical Dry Evergreen Scrub Forests.
4.33.3 Protected Area:
Two Protected Areas, viz., Kolleru and Papikonda Wildlife Sanctuaries fall partly in this Division. An area of 308.55
Km2 is included in the Kolleru WLS which is the largest fresh water lake in the Country and also a Ramsar site. Papikonda
WLS occupies 591 Km2 of the forest area of the Division.
4.33.4 Community Forest Management:
There are 213 VSSs in the Division. An area of 414.54 Km2 of
forests, which constitutes 53% of forest area, is under the
management of VSSs.
4.33.5 Forest Cover:
The forest cover in the Division based on the interpretation
of IRS P6 LISS III 2010 data (Dec 2010 - Jan 2011) is 668.70 Km2
which is 8.6% of the geographical area. In terms of the forest canopy
Land use Area in SqKm Percentage
Forest including Scrub 739.36 9.55
Agriculture 5591.9 72.23
Land with Scrub 58.92 0.75
Fallow Lands 40.77 0.53
Grasslands 0.00 0.00
Settlements 143.74 1.86
Vegetation outside forest 417.04 5.39
Water Bodies 750.27 9.69
Total 7742.00
Table 4.33.1: Land use Pattern
Fig 4. 33.1
Rajahmundry Circle

107
cover density classes the Division has 512.15 Km2 of Moderately Dense Forests and 156.55 Km2 of Open Forests. The
area of the Scrub is 53.41 Km2, Non-Forest 50.32 Km2 and Water Bodies 0.59 Km2. The distribution of the forest cover of
the Division is shown in Fig 4.33.1.
4.33.6 Change in Forest Cover:
The satellite images of 2009 and 2010 are shown in Figs 4.33.2 & 4.33.3 respectively and the changes between this
period are shown on the image of 2010.
Comparison of the current forest cover with that of previous assessment year shows a negative change of 535.2 Haand positive change of 298.79 Ha. The forest cover change matrix given in Table 4.33.2 reveals that there is a decrease of
236.41 Ha in open forest.
The positive change (including scrub) of 298.79 Ha is on account of growth in raised plantations. The negative
change (including scrub) of 338.57 Ha is on account of clearance of jungle growth for raising of plantations, 16.25 Ha is
on account of harvesting of matured plantations and 180.38 Ha is on account of encroachments. As harvesting ofplantations and clearance of jungle growth for raising of plantations are forest management interventions and hence
cannot be considered as loss of forest cover. Hence the negative change due to encroachment alone is taken as negative
change. Therefore the net loss of forest cover is 180.38 Ha.
There are 43 Beats in the Division. Negative changes in forest cover are seen in 10 Beats and positive change in 5Beats. Both positive and negative changes are seen in 4 Beats. There is no change in the remaining 27 Beats.
Details of forest cover changes in these 11 Beats is shown in Table 4.33.3.
Fig 4. 33.3Fig 4. 33.2
Forest division wise results

108
Andhra Pradesh State of Forest - 2012
VDF MDF OF Scrub NF WB
Very Dense Forest 0.00 0.00 0.00 0.00 0.00 0.00 0.00
Moderately Dense Forest 0.00 512.15 0.00 0.00 0.00 0.00 512.15
Open Forest 0.00 0.00 153.56 0.62 4.73 0.00 158.91
Scrub 0.00 0.00 0.53 52.79 0.00 0.00 53.32
Non-Forest 0.00 0.00 2.46 0.00 45.59 0.00 48.05
Water 0.00 0.00 0.00 0.00 0.00 0.59 0.59
Total of 2010 0.00 512.15 156.55 53.41 50.32 0.59 773.02
Net Change 0.00 0.00 -2.36 0.09 2.27 0.00
2009Total of
2009
2010
Table 4.33.2: Forest Cover change matrix (Area in Km2)
ELURU RANGE
Bhogole 0.00 332.9 570.96 516.63 214.68 0.00 1635.17 -35.83 35.83
Chintalapudi 0.00 1374.72 773.87 61.90 85.98 0.00 2296.47 -32.31 0.00
M.V.Gudem 0.00 1116.05 777.60 343.17 269.83 0.00 2506.65 -98.78 0.00
Thadikelapudi 0.00 47.31 857.96 388.24 238.40 0.00 1531.91 45.78 0.00
Velagalapalli 0.00 38.12 550.11 319.26 1099.91 3.36 2010.76 -76.38 0.00
Yerraguntapalli 0.00 376.48 559.55 95.16 209.75 0.00 1240.94 129.17 0.00
Total 0.00 3285.58 4090.05 1724.36 2118.55 3.36 11221.9 -68.35 35.83
JANGAREDDIGUDEM RANGE
Darbhagudem 0.00 12.85 703.62 409.74 202.42 0.00 1328.63 -30.58 0.00
Gullapudi 0.00 3918.14 262.00 5.20 10.28 2.37 4197.99 -0.75 0.75
Jeelugumilli 0.00 256.18 806.85 387.05 56.96 0.00 1507.04 34.26 0.00
Marlagudem 0.00 122.90 487.54 25.93 187.95 0.00 824.32 -64.81 52.47
Mulagalampalli 0.00 577.34 773.31 420.25 756.14 0.00 2527.04 -106.18 91.33
Total 0.00 4887.41 3033.32 1248.17 1213.75 2.37 10385 -168.06 144.55
Grand Total 0.00 8172.99 7123.37 2972.53 3332.3 5.73 21606.9 -236.41 180.38
Table 4.33.3: List of Beats with negative change in Forest Cover (Area in Ha)
BeatEncroach
mentsVDF MDF OF Scrub NF WB Total
Net
Change
Adopt at all levels sustainable development plans and regulations that make environmental conservation and rehabilitation integral toall development initiatives. - Earth charter & Gandhi page 21

109
4.34 KAKINADA DIVISION
4.34.1 Introduction:
Kakinada Forest Division comprises of the entire district of East Godavari and lies in the north eastern part of
Andhra Pradesh between latitudes160 18’ 04’’ and 180 00’ 54’’N and longitude 810 30’ 08’’ and 820 36’ 17’’ E. Geographical
area of the Division is 10807 Km2. The Division can be broadly classified into 3 natural regions namely the Delta, Upland
and Agency or hill tracts. The general elevation of the district varies from a few meters near the sea-coast to about 300 M
above MSL in the hills of the agency. The Eastern Ghats rise by gradations from the level of the coast and spread
throughout the erstwhile agency Taluks of Rampachodavaram and Yellavaram. The delta portion constituting the whole
of Konaseema and portions of erstwhile Taluks of Kakinada, Ramachandrapuram and Rajahmundry, presents a vast
expanse of rice-fields surrounded by plantains, betel, coconut gardens and innumerable palmyrahs. The erstwhile Taluks
of Tuni, Pithapuram, Peddapuram and portions of Kakinada, Ramachandrapuram and Rajahmundry constitute the upland
areas. The main soils in the district are alluvial (clay loamy), red soil, sandy loam and sandy clay. There is mostly alluvial
soil in Godavari delta and sandy clay soil at the tail end portions of river Godavari, red loamy soil in upland and agency
area of the district. The major rivers falling in the Division are Godavari, Pampa and Yeleru.
Land use pattern of the Division is given in Table 4.34.1.
The region mostly has a tropical climate like the rest
of the Coastal Andhra region. The summers (March-June)
are very hot and humid. The rainy season (July-Jan) is the
best time to visit this place with the fields brilliantly green
with paddy crops, rivulets flowing with water and the sun
shining brightly but not burning as it does in the summer.
Temperatures ranging from 100C to 480C and the annual
rainfall are about 1280 mm.
Population of the Division is 5.15 million (2011
Census), per capita forest is 0.06 Ha and the population
density is 477 persons per Km2.
4.34.2 Recorded Forest Area:
The notified forest area of the Division is 3235.39 Km2 which is 32.71% of the geographical area. Reserved and
Protected Forests constitute 2701.31Km2 (83.3%) and 531.13 Km2 (22.7%) of the forest area respectively.
As per Champion and Seth’s classification the forest types found in the Division are Tropical Moist Mixed Deciduous
Forests and Tropical Dry Deciduous Scrub Forests.
4.34.3 Protected Area:
The Division has Coringa Wildlife Sanctuary- the largest surviving patch of Mangrove forests in the State with
more than 65 Mangrove tree species and a home for the rare and endangered Smooth Indian Otter, Fishing Cat andEstuarine Crocodile; and a part of Papikonda Wildlife Sanctuary in its fold.Out of the 3235.39 Km2 of forest area the
Coringa WLS occupies an area of 235.7 Km2 of area and Papikonda WLS 591 Km2.
4.34.4 Community Forest Management:
There are 529 Vana Samrakshana Samities (VSSs) in the Division with an area of 1148.05 Km2 of forests, which is35.4% of the forest area.
Land use Area in SqKm Percentage
Forest including Scrub 2971.09 27.49
Agriculture 5574.51 51.58
Land with Scrub 331.78 3.07
Fallow Lands 224.00 2.07
Grasslands 22.00 0.2
Settlements 130.19 1.2
Vegetation outside Forest 1149.41 10.64
Water Bodies 404.02 3.75
Total 10807.00
Table 4.34.1: Land use Pattern
Rajahmundry CircleForest division wise results

110
Andhra Pradesh State of Forest - 2012
4.34.5 Forest Cover:
The forest cover in the Division based on the interpretation
of IRS P6 LISS III 2010 data (Data of Jan 2011) is 2778.66 Km2
which is 25.71% of the geographical area. In terms of the forestcanopy density classes the Division has 203.04 Km2 of Very Dense
Forests, 2355.89 Km2 of Moderately Dense forests and 220.21 Km2
of Open Forests. The area of the Scrub is 185.66 Km2,that of Non-Forest 101.53 Km2 and Water Bodies 169.06 Km2. The distribution
of the forest cover of the Division is shown in Fig 4.34.1.
4.34.6 Change in Forest Cover:
The satellite images of 2009 and 2010 seasons are shown in Fig 4.34.2 and Fig 4.34.3 respectively and the changes
between this period are shown on the image of 2010.
Comparison of the current forest cover with that of previous assessment year shows a negative change in forest
cover of 96.68 Ha and a positive change of 24.34 Ha. The forest cover change matrix given in Table 4.34.2 reveals that
there is a decrease of 7.26 Ha of Moderately dense forest, 58.50 Ha of Open forest and 30.92 Ha of scrub.
The positive change of 24.34 Ha is on account of growth in plantations raised. The negative change (including
Scrub) of 60.94 Ha is on account of clearance of growth for raising of plantations and 35.74 Ha on account of encroachments.As raising of plantations is a forest management intervention the same is not considered as loss of forest cover. Thus the
negative change due to encroachments is taken as loss of forest cover. Therefore the net loss of forest cover is 35.74 Ha.
Fig 4.34.1
Fig 4.34.2 Fig 4.34.3
There are 99 Beats in the Division. Negative changes in forest cover are seen in 9 Beats and there are no changes in
the remaining 90 Beats.
Details of forest cover changes in the 9 Beats mentioned above are shown in Table 4.34.3.

111
Manage the use of renewable resources such as water, soil, forest products and marine life in ways that do not exceed rates ofregeneration and that protect the health of ecosystem.Earth charter & Gandhi. - Earth charter & Gandhi page 21
ADDATHIGALA RANGE
Perikivalasa 1254.3 4431.62 256.85 442.03 695.73 0.00 7080.53 -2.21 2.21
Total 3683.26 31412.8 2119.23 2134.68 1291.31 33.73 40675.01 -2.21 2.21
ELESWARAM RANGE
Lododdi 72.57 1964.59 149.79 126.31 69.11 0.00 2382.37 -9.75 0.00
Total 608.12 24579.3 2739.72 1937.11 576.06 39.51 30479.79 -9.75 0.00
KAKINADA RANGE
Murari 24.25 525.24 6.11 9.15 42.23 0.00 606.98 -8.43 8.43
Total 1198.48 9503.97 1600.66 1115.64 1373.21 1390.8 16182.76 -8.43 8.43
RAMPACHODAVARAM RANGE
Akumamidikota 1869.97 9435.74 462.93 437.1 501.46 7.04 12714.24 -1.83 1.83
Devarapalli 811.98 6093.03 513.85 540.45 112.22 0.00 8071.53 -11.24 11.24
Kakuru 1061.92 8335.33 180.42 162.4 52.24 111.06 9903.37 -6.51 6.51
Total 11300.7 96004.1 5965.12 6439.18 3025.69 2007.5 124742.33 -19.58 19.58
SUDIKONDA RANGE
D.Velamalakota 827.97 6196.58 612.29 1056.37 292.81 5.3 8991.32 -5.52 5.52
Mallavaram East 0.00 727.16 90.39 36.00 58.16 190.79 1102.5 -6.58 0.00
Sudikonda South 0.61 453.02 77.47 54.38 25.55 0.00 611.03 -20.27 0.00
Total 1304.45 24691.3 2881.65 2859.09 1467.94 1221.09 34425.49 -32.37 5.52
Grand Total 20305.1 235600 22026.2 18564.2 10138.3 16905.96 323539.57 -72.34 35.74
Table 4.34.3: List of Beats with negative change in Forest Cover (Area in Ha)
BeatEncroach
mentsVDF MDF OF Scrub NF WB Total
Net
Change
Forest division wise results
VDF MDF OF Scrub NF WB
Very Dense Forest 203.04 0.00 0.00 0.00 0.00 0.00 203.04
Moderately Dense Forest 0.00 2355.98 0.00 0.00 0.07 0.00 2356.05
Open Forest 0.00 0.00 219.89 0.00 0.82 0.00 220.71
Scrub 0.00 0.00 0.24 185.66 0.07 0.00 185.97
Non-Forest 0.00 0.00 0.00 0.00 100.56 0.00 100.56
Water 0.00 0.00 0.00 0.00 0.00 169.06 169.06
Total of 2010 203.04 2355.98 220.13 185.66 101.52 169.06 3235.39
Net Change 0.00 -0.07 -0.58 -0.31 0.96 0.00
2009Total of
2009
2010
Table 4.34.2: Forest Cover change matrix (Area in Km2)

112
Andhra Pradesh State of Forest - 2012
4.35 KRISHNA DIVISION
4.35.1 Introduction:
Krishna Forest Division comprises of the entire Krishna district lies in the north eastern part of Andhra Pradesh
between latitudes 150 42’ 19’’ and 170 9’ 10’’ N and longitudes 800 00’07’’ and 810 33’ 13’’E. Geographical area of the Division
is 8,727 Km2. The Division has 2 physiographic zones- the plains and the hills. The major rivers falling in the division are
Krishna, Keesara, Tammileru and Budameru.
Land use pattern of the Division is given in Table 4.35.1
The temperature varies from170 C in December to 450 C
in the summer and the average annual rainfall is 1028 mm.
Deccan traps, alluvial deposits, lower or upper
Gondwana sediments, khondalites and chalcolites occupy
the districts. Soils found in the Division are loamy, lateritic
and black cotton.
Population of the Division is 4.52 million (2011 Census),
per capita forest is 0.01 Ha and the population density is
519 per Km2.
4.35.2 Recorded Forest Area:
The notified forest area of the Division is 644.52 Km2,
which is 7.3% of the geographical area. Reserved and Protected Forests constitute an area of 417.44 Km2 (65%) and 227.07
Km2 (35%) of the forest area respectively.
As per Champion and Seth’s classification the forests of this Division can be classified as Dry Deciduous Scrub
Forests, Tropical Thorn Forest, Tropical Evergreen Scrub Forest and Tropical Tidal Swamp Mangrove Forests.
4.35.3 Protected Area:
Two Protected Areas, viz., Kolleru and Krishna Wildlife Sanctuaries fall in the Division. An area of 308.55 Km2 of
forest area of this Division forms a part of Kolleru WLS and 194.81 Km2 of Krishna WLS.
4.35.4 Community Forest Management:
There are 68 Vana Samrakshana Samithies (VSSs) in the
Division. An area of 624.80 Km2 forests, which constitutes 96.8% of
forest area, is under the management of VSSs.
4.35.5 Forest Cover:
The forest cover in the Division based on the interpretation of
IRS P6 LISS III 2010 data (Dec 2010 - Jan 2011) is 287.33 Km2 which
is 3.29% of the geographical area. In terms of the forest canopy
density classes the Division has 1.74 Km2 of Moderately Dense
Forests and 285.59 Km2 of Open Forests. The area of the Scrub is
Land use Area in SqKm Percentage
Forest including Scrub 504.73 5.78
Agriculture 6089.71 69.78
Land with Scrub 137.42 1.57
Fallow Lands 528.28 6.05
Grasslands 0.00 0.00
Settlements 252.16 2.89
Vegetation outside Forest 386.23 4.43
Water Bodies 828.47 9.50
Total 8727.00
Table 4.35.1: Land use Pattern
Fig 4.35.1
Rajahmundry Circle

113
210.61 Km2, that of Non-Forest 73.12 Km2 and Water Bodies 73.46 Km2. The distribution of the forest cover of the Division
is shown in Fig 4.35.1
4.35.6 Change in Forest Cover:
The satellite images of 2009 and 2010 seasons are shown in Figs 4.35.2 & 4.35.3 respectively and the changesbetween this period are shown on the image of 2010.
Comparison of the current forest cover with that of previous assessment year shows a negative change of 41.96 Ha.The forest cover change matrix of given in Table 4.35.2 reveals that there is a decrease of 41.96 Ha of open forest and 4.30
Ha of scrub.
A negative change (including scrub) of 27.66 Ha is on account of clearence of jungle growth for raising of
plantations and 18.6 Ha on account of encroachments. As clearence of growth for raising of plantations is a forest
management intervention the same is not considered as loss of forest cover. Thus the negative change due to encroachmentsalone is taken as loss of forest cover. Therefore the net loss of forest cover is 18.6 Ha .
There are 34 Beats in the Division. Negative changes in forest cover are noticed in 5 Beats. There are no changes inthe remaining 29 Beats.
Details of forest cover changes in these 5 Beats are shown in Table 4.35.3.
Fig 4.35.2 Fig 4.35.3
VDF MDF OF Scrub NF WB
Very Dense Forest 0.00 0.00 0.00 0.00 0.00 0.00 0.00
Moderately Dense Forest 0.00 1.74 0.00 0.00 0.00 0.00 1.74
Open Forest 0.00 0.00 285.51 0.00 0.42 0.00 285.93
Scrub 0.00 0.00 0.00 210.69 0.04 0.00 210.73
Non-Forest 0.00 0.00 0.00 0.00 72.66 0.00 72.66
Water 0.00 0.00 0.00 0.00 0.00 73.46 73.46
Total of 2010 0.00 1.74 285.51 210.69 73.12 73.46 644.52
Net Change 0.00 0.00 -0.42 -0.04 0.46 0.00
2009Total of
2009
2010
Table 4.35.2: Forest Cover change matrix (Area in Km2)
Forest division wise results

114
Andhra Pradesh State of Forest - 2012
ONIPENTA RANGE
Katrenupadu 0.00 72.67 412.36 848.73 373.23 0.00 1706.99 -34.83 7.17
Sunkollu 0.00 0.00 595.87 804.75 16.84 0.00 1417.46 -0.90 0.90
Total 0.00 72.67 1008.23 1653.48 390.07 0.00 3124.45 -35.73 8.07
VIJAYAWADA RANGE
Koduru 0.00 0.00 1083.26 577.13 24.97 0.00 1685.36 -2.69 2.69
Kothurutadepalli 0.00 35.08 1748.6 469.11 131.82 0.70 2385.31 -3.54 3.54
Metlapalli 0.00 0.00 46.55 404.8 5.72 0.00 457.07 -4.30 4.30
Total 0.00 35.08 2878.41 1451.04 162.51 0.70 4527.74 -10.53 10.53
Grand Total 0.00 107.75 3886.64 3104.52 552.58 0.70 7652.19 -46.26 18.60
Table 4.35.3: List of Beats with negative change in Forest Cover (Area in Ha)
BeatEncroach
mentsVDF MDF OF Scrub NF WB Total
Net
Change
114

115
4.36.1 Introduction:
Narsipatnam Forest Division lies in the north-eastern part of Andhra Pradesh between latitudes 170 27’ 33" and 180
07’ 02" N and longitudes 810 51’47" and 820 47’ 59" E. Geographical area of the Division is 3754.99 Km2 which is 30.95% ofthe geographical area of the district .The Division has two physiographic zones- the plains and the hills. Climate of theDivision is characterized by high humidity nearly all round the year with oppressive summer and good seasonal rainfall.The climate of the hill parts of the district is different from that of the plain. Altitude varies from 130 M to 1529 M aboveMSL. The major rivers falling in the Division are Sileru- a tributary of Godavari, Varaha and Thandava which drain in toBay of Bengal.
Land use pattern of the Division is given in Table 4.36.1.
The climate of the Division is characterized by three distinct seasons. i) Summer (ii) Rainy and (iii) Winter seasons.The temperature ranging from 50 C to 450 C and annualrainfall is about 712mm, received mainly from Southwestmonsoons.
The Divisions geology comprises of oldestformation of charnokite series and predominantkhondalite group of rocks of precambrian age. The rocksare essentially Khondalite group with a few charnokite,bands, granites, quartzites, calcigranulites andpegmatites. The chief mineral found is bauxite in all thehigh hills of the agency area; wherever grasslands exist.There are 3 soil types in the Division - sandy soils ofkhondalites and quartzites, clayey sands of charnokiteand granites and coastal sand dunes of quartzite.
Population of the Division is 0.51 million (2011Census), per capita forest is 0.46 Ha and the population density is 121 persons per Km2.
4.36.2 Recorded Forest Area.
The Notified forest area of the Division is 2353.72 Km2 which is 62.67% of the geographical area. Reserved,
Protected and Un-classed forests constitute 989.92 Km2 (42.12%), 1356.31 Km2 (57.71%) and 4.05 Km2 (0.17%) of the
forest area respectively.
As per Champion and Seth’s classification the Division has Tropical Semi Evergreen Forests, Tropical Secondary
Moist Mixed Deciduous Forests, Tropical Dry Deciduous Forests, Tropical Dry Evergreen Scrub, Tropical Thorn Forests
and Dry Savanna Forests.
4.36.3 Protected Area:
There is no Protected Area in this Division.
4.36.4 Community Forest Management:
There are 284 Vana Samrakshana Samities (VSSs) in the Division with an area of 231.13 Km2 of forests, whichconstitutes 9.8% of the forest area.
4.36 NARSIPATNAM DIVISION
Land use Area in SqKm Percentage
Forest including Scrub 2119.19 56.44
Agriculture 918.52 24.46
Land with Scrub 249.05 6.63
Fallow Lands 22.23 0.59
Grasslands 0.13 0
Settlements 8.5 0.23
Vegetation outside Forest 381.07 10.15
Water Bodies 56.3 1.5
Total 3755.00
Table 4.36.1: Land use Pattern
Vishakapatnam CircleForest division wise results

116
Andhra Pradesh State of Forest - 2012
VDF MDF OF Scrub NF WB
Very Dense Forest 32.80 0.00 0.00 0.00 0.00 0.00 32.80
Moderately Dense Forest 0.00 1084.21 0.00 0.00 0.00 0.00 1084.21
Open Forest 0.00 0.00 755.94 0.00 0.21 0.00 756.15
Scrub 0.00 0.00 0.00 244.93 0.00 0.00 244.93
Non-Forest 0.00 0.00 0.00 0.00 235.33 0.00 235.33
Water 0.00 0.00 0.00 0.00 0.00 0.33 0.33
Total of 2010 32.80 1084.21 755.94 244.93 235.54 0.33 2353.75
Net Change 0.00 0.00 -0.21 0.00 0.21 0.00
2009Total of
2009
2010
Table 4.36.2: Forest Cover change matrix (Area in Km2)
4.36.5 Forest Cover:The forest cover in the Division based on the interpretation
of IRS P6 LISS III 2010 (Data of Sep 2010-Jan 2011) is 1873.08Km2 which is 49.89 % of the geographical area. In terms of the
forest canopy density classes the Division has 32.80 Km2 of VeryDense Forests, 1084.21 Km2 of Moderately Dense Forests and
755.94 Km2 of Open Forests. The area of the Scrub is 244.93 Km2,
Non-Forest 235.54 Km2 and Water Bodies 0.33 Km2. The distributionof the forest cover of the Division is shown in Fig 4.36.1.
4.36.6 Change in Forest Cover:The satellite image of 2009 and 2010 seasons are shown in Figs. 4.36.2 and Fig 4.36.3 respectively and the changes
between this period are shown on the image of 2010.Comparison of the current forest cover with that of previous assessment year shows a negative change in forest
cover of 20.63 Ha. The forest cover change matrix given in Table 4.36.2 reveals that there is a decrease of 20.63 Ha of open
forest.The entire negative change of 20.63 Ha is on account of encroachments; which is taken as loss of forest cover.
Therefore the net loss of forest cover is 20.63 Ha.
Fig 4.36.1
There are 52 Beats in the Division. Negative changes in forest cover are noticed in 6 Beats. There are no changesin the remaining 46 Beats.
Details of forest cover changes in the 6 Beats mentioned above are shown in Table 4.36.3.
Fig 4.36.2 Fig 4.36.3

117
K.D. PETA RANGE
Koyyuru 51.79 3949.2 1645.73 374.62 387.08 0.00 6408.42 -1.99 1.99
Total 51.79 3949.2 1645.73 374.62 387.08 0.00 6408.42 -1.99 1.99
MARRIPAKALA RANGE
Palakajeedi 779.74 4722.36 935.45 248.8 189.08 0.00 6875.43 -3.24 3.24
Total 779.74 4722.36 935.45 248.8 189.08 0.00 6875.43 -3.24 3.24
NARSIPATNAM RANGE
Koduru 0.75 1296.72 1658.8 253.24 89.68 0.00 3299.19 -4.70 4.70
Total 0.75 1296.72 1658.8 253.24 89.68 0.00 3299.19 -4.70 4.70
R.V.NAGAR RANGE
Lankapakalu 97.67 4391.49 2082.79 537.54 516.06 0.00 7625.55 -5.38 5.38
Total 97.67 4391.49 2082.79 537.54 516.06 0.00 7625.55 -5.38 5.38
SILERU RANGE
Duppulawada 0.00 744.91 1072.85 609.09 687.65 0.00 3114.5 -3.92 3.92
Kondajartha 317.88 2655.76 550.32 121.72 254.44 0.00 3900.12 -1.40 1.40
Total 317.88 3400.67 1623.17 730.81 942.09 0.00 7014.62 -5.32 5.32
Grand Total 1247.83 17760.44 7945.94 2145.01 2123.99 0.00 31223.21 -20.63 20.63
Table 4.36.3: List of Beats with negative change in Forest Cover (Area in Ha)
BeatEncroach
mentsVDF MDF OF Scrub NF WB Total
Net
Change
Care for the community of life with understanding, compassion and love and accept that with the right to own, manage and use naturalresources comes the duty to prevent environmental harm and to protect the right of people. - Young India 6, Oct 1921, CWMG vol 21, 239
Forest division wise results

118
Andhra Pradesh State of Forests - 2012
4.37 PADERU DIVISION
4.37.1 Introduction:
Paderu Forest Division lies in the northern part of Vishakhapatnam district between latitudes 170 55’ 48’’ and 180 32’
59’’ N and longitudes 820 18’ 41’’ and 830 01’ 04’’ E. Geographical area of the Division is 2336 km2 which is 20.93 % of the
geographic area of district. The Division has two physiographic zones, the plains and the hills. The major river falling in
the Division is Machkund flowing to north.
Land use pattern of the division is given in Table 4.37.1.
The Divisions geology comprises of oldest formation of charnokite series and predominant khondalite group of
rocks of pre-cambrian age. The rocks are essentially Khondalite group with a few charnokite bands, granites, quartzites,
calcigranulites and pegmatites. The soil types found in the division are sandy soils of khondalites and quartzites, clayey
sands of charnokite and granites; black cotton soils come
up next having sizeable chunks of area in K. Kotapadu,
Devarapalli, Cheedikada, Paderu and Hukumpeta
Mandals.
The climate of Paderu Division is characterized by
high humidity throughout the year with oppressive
summer and good seasonal rainfall. The climate of the
hill parts of the Division is different from that of the plains.
Altitude varies from 90 M to 1500 M above MSL.
Temperature ranges from 100 C to 350C and the annual
rainfall is about 1320mm.
Population of the Division is 0.32 million (2011 Census) which is 9% of the total
population of the district, per capita forest is 0.32 Ha and the population density is 101 persons per Km2.
4.37.2 Recorded Forest Area:
The notified forest area of the Division is 1011.52 Km2 which is 43.3% of the geographical area. Reserved, Protected
and Un-classed forests constitute 719.52 Km2 (71.1%), 285.2 Km2 (28.2%) and 6.8 Km2 (0.006%) of the forest area
respectively.
As per Champion and Seth the forests of this Division fall into the following classes - Tropical Semi Evergreen
Forests, Tropical Moist Mixed Deciduous Forests, Tropical Dry Deciduous Forests, Tropical Dry Evergreen Scrub,
Tropical Thorn Forests and Dry Savanna Forests.
4.37.3 Protected Area:
There is no Protected Area in this Division.
4.37.4 Community Forest Management:
There are 303 VSSs in the Division with 270.90 Km2 of forest area, which constitutes 26.65 % of forest area.
4.37.5 Forest Cover:
The forest cover in the Division based on the interpretation of IRS P6 LISS III 2010 data (Oct2010-Mar2011) is
540.95 Km2 which is 23.15% of geographical area. In terms of forest canopy density classes the Division has 1.91 Km2
Land use Area in SqKm Percentage
Forest including Scrub 776.52 33.24
Agriculture 532.22 22.78
Land with Scrub 515.51 22.07
Fallow Lands 64.99 2.78
Grasslands 3.27 0.14
Settlements 2.03 0.09
Vegetation outside Forest 348.63 14.92
Water Bodies 93.04 3.98
Total 2336.20
Table 4.37.1: Land use Pattern
Vishakapatnam Circle

119
of Very Dense Forests, 140.21 Km2 of Moderately Dense Forests and 398.83
Km2 of Open Forests. The area of the Scrub is 234.67 Km2, Non-Forest
235.79 Km2 and Water Bodies 0.11 Km2. The distribution of the forest cover
of the Division is shown in Fig 4.37.1.
4.37.6 Change in Forest Cover:
The Satellite images of 2009 and 2010 seasons are shown in Figs.
4.37.2 and 4.37.3 respectively and the changes between this period areshown on the image of 2010.
Comparison of the current forest cover with that of previous assessment year shows a negative change in forestcover of 1.62 Ha and positive change of 14.80 Ha. The forest cover change matrix given in Table 4.37.2 reveals that there
is a decrease of 1.62 Ha of open forest and 10.32 Ha of scrub.
The positive change 14.80 Ha is on account of growth in raised plantations. The total negative change 26.74 Ha is
on account of encroachments, hence the same has been taken as loss of forest cover.
There are 20 Beats in the Division. Changes in forest cover are noticed in 5 Beats. Negative changes in forest coverare noticed in 3 Beats and poistive change in 1 Beat and both positive and negative change in 1 Beat. There are no
changes in remaining 15 Beats.
Details of forest cover changes in these 5 Beats are shown in Table 4.37.3.
Fig 4.37.1.
VDF MDF OF Scrub NF WB
Very Dense Forest 1.91 0.00 0.00 0.00 0.00 0.00 1.91
Moderately Dense Forest 0.00 140.21 0.00 0.00 0.00 0.00 140.21
Open Forest 0.00 0.00 398.83 0.00 0.02 0.00 398.85
Scrub 0.00 0.00 0.00 234.52 0.25 0.00 234.77
Non-Forest 0.00 0.00 0.00 0.15 235.52 0.00 235.67
Water 0.00 0.00 0.00 0.00 0.00 0.11 0.11
Total of 2010 1.91 140.21 398.83 234.67 235.79 0.11 1011.52
Net Change 0.00 0.00 -0.02 -0.10 0.12 0.00
2009Total of
2009
2010
Table 4.37.2: Forest Cover change matrix (Area in Km2)
Fig 4.37.2 Fig 4.37.3
Forest division wise results

120
Andhra Pradesh State of Forest - 2012
ARAKU RANGE
Araku 0.00 164.46 1149.11 1201.23 1190.86 0.00 3705.66 -10.36 10.36
Total 6.02 2004.53 8712.84 7368.2 6614.16 0.00 24705.8 -10.36 10.36
PADERU RANGE
G.Madugula 24.47 1742.56 4467.58 1537.9 741.09 0.00 8513.6 -6.69 6.69
Paderu 32.36 1458.35 4035.42 1564.67 581.55 0.00 7672.35 -1.62 1.62
Total 99.14 5431.14 17233.7 8274.48 5552.03 0.00 36590.4 -8.31 8.31
PEDABAYULU RANGE
Machipuram 45.4 2426.1 4075.07 1509.73 1670.99 11.23 9738.52 3.77 8.07
Sujanakota 0.00 783.58 1795.66 1020.42 917.14 0.00 4516.8 2.96 0.00
Total 85.73 6585.22 13936.4 7823.79 11413.6 11.23 39856 6.73 0.00
Grand Total 190.89 14020.9 39882.9 23466.5 23579.8 11.23 101152 -11.94 26.74
Table 4.37.3: List of Beats with negative change in Forest Cover (Area in Ha)
BeatEncroach
mentsVDF MDF OF Scrub NF WB Total
Net
Change
120

121
4.38 SRIKAKULAM DIVISION
4.38.1 Introduction:
Srikakulam Forest Division which is co-terminus with the district lies in the north-eastern part of Andhra
Pradesh between latitudes 170 45’’ and 190 30’’ N and longitudes 820 38’ and 840 45’ E. Geographical area of the Division
is 5953.52Km2. The Division has two physiographic zones, i.e., the hills and the plains which are known as agency andnon-agency areas respectively. The altitude varies from 91 M to 1524 M above MSL. The slope is north and northwest-
south and south-east. The Major Rivers are Nagavali and Vamshadhara.
Land use pattern of the Division is given in Table 4.38.1.
The climate of this Division is generally dry with temperatures ranging from 170 C to 370 C and the annual rainfall isabout 1225 mm, received mainly from south-west
monsoons.
Minerals like Manganese ore, Graphite, Lime stone,Iron ore & Mica occur in the Division. The soil types
found are sandy and clayey formed due to weathering of
underlying rocks- granite, gneisses and other allied rocks.
Population of the Division is 2.69 million (2011Census), per capita forest area is 0.03 Ha and the
population density is 462 persons per Km2.
4.38.2 Recorded Forest Area:
The total notified forest area of the Division is 721.72km2 which is 12.21 % of the geographical area. Reserved,
Protected and Un-classed forest constitute 422.45km2(61%), 242.79 km2 (35%) and 21.17 km2 (3%) of the total forest area
respectively.
As per Champion and Seth the forests of Division fall under Tropical Semi Evergreen, Tropical Moist Deciduous(Mixed, Sal, Hilly savanna), Dry Deciduous (mixed, thorn) and Tropical Dry Evergreen (Misc. forests) types.
4.38.3 Protected Area:
There is no Protected Area in this Division.
4.38.4 Community Forest Management:
There are 282 VSSs in the Division having an area of 290.20
Km2 of forests, which constitutes 40.21 % of forest area.
4.38.5 Forest Cover:
The forest cover in the Division based on the interpretation of
IRS P6 LISS III 2010 data (Nov 10-Jan 11) is 574.76 km2 which is10.36% of the geographical area. In terms of the forest canopy
density classes the Division has 134.62 Km2 of Moderately Dense
Land use Area in SqKm Percentage
Forest including Scrub 677.52 11.38
Agriculture 3561.68 59.83
Land with Scrub 541.12 9.09
Fallow Lands 60.72 1.02
Orchards 321.46 5.4
Settlements 31.55 0.53
Not available for cultivation 523.86 8.8
Water Bodies 235.14 3.95
Total 5953.50
Table 4.38.1: Land use Pattern
Fig 4.38.1
Vishakapatnam CircleForest division wise results

122
Andhra Pradesh State of Forest - 2012
Forests and 440.14 Km2 of Open Forests. The area of the Scrub is 102.11 Km2, Non-Forest 34.50 Km2 and Water Bodies10.35 Km2. The distribution of the forest cover of the Division is shown in Fig 4.38.1.
4.38.6 Change in Forest Cover:
The Satellite images of 2009 and 2010 seasons are shown in Figs. 4.38.2 and 4.38.3 respectively and the changes
between this period are shown on the image of 2010.
Comparison of the current forest cover with that of previous assessment year shows a negative change in forestcover of 16.37 Ha. The forest cover change matrix given in Table 4.38.2 reveals that there is a decrease of 16.37 Ha of open
forest.
The total negative change 16.37 Ha is on account of encroachments. Therefore the net loss of forest cover is 16.37Ha.
VDF MDF OF Scrub NF WB
Very Dense Forest 0.00 0.00 0.00 0.00 0.00 0.00 0.00
Moderately Dense Forest 0.00 134.62 0.00 0.00 0.00 0.00 134.62
Open Forest 0.00 0.00 440.14 0.10 0.07 0.00 440.31
Scrub 0.00 0.00 0.00 102.01 0.00 0.00 102.01
Non-Forest 0.00 0.00 0.00 0.00 34.43 0.00 34.43
Water 0.00 0.00 0.00 0.00 0.00 10.35 10.35
Total of 2010 0.00 134.62 440.14 102.11 34.50 10.35 721.72
Net Change 0.00 0.00 -0.17 0.10 0.07 0.00
2009Total of
2009
2010
Table 4.38.2: Forest Cover change matrix (Area in Km2)
There are 43 Beats in the Division. Negative changes in forest cover are noticed in 6 Beats. There are no changes in
the remaining 37 Beats.
Details of forest cover changes in the 6 Beats mentioned above are shown in Table 4.38.3.
Fig 4.38.2 Fig 4.38.3

123
KASIBUGGA RANGE
Bogabanda 0.00 48.63 646.76 99.21 0.59 0.00 795.19 -1.36 1.36
Budarsingi 0.00 40.72 888.86 290.92 27.26 0.00 1247.76 -2.82 2.82
Makarajola 0.00 149.88 1058.22 550.58 76.38 0.00 1835.06 -3.92 3.92
Mandasa 0.00 19.6 1427.05 309.32 17.74 0.00 1773.71 -3.60 3.60
Total 0.00 258.83 4020.89 1250.03 121.97 0.00 5651.72 -11.7 11.7
PATHAPATNAM RANGE
Antharaba 0.00 251.84 1724.37 246.94 18.79 0.00 2241.94 -2.20 2.20
Temburu 0.00 199.11 1981.08 333.22 27.1 0.00 2540.51 -2.47 2.47
Total 0.00 450.95 3705.45 580.16 45.89 0.00 4782.45 -4.67 4.67
Grand Total 0.00 709.78 7726.34 1830.19 167.86 0.00 10434.2 -16.37 16.37
Table 4.38.3: List of Beats with negative change in Forest Cover (Area in Ha)
BeatEncroach
mentsVDF MDF OF Scrub NF WB Total
Net
Change
123
Forest division wise results

124
Andhra Pradesh State of Forest - 2012
4.39.1 Introduction:
Vizianagaram Forest Division which is co-terminus with district lies in the north-eastern part of Andhra Pradesh
between latitudes 170 51’ and 190 9’’ N and longitude 820 58" and 830 49 E. Geographical Area of the Division is 6261
Km2.The Division has two physiographic zones, the plains and the hills. The major rivers in the district are Nagavali,Vegavathi, Gomuki and Suvarnamukhi.
Land use pattern of the division is given in Table 4.39.1.
The climate of this district is characterized by high humidity all round the year with oppressive summer and good
seasonal rainfall. The climate of the hill parts of the districtis different from that of the plains. The temperature varies
from 17.10 C to 39.60 C. The main soils in the district are
red, sandy loams and sandy clay.
The average annual rainfall of the Division is 1,131
mm. The Division gets the benefit of both the south-west
and north-east monsoon.
Population of the Division is 2.34 million as per 2011
census and the per capita forest is 0.05 Ha. The population
density is 358 persons per Km2.
4.39.2 Recorded Forest Area:
The area of notified forests of the Division is 1219.28Km2 which is 18.24% of the geographical area. Reserved, Protected and Un-classed forests constitute 716.27 Km2 (60%),
420.10 Km2 (35.2%) and 56.66 Km2 (0.047%) of the forest area respectively.
As per Champion and Seth’s classification the forests of the Division fall under Southern Tropical Moist Mixed
Deciduous Forests, Northern Tropical Dry Deciduous Forests, Southern Tropical Dry Mixed Deciduous Forests and
Tropical Dry Evergreen Forests.
4.39.3 Protected Area:
There is no Protected Area in this Division.
4.39.4 Community Forest Management:
There are 265 VSSs in the Division. An area of 305.59 Km2 of
forest area, which is 25% of the forest area is under the management
of communities.
4.39.5 Forest Cover:
The forest cover in the Division based on the interpretation
of IRS P6 LISS III 2010 data (Nov 10–Jan 11) is 1120.67 Km2 which
is 17.92% of the geographical area. In terms of the forest canopydensity classes the Division has 595.98 Km2 of Moderately Dense
4.39 VIZIANAGARAM DIVISION
Land use Area in SqKm Percentage
Forest including Scrub 1187.91 18.97
Agriculture 3244.78 51.82
Land with Scrub 777.07 12.41
Fallow Lands 23.79 0.38
Grasslands 0.63 0.01
Settlements 25.67 0.41
Not available for cultivation 869.74 13.89
Water Bodies 132.12 2.11
Total 6261.64
Table 4.39.1: Land use Pattern
Fig 4.39.1
Vishakapatnam Circle

125
Forests and 524.69 Km2 of Open Forests. The area of the Scrub is 62.85 Km2, Non-Forest 35.29 Km2 and Water Bodies 0.44Km2. The distribution of the forest cover of the Division is shown in Fig 4.39.1.
4.39.6 Change in Forest Cover:
The Satellite images of 2009 and 2010 seasons are shown in Figs. 4.39.2 and 4.39.3 respectively and the changes
between this period are shown on the image of 2010.
Comparison of the current forest cover with that of previous assessment year shows a negative change in forestcover of 85.24 Ha. The forest cover change matrix given in Table 4.39.2 reveals that there is a decrease of 78.49 Ha of
moderately dense forest and 6.75 Ha of open forest.
The total negative change of 85.24 Ha is on account of encroachments. Therefore the net loss of forest cover in theDivision is 85.24 Ha.
Fig.4.39.3Fig.4.39.2
There are 49 Beats in the Division. Negative changes in forest cover are noticed in 15 Beats. There are no changes
in remaining 34 Beats.
Details of forest cover change in these 15 Beats is shown in Tabel no. 4.39.3.
Forest division wise results
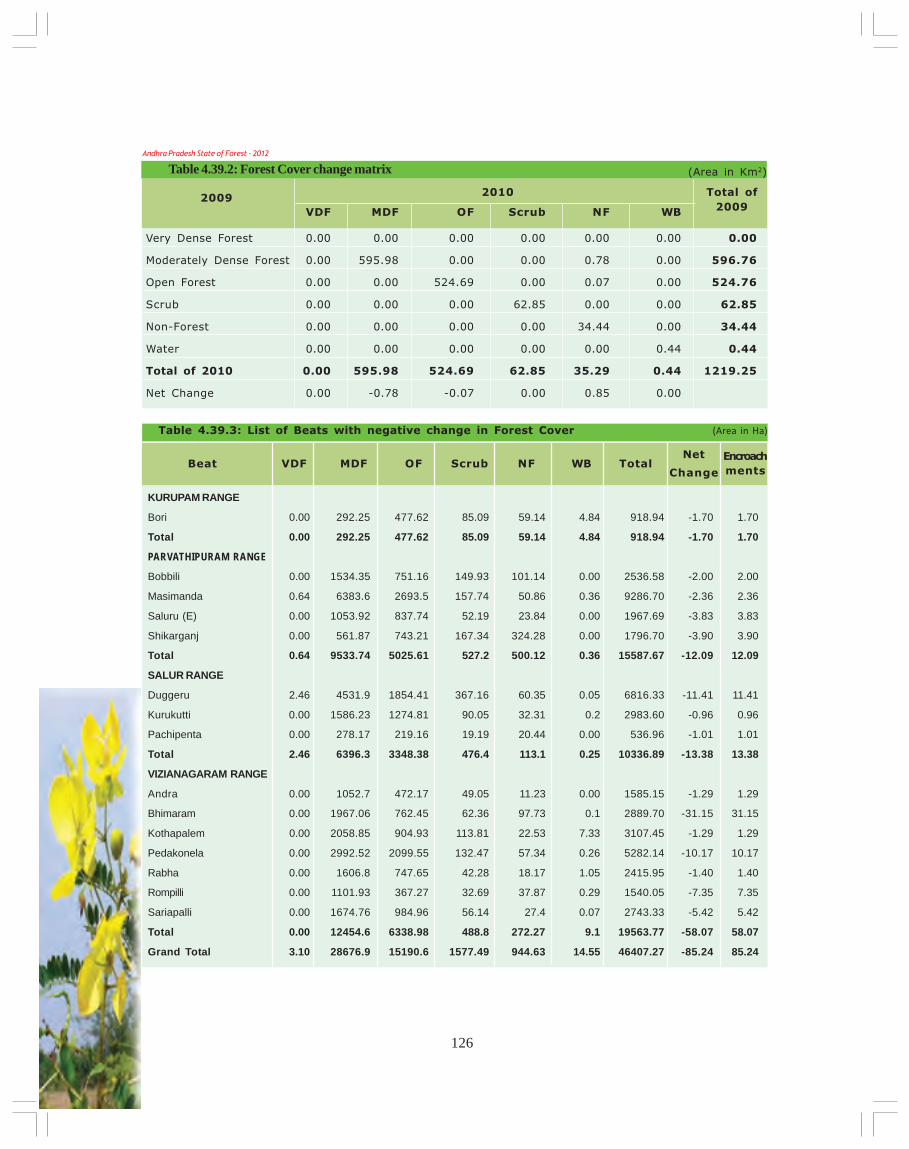
126
Andhra Pradesh State of Forest - 2012
VDF MDF OF Scrub NF WB
Very Dense Forest 0.00 0.00 0.00 0.00 0.00 0.00 0.00
Moderately Dense Forest 0.00 595.98 0.00 0.00 0.78 0.00 596.76
Open Forest 0.00 0.00 524.69 0.00 0.07 0.00 524.76
Scrub 0.00 0.00 0.00 62.85 0.00 0.00 62.85
Non-Forest 0.00 0.00 0.00 0.00 34.44 0.00 34.44
Water 0.00 0.00 0.00 0.00 0.00 0.44 0.44
Total of 2010 0.00 595.98 524.69 62.85 35.29 0.44 1219.25
Net Change 0.00 -0.78 -0.07 0.00 0.85 0.00
2009Total of
2009
2010
Table 4.39.2: Forest Cover change matrix (Area in Km2)
KURUPAM RANGE
Bori 0.00 292.25 477.62 85.09 59.14 4.84 918.94 -1.70 1.70
Total 0.00 292.25 477.62 85.09 59.14 4.84 918.94 -1.70 1.70
PARVATHIPURAM RANGE
Bobbili 0.00 1534.35 751.16 149.93 101.14 0.00 2536.58 -2.00 2.00
Masimanda 0.64 6383.6 2693.5 157.74 50.86 0.36 9286.70 -2.36 2.36
Saluru (E) 0.00 1053.92 837.74 52.19 23.84 0.00 1967.69 -3.83 3.83
Shikarganj 0.00 561.87 743.21 167.34 324.28 0.00 1796.70 -3.90 3.90
Total 0.64 9533.74 5025.61 527.2 500.12 0.36 15587.67 -12.09 12.09
SALUR RANGE
Duggeru 2.46 4531.9 1854.41 367.16 60.35 0.05 6816.33 -11.41 11.41
Kurukutti 0.00 1586.23 1274.81 90.05 32.31 0.2 2983.60 -0.96 0.96
Pachipenta 0.00 278.17 219.16 19.19 20.44 0.00 536.96 -1.01 1.01
Total 2.46 6396.3 3348.38 476.4 113.1 0.25 10336.89 -13.38 13.38
VIZIANAGARAM RANGE
Andra 0.00 1052.7 472.17 49.05 11.23 0.00 1585.15 -1.29 1.29
Bhimaram 0.00 1967.06 762.45 62.36 97.73 0.1 2889.70 -31.15 31.15
Kothapalem 0.00 2058.85 904.93 113.81 22.53 7.33 3107.45 -1.29 1.29
Pedakonela 0.00 2992.52 2099.55 132.47 57.34 0.26 5282.14 -10.17 10.17
Rabha 0.00 1606.8 747.65 42.28 18.17 1.05 2415.95 -1.40 1.40
Rompilli 0.00 1101.93 367.27 32.69 37.87 0.29 1540.05 -7.35 7.35
Sariapalli 0.00 1674.76 984.96 56.14 27.4 0.07 2743.33 -5.42 5.42
Total 0.00 12454.6 6338.98 488.8 272.27 9.1 19563.77 -58.07 58.07
Grand Total 3.10 28676.9 15190.6 1577.49 944.63 14.55 46407.27 -85.24 85.24
Table 4.39.3: List of Beats with negative change in Forest Cover (Area in Ha)
BeatEncroach
mentsVDF MDF OF Scrub NF WB Total
Net
Change

127
4.40 VISHAKHAPATNAM DIVISION
4.40.1 Introduction:
Vishakhapatnam Forest Division lies in the southern part of Vishakhapatnam district between latitudes 170 15’ 00’’and 180 26’ 25’’ N and longitudes 820 31’ 04’’ and 830 27’ 40’’ E. Geographical area of the Division is 5069 Km2 which is 45% of the geographical area of district. The Division has two physiographic zones, the plains and the hills. The majorrivers falling in the Division are Thadava, Varaha and Sharada.
Land use pattern of the division is given in Table 4.40.1.
There are 3 major soil types in the Division. These are sandy, clayey sands and coastal sand dunes.
The climate of Vishakhapatnam Division is characterized by high humidity nearly all through the year with oppressivesummer and good seasonal rainfall. The climate of the hillparts of the Division is different from that of the plains.Altitude varies from 90 M to 1500 M above MSL.Temperatures range from 180C to 450C and the annualrainfall is about 1202mm, received mainly from south-westand north-east monsoons.
Population of the Division is 3.45 million (2011Census) which is 79% of the population of the district.The per capita forest is 0.04 Ha and the population density
of the Division is 916 persons per Km2.
4.40.2 Recorded Forest Area:
The notified forest area of the Division is 1266.09Km2 which is 25% of the geographical area. Reserved, Protected and Un-classed forests constitute 586.6 Km2 (46%),
678.65 Km2 (53%) and 0.74 Km2 (0.06%) of the forest area respectively.
As per Champion and Seth’s classification the forest types in the Division are Southern Tropical Semi Evergreen
Forests, Southern Tropical Moist Mixed Deciduous Forests, Southern Tropical Dry Deciduous Forests, Tropical Dry
Evergreen Scrub, Tropical Thorn Forests and Dry Savanna Forest.
4.40.3 Protected Area:
There is one Protected Area, viz., Kambalakonda WLS in the Division having an area of 70.70 km2. This is large and
sprawling greenery around the Vizag City harbouring diverse flora & fauna.
4.40.4 Community Forest Management:
There are 321 Vana Samrakshana Samities (VSSs) in the Division. An area of 271.93 Km2 of notified forests, which is21 % of forest area, is under the management of VSSs.
4.40.5 Forest Cover:
The forest cover in the Division based on the interpretation of IRS P6 LISS III 2010 (Data of Jan 11) is 960.13 Km2
which is 18.93% of the geographical area. In terms of the forest canopy density classes the Division has 0.15 Km2 of VeryDense Forests, 432.24 Km2 of Moderately Dense Forests and 527.74 Km2 of Open Forests. The area of the scrub is 199.54
Land use Area in SqKm Percentage
Forest including Scrub 1162.63 22.93
Agriculture 2085.9 41.14
Land with Scrub 495.36 9.77
Fallow Lands 407.97 8.05
Grasslands 0.49 0.01
Settlements 78.09 1.54
Vegetation outside Forest 616.29 12.16
Water Bodies 223.05 4.4
Total 5069.80
Table 4.40.1: Land use Pattern
Vishakapatnam CircleForest division wise results

128
Andhra Pradesh State of Forest - 2012
Km2 , Non-Forest 105.16 Km2 and Water Bodies 1.23 Km2. Thedistribution of the forest cover of the Division is shown in Fig 4.40.1.
4.40.6 Change in Forest Cover:
The satellite image of 2009 and 2010 seasons are shown in
Figs. 4.40.2 and 4.40.3 respectively and the changes between thisperiod are shown on the image of 2010.
Comparison of the current forest cover with that of previous
assessment year shows a negative change in forest cover of 26.74Ha. The change matrix given in Table 4.40.2 reveals that there is a decrease of 10.57 Ha of moderately dense forest and
16.17 Ha of open forest.
A negative change of 24.27 Ha is on account of encroachments and 2.47 Ha on account of diversion of forestlandfor non-forestry purposes. Only the negative change due to encroachment is taken as loss of forest cover, therefore the
net loss of forest cover is 24.27 Ha.
Fig 4.40.1
There are 40 Beats in the Division. Negative changes in forest cover are seen in 8 Beats and there are no changes inthe remaining 32 Beats.
Details of forest cover changes in the 8 Beats are shown in Table 4.40.3.
VDF MDF OF Scrub NF WB
Very Dense Forest 0.15 0.00 0.00 0.00 0.00 0.00 0.15
Moderately Dense Forest 0.00 432.24 0.00 0.00 0.11 0.00 432.35
Open Forest 0.00 0.00 527.74 0.00 0.16 0.00 527.90
Scrub 0.00 0.00 0.00 199.54 0.00 0.00 199.54
Non-Forest 0.00 0.00 0.00 0.00 104.89 0.00 104.89
Water 0.00 0.00 0.00 0.00 0.00 1.23 1.23
Total of 2010 0.15 432.24 527.74 199.54 105.16 1.23 1266.06
Net Change 0.00 -0.11 -0.16 0.00 0.27 0.00
2009Total of
2009
2010
Table 4.40.2: Forest Cover change matrix (Area in Km2)
Fig 4.40.2 Fig 4.40.3

129
Table 4.40.3: List of Beats with negative change in Forest Cover (Area in Ha)
BeatEncroach
mentsVDF MDF OF Scrub NF WB Total
Net
Change
ANANTHAGIRI RANGE
Kuridi 0.00 1328.41 1670.85 271.89 162.42 0.00 3433.57 -8.06 8.06
Medaparthy 0.00 1793.08 3276.62 1093.16 521.85 0.00 6684.71 -6.78 6.78
Total 0.00 3121.49 4947.47 1365.05 684.27 0.00 10118.3 -14.84 14.84
CHODAVARAM RANGE
Kinthali 0.52 3276.89 2105.82 381.74 175.29 1.95 5942.21 -0.76 0.76
Konam 1.79 1696.39 3710.32 1250.41 439.01 0.00 7097.92 -1.29 1.29
Tattapudi 4.75 3114.83 3351.83 1948.12 1127.3 0.00 9546.83 -0.83 0.83
Total 7.06 8088.11 9167.97 3580.27 1741.6 1.95 22587 -2.88 2.88
VISHAKHAPATNAM RANGE
Advanipalem 0.00 93.97 727.35 548.99 353.95 0.00 1724.26 -2.06 2.06
Mudasarlova 0.00 1527.83 1791.95 569.55 254.42 0.00 4143.75 -4.49 4.49
Pothukonda 0.00 203.05 889.48 409.85 336.7 0.00 1839.08 -2.47 0.00
Total 0.00 1824.85 3408.78 1528.39 945.07 0.00 7707.09 -9.02 6.55
Grand total 7.06 13034.5 17524.2 6473.71 3370.94 1.95 40412.3 -26.74 24.27
Satellite Images
2009 2010
Ensure that the use of orbital and outer space supports environmental protection and space.-Earth charter & Gandhi page 61
Longitude 83.052190 E
Latitude 18.149750 N
Area in Ha 50.40
Change MDF to Scrub
Compt No 511
Beat Medaparthy
Range Ananthagiri
Division Visakhapatnam
Forest division wise results

130
Andhra Pradesh State of Forest - 2012
4.41 KARIM NAGAR EAST DIVISION
4.41.1 Introduction:
Karim Nagar East Forest Division lies in the eastern part of Karim Nagar district between latitudes 180 20’ 53’’ and 180
52’ 14’’ N and longitudes 790 10’ 48’’ and 800 20’ 44’’ E. Geographical area of the Division is 3,814 Km2 which is 32.25% ofthe geographical area of district. This Division lies on deccan plateau. The River Godavari forms the northern- andeastern boundaries of the Division as wells as the district. Godavari and Maneru are main rivers of Karimnagar EastDivision.
Land use pattern of the Division is given in Table 4.41.1.
The climate of this Division is generally dry with temperatures ranging from 200C to 440C and the annual rainfall isabout 756 mm, received mainly from Southwest monsoons.
The soil types found mainly are black cotton, sandyloam, alluvial and lateritic with less humus in top layer.
Population of the Division is 1.12 million (2011Census), per capita forest area is 0.12 Ha and thepopulation density is 542 persons per Km2.
4.41.2 Recorded Forest Area:
The notified forest area of the Division is 1432.1Km2 which is 37.55% of the geographical area. Reserved,Protected and un-classed forests constitute 1382.13 Km2
(96.51%), 27.43 Km2 (1.913%) and 22.54 Km2 (1.573%) ofthe forest area respectively.
As per Champion and Seth’s classification forests of Division fall under Tropical Dry Deciduous and TropicalThorn Forest types.
4.41.3 Protected Area:
A portion of the Shivaram Wildlife Sanctuary is included in this Division. An area of 19.15 Km2is included in theWLS.
4.41.4 Community Forest Management:
There are 127 Vana Samrakshana Samities (VSSs) in the Division spreadover an area of 314.05 Km2 of forest area, which is 21.93 % of the forest area.
4.41.5 Forest Cover:
The forest cover in the Division based the interpretation of IRS P6 LISS III
2010 data (Oct 2010-Dec 2010) is 1071.52 Km2 which is 28.09% of the
geographical area. In terms of the forest canopy density classes the Division
has 657.93 Km2 of Moderately Dense Forests and 413.59 Km2 of Open Forests.
The area of the Scrub is 258.72 Km2; Non-Forest 50.31 Km2 and Water Bodies
6.26 Km2.The distribution of the forest cover of the Division is shown in Fig 4.41.1.
Land use Area in SqKm Percentage
Forest including Scrub 1333.62 34.97
Agriculture 1292.93 33.90
Land with Scrub 314.00 8.23
Fallow Lands 217.32 5.70
Settlements 32.87 0.86
Vegetation outside Forest 548.56 14.38
Water Bodies 74.65 1.96
Total 3814.00
Table 4.41.1: Land use Pattern
Fig 4.41.1
Warangal Circle

131
4.41.6 Change in Forest Cover:
The Satellite images of 2009 and 2010 seasons are shown in Figs 4.41.2 and Fig 4.41.3 respectively and the changesbetween this period are shown on the image of 2010.
Comparison of the current forest cover with that of previous assessment year shows a positive change 10.48Ha and negative change of 4.71 Ha. The forest cover change matrix given in Table 4.41.2 reveals that there is a decrease
of 4.11 Ha of moderately dense forest, 66.65 Ha of scrub and increase of 9.88 Ha in Open Forest.
The positive change 10.48 Ha is on account of growth in raised plantations. The negative change (including
scrub) of 4.11 Ha is on account of clearance of jungle growth for raising of plantations, 0.60Ha on account of encroachments
and 66.65 Ha on account of diversion of forestlands for non-forestry purpose. As raising of plantation is a Forestmanagement intervention and hence not considered as loss of forest cover. Thus only the negative change due to
encroachment is taken as loss of forest cover. Therefore the net loss of forest cover is 0.60 Ha only.
There are 78 Beats in the Division. Negative changes in forest cover are noticed in 3 Beats only and positive change
in 1 Beat. There are no changes in the remaining 74 Beats.
Details of forest cover changes in 4 Beats mentioned above are shown in Table 4.41.3.
Fig.4.41.2 Fig.4.41.3
VDF MDF OF Scrub NF WB
Very Dense Forest 0.00 0.00 0.00 0.00 0.00 0.00 0.00
Moderately Dense Forest 0.00 657.93 0.00 0.00 0.04 0.00 657.97
Open Forest 0.00 0.00 413.49 0.00 0.01 0.00 413.50
Scrub 0.00 0.00 0.00 258.72 0.67 0.00 259.39
Non-Forest 0.00 0.00 0.10 0.00 49.59 0.00 49.69
Water 0.00 0.00 0.00 0.00 0.00 6.26 6.26
Total of 2010 0.00 657.93 413.59 258.72 50.31 6.26 1386.81
Net Change 0.00 -0.04 0.09 -0.67 0.62 0.00
2009Total of
2009
2010
Table 4.41.2: Forest Cover change matrix (Area in Km2)
Forest division wise results

132
Andhra Pradesh State of Forest - 2012
MAHADEVPUR RANGE
Annaram 0.00 620.48 480.35 480.12 35.03 1.26 1617.24 10.48 0.00
Total 0.00 620.48 480.35 480.12 35.03 1.26 1617.24 10.48 0.00
MANTHANI RANGE
Gunjapadugu 0.00 0.00 1.62 116.52 322.81 112.21 553.16 -66.65 0.00
Khammampally 0.00 366.60 784.44 465.95 28.36 0.00 1645.35 -0.60 0.60
Maidambanda 0.00 677.03 272.84 88.42 14.13 11.69 1064.11 -4.11 0.00
Total 0.00 1043.63 1058.90 670.89 365.30 123.90 3262.62 -71.36 0.60
Grand Total 0.00 1664.11 1539.25 1151.01 400.33 125.16 4879.86 -60.88 0.60
Table 4.41.3: List of Beats with negative change in Forest Cover (Area in Ha)
BeatEncroach
mentsVDF MDF OF Scrub NF WB Total
Net
Change
Satellite Images
2009 2010
Mange the extraction and use of non- renewable resources such as minerals and fossil fuels in ways that minimize depletion andcause no serious environmental damage. - Earth charter & Gandhi page 21
Longitude 79.626520 E
Latitude 18.55120 N
Area in Ha 4.11
Change MDF to NF
Compt No 461
Beat Maidambanda
Range Begampet
Division Karimnagar East

133
4.42 KARIM NAGAR WEST DIVISION
4.42.1 Introduction:
Karim Nagar West Forest Division lies in the western part of Karim Nagar district between latitudes 170 58’ 58’’ and
190 4’ 37’’N and longitudes 780 30’ 56’’ and 790 36’ 54’’E. Geographical area of the Division is 8,009 Km2 which is 77.75% of
the geographical area of district. This Division lies on deccan plateau. The River Godavari forms northern boundary of
the Division. Godavari and Maneru are main rivers of Karimnagar West Division.
Land use pattern of the Division is given in Table 4.42.1.
The climate of this Division is generally dry with
temperatures ranging from 200C to 440C and the annual
rainfall is about 756 mm, received mainly from south-west
monsoons.
The soil types found in the Division are mainly
clayey loam, sandy loam and red chalkas interspersed
with black cotton soils.
Population of the Division is 2.69 million (2011
Census), per capita forest area is 0.04 Ha and the
population density is 276 persons per Km2.
4.42.2 Recorded Forest Area:
The notified forest area of the Division is 1044.71 Km2 which is 13.04% of the geographical area. Reserved,
Protected and Un-classed forests constitute 864.29 Km2 (82.73%), 168.72 Km2 (16.15%) and 11.70 Km2 (1.12%) of the forestarea respectively.
As per Champion and Seth’s classification the forests of Division fall under Tropical Dry Deciduous and Tropical
Thorn Forest types.
4.42.3 Protected Area:
There are no Protected Areas in the Division.
4.42.4 Community Forest Management:
There are 236 Vana Samrakshana Samities (VSSs) or JFPCs in the
Division. An area of 554.499 Km2 forests, which is 44.4 % of forest area, isunder the management of VSSs.
4.42.5 Forest Cover:
The forest cover in the Division based on the interpretation of IRS P6
LISS III 2010 data (Oct/Dec 2010) is 839.00 Km2 which is 10.48% of thegeographical area. In terms of the forest canopy density classes, the Division
has 501.42 Km2 of Moderately Dense Forests and 336.27 Km2 of Open Forests.
Land use Area in SqKm Percentage
Forest including Scrub 959.19 11.98
Agriculture 5315.40 66.37
Land with Scrub 705.84 8.81
Fallow Lands 246.07 3.07
Settlements 123.64 1.54
Vegetation outside Forest 426.79 5.33
Water Bodies 232.06 2.90
Total 8009.00
Table 4.42.1: Land use Pattern
Fig 4. 42.1
Warangal CircleForest division wise results
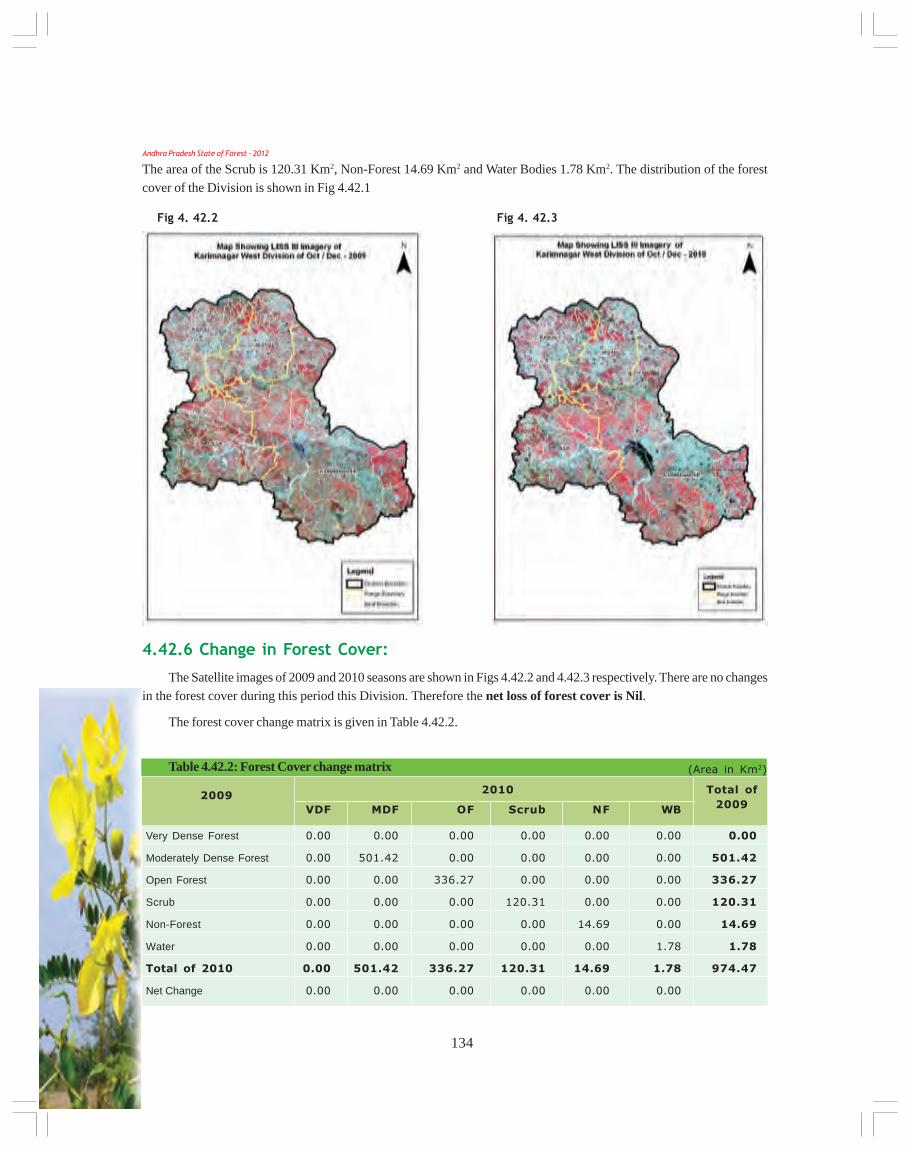
134
Andhra Pradesh State of Forest - 2012
The area of the Scrub is 120.31 Km2, Non-Forest 14.69 Km2 and Water Bodies 1.78 Km2. The distribution of the forestcover of the Division is shown in Fig 4.42.1
Fig 4. 42.2 Fig 4. 42.3
4.42.6 Change in Forest Cover:
The Satellite images of 2009 and 2010 seasons are shown in Figs 4.42.2 and 4.42.3 respectively. There are no changesin the forest cover during this period this Division. Therefore the net loss of forest cover is Nil.
The forest cover change matrix is given in Table 4.42.2.
VDF MDF OF Scrub NF WB
Very Dense Forest 0.00 0.00 0.00 0.00 0.00 0.00 0.00
Moderately Dense Forest 0.00 501.42 0.00 0.00 0.00 0.00 501.42
Open Forest 0.00 0.00 336.27 0.00 0.00 0.00 336.27
Scrub 0.00 0.00 0.00 120.31 0.00 0.00 120.31
Non-Forest 0.00 0.00 0.00 0.00 14.69 0.00 14.69
Water 0.00 0.00 0.00 0.00 0.00 1.78 1.78
Total of 2010 0.00 501.42 336.27 120.31 14.69 1.78 974.47
Net Change 0.00 0.00 0.00 0.00 0.00 0.00
2009Total of
2009
2010
Table 4.42.2: Forest Cover change matrix (Area in Km2)

135
4.43 WARANGAL NORTH DIVISION
4.43.1 Introduction:
Warangal North Forest Division lies in the north-western part of Warangal district between latitudes 170 29’ 16’’ and
180 36’ 20’’ N and longitudes 780 49’ 49’’ and 800 40’ 13’’ E. Geographical area of the Division is 8687.81 Km2 which is75.96% of the geographical area of the district. The elevation of the terrain ranges from 266 to 518 M above Mean Sea
Level (MSL). The general slope of the land is towards south-east, the surplus water draining into Godavari River.
Dayyam vagu is one of the important rivulets flowing in the Division and passes mostly through forest area.
Land use pattern of the Division is given in Table 4.43.1
The climate of this Division is generally dry with temperature ranging from 13.50C to 39.60C and the annual rainfall
is about 1015.8 mm, received mainly from Southwest
monsoons.
The soil types found mainly are black cotton, loamy,
sandy and alluvial. The rocks found in this Division areArchaens, Granites, Gneisses and Dykes. The mineral
resources in this Division are Iron ore, Lime stone and
Coal.
Population of the Division is 2.57 million (2011
Census), per capita forest area is 0.09 Ha and the populationdensity is 286 persons per Km2.
4.43.2 Recorded Forest Area:
The notified forest area of the Division is 2310.25Km2 which is 26.59% of the geographical area. Reserved, Protected and Un-classed forests constitute 1579.06 Km2
(68.35%), 709.02 Km2 (30.69%) and 22.18 Km2 (0.95%) of the forest area respectively.
As per Champion and Seth’s classification the forests of this Division fall under Tropical Dry Deciduous Teak
Forests and Tropical Moist Deciduous Forests.
4.43.3 Protected Area:
There is no Protected Area in the Division after carving out of Warangal WLM Division containing Eturnagaram
and Tadwai WLSs.
4.43.4 Community Forest Management:
There are 127 Vana Samrakshana Samities (VSSs) in the Division. 332.38 Km2 of forest area, which is 8.95 % of thenotified forests, is under the management of VSSs.
4.43.5 Forest Cover:
The forest cover in the Division based on the interpretation of IRS P6LISS III 2010 data (Oct/Dec 2010) is 1965.16 Km2 which is 22.61% of the
geographical area. In terms of the forest canopy density classes the Division
has 951.75 Km2 of Moderately Dense Forests and 1013.41 Km2 Open Forests.The area of the Scrub is 91.80 Km2, Non-Forests 246.56 Km2 and Water
Bodies 6.73 Km2. The distribution of the forest cover of the Division is
shown in Fig 4.43.1
Land use Area in SqKm Percentage
Forest including Scrub 2062.96 23.75
Agriculture 5402.94 62.19
Land with Scrub 370.82 4.27
Fallow Lands 308.13 3.55
Grasslands 0.00 0.00
Settlements 103.8 1.19
Vegetation outside Forest 171.84 1.98
Water Bodies 267.32 3.07
Total 8687.81
Table 4.43.1: Land use Pattern
Fig 4. 43.1
Warangal CircleForest division wise results

136
Andhra Pradesh State of Forest - 2012
4.43.6 Change in Forest Cover:
The Satellite images of 2009 and 2010 seasons are shown in Figs. 4.43.2 and 4.43.3 respectively and the changesbetween this period are shown on the image of 2010.
Comparison of the current forest cover with that of previous assessment year shows a negative change in forest
cover of 320.92 Ha and positive change of 53.04 Ha. The forest cover change matrix given in Table 4.43.2 reveals that
there is a decrease of 134.88 Ha of moderately dense forest and 133.00 Ha of open forest.
The positive change 53.04 Ha is on account of growth in raised plantations. The negative change (including scrub)
of 83.53 Ha is on account of clearance of jungle growth for raising of plantations and 272.55 Ha on account of encroachments.
As raising of plantations is a forest management intervention the same is not considered as loss of forest cover. Thusonly the negative change due to encroachment is taken as loss of forest cover. Hence the net loss of forest cover in the
Division is 272.55 Ha.
There are 84 Beats in the Division. Negative changes in forest cover are noticed in 30 Beats and positive change in1 Beat. There are no changes in the remaining 53 Beats.
Details of forest cover changes in the 31 Beats mentioned above are shown in Table 4.43.3.
VDF MDF OF Scrub NF WB
Very Dense Forest 0.00 0.00 0.00 0.00 0.00 0.00 0.00
Moderately Dense Forest 0.00 951.75 0.23 0.28 0.84 0.00 953.10
Open Forest 0.00 0.00 1012.65 0.44 1.65 0.00 1014.74
Scrub 0.00 0.00 0.17 91.08 0.12 0.00 91.37
Non-Forest 0.00 0.00 0.36 0.00 243.95 0.00 244.31
Water 0.00 0.00 0.00 0.00 0.00 6.73 6.73
Total of 2010 0.00 951.75 1013.41 91.80 246.56 6.73 2310.25
Net Change 0.00 -1.35 -1.33 0.43 2.25 0.00
2009Total of
2009
2010
Table 4.43.2: Forest Cover change matrix (Area in Km2)
Fig 4.43.3Fig 4.43.2

137
BHUPALAPALLI NORTH RANGEAndukthanda 0.00 235.40 460.60 82.24 180.61 0.00 958.85 -6.39 6.39Dudekulapalli 0.00 1356.79 1164.69 26.01 68.85 0.01 2616.35 -2.04 2.04Kamalapur 0.00 1017.76 2186.94 142.31 374.21 7.26 3728.48 -45.46 0.00Rampur N 0.00 468.99 1321.58 77.13 172.18 0.00 2039.88 -1.33 1.33Total 0.00 3078.94 5133.81 327.69 795.85 7.27 9343.56 -55.22 9.76ETURANAGARAM RANGEBhupathipur 0.00 1553.78 1217.16 35.74 89.39 1.22 2897.29 -1.11 1.11Domeda 0.00 526.35 1929.43 151.34 302.28 0.00 2909.40 -2.63 2.63Eturnagaram 0.00 782.44 876.21 99.90 293.20 0.00 2051.75 -1.84 1.84Gurvella 0.00 1419.84 904.67 50.28 386.78 23.47 2785.04 -4.04 4.04Komatpalli 0.00 439.44 1307.19 181.25 817.14 4.18 2749.20 46.45 6.59Mangapet 0.00 224.24 1225.18 156.86 352.65 0.00 1958.93 -47.26 47.26Puredpalli 0.00 1263.36 1721.78 219.09 452.26 0.01 3656.50 -4.44 4.44Rampur Mulakatta 0.00 640.75 1390.47 71.20 326.97 14.74 2444.13 -1.70 1.70Roheer 0.00 1597.63 1488.80 120.60 605.28 94.02 3906.33 -29.09 29.09Salpak 0.00 1710.88 1899.00 97.29 291.49 18.13 4016.79 -23.13 23.13Thimmampet 0.00 930.55 2055.97 201.14 1116.96 10.44 4315.06 -1.44 1.44Tondyal laxmipur 0.00 1208.48 1605.51 80.56 116.22 0.01 3010.78 -3.39 3.39Total 0.00 12297.74 17621.37 1465.25 5150.62 166.22 36701.20 -73.62 126.66MULUGU RANGEMulugu 0.00 172.54 395.06 136.52 203.80 0.01 907.93 -3.60 3.60Narayanpur 0.00 803.14 988.78 89.81 348.09 5.02 2234.84 -41.04 2.97Total 0.00 975.68 1383.84 226.33 551.89 5.03 3142.77 -44.64 6.57PASARA RANGEAlliguda N 0.00 2202.63 527.86 33.53 114.54 0.00 2878.56 -1.80 1.80Alliguda S 0.00 2574.20 623.04 14.95 60.87 3.45 3276.51 -3.54 3.54Bandal 0.00 5076.76 1122.29 40.57 88.41 0.00 6328.02 -19.81 19.81Lingal 0.00 2462.40 1737.36 121.49 471.03 2.15 4794.43 -22.52 22.52Motlaguda 0.00 2322.30 2008.45 71.44 143.92 0.00 4546.11 -0.93 0.93Total 0.00 14638.29 6019.00 281.98 878.77 5.60 21823.63 -48.60 48.60TADWAI RANGEBeerelli 0.00 1993.67 2024.01 301.70 564.29 18.98 4902.65 -21.40 21.40Chinnaboinapally 0.00 1396.86 968.78 97.74 384.51 0.00 2847.89 -10.03 10.03Damervai 0.00 996.34 1159.18 68.05 133.20 0.00 2356.76 -0.73 0.73Katapur 0.00 1147.73 773.55 64.76 81.80 2.31 2070.15 -5.19 5.19Oorattam 0.00 4603.03 3700.77 210.32 387.18 25.20 8926.50 -9.42 9.42Rampur New 0.00 1179.94 877.18 75.47 64.34 0.00 2196.92 -19.46 19.46Shahpalli 0.00 2093.22 1478.43 87.80 265.78 21.91 3947.14 -13.57 13.57Souledu 0.00 2260.94 931.55 4.48 4.76 0.00 3201.73 -1.16 1.16Total 0.00 15671.73 11913.45 910.32 1885.86 68.40 30449.74 -80.96 80.96Grand Total 0.00 46662.38 42071.47 3211.57 9262.99 252.52 101460.90 -303.04 272.55
Table 4.43.3: List of Beats with negative change in Forest Cover (Area in Ha)
Satellite Images
2009 2010
BeatEncroach
mentsVDF MDF OF Scrub NF WB Total
Net
Change
Longitude 80.458810 E
Latitude 18.251580 N
Area in Ha 1.27
Change OF to NF
Compt No 250
Beat Tondyal Laxmipur
Range Eturagaram
Division Warangal North
Forest division wise results

138
Andhra Pradesh State of Forest - 2012
4.44 WARANGAL SOUTH DIVISION
4.44.1 Introduction:
Warangal South Forest Division lies in the south-eastern part of Warangal district between latitudes 170 19’ 05’’ and
180 07’ 04’’ N and longitudes 790 35’ 32’’ and 800 18’ 32’’ E. Geographical area of the Division is 3,618 Km2 which is 29.3%
of the geographical area of the district. The Division is having an altitude of 420 to 658 M and the plains having an altitude
of 302 M above MSL.
Land use pattern of the Division is given in Table 4.44.1
The climate of this Division is generally dry with temperatures ranging from 13.50C to 39.60C and the annual rainfall
is about 1015.8 mm, received mainly from Southwest monsoons.
The soil types found mainly are black cotton, red
and brown sandy loam.
Population of the Division is 0.95 million (2011
Census), per capita forest area is 0.18 Ha and the
population density is 246 persons per Km2.
4.44.2 Recorded Forest Area:
The notified forest area of the Division is 1174 Km2
which is 32.4% of the geographical area. Reserved,
Protected and Un-classed forests constitute 572.8 Km2
(48.79%), 598 Km2 (51.03%) and 2.11 Km2 (0.18%) of the
forest area respectively.
As per Champion and Seth’s classification the
forests of Division fall under Dry Deciduous Teak Forests, Tropical Dry Deciduous Mixed Forests, Bamboo and Tropical
Dry Mixed Teak Forests.
4.44.3 Protected Area:
There is no Protected Area in the Division after carving out of Warangal WLM Division consisting of Pakhal WLS.
4.44.4 Community Forest Management:
There are 147 Vana Samrakshana Samities (VSSs) in the Division.
An area of 339.46 Km2 forests, which is 19.89 % of notified forest area, is
under the management of VSSs.
4.44.5 Forest Cover:
The forest cover in the Division based on the interpretation of IRS
P6 LISS III 2010 data (Oct/Dec 2010) is 732.42 Km2 which is 20.24% of
the geographical area. In terms of the forest canopy density classes the
Division has 307.03 Km2 of Moderately Dense Forests and 425.39 Km2 of
Open Forests. The area of the Scrub is 78.76 Km2, Non-Forest 341.18 Km2
and Water Bodies 22.29 Km2. The distribution of the forest cover of the
Division is shown in Fig 4.44.1
Land use Area in SqKm Percentage
Forest including Scrub 815.16 22.53
Agriculture 2296.34 63.47
Land with Scrub 174.21 4.81
Fallow Lands 77.86 2.15
Grasslands 0.00 0.00
Settlements 13.11 0.36
Vegetation outside Forest 94.3 2.61
Water Bodies 147.15 4.07
Total 3618.13
Table 4.44.1: Land use Pattern
Fig 4. 44.1
Warangal Circle

139
4.44.6 Change in Forest Cover:
The Satellite images of 2009 and 2010 seasons are shown in Figs. 4.44.2 and 4.44.3 respectively and the changes
between this period are shown on the image of 2010.
Comparison of the current forest cover with that of previous assessment year shows a negative change in forestcover of 271.73 Ha. The forest cover change matrix given in Table 4.44.2 reveals that there is a decrease of 118.85 Ha of
moderately dense forest and 152.88 Ha of open forest.
The entire negative change (including scrub) of 289.97 Ha is on account of encroachments. Therefore the net lossof forest cover is 289.97 Ha.
There are 56 Beats in the Division. Negative changes in forest cover are noticed in 24 Beats. There are no changes
in the remaining 32 Beats.Details of forest cover changes in the 24 Beats mentioned above are shown in Table 4.44.3
Fig 4. 44.3Fig 4. 44.2
VDF MDF OF Scrub NF WB
Very Dense Forest 0.00 0.00 0.00 0.00 0.00 0.00 0.00
Moderately Dense Forest 0.00 307.03 0.15 0.62 0.42 0.00 308.22
Open Forest 0.00 0.00 425.24 0.38 1.30 0.00 426.92
Scrub 0.00 0.00 0.00 77.76 0.03 0.00 77.79
Non-Forest 0.00 0.00 0.00 0.00 339.43 0.00 339.43
Water 0.00 0.00 0.00 0.00 0.00 22.29 22.29
Total of 2010 0.00 307.03 425.39 78.76 341.18 22.29 1174.65
Net Change 0.00 -1.19 -1.53 0.97 1.75 0.00
2009Total of
2009
2010
Table 4.44.2: Forest Cover change matrix (Area in Km2)
Forest division wise results

140
Andhra Pradesh State of Forest - 2012
GUDUR RANGE
Matwada 0.00 487.45 1240.71 124.28 383.14 2.31 2237.89 -6.80 6.80
Otla 0.00 1244.49 1198.41 163.19 371.35 4.91 2982.35 -2.27 2.27
Total 0.00 1731.94 2439.12 287.47 754.49 7.22 5220.24 -9.07 9.07
KOTHAGUDA RANGE
Bavargonda 0.00 639.93 646.58 82.84 435.41 7.91 1812.67 -1.31 1.31
Buthulapally 0.00 177.48 1651.00 301.11 965.32 9.24 3104.15 -5.37 5.37
Gudipaddu 0.00 1705.11 362.85 41.92 365.29 4.36 2479.53 -11.67 11.67
Gurjalemote 0.00 1203.35 689.53 32.40 142.88 3.39 2071.55 -3.53 3.53
Jangalapally 0.00 1826.97 1242.98 141.84 304.16 1.29 3517.24 -12.35 12.35
Kamaram 0.00 925.21 2322.66 95.29 517.43 16.99 3877.58 -9.14 9.14
Komatlaguda 0.00 1443.75 841.58 98.44 460.07 7.35 2851.19 -19.31 19.31
Madaguda 0.00 1049.03 1234.85 167.89 639.17 6.38 3097.32 -4.50 4.50
Mamidiguda 0.00 975.47 1092.79 68.47 464.19 2.37 2603.29 -8.97 8.97
Marriguda 0.00 777.81 1511.90 170.46 404.80 5.02 2869.99 -17.20 17.20
Putlabhupathi 0.00 912.49 760.94 118.13 265.17 6.82 2063.55 -13.22 13.22
Thirmalgandi 0.00 87.18 1187.11 140.62 414.70 6.63 1836.24 -1.98 1.98
Total 0.00 11723.78 13544.77 1459.41 5378.59 77.75 32184.30 -108.55 108.55
MAHBOOBABAD RANGE
Kongarigidda 0.00 446.18 1151.97 234.81 687.17 7.94 2528.07 -12.28 12.28
Total 0.00 446.18 1151.97 234.81 687.17 7.94 2528.07 -12.28 12.28
NARSAMPET RANGE
Ashoknagar 0.00 46.36 699.54 126.14 913.43 59.78 1845.25 -17.96 17.96
Budharaopet 0.00 27.79 38.71 10.04 33.85 0.00 110.39 -1.76 1.76
Dabeerpet 0.00 488.24 1464.42 262.37 744.31 4.72 2964.06 -3.76 3.76
Govindapur 0.00 1130.97 1000.65 344.05 1464.98 131.55 4072.20 -101.99 101.99
Inchaguda(N) 0.00 93.44 656.82 88.49 879.30 1.48 1719.53 -2.99 2.99
Inchaguda(S) 0.00 16.26 521.01 208.61 1686.64 108.75 2541.27 -2.95 2.95
Musmi-1 0.00 515.97 1006.17 119.51 616.77 13.31 2271.73 -17.12 17.12
Pakhal 0.00 544.75 1145.17 324.63 1179.62 1500.23 4694.40 -4.90 4.90
Ponugondla 0.00 922.22 1170.30 42.15 67.18 0.01 2201.86 -6.64 6.64
Total 0.00 3786.00 7702.79 1525.99 7586.08 1819.83 22420.69 -160.07 160.07
Grand Total 0.00 17687.90 24838.65 3507.68 14406.33 1912.74 62353.30 -289.97 289.97
Table 4.44.3: List of Beats with negative change in Forest Cover (Area in Ha)
Satellite Images
2009 2010
BeatEncroach
mentsVDF MDF OF Scrub NF WB Total
Net
Change
Longitude 80.138570 E
Latitude 17.981440 N
Area in Ha 1.607
Change OF to NF
Compt No 763
Beat Musmi-1
Range Narsampet
Division Warangal South

141
4.45 WARANGAL WLM DIVISION
4.45.1 INTRODUCTION:
Warangal WLM Forest Division lies in the north-western and south-eastern parts of Warangal district between
latitudes 170 29’ 16’’ and 180 36’ 20’’ N and longitudes 780 49’ 49’’ and 800 40’ 13’’ E. Geographical Area of the Division is 540Km2.
Land use pattern of the Division is given in Table 4.45.1.
The climate of this Division is generally dry withtemperatures ranging from 13.50C to 39.60C and the annual
rainfall is about 1015.8 mm, received mainly from
Southwest monsoons.
Population of the Division is 0.039 million (2011Census), per capita forest area is 1.38 Ha and the
population density is 72 persons per Km2.
4.45.2 RECORDED FOREST AREA:
The notified forest area of the Division is 538.55Km2.
As per Champion and Seth’s classification theforests of Division fall under Tropical Dry Deciduous,
Tropical Moist Deciduous, Tropical Semi Evergreen and Tropical Thorn Forest types.
4.45.3 PROTECTED AREA:
The Division consists of two Protected Areas - Eturnagaram and Pakhal wildlife Sanctuaries.
4.45.4 COMMUNITY FOREST MANAGEMENT:
There are 43 Vana Samrakshana Samities (VSSs) in the Division. An area of 100.67 Km2 forest area which is 18.69%
of the notified forests is under the management of the VSSs.
4.45.5 FOREST COVER:
The forest cover in the Division based on the interpretation of IRSP6 LISS III 2010 data (Oct 2010) is 495.35 Km2 which is 91.72% of the
geographical area. In terms of the forest canopy density classes the
Division has 218.91 Km2 of Moderately Dense Forests and 276.44 Km2
of Open Forests. The area of the Scrub is 15.30 Km2, Non-Forests 26.13
Km2 and Water Bodies 1.77 Km2. The distribution of the forest cover of
the Division is shown in Fig 4.45.1
4.45.6 CHANGE IN FOREST COVER:
The Satellite images of 2009 and 2010 seasons are shown in Figs. 4.45.2 and 4.45.3 respectively and the changes
between this period are shown on the image of 2010.
Land use Area in SqKm Percentage
Forest including Scrub 511.55 94.72
Agriculture 6.86 1.27
Land with Scrub 5.41 1.00
Fallow Lands 0.19 0.04
Grasslands 0.00 0.00
Settlements 0.00 0.00
Vegetation outside Forest 14.99 2.78
Water Bodies 1.04 0.19
Total 540.04
Table 4.45.1: Land use Pattern
Fig 4.45.1
Warangal CircleForest division wise results

142
Andhra Pradesh State of Forest - 2012
Comparison of the current forest cover with that of previous assessment year shows a negative change in forestcover of 94.63 Ha. The forest cover change matrix given in Table 4.45.2 reveals that there is a decrease of 16.73 Ha of
moderately dense forest and 77.90 Ha of open forest.
The entire negative change (including scrub) of 103.05 Ha is on account of encroachments which is a loss of forestcover. Therefore, the net loss of forest cover in this Division is 103.05 Ha.
Fig 4. 45.2 Fig 4. 45.3
There are 30 Beats in the Division. Negative changes in forest cover are noticed in 11 Beats.There are no changesin the remaining 19 Beats.
Details of forest cover changes in these 11 Beats are shown in Table 4.45.3.
VDF MDF OF Scrub NF WB
Very Dense Forest 0.00 0.00 0.00 0.00 0.00 0.00 0.00
Moderately Dense Forest 0.00 218.91 0.03 0.03 0.10 0.00 219.07
Open Forest 0.00 0.00 276.41 0.06 0.75 0.00 277.22
Scrub 0.00 0.00 0.00 15.21 0.05 0.00 15.26
Non-Forest 0.00 0.00 0.00 0.00 25.23 0.00 25.23
Water 0.00 0.00 0.00 0.00 0.00 1.77 1.77
Total of 2010 0.00 218.91 276.44 15.30 26.13 1.77 538.55
Net Change 0.00 -0.16 -0.78 0.04 0.90 0.00
2009Total of
2009
2010
Table 4.45.2: Forest Cover change matrix (Area in Km2)

143
ETURUNAGARAM RANGE
Kondai(s) 0.00 794.01 499.46 10.49 9.05 17.23 1330.24 -1.50 1.50
Mallial(s) 0.00 1241.94 754.72 78.22 328.10 17.94 2420.92 -1.70 1.70
Total 0.00 2035.95 1254.18 88.71 337.15 35.17 3751.16 -3.20 3.20
KOTHAGUDA-I RANGE
Ankannaguda 0.00 468.80 694.17 11.17 20.92 2.50 1197.56 -1.70 1.70
Kondapur 0.00 161.56 307.19 13.67 15.50 0.00 497.92 -6.99 6.99
Medapally 0.00 580.42 930.12 166.02 435.01 5.02 2116.59 -63.95 63.95
Ootai 0.00 455.66 2013.51 136.55 87.12 0.00 2692.84 -6.75 6.75
Total 0.00 1666.44 3944.99 327.41 558.55 7.52 6504.91 -79.39 79.39
KOTHAGUDA-II RANGE
Doravarivempally 0.00 584.63 1771.17 56.58 88.86 0.00 2501.24 -7.71 7.71
Karlai 0.00 420.03 1483.68 95.02 518.43 13.79 2530.95 -3.79 3.79
Ootla 0.00 491.20 730.19 21.91 30.82 3.75 1277.87 -0.77 0.77
Total 0.00 1495.86 3985.04 173.51 638.11 17.54 6310.06 -12.27 12.27
TADWAI RANGE
Dodla 0.00 1521.15 795.60 43.76 20.02 16.43 2396.96 -2.36 2.36
Heerapur 0.00 608.38 616.47 45.78 17.08 0.00 1287.71 -5.83 5.83
Total 0.00 2129.53 1412.07 89.54 37.10 16.43 3684.67 -8.19 8.19
Grand Total 0.00 7327.78 10596.28 679.17 1570.91 76.66 20250.80 -103.05 103.05
Table 4.45.3: List of Beats with negative change in Forest Cover (Area in Ha)
Satellite Images
2009 2010
BeatEncroach
mentsVDF MDF OF Scrub NF WB Total
Net
Change
Prevent cruelty to animal kept in human societies and protect them from suffering. - Earth charter & Gandhi page 59
Longitude 80.10430 E
Latitude 18.122390 N
Area in Ha 1.702
Change OF to NF
Compt No 0
Beat Ankannaguda
Range Kothaguda-I
Division Warangal WLM
Forest division wise results
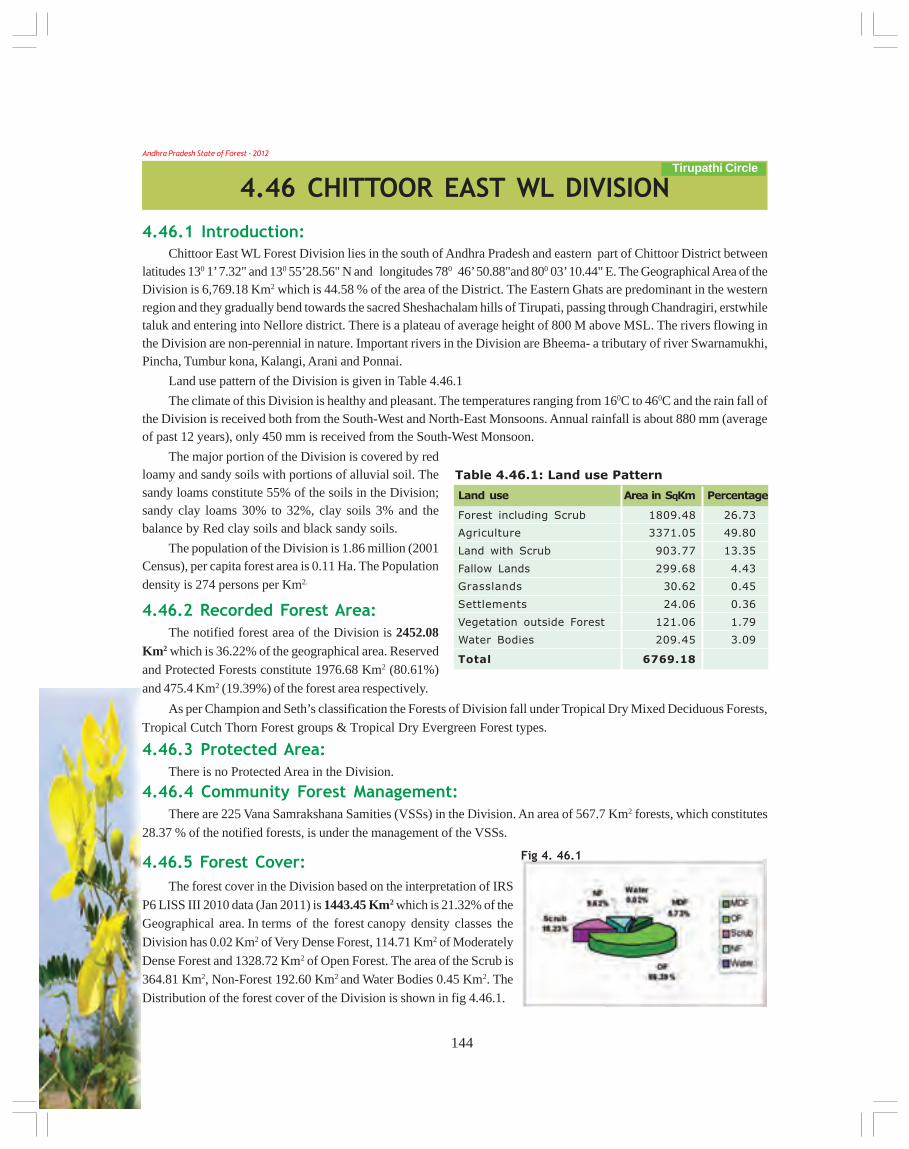
144
Andhra Pradesh State of Forest - 2012
4.46 CHITTOOR EAST WL DIVISION
4.46.1 Introduction:
Chittoor East WL Forest Division lies in the south of Andhra Pradesh and eastern part of Chittoor District betweenlatitudes 130 1’ 7.32" and 130 55’28.56" N and longitudes 780 46’ 50.88"and 800 03’ 10.44" E. The Geographical Area of theDivision is 6,769.18 Km2 which is 44.58 % of the area of the District. The Eastern Ghats are predominant in the westernregion and they gradually bend towards the sacred Sheshachalam hills of Tirupati, passing through Chandragiri, erstwhiletaluk and entering into Nellore district. There is a plateau of average height of 800 M above MSL. The rivers flowing inthe Division are non-perennial in nature. Important rivers in the Division are Bheema- a tributary of river Swarnamukhi,Pincha, Tumbur kona, Kalangi, Arani and Ponnai.
Land use pattern of the Division is given in Table 4.46.1
The climate of this Division is healthy and pleasant. The temperatures ranging from 160C to 460C and the rain fall ofthe Division is received both from the South-West and North-East Monsoons. Annual rainfall is about 880 mm (averageof past 12 years), only 450 mm is received from the South-West Monsoon.
The major portion of the Division is covered by redloamy and sandy soils with portions of alluvial soil. Thesandy loams constitute 55% of the soils in the Division;sandy clay loams 30% to 32%, clay soils 3% and thebalance by Red clay soils and black sandy soils.
The population of the Division is 1.86 million (2001Census), per capita forest area is 0.11 Ha. The Populationdensity is 274 persons per Km2.
4.46.2 Recorded Forest Area:
The notified forest area of the Division is 2452.08Km2 which is 36.22% of the geographical area. Reservedand Protected Forests constitute 1976.68 Km2 (80.61%)
and 475.4 Km2 (19.39%) of the forest area respectively.
As per Champion and Seth’s classification the Forests of Division fall under Tropical Dry Mixed Deciduous Forests,
Tropical Cutch Thorn Forest groups & Tropical Dry Evergreen Forest types.
4.46.3 Protected Area:
There is no Protected Area in the Division.
4.46.4 Community Forest Management:
There are 225 Vana Samrakshana Samities (VSSs) in the Division. An area of 567.7 Km2 forests, which constitutes
28.37 % of the notified forests, is under the management of the VSSs.
4.46.5 Forest Cover:
The forest cover in the Division based on the interpretation of IRS
P6 LISS III 2010 data (Jan 2011) is 1443.45 Km2 which is 21.32% of theGeographical area. In terms of the forest canopy density classes the
Division has 0.02 Km2 of Very Dense Forest, 114.71 Km2 of Moderately
Dense Forest and 1328.72 Km2 of Open Forest. The area of the Scrub is364.81 Km2, Non-Forest 192.60 Km2 and Water Bodies 0.45 Km2. The
Distribution of the forest cover of the Division is shown in fig 4.46.1.
Land use Area in SqKm Percentage
Forest including Scrub 1809.48 26.73
Agriculture 3371.05 49.80
Land with Scrub 903.77 13.35
Fallow Lands 299.68 4.43
Grasslands 30.62 0.45
Settlements 24.06 0.36
Vegetation outside Forest 121.06 1.79
Water Bodies 209.45 3.09
Total 6769.18
Table 4.46.1: Land use Pattern
Fig 4. 46.1
Tirupathi Circle

145
4.46.6 Change in Forest Cover:
The satellite images of 2009 and 2010 are shown in Figs 4.46.2 & 4.46.3 respectively and the changes between this
period are shown on the image of 2010.
Comparison of the current forest cover with that of previous assessment year shows no negative change. The forestcover change matrix given in Table 4.46.2 reveals that there is a decrease in forest cover of 1.66 Ha in scrub.
The negative change in scrub of 1.66 Ha is on account of encroachment. Therefore the net loss of forest cover is1.66 Ha.
There are 78 Beats in the Division. Negative change in forest cover is noticed in 1 Beat only, i.e., Vadmalpet. Thereis change in the remaining 77 Beats.
Details of forest cover changes in the 1 Beat mentioned above, is shown in Table 4.46.3.
VDF MDF OF Scrub NF WB
Very Dense Forest 0.02 0.00 0.00 0.00 0.00 0.00 0.02
Moderately Dense Forest 0.00 114.71 0.00 0.00 0.00 0.00 114.71
Open Forest 0.00 0.00 1328.72 0.00 0.00 0.00 1328.72
Scrub 0.00 0.00 0.00 364.81 0.02 0.00 364.83
Non-Forest 0.00 0.00 0.00 0.00 192.58 0.00 192.58
Water 0.00 0.00 0.00 0.00 0.00 0.45 0.45
Total of 2010 0.02 114.71 1328.72 364.81 192.6 0.45 2001.31
Net Change 0.00 0.00 0.00 -0.02 0.02 0.00
2009Total of
2009
2010
Table 4.46.2: Forest Cover change matrix (Area in Km2)
Puttur RANGE
Vadamalpet 0.00 459.45 2495.00 196.76 119.53 0.00 3270.74 -1.66 1.66
Total 0.00 459.45 2495.00 196.76 119.53 0.00 3270.74 -1.66 1.66
Table 4.46.3: List of Beats with negative change in Forest Cover (Area in Ha)
BeatEncroach
mentsVDF MDF OF Scrub NF WB Total
Net
Change
Forest division wise results
Fig 4. 46.3Fig 4. 46.2

146
Andhra Pradesh State of Forest - 2012
4.47 TIRUPATI WLM DIVISION
4.47.1 Introduction:
Tirupati WLM Division spreads over part of 2 districts, i.e., Chittoor and Kadapa. It lies in the southern part of
Andhra Pradesh and north-eastern part of Chittoor district and south-eastern part of Kadapa district between latitudes
130 36’ 18’’ and 130 56’ 55.68’’ N and longitudes 790 07’ 51.96’’ and 790 30’ 18.36" E. Geographical area of the Division is
755.17 Km2.
Land use pattern of the Division is given in Table 4.47.1
The climate of this Division is generally dry with temperatures ranging from 190C to 400C and the annual rainfall is
about 934 mm, received mainly from north-east monsoons.
Population of the Division is 0.38 million (2011
Census), per capita forest area is 0.18 Ha and the
population density is 507 persons per Km2.
4.47.2 Recorded Forest Area:
The notified forest area of the Division is 714.33Km2 which is 98.38% of the geographical area.
As per Champion and Seth’s classification the
forests of Division fall under Tropical Dry Mixed
Deciduous Forests, Tropical Dry Deciduous Forests,
Tropical Cutch Thorn Forest & Tropical Dry Evergreen
Forest types. Its most important species is the famous
Pterocarpus santalinus or Red Sanders.
4.47.3 Protected Area:
The Division consists of the Sri Venkateswara Wildlife Sanctuary and Sri Venkateswara National Park.
4.47.4 Community Forest Management:
There are 42 Vana Samrakshana Samities (VSSs) in the Division. An area of 107.44 Km2, which constitutes 15.04% of
the notified forests, is under the management of the VSSs.
4.47.5 Forest Cover:
The forest cover in the Division based on the interpretation of IRS P6
LISS III 2010 data (Feb 2011) is 494.21 Km2 which is 65.44 % of the
geographical area. In terms of the forest canopy density classes the Division
has 3.16 Km2 of Very Dense Forests, 86.64 Km2 of Moderately Dense Forests
and 404.41 Km2 of Open Forest. The area of the Scrub is 194.35 Km2, Non-
Forests 23.35 Km2 and water Bodies 2.41 Km2 .The distribution of the forest
cover of the Division is shown in Fig 4.47.1.
4.47.6 Change in Forest Cover:
The satellite images of 2009 and 2010 seasons are shown in Figs 4.47.2 & 4.47.3 respectively and the changes
between this period are shown on the image of 2010.
Land use Area in SqKm Percentage
Forest including Scrub 689.81 91.34
Agriculture 0.00 0.00
Land with Scrub 3.82 0.51
Fallow Lands 35.73 4.73
Grasslands 0.00 0.00
Settlements 4.39 0.58
Vegetation outside Forest 19.18 2.53
Water Bodies 2.31 0.31
Total 755.17
Table 4.47.1: Land use Pattern
Fig 4. 47.1
Tirupathi Circle

147
Comparison of the current forest cover with that of previous assessment year shows a negative change in forestcover of 2.99 Ha. The forest cover change matrix given in Table 4.47.2 reveals that there is a decrease of 2.99 Ha of open
forest.
The total negative change of 2.99 Ha is on account of diversion of forestland to AP Tourism Department which willbe compensated. Therefore the net loss of forest cover is Nil.
There are 25 Beats in the Division. Negative changes in forest cover is seen in only 1 Beat and there are no changes
in the remaining 24 Beats.
Details of forest cover changes in 1 Beat mentioned above is shown in Table 4.47.3.
VDF MDF OF Scrub NF WB
Very Dense Forest 3.16 0.00 0.00 0.00 0.00 0.00 3.16
Moderately Dense Forest 0.00 86.64 0.00 0.00 0.00 0.00 86.64
Open Forest 0.00 0.00 404.41 0.03 0.00 0.00 404.44
Scrub 0.00 0.00 0.00 194.32 0.00 0.00 194.32
Non-Forest 0.00 0.00 0.00 0.00 23.35 0.00 23.35
Water 0.00 0.00 0.00 0.00 0.00 2.41 2.41
Total of 2010 3.16 86.64 404.41 194.35 23.35 2.41 714.32
Net Change 0.00 0.00 -0.03 0.03 0.00 0.00
2009Total of
2009
2010
Table 4.47.2: Forest Cover change matrix (Area in Km2)
Fig 4.47.2 Fig 4.47.3
Tirupati Range
Perumallapalli 20.93 423.89 876.31 439.43 67.79 0.00 1828.35 -2.99 0.00
Total 20.93 423.89 876.31 439.43 67.79 0.00 1828.35 -2.99 0.00
Table 4.47.3: List of Beats with negative change in Forest Cover (Area in Ha)
BeatEncroach
mentsVDF MDF OF Scrub NF WB Total
Net
Change
Forest division wise results

148
Andhra Pradesh State of Forest - 2012
4.48 RAJAMPET WL DIVISION
4.48.1 Introduction:
Rajampet WL Forest Division lies in the south-eastern part of Kadapa district between latitudes 130 46’ 45’’ and 140
23’ 35’’ N and longitudes 780 44’ 44’’ and 790 28’ 22’’ E. Geographical area of the Division is 3,027 Km2 which is 19.71% ofthe geographical area of the district. The Division is having an altitude of 378.7 M. The rivers Penna, Chitravathi, Kundu,Papaghni, Sagileru, Mandvya, Gunjaneru and Cheyyeru fall in this Division.
Land use pattern of the Division is given in Table 4.48.1
The climate of this Division is generally dry withtemperatures ranging from 250 C to 400 C and the annualrainfall is about 700 mm with uneven isolated rainsreceived mainly from south-west monsoons.
The soils of the Division are red ferrugenous andblack. These two classes can be sub divided into clay &loamy sand with finer distinctions. They range from poorto fertile. Red soils occupy most of the Division area andare under cultivation. These soils have a low nutrientstatus. The minerals like Barytes, China clay, White clay,Copper, Manganese Black Granite and Lime stone areavailable.
Population of the Division is 0.49 million (2011Census), per capita forest area is 0.3 Ha and the populationdensity is 148 persons per Km2.
4.48.2 Recorded Forest Area:
The notified forest area of the Division is 1437.03 Km2 which is 47.47% of the geographical area. Reserved and Un-classed forests constitute 1,410.71 Km2 (98.17%) and 26.32 Km2 (1.83%) of the forest area respectively.
As per Champion and Seth’s classification the forests of Division falls under Tropical Dry Deciduous forest type.Its most important species is the famous Pterocarpus santalinus or Red Sanders. These forests fall under three zonesthose of Terai or Fuel Forests up to an elevation of 250 M, hill forests or Red Sanders lying between the elevation of 250- 700 M and Shorea eugenia occupying elevations above 700 M feet.
4.48.3 Protected Area:
A part of Sri Penusila Narasimha Swamy WLS falls in this Division.
4.48.4 Community Forest Management:
There are 178 Vana Samrakshana Samities (VSSs) in the Division. An area of 445.55 Km2 of forests, which is 31% ofthe notified forests, is under the management of the VSSs.
4.48.5 Forest Cover:
The forest cover in the Division is based on the interpretation
of IRS P6 LISS III 2010 data (Jan 2011) is 1031.74 Km2 which is 34.11% of
the geographical area. In terms of the forest canopy density classes the
Division has 55.71 Km2 of Moderately Dense Forest and 976.03 Km2 of
Open Forest. The area of the Scrub is 363.21 Km2, Non-Forest 54.08 Km2
and Water Bodies 2.91 Km2.The distribution of the forest cover of the
Division is shown in Fig 4.48.1.
Land use Area in SqKm Percentage
Forest including Scrub 1397.35 46.16
Agriculture 845.79 27.94
Land with Scrub 185.17 6.12
Fallow Lands 382.88 12.65
Grasslands 6.00 0.20
Settlements 7.65 0.25
Orchids 158.72 5.24
Water Bodies 43.43 1.43
Total 3027.00
Table 4.48.1: Land use Pattern
Fig 4. 48.1
Tirupathi Circle

149
4.48.6 Change in Forest Cover:
The satellite images of 2009 and 2010 seasons are shown in Figs 4.48.2 & 4.48.3 respectively and the changes
between this period are shown on the image of 2010.
Comparison of the current forest cover with that of previous assessment year does not show any change in theforest cover. The Forest cover change matrix given in Table 4.48.2 reveals that there has been an increase of 1.32 Ha ofscrub.
The positive change of 11.68 Ha is on account of raising of plantations. The negative change including scrub loss is
10.36 Ha on account of clearance of jungle growth for raising of plantations. As raising of plantations is a forest management
intervention the same is not considered as loss of forest cover. Therefore there is no net loss of forest cover in the Division.
Fig 4. 48.3Fig 4. 48.2
VDF MDF OF Scrub NF WB
Very Dense Forest 0.00 0.00 0.00 0.00 0.00 0.00 0.00
Moderately Dense Forest 0.00 55.71 0.00 0.00 0.00 0.00 55.71
Open Forest 0.00 0.00 976.03 0.00 0.00 0.00 976.03
Scrub 0.00 0.00 0.00 363.09 0.10 0.00 363.19
Non-Forest 0.00 0.00 0.00 0.12 53.98 0.00 54.10
Water 0.00 0.00 0.00 0.00 0.00 2.91 2.91
Total of 2010 0.00 55.71 976.03 363.21 54.08 2.91 1451.94
Net Change 0.00 0.00 0.00 0.02 -0.02 0.00
2009Total of
2009
2010
Table 4.48.2: Forest Cover change matrix (Area in Km2)
There are 32 Beats in the Division. Both positive and negative changes in forest cover are noticed in 1 Beat only and
only positive change is noticed in 1 Beat. There are no changes in the remaining 29 Beats.
Details of forest cover changes in the 2 Beats mentioned above are shown in Table 4.48.3.
CHITVEL RANGEChitvel 0.00 792.13 5795.53 1785.32 152.00 0.00 8524.98 8.96 0.00Total 0.00 792.13 5795.53 1785.32 152 0.00 8524.98 8.96 0.00RAJAMPET RANGEAnnasamudram 0.00 44.7 2650.31 1053.13 114.32 0.62 3863.08 -7.64 0.00Total 0.00 44.7 2650.31 1053.13 114.32 0.62 3863.08 -7.64 0.00Grand Total 0.00 836.83 8445.84 2838.45 266.32 0.62 12388.06 1.32 0.00
Table 4.48.3: List of Beats with negative change in Forest Cover (Area in Ha)
BeatEncroa-
chmentsVDF MDF OF Scrub NF WB Total
Net
Change
Forest division wise results
150
Andhra Pradesh State of Forest - 2012
5.1 Introduction
India being situated in the tropical region harbors rich Bio-Diversity. With just 2% of the world’s land area India
supports about 10% of the world’s Biological Diversity making it the 7th richest Bio-Diversity country in the world. This
distinction bestows a great responsibility on the Government to protect and conserve its rich floral, faunal and ecological
diversity. This is sought to be done by establishing a network of Protected Areas. The term Protected Areas is commonly
used to describe areas of ecological and biological importance like Wildlife Sanctuaries, National Parks, Zoos, Game
reserves etc. An area qualifies to be declared as Protected Area when it bears some floral or faunal species of great
significance, which need to be conserved or has an ecological system, which is fragile and needs to be protected. India
is one of the 12 mega-biodiversity countries of the World.
The Andhra Pradesh state has coastline of about 1000 km. The State has wide and varied vegetation types enriched
by a variety of flora and fauna. Andhra Pradesh being located strategically in the central region of the Indian sub-
continent has representatives of the magnificent Indian plant and animal life. Its varied topography ranging from the hills
of Eastern Ghats and Nallamalais to the shores of Bay of Bengal supports varied ecotypes, which in turn support a rich
diversity of flora and fauna. The vegetation found in the state is largely of dry deciduous type with a mixture of Teak,
Terminalias, Dalbergias, Pterocarpus, Anogeissus etc. The hills of Eastern Ghats add greatly to the Biological Diversity
and provide centers of endemism for plants, birds and lesser forms of animal life. The varied habitat harbors a diversity
of fauna which includes Tiger, Panther, Wolf, Wild Dog, Hyena, Sloth Bear, Gaur, Black Buck, Chinkara, Chowsingha,
Nilgai, Cheetal, Sambar and a number of Birds and Reptiles. The long sea coast provides the nesting ground for sea
turtles, the back waters of Pulicat lake are the feeding grounds for Flamingos and Grey Pelicans, the estuaries of river
Godavari and Krishna support rich mangrove forests with Fishing Cat and Otters as key-stone species. The State is a
proud possessor of some rare and endemic plants like Cycas beddomei, Pterocarpus santalinus, Terminalia pallida,
Syzygium alternifolium, Shorea talura, Shorea tumbuggia, Psilotum nudam etc. Similarly, the Double banded or the
Jerdon’s Courser, the Golden Gecko and the Slender Loris are rare, endangered and endemic fauna in the State.
5.2 Protected Area Network in AP
The State has 27 Protected Areas – 20 Wildlife Sanctuaries, 6 National Parks and 2 Tiger Reserves i.e. Nagarjuna
Sagar – Srisailam Tiger Reserve (NSTR), the biggest Tiger Reserve of India and Kawal Tiger Reserve in Adilabad District
– the latest to be notified as Tiger Reserve in A.P. Out of 63814 Km2 of notified forest area, 15280.92 Km2 is included in the
PA network, covering an area of about 23.9% of the notified forests and 5.53% of Geographical area of the State.
The State with its rich forests and diverse flora and fauna provides ample scope for promoting Eco-tourism. The
natural beauty of the state has not been fully exposed to the visitors till now. The Government has drawn up a plan to
open up the Protected Area Network of the State for visitors under the scheme of Community based Eco-tourism Project
(CBET). Each of the Wildlife Sanctuary and National Park of the State has its own significance and has something unique
to offer to the visitors.
5.3 Forest Cover in Protected Areas
The forest cover in the Protected Areas based on the interpretation of IRS P6 LISS III 2010 data is 10043.63 Km2, i.e.
3.7% of the Geographical area. In terms of the forest canopy density classes the PA Network has 208.37 Km2 of Very
Dense Forest, 3927.50 Km2 of Moderately Dense Forest and 5907.76 Km2 of Open Forests. The area of the Scrub included
is 2919.79 Km2, Non-Forest 1371.99 Km2 and Water Bodies 945.47 Km2.
Chapter – V
FOREST COVER STATISTICS IN PROTECTED AREAS

151
Comparison of the forest cover of 2010 with that of 2009 shows a net loss of 4.31 Km2 of forest cover. Maximumhabitat loss of 1.56 Km2 has occurred in Kinnerasani Wildlife Sanctuary and the least loss of 0.03 Km2 in Sri VenkateswaraNational Park. There is no loss of habitat (forest cover) in the remaining 18 WLSs.
Protected Area wise forest cover in different forest canopy density classes along with the changes compared to2009 assessment is given in Table 5.1.
** Water Bodies inclusive of outside notified forests in Pulicat & Kolleru Lake, Koringa WLS etc.
* Net Change in Forest Cover Only i.e., VDF, MDF and OF to Scrub and Non-Forest between 2009 and 2010.
1 ETURNAGARAM 0.00 417.09 349.71 -0.86 23.80 75.95 4.11 870.66
2 GBM WLS 23.38 760.07 295.30 0.00 52.59 17.93 0.95 1150.22
3 KAMBALAKONDA WLS 0.00 26.19 37.97 -0.04 11.78 3.95 0.12 80.01
4 KAWAL WLS 48.26 332.03 300.58 -0.29 93.15 115.18 3.80 893.00
5 KBR NP 0.00 0.04 0.03 0.00 1.11 0.25 0.00 1.43
6 KINNERASANI WLS 1.54 227.90 287.65 -1.56 182.44 110.93 15.28 825.74
7 KOLLERU LAKE WLS 0.00 12.32 103.92 0.00 82.21 100.34 78.67 377.46
8 KORINGA WLS 12.87 89.26 13.99 0.00 1.91 6.23 125.56 249.82
9 RAYALA ELEPHANT RESERVE
(INCLUDING KOUNDINYA WLS) 0.01 112.88 453.32 0.00 190.51 57.79 0.99 815.50
10 KRISHNA WLS 0.00 0.00 80.14 0.00 66.80 49.64 121.82 318.40
11 LANKAMALLESWARA 0.11 157.59 233.40 0.00 102.97 11.43 0.10 505.60
12 MAHAVIR HARINA
VANASTHALI NP 0.00 0.18 0.49 -0.06 11.95 2.45 0.00 15.07
13 MANJEERA 0.00 2.40 5.52 0.00 5.35 2.89 10.72 26.88
14 CHILKUR MRUGAVANI NP 0.00 0.00 0.04 0.00 0.00 4.48 0.45 4.97
15 NELAPATTU WLS 0.00 0.03 5.05 0.00 1.20 3.22 0.07 9.57
16 NSTR 1.08 731.70 1970.38 0.00 1371.83 350.98 96.36 4522.33
17 PAKHAL WLS 0.00 145.35 402.34 -1.22 66.05 190.99 23.21 827.94
18 PAPIKONDA WLS 79.97 636.40 110.43 0.00 20.64 5.92 3.23 856.59
19 PENISULA WLS 0.00 84.35 798.92 -0.25 321.66 29.05 37.55 1271.53
20 POCHRAM WLS 38.19 82.89 13.38 0.00 7.63 0.13 0.16 142.38
21 PRANAHITA WLS 0.00 22.48 17.45 0.00 23.27 4.94 0.24 68.38
22 PULICAT LAKE 0.09 2.33 41.54 0.00 87.66 205.39 420.33 757.34
23 RAJIVGANDHI NP 0.00 0.00 0.30 0.00 1.81 1.71 0.00 3.82
24 ROLLAPADU WLS 0.00 0.00 0.01 0.00 0.04 5.16 0.00 5.21
25 SHIVARAM WLS 0.00 4.00 19.17 0.00 16.12 0.76 0.04 40.09
26 SRI VENKATESWARA WLS 2.87 80.02 366.73 -0.03 175.31 14.30 1.71 640.94
(Including SVNP)
Total 208.37 3927.50 5907.76 -4.31 2919.79 1371.99 945.47 15280.88
Table 5.1 Protected Area-wise Forest Cover 2010
S.No. Sanctuary VDF MDF OF Net Scrub NF W B Total
Change
Earth provides to enough to satisfy every man’s need but not every man’s greed.- (Quotation Popularised by Gandhi)
Forest Cover Statistics in Protected Areas
(Area in Km2 )

152
Andhra Pradesh State of Forest - 2012
6.1 Introduction
Andhra Pradesh is one of the pioneering Forest Departments in India in implementing the Community ForestManagement (CFM). Joint Forest Management (JFM) was introduced in AP in 1994 for protecting forests, to improvetheir productivity and to alleviate rural poverty in consonance with the National Forest Policy 1988 and GoI circular ofJune 1990 on people’s participation in forest management. This strategy proved effective in restoring forest cover indegraded forest lands and improved access to the forest resources by communities living in forest fringe areas. Consideringthe potential of the forests to contribute towards poverty alleviation the Government of Andhra Pradesh adopted aproactive stance by transforming JFM into CFM during 2002.
The difference between JFM and CFM is that while JFM uses participation of communities mainly for forestprotection by giving them the rights to non-timber forest products (NTFP) and modest benefit-sharing in timber withlimited involvement in forest management. Whereas CFM aims to improve forests both in coverage and productivity byempowering VSSs to take more autonomous decisions regarding the management and use the forest resources inlivelihood development. This means a greater devolution of power and responsibilities to VSSs in planning, managementand decision making on the forest areas marked for the VSSs, at the same time redefining roles of APFD frontline staff toact as facilitators. It is important to note that Andhra Pradesh is the only State in the country which has adopted CFM andprovided 100% of net revenue generated from the VSS forest areas with a minimum of 50% of it being required to beploughed back in forest development works, as per the key strategy to address the use of forest resources for povertyalleviation.
6.2 Joint Forest Protection Committees (JFPCs)
There are 7,718 Vana Samrakshana Samities (VSSs) or JFPCs in the State. 15,200 Km2 forest area, which constitutes23.8 % of forest area, is under CFM. 15.39 lakh members are involved in CFM which includes 4.65 lakh members belongingto Scheduled Tribes and 3.23 lakh members belonging to Scheduled castes.
6.3 Forest Cover in VSS Areas
The forest cover in the VSS areas based on the interpretation of IRS P6 LISS III 2010 data is 9265.13 Km2, which is3.36% of the Geographical area. In terms of the forest canopy density classes the VSSs managed forests in the Stateconsists of 76.78 Km2 of Very Dense Forest, 3774.55 Km2 of Moderately Dense Forest and 5402.92 Km2 of Open Forest.The area of the Scrub is 3797.88 Km2, Non-Forest is 2099.42 Km2 and Water Bodies is 48.47 Km2.
Comparison of the forest cover of 2010 with that of 2009 shows a net loss of 10.84 Km2 of forest cover. It is seen thatcontribution of encroachments in the loss of forest cover in VSS areas is 9.57 Km2.
Division wise forest cover in VSSs in different forest canopy density classes along with the changes compared to2009 assessment is given in Table 6.1.
The 15 VSSs, where the most loss of forest cover was noticed (VDF,MDF, OF,SC) are
Chedwai (Kagaznagar), Abbugudem(Kothagudem), Manthur(Medak), Marlagudem(Eluru), Bandamcherla(Eluru),Kandrikagudem(Eluru), Narayanapur(Warangal North),Kammarigudem(Paloncha), Ragisettigudem(Paloncha),Rampuram(Kothagudem), Gajularamaram(Hyderabad), Potlavarigudem(Badrachalam South), Z.Veerabdraram(BadrachalamNorth), Singaram (Badrachalam North).
The 9 VSSs, where the forest cover was gained (VDF, MDF, OF, Scrub) are:
Vykuntapuram(Guntur), Pathangulagudem(Eluru), A.Durgapuram.S.T.colony(Kadapa), Komatipalli(Warangal North),Paluguthanda(Nagarjunasagar), Malonibavithanda(Nagarjunasagar) and Thippannapalli(Kothagudem).
Chapter - VI
FOREST COVER STATISTICS IN
JOINT FOREST MANAGEMENT AREA

153
ADILABAD CIRCLE
1 Adilabad 1.1 112.21 157.53 -0.04 39.76 48.29 0.45 359.342 Bellampally 2.33 100.35 71.58 -0.18 13.17 19.08 0.41 206.923 JannaramWLM 1.67 56.81 55.91 0 3.95 2.41 1.28 122.034 Kagaznagar 3.95 62.46 51.33 -0.56 15.25 14.58 0.84 148.415 Mancherial 0.56 47.88 55.42 0 21.06 12.25 0.51 137.686 Nirmal 0.29 107.34 123.08 -0.14 29.37 21.74 0.68 282.5 Total 9.9 487.05 514.85 -0.92 122.56 118.35 4.17 1256.88ANANTHAPUR CIRCLE
7 Anathapur 0 0.35 78.84 0 241.9 307.16 0.11 628.368 ChittoorWest 0 34.6 202.28 0 151.25 73.67 0.71 462.51 Total 0 34.95 281.12 0 393.15 380.83 0.82 1090.87GUNTUR CIRCLE
9 Giddalur 0.15 10.11 35.54 0 114.67 123.49 3.12 287.0810 Guntur 0 0 24.72 0 199.43 34.67 1.99 260.8111 Nellore 0 6.6 123.48 -0.04 289.83 224.63 1.4 645.94 Total 0.15 16.71 183.74 -0.04 603.93 382.79 6.51 1193.83HYDERABAD CIRCLE
12 Hyderabad 0 65.18 113.69 -0.67 161.76 11.83 1.03 353.4913 Mahabubnagar 0 13.74 246.34 0 223.61 1.64 0.09 485.4214 Nalgonda 0 0.21 23.31 0 134.05 55.86 0.32 213.75 Total 0 79.13 383.34 -0.67 519.42 69.33 1.44 1052.66KHAMMAM CIRCLE
15 BhadrachalamNorth 0.01 30.49 43.49 -0.83 28.53 15.97 0.33 118.8216 BhadrachalamSouth 0.9 35.13 36.43 -0.89 12.6 1.72 0.09 86.8717 Khammam 0.1 47.72 95.75 -0.4 69.37 25.05 0.76 238.7518 Kothagudem 0 26 103.26 -0.76 71.86 37.34 0.17 238.6319 Paloncha 0.34 51.92 145.14 -2.73 64.72 21.98 0.16 284.2520 PalonchaWLM 0.44 60.15 76.06 -0.63 41.4 19.16 2.13 199.33 Total 1.79 251.41 500.13 -6.24 288.48 121.22 3.64 1166.65KURNOOL CIRCLE
21 Kadapa 0 11.21 180.7 -0.17 169.28 32.69 0.21 394.0822 Kurnool 0 0.02 111 0 138.82 142.52 0.27 392.6323 Nandyal 1.29 62.43 53.47 0 20.11 28.58 0.96 166.8424 Proddatur 0 46.02 148.15 0 153.71 106.72 1.77 456.37 Total 1.29 119.68 493.32 -0.17 481.92 310.51 3.21 1409.92NIZAMABAD CIRCLE
25 Kamareddy 0 83.48 177.43 0 34.65 28.81 1.28 325.6526 Medak 0 69.29 361.11 -0.09 180.55 15.86 1.02 627.8327 MedakWLM 0 20.57 22.62 0 4.03 2.96 0.03 50.2128 Nizamabad 0 131.07 183.4 -0.2 46.62 41.76 2.54 405.39 Total 0 304.41 744.56 -0.29 265.85 89.39 4.87 1409.08RAJAMUNDRY CIRCLE
29 Eluru 0.03 260.37 98.63 -1.01 27.64 27.82 0.06 414.5530 Kakinada 61.19 905.32 88.96 -0.11 54.39 27.84 10.35 1148.0531 Vijayawada 0 0.04 27.45 0 44.78 8.22 0.88 81.37 Total 61.22 1165.73 215.04 -1.12 126.81 63.88 11.29 1643.97FDPT SRISAILAM CIRCLE
32 Achampet 0.01 42.35 102.64 0 83.94 4.42 3.6 236.9633 Atmakur 0.02 8.3 30.13 0 19.34 76.4 1.12 135.3134 MarkapurWLM 0.28 39.87 119.06 -0.02 135.23 52.5 0.21 347.1535 Nagarjunasagar 0 2.88 44.66 0 106.66 21.87 0.15 176.22 Total 0.31 93.4 296.49 -0.02 345.17 155.19 5.08 895.64TIRUPATHI WLM CIRCLE
36 ChittoorEast 0.02 17.2 321.75 0 142.07 86.49 0.17 567.737 Rajampet 0 4.29 131 0 117.2 36.36 0.08 288.9338 TirupathiWLM 0.94 16.18 57.88 0 24.17 8.07 0.21 107.45 Total 0.96 37.67 510.63 0 283.44 130.92 0.46 964.08VIZAG CIRCLE
39 Narsipatnam 0.87 99.31 95.69 0 20.28 14.98 0 231.1340 Paderu 0.29 40.21 133.12 -0.02 59.73 46.46 0 279.8141 Srikakulam 0 41.4 188.95 -0.06 41.61 15.72 2.54 290.2242 Visakhapatnam 0 102.27 114.14 -0.04 35.3 20.02 0.22 271.9543 Vizianagaram 0 172.44 114.93 -0.15 15.34 12.2 0.02 314.93 Total 1.16 455.63 646.83 -0.27 172.26 109.38 2.78 1388.04WARANGAL CIRCLE
44 KarimnagarEast 0 382.61 171.36 -0.04 60.37 7.43 0.45 622.2245 KarimnagarWest 0 120.28 118.21 0 83.8 10.13 1.3 333.7246 WarangalNorth. 0 107.07 150.12 0.03 18.89 55.62 0.67 332.3747 WarangalSouth 0 85.09 136.4 -0.82 28.7 88.1 1.19 339.4748 WarangalWLM 0 33.74 56.85 -0.25 3.13 6.34 0.59 100.66 Total 0 728.79 632.94 -1.08 194.89 167.62 4.2 1728.44 Grand Total 76.78 3774.55 5402.96 -10.84 3797.88 2099.42 48.47 15200.06
Table 6.1.: Divisionwise Forest Cover in VSS areas 2010
* Net Change in Forest Cover Only, i.e. VDF, MDF and OF to Scrub and Non-Forest between year 2009 and 2010.
S.No. Division VDF MDF OF Net Scrub NF WB Total
Change
(Area in Km2 )
Forest cover statistics in Joint Forest Management Area

154
Andhra Pradesh State of Forest - 2012
7.1 INTRODUCTION
There is unanimous opinion that the forest fires are to be controlled if not completely eliminated. For last several
decades attempts have been made to prevent forest fires but the success was to a limited extent. Andhra Pradesh has an
area of about 63,814 Km2 of forest land under the control of Forest Department. Out of the above, excluding an area of
about 350 Km2 of mangrove vegetation, the rest of the forest area is prone to fires. The fires occurring in Andhra Pradesh
(AP) are only ground fires in nature. The ground fire or surface fire occurs between November and May in the state as
seen from MODIS satellite images. March is the most susceptible month for the forest fires. The ground fire causes wide
spread damage to the ground flora and fauna. The young regeneration is seriously affected by the fire. There are no two
opinions that elimination of forest fire, which is mostly manmade, is a prerequisite for a healthy forest in the state.
7.2 FOREST FIRE LOSSES
a. National Level:
There are several papers about the forest fire in India. It is reported that during the Sixth Five-Year Plan (1980-85) in
all 17,852 number of fire incidents were reported affecting an area of 5.7 million Ha at an annual average of 1.14 million Ha
(Srivastava, 1989). Extrapolations of fire data in two representative areas, i.e. Chandrapur and Haldwani indicate that the
total area burnt annually in the country may range between 2.66 and 13.95 million Ha (Saigal, 1989). As per Ministry of
Environment and Forests, the forest area that is affected by annual fires could be as much as 37 million Ha.
b. State Level:
No definite study has been done in A.P. to estimate the extent of forest
fires and consequent damages. After the MODIS satellite data was made
available by FSI, it was found that 24 percent of the compartments (of the total
number about 18,000) are prone to fire damage to various degrees in the state
leaving balance 76 percent compartments unaffected. Total number of fire
incidents in AP reported through MODIS satellite since 2004 is shown in Table
7.1. The details of Circle wise fire occurrence in Andhra Pradesh is given in
Table 7.2. The Division wise details of fire occurrence in various years in Andhra
Pradesh are given in Table 7.3.
In all 13,835 fire incidents were reported in this period of 9 years. Thus on
an average 1537 fire incidents take place annually in AP. A map of Andhra
Pradesh showing forest fire occurrence between 2004 and 2011 is shown in
Fig 7.1.
CHAPTER – VII
FOREST FIRE IN ANDHRA PRADESH
S.No Year ForestFires
1. 2004 3 3
2. 2005 1084
3. 2006 1581
4. 2007 1929
5. 2008 1444
6. 2009 2454
7. 2010 1840
8. 2011 1113
9. 2012 2357
Total 13835
Table 7.1 :
Table showing the Number of Fire incidents
observed through MODIS Data.
(See Table. 7.4 for Month wise Distribution)

155
Forest fire in Andhra Pradesh
Fig No. 7.1 MAP SHOWING LOCATIONS OF FIRE OCCURANCES IN ANDHRA PRADESH (2004-2012)
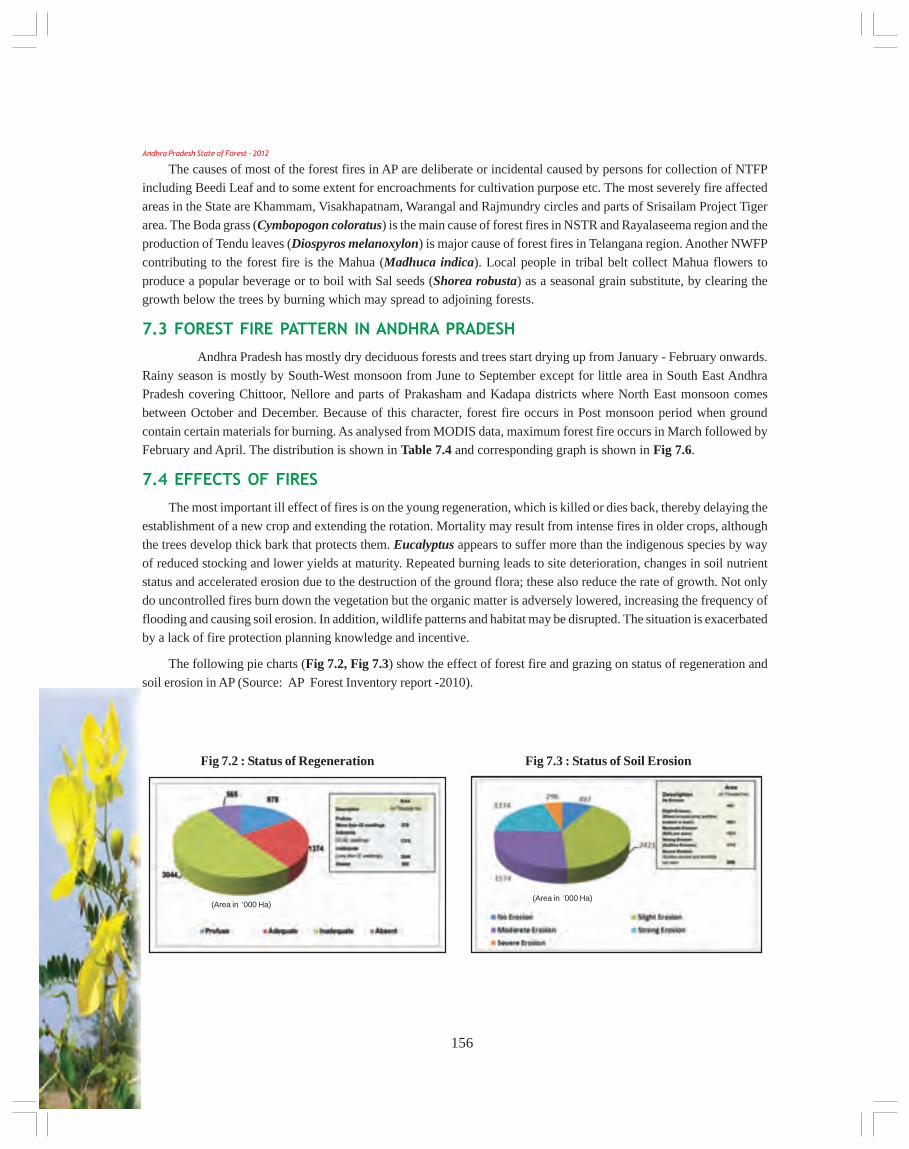
156
Andhra Pradesh State of Forest - 2012
The causes of most of the forest fires in AP are deliberate or incidental caused by persons for collection of NTFPincluding Beedi Leaf and to some extent for encroachments for cultivation purpose etc. The most severely fire affected
areas in the State are Khammam, Visakhapatnam, Warangal and Rajmundry circles and parts of Srisailam Project Tiger
area. The Boda grass (Cymbopogon coloratus) is the main cause of forest fires in NSTR and Rayalaseema region and theproduction of Tendu leaves (Diospyros melanoxylon) is major cause of forest fires in Telangana region. Another NWFP
contributing to the forest fire is the Mahua (Madhuca indica). Local people in tribal belt collect Mahua flowers to
produce a popular beverage or to boil with Sal seeds (Shorea robusta) as a seasonal grain substitute, by clearing thegrowth below the trees by burning which may spread to adjoining forests.
7.3 FOREST FIRE PATTERN IN ANDHRA PRADESH
Andhra Pradesh has mostly dry deciduous forests and trees start drying up from January - February onwards.
Rainy season is mostly by South-West monsoon from June to September except for little area in South East AndhraPradesh covering Chittoor, Nellore and parts of Prakasham and Kadapa districts where North East monsoon comes
between October and December. Because of this character, forest fire occurs in Post monsoon period when ground
contain certain materials for burning. As analysed from MODIS data, maximum forest fire occurs in March followed byFebruary and April. The distribution is shown in Table 7.4 and corresponding graph is shown in Fig 7.6.
7.4 EFFECTS OF FIRES
The most important ill effect of fires is on the young regeneration, which is killed or dies back, thereby delaying the
establishment of a new crop and extending the rotation. Mortality may result from intense fires in older crops, althoughthe trees develop thick bark that protects them. Eucalyptus appears to suffer more than the indigenous species by way
of reduced stocking and lower yields at maturity. Repeated burning leads to site deterioration, changes in soil nutrientstatus and accelerated erosion due to the destruction of the ground flora; these also reduce the rate of growth. Not only
do uncontrolled fires burn down the vegetation but the organic matter is adversely lowered, increasing the frequency of
flooding and causing soil erosion. In addition, wildlife patterns and habitat may be disrupted. The situation is exacerbatedby a lack of fire protection planning knowledge and incentive.
The following pie charts (Fig 7.2, Fig 7.3) show the effect of forest fire and grazing on status of regeneration and
soil erosion in AP (Source: AP Forest Inventory report -2010).
Fig 7.2 : Status of Regeneration Fig 7.3 : Status of Soil Erosion
(Area in ’000 Ha)(Area in ’000 Ha)

157
Table 7.2 : Circlewise Fire Occurances in Andhra Pradesh
S.No Circle 2004 2005 2006 2007 2008 2009 2010 2011 2012 Total
1 KHAMMAM 1 96 220 240 227 490 286 115 319 1994
2 FDPT SRISAILAM 15 175 182 298 211 307 202 173 313 1876
3 WARANGAL 2 119 197 198 224 359 253 86 352 1790
4 RAJAHMUNDRY 1 96 197 221 218 248 254 149 306 1690
5 KURNOOL 1 163 175 191 107 227 213 124 204 1405
6 VISAKAPATNAM 3 114 182 204 85 172 224 43 191 1218
7 TIRUPATI 0 145 141 185 91 178 113 205 159 1217
8 ADILABAD 5 27 70 156 142 270 142 71 309 1192
9 GUNTUR 0 93 137 151 76 130 106 99 130 922
10 ANANTHAPUR 3 51 59 47 37 45 35 31 53 361
11 NIZAMABAD 0 4 16 28 22 26 9 13 21 139
12 HYDERABAD 2 1 5 10 4 2 3 4 0 31
33 1084 1581 1929 1444 2454 1840 1113 2357 13835
Table 7.3 : Divisionwise Fire Occurances in Andhra Pradesh
S.No Circle 2004 2005 2006 2007 2008 2009 2010 2011 2012 Total
1 KAKINADA 1 85 178 189 199 214 228 141 279 1514
2 GIDDALUR 0 83 122 132 63 109 94 72 104 779
3 WARANGAL NORTH 0 60 92 91 91 155 107 47 131 774
4 ACHAMPET 12 52 59 124 89 128 49 52 141 706
5 RAJAMPET 0 83 71 92 62 93 64 105 102 672
6 BADRACHALAM NORTH 0 29 89 83 77 142 90 39 87 636
7 MARKAPUR 1 58 69 89 68 80 74 75 76 590
8 ATMAKUR 2 65 54 85 53 99 79 46 96 579
9 NARSIPATNAM 1 59 54 98 27 80 84 22 91 516
10 KADAPA 0 89 45 50 40 74 79 39 60 476
11 NANDYAL 0 24 73 75 35 80 81 35 68 471
12 PRODDUTUR 1 50 56 66 30 73 53 50 76 455
13 WLM TIRUPATI 0 52 55 80 19 73 33 82 42 436
14 KOTHAGUDEM 1 23 41 26 32 136 38 15 77 389
15 BADRACHALAM SOUTH 0 20 23 45 46 59 82 27 46 348
16 KARIMNAGAR EAST 1 15 13 22 27 60 66 6 108 318
17 WARANGAL SOUTH 0 22 44 30 41 73 27 12 55 304
18 NIRMAL 3 8 12 48 42 87 32 27 44 303
19 WLM WARANGAL 0 18 35 43 49 52 42 15 42 296
20 PADERU 1 27 49 45 20 30 49 10 44 275
21 PALONCHA 0 13 24 44 31 53 44 11 49 269
22 BELLAMPALLY 0 1 22 20 30 50 40 15 73 251
23 KHAMMAM 0 7 20 28 32 58 16 16 31 208
Forest fire in Andhra Pradesh

158
Andhra Pradesh State of Forest - 2012
During the year 2004 a Forest Fire Risk Zonation was carried out using satellite data taking into account certain
parameters like Forest density, distance of habitation, Road, Slope, Aspect etc and maps were generated upto Beat level.These were communicated to field officers for use. However after availability of MODIS fire data, new fire risk zonation
map has been prepared based on the actual fire occurrences.
The Fire Risk Zonation map prepared and communicated based on MODIS data between 2004 and 2012, for the use
of field officers, is shown in Fig 7.4, The Fire Risk Zonation map prepared based on MODIS data between 2004 and 2012for Kakinada Division is shown in Fig 7.5.
24 ANANTHAPUR 2 24 41 13 27 24 24 17 16 188
25 VISAKHAPATNAM 0 14 38 28 21 21 24 5 28 179
26 KAGAZNAGAR 0 6 8 40 7 35 16 6 59 177
27 MANCHERIAL 2 2 10 14 14 32 25 9 65 173
28 CHITTOOR WEST 1 27 18 34 10 21 11 14 37 173
29 JANNARAM 0 9 13 21 12 44 24 6 39 168
30 ELURU 0 7 16 31 18 34 23 8 23 160
31 WLM PALONCHA 0 4 23 14 9 42 16 7 29 144
32 VIZIANAGARAM 0 6 21 19 7 27 37 4 18 139
33 ADILABAD 0 1 5 13 37 22 5 8 29 120
34 NELLORE 0 9 13 18 13 16 10 21 19 119
35 SRIKAKULAM 1 8 20 14 10 14 30 2 10 109
36 CHITTOOR EAST 0 10 15 13 10 12 16 18 15 109
37 KARIMNAGAR WEST 1 4 13 12 16 19 11 6 16 98
38 KAMAREDDY 0 1 3 10 8 8 4 1 11 46
39 NIZAMABAD 0 0 6 11 8 14 2 3 1 45
40 MEDAK 0 3 7 5 5 4 3 8 8 43
41 GUNTUR 0 1 2 1 0 5 2 6 7 24
42 HYDERABAD 0 0 5 7 3 2 2 3 0 22
43 VIJAYAWADA 0 4 3 1 1 0 3 0 4 16
44 MAHABOOBNAGAR 2 1 0 3 1 0 1 1 0 9
45 WLM MEDAK 0 0 0 2 1 0 0 1 1 5
46 KURNOOL 0 0 1 0 2 0 0 0 0 3
47 WLM NSAGAR 0 0 0 0 1 0 0 0 0 1
48 NALGONDA 0 0 0 0 0 0 0 0 0 0
Total 33 1084 1581 1929 1444 2454 1840 1113 2357 13835

159
Fig 7.4
Forest fire in Andhra Pradesh
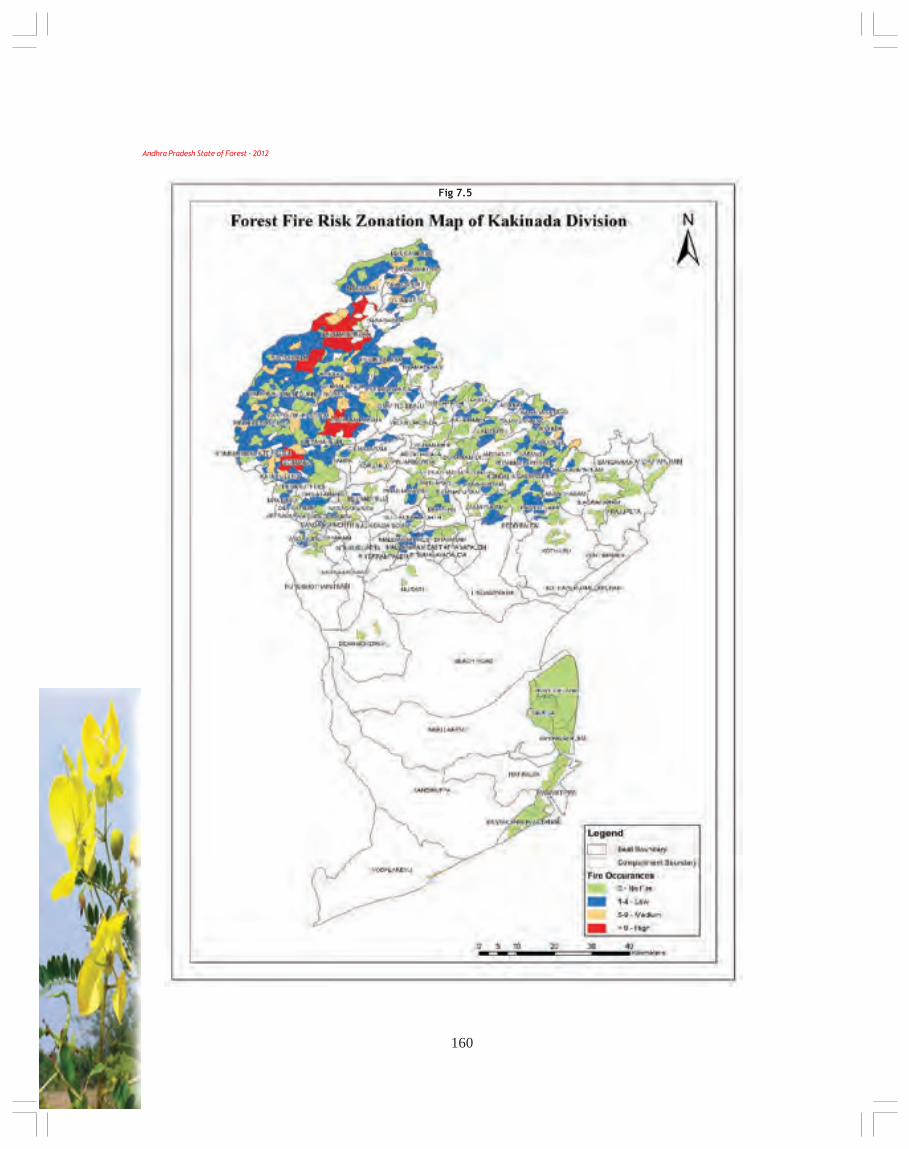
160
Andhra Pradesh State of Forest - 2012
Fig 7.5

161
Fig. 7.6 Month wise Distribution of fire occurances for the years 2004-2012
Table 7.4. Month wise Distribution of fire occurances for the years 2004-2012
Month / Year 2004 2005 2006 2007 2008 2009 2010 2011 2012 Total
January 1 107 14 76 82 156 37 4 54 531
February 1 707 528 572 194 625 255 2 976 3860
March 0 192 540 695 521 1335 1100 508 1079 5970
April 2 61 435 466 141 263 378 326 212 2284
May 2 11 61 120 506 74 62 252 36 1124
June 0 5 3 0 0 1 8 19 0 36
November 3 0 0 0 0 0 0 0 0 3
December 24 1 0 0 0 0 0 2 0 27
Total 33 1084 1581 1929 1444 2454 1840 1113 2357 13835
Protect wild animals from methods of hunting, trapping and fishing that cause extreme, prolonged, and avoidable suffering.- Earth charter & Gandhi page 59
Forest fire in Andhra Pradesh
No
. o
f fi
re i
nci
den
ces
Year

162
Andhra Pradesh State of Forest - 2012
Allowable Error: A systemic error that is ‘acceptable’, both statistically and analytically. The amount of error that can be tolerated
without invalidating the usefulness of the analytic result.
AWiFS: Advanced Wide Field Sensor
Band: A wavelength interval in the electromagnetic spectrum. For example, in IRS images the bands designate specific wavelength
intervals at which images are acquired.
Calibration: Process of comparing an instrument’s measurements with a standard.
Classification: Process of assigning individual pixels of an image to categories, generally on the basis of spectral reflectance
characteristics.
Classification accuracy: The extent to which a manual or automatic processing system correctly identifies selected classes.
Color Composite Image: Color image prepared by projecting individual black-and-white multi-spectral images, each through a
different color filter. When the projected images are superposed, a color composite image results.
Confidence Interval: A confidence interval (CI) is a particular kind of interval estimate of a population parameter. Confidence
intervals are used to indicate the reliability of an estimate. How likely the interval is to contain the parameter is determined by
the confidence level or confidence coefficient. Increasing the desired confidence level will widen the confidence interval,
however the estimated value will be away from the absolute value.
Consumer’s accuracy: It is a measure of the reliability of an output map generated from a classification scheme. It is a statistic that
can tell the user of the map what percentage of a class corresponds to the ground-truthed class.
Contrast: The ratio between the energy emitted or reflected by an object and its immediate surroundings.
Contrast enhancement: Image-processing procedure that improves the contrast ratio of images. The original narrow range of
digital values is expanded to utilize the full range of available digital values.
Contrast ratio: On an image, the ratio of reflectance’s between the brightest and darkest parts of an image.
Contrast stretching: Expanding a measured range of digital numbers in an image to a larger range, to improve the contrast of the
image and its component parts.
Density slicing: Process of converting the continuous gray tones of an image into a series of density intervals, or slices, each
corresponding to a specific digital range. The density slices are then displayed either as uniform gray tones or as colors.
Digital Image Processing: Computer manipulation of the digital-number values of an image.
Digital Number (DN): Value assigned to a pixel in a digital image
Error Matrix: A matrix or table that displays statistics for assessing image classification accuracy by showing the degree of
misclassification among classes.
Errors of Commission: Pixels incorrectly assigned to a particular class that actually belong in other classes.
Errors of Omission: Pixels incorrectly excluded from a particular class.
False color image: An image produced by displaying multiple spectral bands as colors different from the spectral range they were
taken in. A color image where parts of the non-visible EM spectrum are expressed as one or more of the red, green, and blue
components, so that the colors produced by the Earth’s surface do not correspond to normal visual experience. Also called a
false color composite (FCC). The most commonly seen false-color images display the very-near infrared as red, the red as
green, and the green as blue.
Glossary of Technical Terms
163
Forest: Land with tree crown cover (or Equivalent stocking level) of more than 10 % and area of more than 0.5 ha. The trees should
be able to reach a minimum height of 5 m at maturity in situ. May consist of either closed forest formations where trees of
various storeys and undergrowth cover a high proportion of the ground, or open forest formations with a continuous
vegetation cover, in which tree crown cover exceeds 10 %. Young natural stands and all plantations established for forestry
purposes which have yet to reach above criteria are included under forest, as are areas normally forming part of the forest area
which are temporarily un stocked as a result of human intervention or natural causes but which are expected to revert to forest.
Forest Canopy Density: Forest Canopy Density (FCD) refers to the proportion of an area in the field/ground that is covered by
the crown of trees and is expressed in percentage of the total area.
Forest Type: Forest type is defined as a unit of vegetation which possess broad characteristics in physiognomy and structure
sufficiently pronounced to permit its differentiation from other such units (Champion & Seth 1968)
Geographic Information System (GIS): A computer based system for capturing, storing, manipulating, analyzing and displaying
data, which are spatially referenced to the earth.
Global Positioning System (GPS): The Global Positioning System (GPS) is a space-based global navigation satellite system. It
provides reliable positioning, navigation, and timing services to worldwide users on a continuous basis in all weather, day and
night, anywhere on or near the Earth which has an unobstructed view of four or more GPS satellites.
Good Forest and Degraded Forest: Good Forest includes VDF, MDF and OF; degraded forest includes Scrub and Non-Forest.
Green and Barren: Green includes VDF, MDF, OF and Scrub; Barren includes Non-Forest.
Ground control point (GCP): A geographic feature of known location that is recognizable on images and can be used to determine
geometric corrections.
Ground truth: Information acquired by field study for the purpose of calibration and/or verification of remotely sensed data.
Geometric correction: Image-processing procedure that corrects spatial distortions in an image. The geographic correction of
image data to conform to a map projection.
Histogram: A means of expressing the frequency of occurrence of values in a data set within a series of equal ranges/bins, the height
of each bin representing the frequency at which values in the data set fall within the chosen range. A cumulative histogram
expresses the frequency of all values falling within a bin and lower in the range. A smooth curve derived mathematically from
a histogram is termed as probability density function (PDF).
Image: A pictorial representation acquired in any wavelength of the electromagnetic spectrum. Although image is a general term, it
is commonly restricted to representations acquired by non-photographic methods.
Imagery: The products of image forming instruments.
Interpretation: The process in which a person extracts information from an image.
Interpretation key: Characteristic or combination of characteristics that enable an interpreter to identify an object on an image.
Kappa coefficient: A statistical measure of the agreement, beyond chance, between two maps (e.g. output map of classification
and ground-truthed map). It is represented by the symbol kappa hat or Khat.
Mangroves : Salt tolerant ever green forest ecosystem found mainly in tropical and sub – tropical coastal and / or inter tidal regions.
Medium Dense Forest: All lands with forest cover having a canopy density between 70-40% Multi-spectral classification:
Identification of terrain categories by digital processing of data acquired by multi-spectral scanners.
Multi-spectral scanner: Scanner system that simultaneously acquires images of the same scene at different wavelengths.
Mid-infrared (MIR): The range of EM wavelengths from 8 to 14 micrometers dominated by emission of thermally generated
radiation from materials; also known as thermal infrared.
NDVI: The Normalized Difference Vegetation Index (NDVI) is defined as the ratio of the difference in the NIR & Red radiance
values to the sum of the NIR & Red radiance values.
Glossary of Technical Terms

164
Andhra Pradesh State of Forest - 2012
NDWI: The Normalized Difference Water Index (NDVI) is defined as the ratio of the difference in the SWIR and NIR radiance
values to the sum of the SWIR and NIR radiance values.
Near infrared (NIR): The shorter wavelength range of the infrared region of the EM spectrum, from 0.7 to 2.5 m. It is often divided
into very-near infrared (VNIR) covering the range accessible to photographic emulsions (0.7 to 1.0m), and the short wavelength
infrared (SWIR) covering the remainder of the NIR atmospheric window from 1.0 to 2.5m.
Noise: Random or repetitive events that obscure or interfere with the desired information.
Open Forest: Lands with forest cover having a canopy density between 40 to 10%.
Overall accuracy: The percentage of correctly classified pixels. It is a good measure of the accuracy of a classification scheme as
it is not biased towards the smaller classes.
Path and Row: Path is an approximate specific orbital track of a Satellite which may vary due to drift and other factors. Row refers
to the latitudinal center line of a frame of imagery.
Pixel: Contraction of picture element
Producer’s accuracy: A measure of the accuracy of a particular classification scheme. It shows what percentage of a particular
ground class was correctly classified.
Protected Forest (PF): An area notified under the provisions of the Indian Forest Act or other State Forest Acts, having limited
degree of protection. In protected forest all activities are permitted unless prohibited.
Radiometric correction: Calibration of recorded radiance values reflected from (or emitted by) the ground scene.
Radiometric Resolution: The expected spread of variation in each estimate of scene reflectivity as observed in an image. Smaller
radiometric resolution is “better”. Radiometric resolution for a given image may be improved by averaging, but at the cost of
spatial resolution.
Raster format: A means of representing spatial data in the from of a grid of DN, each line of which can be used to modulate the lines
of a video raster.
Ratio image: An image prepared by processing digital multi-spectral data as follows: for each pixel, the value for one band is
divided by that of another. The resulting digital values are displayed as an image.
Remote sensing: Collection and interpretation of information about an object with an instrument without being in physical
contact with the object.
Reserved Forests (RF): An area so constituted under the provisions of the Indian Forest Act or other State Forest Acts, having full
degree of protection. In Reserved forests all activities are prohibited unless permitted.
SAVI: Soil-Adjusted Vegetation Index. A vegetation index that accounts for, and minimizes, the effect of soil background conditions.
Scene: As the satellite moves along its path, the observatory instruments are continuously scanning the terrain below. The
instrument signals are transmitted to Earth and correlated with telemetry ephemeris data to form individual framed images.
During this process, the continuous data are segmented into individual frames of data known as scenes
Scrub: Degraded forest lands having canopy density less than 10% and areas with dwarf and stunted growth.
Spatial resolution: Ability to separate closely spaced objects on an image or photograph. A measure of the smallest angular or
linear separation between two objects usually expressed in radians or meters.
Spectral resolution: The ability of a sensing system to resolve or differentiate electromagnetic radiations of different frequencies.
Standard Deviation and Variance: In probability theory and statistics, the variance of a random variable or distribution is the
expected, or mean, value of the square of the deviation of that variable from its expected value or mean. Thus the variance is
a measure of the amount of variation within the values of that variable, taking account of all possible values and their
probabilities or weightings (not just the extremes which give the range). The standard deviation of a statistical population, a
data set, or a probability distribution is the square root of its variance. Standard deviation is a widely used measure of the
variability or dispersion.

165
Statistic: A statistic is a single measure of some attribute of a sample (e.g. its arithmetic mean value). It is calculated by applying
a function (Statistical algorithm) to the values of the items comprising the sample which are know together as a set of data. A
Statistic as a function of a sample where the function itself is independent of the sample’s distribution; that is, the function
can be stated before realization of the data. The term statistic is used both for the function and for the value of the function
on a given sample.
Stereo pair: Two overlapping images or photographs that may be viewed stereoscopically.
Supervised classification: Digital-information extraction technique in which the operator provides training-site information that
the computer uses to assign pixels to categories
Tone: Each distinguishable shade of gray from white to black on an image
Training area: A sample of the Earth’s surface with known properties; the statistics of the imaged data within the area are used to
determine decision boundaries in classification.
Training site: Area of terrain with known properties or characteristics that is used in supervised classification.
Tree: A woody perennial with a single main stem, or in the case of coppice with several stems, having a more or less definite crown,
having diameter 10 cm or more at breast height (1.37m). If there are stems below 1.37 m height then individual branch/stem
which has attained 10 cm DBH will be considered as individual tree. It also includes bamboo, palms, coconut, neem, peepal,
fruit trees etc.
Unsupervised classification: Digital information extraction technique in which the computer assigns pixels to categories with no
instructions from the operator.
Vegetation Canopy: The layers of vegetation above the level of the ground, formed by the leaves of the plants.
Very Dense Forest: All lands with forest cover having a canopy density more than 70%
Visible radiation: Energy at wavelengths from 0.4 to 0.7mm that is detectable by the human eye.
Glossary of Technical Terms

166
Andhra Pradesh State of Forest - 2012
“The President in Washington sends word that he wishes to buy our land.But how can you buy or sell the sky? the land? The idea is strange to us. If wedo not own the freshness of the air and the sparkle of the water, how canyou buy them?
Every part of the earth is sacred to my people. Every shining pine needle,every sandy shore, every mist in the dark woods, every meadow, everyhumming insect; all are holy in the memory and experience of my people.
We know the sap which courses through the trees as we know the blood that courses through ourveins. We are part of the earth and it is part of us. The perfumed flowers are our sisters. The bear,the deer, the great eagle, these are our brothers. The rocky crests, the dew in the meadow, the bodyheat of the pony, and man all belong to the same family.
The shining water that moves in the streams and rivers is not just water, but the blood of ourancestors. If we sell you our land, you must remember that it is sacred. Each glossy reflection in theclear waters of the lakes tells of events and memories in the life of my people. The water’s murmuris the voice of my father’s father.
The rivers are our brothers. They quench our thirst. They carry our canoes and feed our children.So you must give the rivers the kindness that you would give any brother.
If we sell you our land, remember that the air is precious to us, that the air shares its spirit with allthe life that it supports. The wind that gave our grandfather his first breath also received his lastsigh. The wind also gives our children the spirit of life. So if we sell our land, you must keep it apartand sacred, as a place where man can go to taste the wind that is sweetened by the meadowflowers.
Will you teach your children what we have taught our children? That the earth is our mother?What befalls the earth befalls all the sons of the earth.
This we know: the earth does not belong to man, man belongs to the earth. All things are connectedlike the blood that unites us all. Man did not weave the web of life, he is merely a strand in it.Whatever he does to the web, he does to himself.
One thing we know: our God is also your God. The earth is precious to him and to harm the earthis to heap contempt on its creator.
Your destiny is a mystery to us. What will happen when the buffalo are all slaughtered? The wildhorses tamed? What will happen when the secret corners of the forest are heavy with the scent ofmany men and the view of the ripe hills is blotted with talking wires? Where will the thicket be?Gone! Where will the eagle be? Gone! And what is to say goodbye to the swift pony and then hunt?The end of living and the beginning of survival.
When the last red man has vanished with this wilderness and his memory is only the shadow of acloud moving across the prairie, will these shores and forests still be here? Will there be any of thespirit of my people left?
We love this earth as a new born loves its mother’s heartbeat. So, if we sell you our land, love it aswe have loved it. Care for it, as we have cared for it. Hold in your mind the memory of the land asit is when you receive it. Preserve the land for all children, and love it, as God loves us.
As we are part of the land, you too are part of the land. This earth is precious to us. It is alsoprecious to you.
One thing we know - there is only one God. No man, be he Red man or White man, can be apart.We ARE all brothers after all.”
SEATTLE CHIEF’S LETTER TO ALL(Written in 1852 to US President)