how much information is enough? much information is enough? green global ncap labelling / green...
TRANSCRIPT

How Much Information Is Enough?
Green Global NCAP Labelling / Green Scoring Workshop Global Fuel Economy Initiative
Gloria EspositoProgramme ManagerLow Carbon Vehicle [email protected]
Information processing theories suggest there is a limit to the amount of information a human can absorb over a specific period of time. (Born et al 2011)
How does the information shown on fuel economy labels differ internationally?
Outline of research studies exploring presentation of environmental information on product labels
Examples of multi criteria environmental labels What insights have been gained from LowCVP research Conclusion
Outline of Presentation
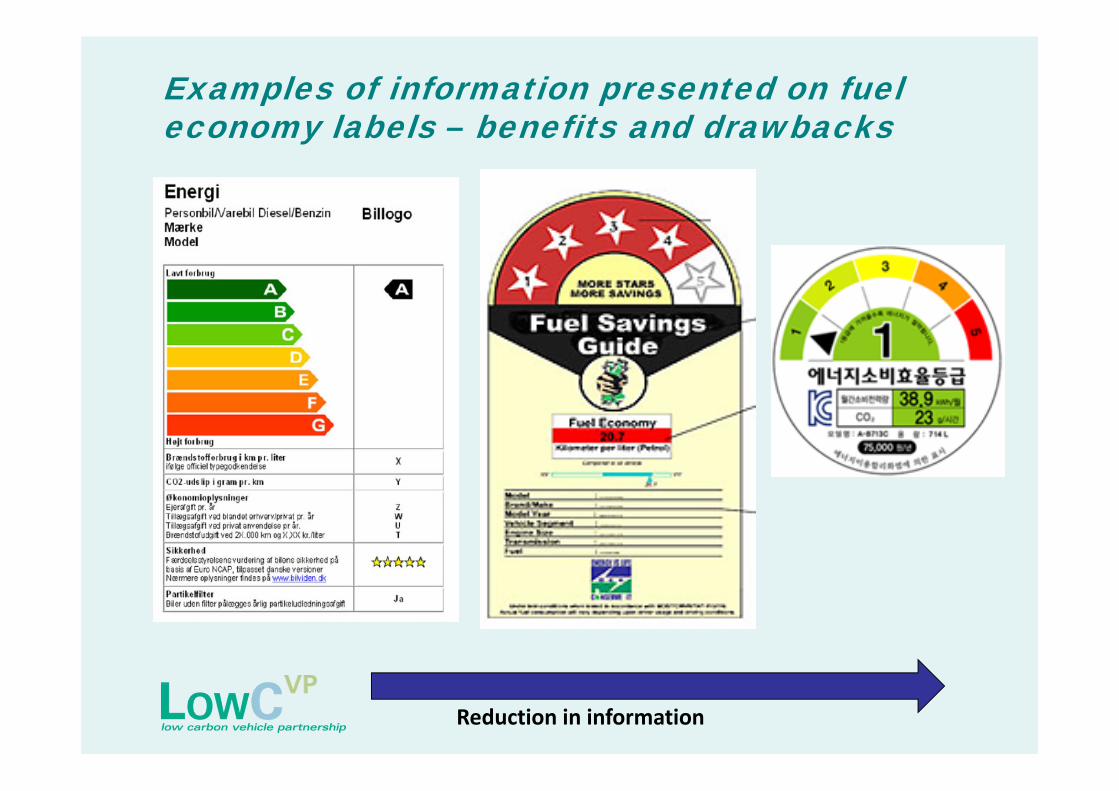
Examples of information presented on fuel economy labels – benefits and drawbacks
Reduction in information
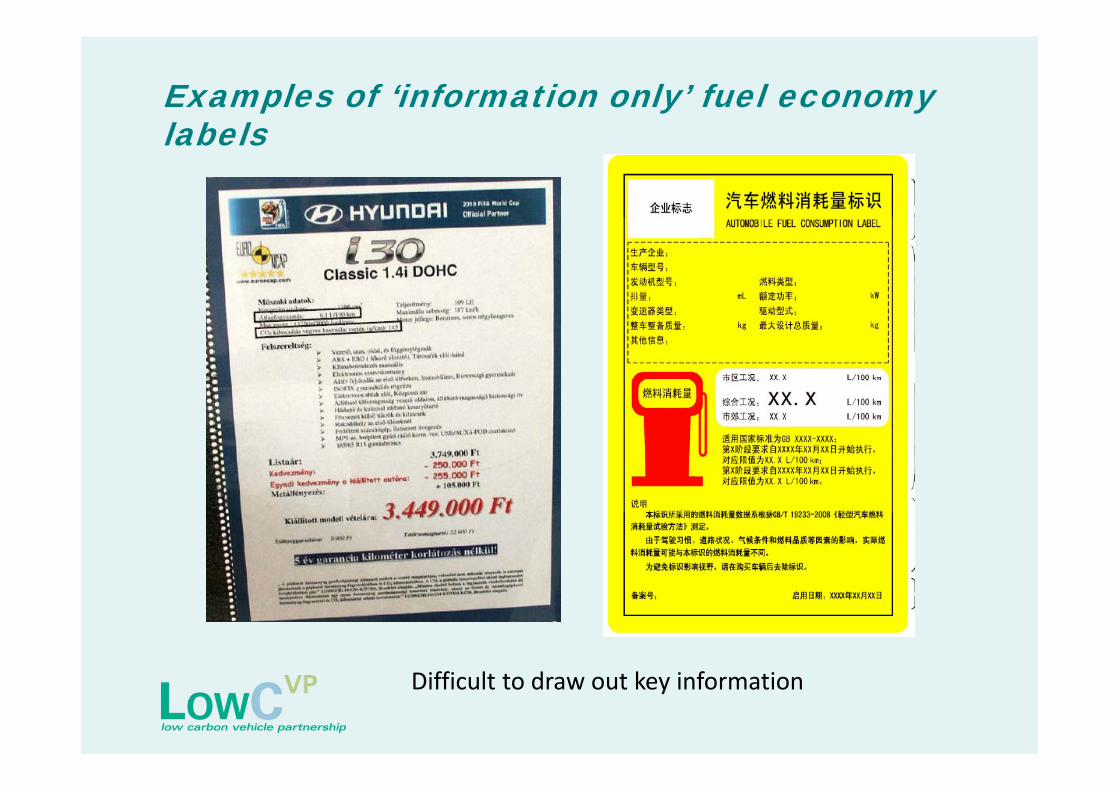
Examples of ‘information only’ fuel economy labels
Difficult to draw out key information
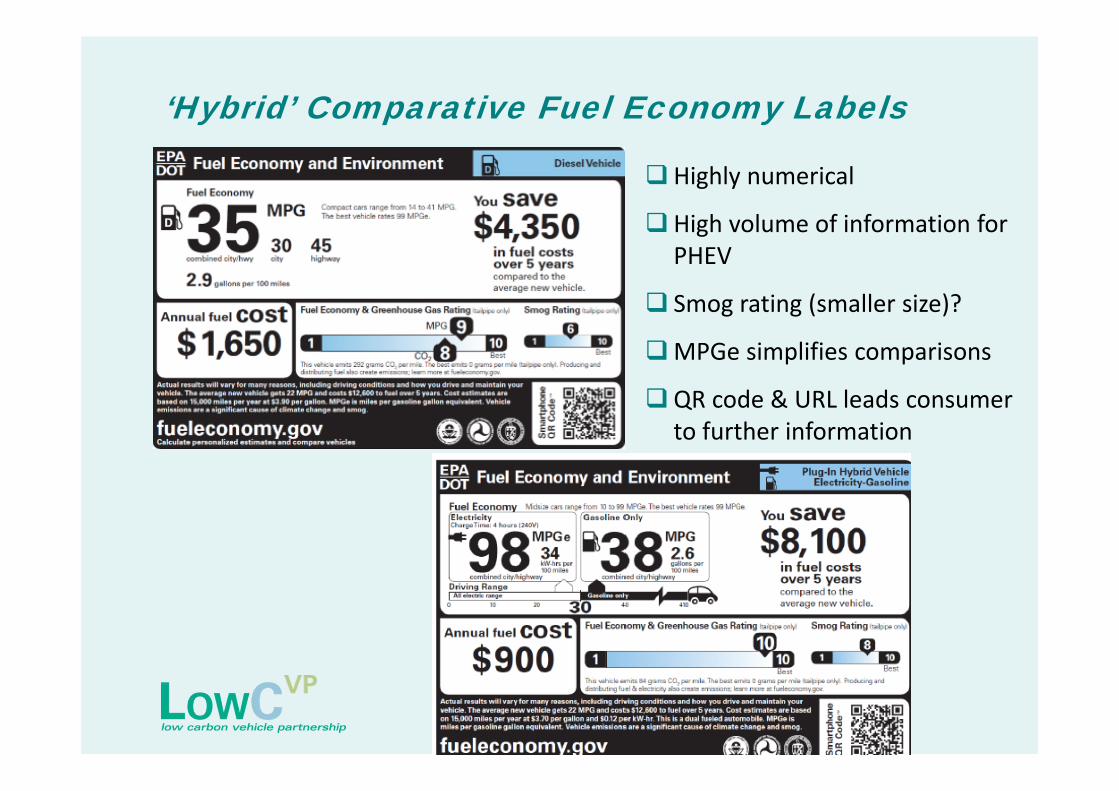
‘Hybrid’ Comparative Fuel Economy Labels
Highly numerical
High volume of information for PHEV
Smog rating (smaller size)?
MPGe simplifies comparisons
QR code & URL leads consumer to further information

Comparison of fuel economy labelsPresentation of CO2 emissions /fuel economy Country
Comparative colour codedUK, Germany, France, Spain, Finland, Belgium, Denmark
Comparative scale system US, New Zealand, Korea, IndiaInformation only Hungary, ChinaAdditional InformationRunning cost (fuel/road tax) US, Denmark UK, Germany, FinlandAir quality rating system USExhaust emission class AustriaDriver behaviour impact on fuel UK, US, Belgium, Denmark, France, Hungry SpainElectricity consumption for EVs US, Germany, UKCO2 from electricity consumption SwitzerlandEuro NCAP Denmark, HungaryQR code USWebsite for further information US, New Zealand, UK, Belgium
Fuel economy ‐ combination of mandatory and voluntary information ‐ how this is presented varies internationally
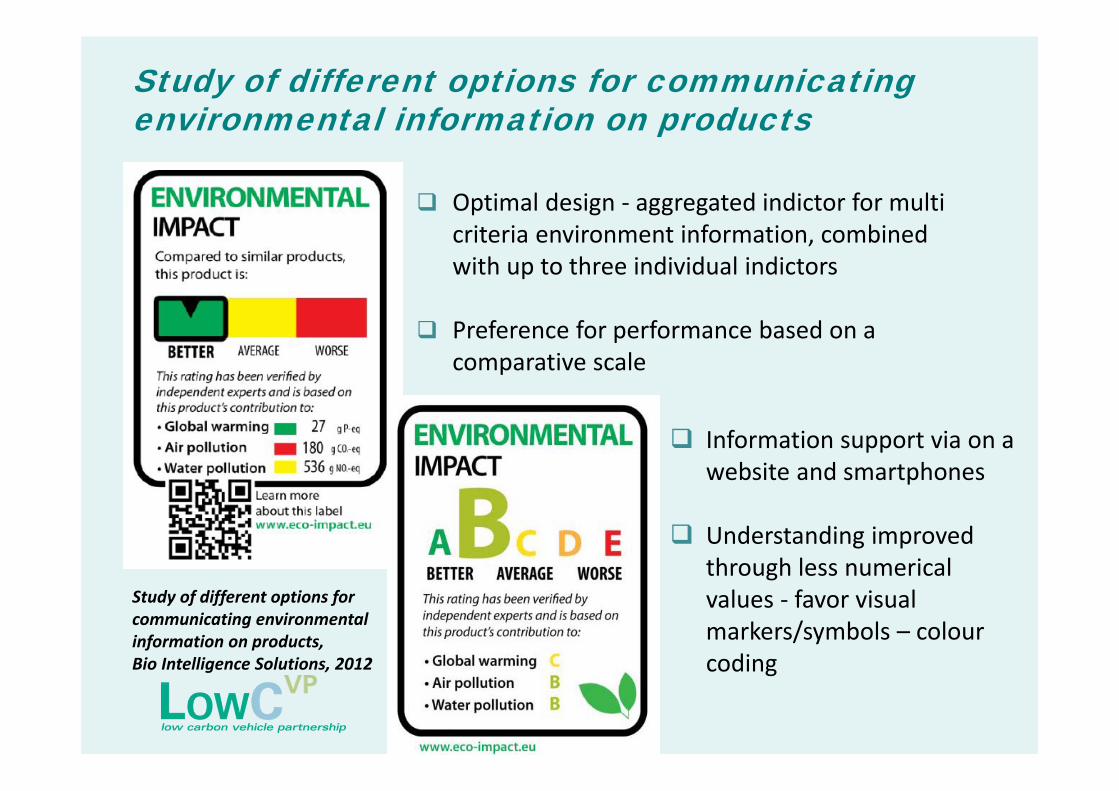
Study of different options for communicating environmental information on products
Optimal design ‐ aggregated indictor for multi criteria environment information, combined with up to three individual indictors
Preference for performance based on a comparative scale
Information support via on a website and smartphones
Understanding improved through less numerical values ‐ favor visual markers/symbols – colourcoding
Study of different options for communicating environmental information on products, Bio Intelligence Solutions, 2012
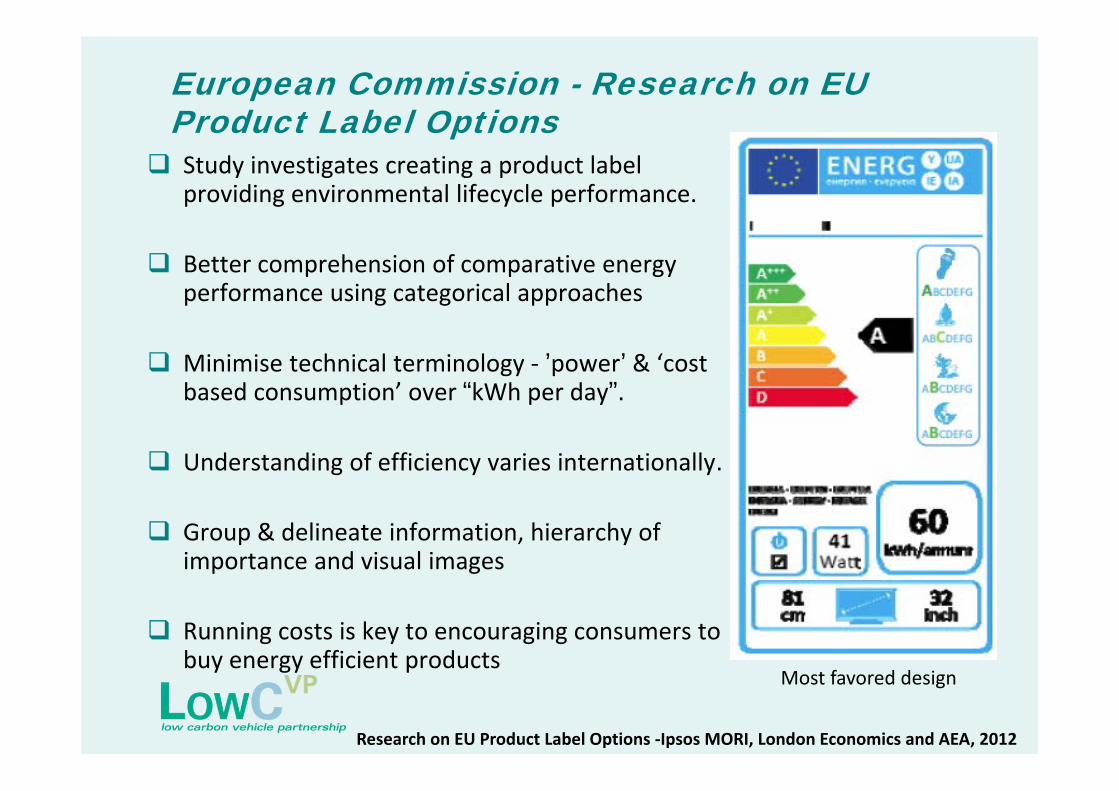
European Commission - Research on EU Product Label Options Study investigates creating a product label
providing environmental lifecycle performance.
Better comprehension of comparative energy performance using categorical approaches
Minimise technical terminology ‐ ’power’ & ‘cost based consumption’ over “kWh per day”.
Understanding of efficiency varies internationally.
Group & delineate information, hierarchy of importance and visual images
Running costs is key to encouraging consumers to buy energy efficient products
Most favored design
Research on EU Product Label Options ‐Ipsos MORI, London Economics and AEA, 2012
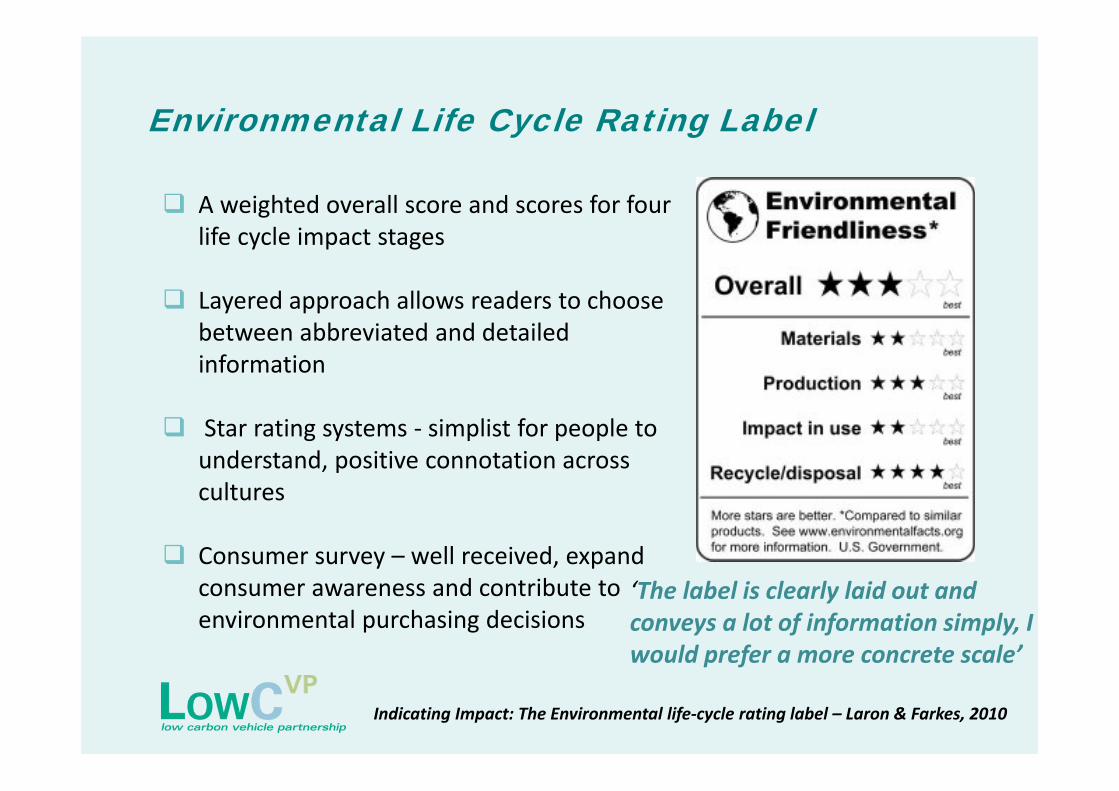
Environmental Life Cycle Rating Label
Indicating Impact: The Environmental life‐cycle rating label – Laron & Farkes, 2010
A weighted overall score and scores for four life cycle impact stages
Layered approach allows readers to choose between abbreviated and detailed information
Star rating systems ‐ simplist for people to understand, positive connotation across cultures
Consumer survey – well received, expand consumer awareness and contribute to environmental purchasing decisions
‘The label is clearly laid out and conveys a lot of information simply, I would prefer a more concrete scale’

Do any of these labels risk information overload?
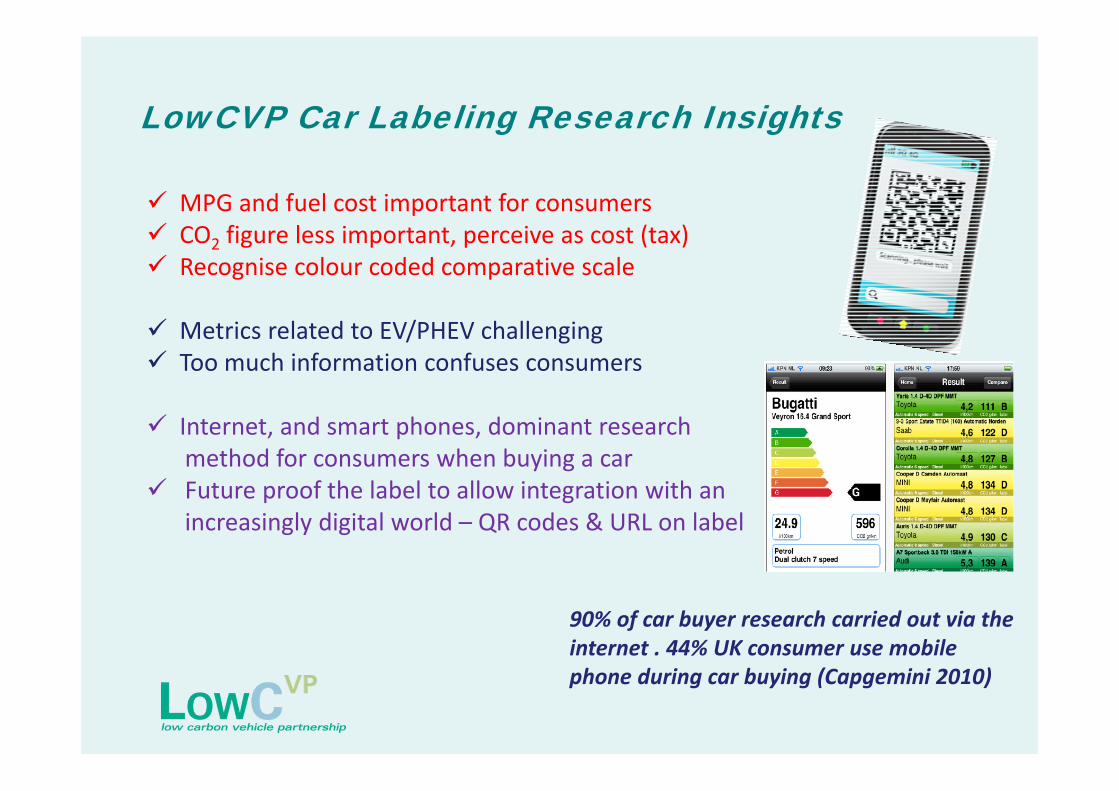
LowCVP Car Labeling Research Insights
MPG and fuel cost important for consumers CO2 figure less important, perceive as cost (tax) Recognise colour coded comparative scale
Metrics related to EV/PHEV challenging Too much information confuses consumers
Internet, and smart phones, dominant research method for consumers when buying a car
Future proof the label to allow integration with an increasingly digital world – QR codes & URL on label
90% of car buyer research carried out via the internet . 44% UK consumer use mobile phone during car buying (Capgemini 2010)

Conclusion – The Winning Elements
Balance and prioritise information most likely to influence consumer purchasing decision:
Fuel consumption, Fuel Cost, Comparative Performance, Environmental
Information must be clear, simple and ease cognitive processing Support for aggregation of multiple environmental indictors Comparative information ‐ works well using categorised colour
coding or stars, cost metric easily understood Links to websites can provide consumers with additional information Care with metrics & terminology, complexity brings confusion,
consider cultural differences Testing new labels with consumers is essential – different countries
& demographics