homelessness in oregon
TRANSCRIPT
March 2019
Prepared for:
The Oregon Community Foundation
FINAL REPORT
HOMELESSNESS IN OREGON
A Review of Trends, Causes, and Policy Options
Acknowledgments This report was written by John Tapogna and Madeline Baron with research assistance from Ryan Knapp, Jeff Lane, and Virginia Wiltshire-Gordon, and editorial support from Laura Knudson. The authors would also like to recognize Ingrid Gould Ellen and Brendan O’Flaherty—editors of How to House the Homeless (Russell Sage Foundation, 2010). The policy framework advanced in this report draws heavily on their book's insights.
The authors are solely responsible for any errors or omissions.

Executive Summary
i
Executive Summary
Purpose of the Report Oregon’s homeless crisis stretches across the state. Jackson County’s homeless population recently hit a seven-year high. During 2017-2018, the number of adults living on the streets, under bridges, or in cars increased by 25.8 percent in Central Oregon. Conditions faced by Lane County’s growing unsheltered homeless population triggered the threat of a lawsuit. And news reports have profiled challenges from Astoria to Ontario.
The homeless crisis dominated the 2018 state and local elections. Rival candidates debated camping regulations, sit-lie ordinances, street cleanups, and the use of jails as shelters. Post-election, Governor Kate Brown has advanced a range of initiatives aimed at preventing and addressing homelessness—with a special emphasis on children, veterans, and the chronically homeless. Meanwhile, cities and counties across the state—building on federal and state programs—are crafting localized responses to address the crisis.
This report seeks to advance the policy discussion for a problem that some Oregonians consider intractable. With a statewide focus, it reviews the literature on homelessness determinants, explores trends in homelessness across the state, puts the challenges into a broader national context, and organizes possible responses into a four-part policy framework.
Homelessness in Oregon: Determinants and Recent Trends Homelessness has declined since the Great Recession but not as much as it would have in a better functioning housing market. Oregon’s high rents make the crisis more severe than those in most states and, left unabated, they will contribute to a growing homeless population going forward. Like its West Coast neighbors, Oregon has not expanded its emergency shelter capacity to match the size of its homeless population and, in 2018, had the second highest rate of unsheltered homeless people in the country. The state also had the third highest rate of chronically homeless people in the U.S.
General trends and determinants of homelessness include the following:
§ Oregon has disproportionately large homeless populations. Oregon’s general population represents 1.3 percent of the total U.S. population. By contrast, the state’s homeless population is proportionately twice as large, reaching 2.6 percent of the U.S. total. The state’s chronically homeless population represents 4.5 percent of U.S. total, and its unsheltered population is 4.6 percent of the national total. Oregon reports 3,361 individuals in an especially vulnerable subgroup—people who are both unsheltered

Executive Summary
ii
and chronically homeless. They make up 5.6 percent of the U.S. total—more than four times the rate of Oregon’s share of the U.S. total population.
§ Homeless counts are down since the Great Recession but have edged up recently for two key subpopulations—the unsheltered homeless and the chronically homeless. Statewide, the total number of people experiencing homelessness declined by about 4,364 people from 2007 through 2015 but edged up during 2015-2017. Oregon’s unsheltered populations declined through 2013, was stable during 2013-2015, and then increased by 572 people during 2015-2017. The number of chronically homeless individuals—those who are homeless for more than a year or who face repeated spells of homelessness over time—remains above levels recorded during the recession.
§ High rents are to blame for the severity of the state’s homelessness crisis. Economists John Quigley and Steven Raphael were among the first to demonstrate that housing affordability—rather than personal circumstances—is the key to predicting the relative severity of homelessness across the United States.1 They estimated that a 10.0 percent increase in rent leads to a 13.6 percent increase in the rate of homelessness. Consistent with Quigley and Raphael’s findings, our analysis indicates that median rents across U.S. states explains 43 percent of the variance in rates of homelessness in 2017.
§ Homelessness disproportionately affects many racial or ethnic minority groups. The African American share of the homeless population (6.0 percent) is more than three times their share of the general population (1.9 percent). Similarly, the share of homeless individuals who identify as American Indian/Alaskan Native is 3.5 times this group’s representation in the general population, and the share of homeless individuals who identify as Native Hawaiian/Pacific Islander is 3.25 times this group’s representation in the general population. The racial disparities in homelessness found in Oregon mirror national data.
§ Housing instability affects many more children than conventional homeless counts would suggest. The U.S. Department of Housing and Urban Development (HUD) point-in-time (PIT) counts show about 2,500 children are experiencing homelessness in recent years. By contrast, the Oregon Department of Education (ODE) reports almost 22,000 in the 2017-18 school year. Homeless students under the ODE definition are those who lack a “fixed, regular, or adequate nighttime residence.” This count incudes sheltered and unsheltered students who are included in the HUD PIT definition but
1 John M. Quigley and Steven Raphael, “The Economics of Homelessness: The Evidence from North America,” European Journal of Housing Policy 1, no. 3 (2001): 323-336.

Executive Summary
iii
additionally extends to students who are doubled-up in shared housing, living in a hotel or motel, or who are unaccompanied by adults.
Comprehensive Framework of Responses to Homelessness The report’s policy discussion is organized around a four-part framework. The first set of policies affect regional housing production and describes how progress on that front could lead to small reductions in the likelihood of homelessness for large numbers of households. Next, the report outlines programs designed to serve low-income, cost-burdened renters, most of whom are not currently homeless. A third category of programming narrowly targets increasingly intensive and expensive interventions to homeless individuals and families with the highest needs. Lastly, the report considers the role of emergency shelters in the crisis system.
§ Accelerated housing production—at all price points—would make small reductions in the likelihood of homelessness for large numbers of people. The underproduction of housing has contributed to the region’s rising rents which in turn has increased the severity of the homelessness crisis. Over the 2010-2016 time period, Oregon created only 63 new housing units for every 100 households that formed during the time period, increasing competition for housing. This underproduction has put upward pressure on housing costs.
A supply strategy would start with a top-line production goal which would require returning to annual production levels that keep pace with household formation while simultaneously adding production to address the legacy of decades of underbuilding. Accelerating production requires a re-examination of the regulatory environment to reduce development barriers—both what’s in code, as well as the processes by which the regulations are implemented.
§ Means-tested rent subsidies—like HUD’s Housing Choice Voucher (HCV) program—can help to prevent homelessness but are in short supply. Federal, state, and local governments operate a number of programs designed to reduce the cost of housing for low-income households. The largest subsidy program is the HCV program, which caps rent payments at 30 percent of the tenant’s income. Gold-standard, controlled-trial experiments have shown that vouchers provided at emergency shelters reduce the proportion of families with subsequent shelter stays by three-fourths.
The Center on Budget and Policy Priorities calculated that about 209,000 low-income, renter households in Oregon received federal assistance or were in need of it in 2016.2 Of those, slightly more than one-quarter—56,000 households—received assistance.
2 CBPP defines low-income as households with incomes below 80 percent of their area median.
Executive Summary
iv
The remaining 153,000 households did not. These unassisted, low-income households paid more than one-half of their income for rent and utilities and were thus at measurable risk of homelessness. Extending federal assistance to these households would have cost more than $1 billion in 2016.
§ Targeted, intensive services for high-cost, high-needs individuals are promising and can draw on new analytic tools. Coordinated, national initiatives to end chronic homelessness—typically involving the highest need populations—started in the early 2000s. Permanent supportive housing (PSH), the recognized best practice, provides rent assistance with no time limit and supportive services focused on mental health, substance abuse treatment, and employment.
Expansion of PSH services is already high on the state’s homeless policy agenda. In December 2018, a Statewide Supportive Housing Strategy Workgroup (SSHSW)—jointly sponsored by the Oregon Health Authority (OHA) and Oregon Housing and Community Services (OHCS)—issued its PSH recommendations, including a call for capital to build new units.3 The state’s PIT count of chronically homeless individuals gives a rough sense of need.
§ Emergency shelters are the policy of last resort. Effective shelter system management diverts entries if safe housing alternatives exists, provides temporary access to a crisis bed, and offers a gateway to permanent housing. Oregon’s tight housing market has overwhelmed the crisis system: high rents put more households into cost-burdened situations, and personal crises pushed some of those severely cost-burdened households into homelessness. At the same time, the evidence-based solution to housing re-entry—deep, sustained rental subsidies—were expensive and in short supply. Inflow to shelters exceeded outflows into permanent housing, and visible, unsheltered homelessness edged up across the state.
No standard formulas exist to inform the system’s expansion. Better progress on the state’s vision of ending chronic homelessness would free up emergency shelter capacity. That’s a necessary first step. Deeper analysis of Homeless Management Information System (HMIS) data might yield insights into patterns of shelter use, identify frequent users, offer ideas on how to further reduce the region’s already below-average shelter spells, and boost capacity. The situation also calls for alternative shelter and support models (e.g., relocation centers, tiny home villages, mobile hygiene clinics, and storage facilities for personal belongings).
3 Oregon Housing and Community Services, “Oregon Statewide Supportive Housing Strategy Workgroup: Permanent Supportive Housing Framework and Recommendations,” www.oregon.gov/ohcs/DO/sshwg/12-05-2018-Oregon-SSHSW-Framework-Recommendations.pdf, (December 5, 2018).

Executive Summary
v
Where Do We Go from Here? Oregon’s policy discussion might improve if homelessness were described as two, related crises. One crisis affects a population of individuals with highly challenging personal circumstances who will struggle to remain housed absent sustained, intensive support. A second crisis affects more than 150,000 households: the short-term homeless plus the growing numbers of severely cost-burdened renters on the verge of homelessness. The first crisis, while challenging, is within the scope of traditional, local homeless agencies to address and solve with additional resources and efficiencies. The second crisis is not. Meaningful progress there would require action by a much broader set of public, private, local, state, and federal actors.
The following recommendations should be considered reinforcements of—and complements to—strong work that has been underway for more than a decade serving some of Oregon’s most vulnerable populations.
1. Accelerate housing supply at all price points. A dysfunctional, undersupplied housing market is the root of Oregon’s homeless crisis. If the state continues the practice of building 63 housing units for every new 100 households formed, rents would continue to rise, vacancy rates would fall, and the effectiveness of all the following recommendations in this report would be diminished.
Future homelessness reduction strategies would be appropriately scoped if they articulated broad housing production goals and associated rent and vacancy rate targets. Appropriately scoped plans would pull more actors to the table: planning agencies that design and oversee housing regulations, permitting agencies that help determine the pace and nature of housing development, state legislators with land-use regulatory oversight responsibilities, and the region’s Congressional delegation who help determine the scope of federal rental assistance.
Expanded plans by themselves would do nothing to ease the homelessness crisis. Once the undersupply problem is broadly accepted, the work would turn to politically difficult implementation. Local politics work against accelerated housing supply responses. Current residents usually like their neighborhoods the way they are. To overcome the opposition, localities would need to hold themselves accountable to clear, broadly disseminated production goals; prune land-use regulations that don’t serve a clear health, safety, or environmental protection purpose; accelerate permit process timetables; explore little-used but promising policies such as land-value or split-rate taxes; and cede regulatory power to the state for some zoning decisions.

Executive Summary
vi
On the latter point, the 2019 Legislature appears poised to act with state-level concepts that could ban single-family zoning in larger communities and require higher housing density along transit corridors. State lawmakers could extend their housing policy packages to provide fiscal rewards and penalties tied to housing goals.
2. Increase the supply of affordable housing units. Rent-restricted units, regardless of what income bracket they target, provide stable housing for people who need it. They are also an important component of any comprehensive approach to addressing homelessness. Rent vouchers stretch further when they are used to buy down rent from 60 percent of median family income (MFI) to 30 percent MFI, than when they are buying down market rate rent. Moreover, moving people into units that more closely match their financial capacity frees up lower-cost market-rate and other affordable units to those who may need them more—a benefit that reverberates through the entire housing continuum. In the past, rent-restricted units were primarily federally funded, but those resources have diminished and are insufficient to meet the regional need. Local revenue-raising efforts are important steps. To ensure that those resources go as far as they can, local governments should evaluate opportunities for additional incentives, such as state-enabled tax abatement programs, fee waivers or reductions, and land write-downs for affordable units. They should also identify and remove regulatory barriers that drive development costs up or unintentionally reduce the number of units possible on a site. These include costly parking requirements, building height and bulk restrictions, design guidelines, and requirements for ground-floor non-residential uses.
3. Strengthen connections between the affordable housing and homeless services sectors. Two sectors that operate a range of related, interdependent programming could improve coordination. For example, local governments could revisit their affordable housing screening guidelines which sometimes penalize families and individuals with low credit scores or evictions—rendering too many people ineligible. Localities should look into innovative programs like Come Home NYC—a rent guarantee program that reduces a landlord’s risk of accepting an application from a homeless family. And agencies could also consider targeting their limited, local rent subsidy dollars to help further reduce the rent of tenants in units built with the Low Income Housing Tax Credit (LIHTC) program.
4. Expand and add analytic rigor to the effort to end chronic homelessness. One-half of the country’s chronically homeless people live in four states: Oregon, California, Washington, and Hawaii. Given the unusually high concentration, public agencies and nonprofits across these states should partner to gain a much deeper understanding of the barriers faced by the West’s long-term homeless.
Executive Summary
vii
PSH is the best policy response for a share of the chronic population. But the programming is expensive and, as broadly implemented, has not yet proven to be cost-beneficial. Service agencies will need to invest in better analytic capabilities—like the Silicon Valley Triage Tool—to target the highest cost, highest needs individuals. Lane County has had early success through the Corporation for Supportive Housing’s (CSH) Frequent User Systems Engagement (FUSE) initiative, but agencies have much more to learn in this rapidly evolving service area. Success here would deliver sustained support to the region’s most vulnerable populations, reduce health and public safety expenditures, and free up emergency shelter capacity for more appropriate short stays.
5. Identify populations—in addition to chronically homeless single adults—that supportive housing models could serve cost effectively. Public and nonprofit agencies in a number of regions across the country are testing the costs and benefits of extending supportive housing interventions to families with children. Some of the collaborations are organized under “pay for success” frameworks in which investors commit funding upfront in return for calculable, downstream savings. These demonstrations may yield insights into specific populations (e.g., families involved in the child welfare system) that could be cost-effectively targeted for PSH interventions.
6. Recognize that shallow, temporary subsidies require additional evidence, and enter into partnerships to identify next-generation, low-cost alternatives to the HCV. The federal government’s HCV program is a proven homelessness prevention tool, but it covers only a quarter of eligible households. To spread limited resources to unserved HCV-eligible populations, communities across Oregon have experimented with shallow and temporary rent subsidies. HUD’s Family Options Study delivered disappointing news in this area and showed that long-term vouchers were more effective in reducing future spells of homelessness, improving housing stability, and helping beneficiaries live independently. Shallow, temporary subsidies remain promising but unproven. Here, Oregon would be well-served by recognizing the policy unknowns, partnering with think tanks and communities from across the country, and continuing the investigation for effective, lower-cost alternatives to the HCV. One approach worth a test: target a larger share of federally-funded, long-term vouchers to formerly homeless individuals and shift some locally-funded, short-term vouchers to HCV applicants with less severe needs.
7. Increase the emergency shelter bed inventory to ensure the safety of vulnerable populations. U.S. emergency shelter policy broadly falls into East Coast and West Coast schools. The East Coast approach, driven by climate and past litigation, generally expands its emergency bed capacity to meet the need. The West Coast approach does not tie capacity to need which has led to sizable, unsheltered populations.

Executive Summary
viii
Safety of vulnerable populations, children, women, and adults with disabilities, is the top priority of a crisis system, and Oregon’s bed inventory is too small to ensure that safety. When it comes to expansion, no recommended formulas exist. Neither New York (4.7 percent unsheltered) nor California (68.9 percent unsheltered) are models to replicate. An overbuilt shelter system becomes an expensive, semi-permanent solution for too many individuals and families while an underbuilt system exposes vulnerable populations to unsafe conditions. Adding emergency beds across the state to bring the unsheltered rate to 40 percent would be an appropriate, short-term goal.4
While no one should have to experience unsheltered homelessness, tradeoffs abound in shelter expansion. Every dollar spent on emergency beds is a dollar that could be spent on programming with stronger evidence of improving long-term housing outcomes (e.g., long-term vouchers and permanent supportive housing).
The state will not make progress on homelessness if the hard work is done only by those who directly serve the homeless on a daily basis. The problem is too big for that. Progress will require collective action by a range of actors: public and nonprofit agencies that work not only on homeless issues but also broader housing and land-use regulatory policies; federal partners willing to re-examine and invest in rental assistance; state policymakers who can chart new state roles in housing policy; business leaders who will provide leadership and support strategies; philanthropies willing to convene and invest in research and development; and universities that can lead in research and policy innovation.
4 This would bring Oregon’s statewide unsheltered homeless rate into line with Multnomah County’s rate and close to the U.S, average.

ix
This page intentionally blank
Introduction
ECONorthwest 1
Introduction Oregon’s homeless crisis stretches across the state. Jackson County’s homeless population hit a seven-year high in 2018.5 Central Oregon’s total homeless population was steady during 2017-2018, but the number of unsheltered adults—those living on the streets, under bridges, or in cars—increased by 25.8 percent. In Lane County, a similar upward trend in its unsheltered population triggered the threat of a lawsuit.6 And, in Ontario, homeless individuals and families braced for a frigid, Eastern Oregon winter in a community that lacks a single shelter bed.7
Not surprisingly, given these trends, Oregon’s homeless crisis dominated 2018 state and local elections. Rival candidates found little common ground. They debated camping regulations, sit-lie ordinances, street cleanups, and the use of jails as shelters. Policy price tags ranged from tens of millions to hundreds of millions of dollars. The Oregonian’s Molly Harbarger rightly noted few issues are as complex or inspire as much passion.
The myriad ways that people enter homelessness drive the complexity. A Central Oregon homeless survey asked about 21 different factors, ranging from domestic violence and mental health to unaffordable rent and unemployment. The wide range of possible causes elicits a wide range of policy responses. Governor Kate Brown’s 2019-2021 Governor’s Budget boosts emergency rent assistance, subsidizes the construction of affordable housing, builds permanent supportive housing (PSH) for the chronically homeless,8 increases resources of veteran’s homelessness services, creates incentives to accelerate the supply of market-rate
5 Jamie Parfitt, “New Report Finds Jackson County Homelessness Highest in Seven Years,” KRDV, www.kdrv.com/content/news/New-Report-Finds-Jackson-County-Homelessness-Highest-in-Seven-Years-485277291.html, (June 12, 2018).
6 “City of Eugene threatened with law suit over homeless population issues,” KVAL, www.kval.com/news/local/city-of-eugene-sued-over-homeless-population-issues, (October 5, 2018).
7 Kristine de Leon, “With No Shelters in Town, Homeless Residents are Left to Brave the Cold,” Malheur Enterprise, www.malheurenterprise.com/posts/5114/with-no-shelters-in-town-homeless-residents-are-left-to-brave-the-cold, (December 12, 2018).
8 A ‘‘chronically homeless’’ individual is defined as a homeless individual who a) lives either in a place not meant for human habitation, a safe haven, or an emergency shelter, or in an institutional care facility if the individual has been living in the facility for fewer than 90 days and had been living in a place not meant for human habitation, a safe haven, or an emergency shelter immediately before entering the institutional care facility; b) has been living as described above continuously for at least 12 months, or on at least four separate occasions in the last three years, where the combined occasions total a length of time of at least 12 months; and c) has one or more disabling conditions, such as a substance use disorder, serious mental illness, developmental disability, post-traumatic stress disorder, or chronic physical illness or disability. See Federal Register / Vol. 80, No. 233 / Friday, December 4, 2015, page 75792, www.hudexchange.info/resources/documents/Defining-Chronically-Homeless-Final-Rule.pdf.

Introduction
ECONorthwest 2
housing, expands the share of Temporary Assistance for Needy Families (TANF) funds that can be used for housing assistance, and more. The budget is just one, multi-faceted response to a complex problem. Many other responses like it exist at the city and county levels across the state.
A lack of agreement about the root causes of homelessness challenges policy design. Boiling down longer lists, public and elected officials often pivot between two prime culprits: an overpriced housing market or challenging personal circumstances (e.g., drug addiction and mental health issues).
Clarifying the root causes of Oregon’s homelessness problem is the first objective of this report. To do that, the next section explores statewide trends in homelessness, situates Oregon’s challenges within a broader national context, and reviews the academic and professional literature on homelessness determinants. The review suggests that housing costs and challenging personal circumstances jointly contribute to the crisis. UCLA economist William Yu may have put it best when he described California’s problem as the complex intersection of difficult personal circumstances in the wrong kind of housing market.9
The report then turns to solutions and is organized around a four-part policy framework. The section opens with a discussion of policies that affect the overall production of housing and describes how progress on that front could lead to small reductions in the likelihood of homelessness for large numbers of households. Next, the report outlines the variety of federal, state, and local programs designed to serve low-income, cost-burdened renters, most of whom are not currently homeless (e.g., housing choice vouchers (HCV), public housing, government-supported affordable housing). An important finding here is that, unlike other components of public safety nets, rental assistance programs are not an entitlement program and do not expand and contract in response to economic conditions or need. A third category of programming narrowly targets intensive and expensive interventions to homeless individuals and families with the highest needs. Precisely defining and identifying “high needs” is the key challenge, but better data and predictive analytics can help. Lastly, the report considers the role of emergency shelters in the crisis system—the policy of last resort. Shelter policy has the safety of vulnerable populations as its top goal. Beyond that, policymakers must strike a balance between the public’s strong support for shelter expansion and experts’ equally strong warnings that an overbuilt system could become an expensive semi-permanent solution for too many individuals and families.
9 William Yu, “Homelessness in the U.S., California, and Los Angeles,” www.youtube.com/watch?v=XOxcDJY3ens, (June 18, 2018).
Introduction
ECONorthwest 3
A concluding section offers next steps for state and local plans to reduce homelessness. It suggests framing problems and solutions in ways that could reconcile the disagreement about the root causes of homelessness. The public’s understanding of the problem may improve if homelessness were described as two related crises. One crisis affects a population of individuals with highly challenging personal circumstances—mental illness, adverse physical health conditions, or substance abuse issues—who will struggle to remain housed absent sustained, intensive support. A second crisis affects more than 150,000 households: the short-term homeless plus the growing numbers of severely cost-burdened renters on the verge of homelessness. The boundary between these crises is permeable; the loss of housing can trigger chronic illness, depression, and drug use, while these personal issues can also lead to housing instability.
The first crisis, while challenging, is within the scope of traditional, local homeless agencies to address and solve with additional resources. The second crisis is not. Meaningful progress there would require action by a much broader set of public, private, local, state, and federal actors.
Homelessness in Oregon: Determinants and Recent Trends
ECONorthwest 4
Homelessness in Oregon: Determinants and Recent Trends
Measuring Homelessness Reliable measurement is key to defining a public policy problem, and measurement of homeless populations is inherently challenging. The most commonly cited source of data on homelessness is the Point-in-Time Counts (PIT) organized by the U.S. Department of Housing and Urban Development (HUD). Conducted by local Continuums of Care (CoCs), HUD requires a PIT count of the total number and characteristics of all people experiencing homelessness in each CoC’s region on a specific night in January. CoCs count people living in emergency homeless shelters, transitional housing, and safe havens every year, and count unsheltered homeless persons every other year (the latest of which was 2017). Counting methods vary across time and place, rely heavily on volunteers, and can be disrupted by weather. Community effort in getting an accurate count is not uniform across geographies. And the homeless population is in continuous flux.
Together, this means that despite best efforts, the nature of the data varies from year to year and from region to region. While comparisons across time and geographies can be valuable, the inherent inconsistencies in methods, accuracy, and effort must be kept in mind. Take Lane County as an example. The January 2018 PIT count drew on more than 300 volunteers—twice the number of volunteers who participated in the January 2017 count.10 The increased effort is commendable, but it also calls into questions the comparability of the 2017 and 2018 findings.
Accurate PIT counts in rural areas have particular challenges due to the geographic dispersion of people (including people experiencing homelessness), differences in staffing and volunteers, as well as cultural differences which may obscure the nature of homelessness. Oregon has seven Continuums of Care (CoCs) that organize and perform the PIT counts. Three are in the Portland region, three are in the I-5 corridor and in Central Oregon, and the last bundles rural and suburban areas into a non-contiguous geography called the “Balance of State.” Beyond the operational challenges of counting homeless individuals in rural areas, this large geography obscures variations across small towns and rural counties, grouping together Coastal communities and rural Eastern Oregon.
Accurate PIT counts are necessary to receive funding for homeless services, shelters, and prevention efforts. Undercounting can lead to less funding. Appendix A offers more detail on the PIT calculation methods, and also describes how a snapshot PIT count relates to the number of people who are ever homeless over the course of a year.
10 Alexandria Dreher, Lane County 2018 Sheltered and Unsheltered Point in Time Count Full Report (May 2018), 2.

Homelessness in Oregon: Determinants and Recent Trends
ECONorthwest 5
Determinants of Homelessness and Interstate Comparisons Theories about the key drivers of homelessness fall into two broad categories: personal behaviors and housing market conditions. A community cannot develop appropriate policy responses until the respective roles of—and interplay between—those factors are better understood.
Those advancing adverse individual circumstances as the primary driver of homelessness have readily observed examples. The incidence of mental illness, substance abuse, family disputes, and domestic violence are much higher for people experiencing homelessness than for the general population. But correlation is not causation. The Appalachian region is struggling with a severe opioid crisis,11 but rates of homelessness in Alabama, Georgia, Kentucky, West Virginia, Tennessee, and other states in the region are less than half those in Oregon.12 Appalachia’s relatively low rates of homelessness suggest determinants extend beyond challenging personal circumstances. Economic analyses evaluating the determinants of homelessness have found little evidence that unemployment rates and rates of disability benefits affect variations in homelessness.13
The theoretical tie between housing affordability and homelessness is relatively straightforward. The cost of housing at the extreme low-end of the market rises to levels that crowd out spending on food, clothing, childcare, and essential items to such a degree that some individuals and families have no other choice but to move onto the streets or into emergency shelters. In other cases, individuals and families may face an emergency expense (such as a car repair or medical bill) and, without adequate income or savings, are evicted. In each of these situations, supply-side factors relating to access to housing at a range of affordability levels come into play as well as extenuating circumstances.
Economists John Quigley and Steven Raphael were among the first to demonstrate that housing affordability—rather than personal circumstances—is the key to
11 Alan B. Krueger, “Where Have All the Workers Gone? An Inquiry into the Decline of the U.S. Labor Force Participation Rate,” Brookings Papers on Economic Activity Conference Drafts (Washington, DC: Brookings Institution, September 2017).
12 U.S. Department of Housing and Urban Development, The 2018 Annual Homeless Assessment Report (AHAR) to Congress (Washington, DC: U.S. Department of Housing and Development, December 2018).
13 Quigley and Raphael, “The Economics of Homelessness.”
The Appalachian region is struggling with a severe opioid crisis, but rates of homelessness in Alabama, Georgia, Kentucky, West Virginia, Tennessee, and other states in the region are less than half those in Oregon. Appalachia’s relatively low rates of homelessness suggest determinants extend beyond challenging personal circumstances.
Homelessness in Oregon: Determinants and Recent Trends
ECONorthwest 6
predicting the relative severity of homelessness across the United States.14 They assembled a variety of homeless and shelter counts from metropolitan areas across the country, as well as a host of location characteristics: rental vacancy rates, nominal rents, rent-to-income ratios, January temperatures, unemployment rates, and numbers of disability benefit recipients. They found that—controlling for weather, unemployment, and disability rates—median rents and vacancy rates in the local rental market are significantly related to the rate of homelessness in that region. They estimated that a 10.0 percent increase in rent leads to a 13.6 percent increase in the rate of homelessness and that a 10.0 percent increase in the vacancy rate of housing units corresponds to a 3.9 percent decline in the rate of homelessness.
Subsequent analyses have validated Quigley and Raphael’s work.15 Recent research by Zillow evaluated the housing conditions of the 386 HUD continuums across the country and determined that homelessness rises more rapidly at two key rent-to-income thresholds: 22.0 percent and 32.0 percent (see slopes in Figure 1), lending credence to the general industry concept that households should not pay more than 30 percent of their gross income on housing costs. While this analysis was performed at the metro level, the relationship between statewide rents and homelessness holds.
14 Ibid.
15 See for example, Maria Hanratty, “Do Local Economic Conditions Affect Homelessness? Impact of Area Housing Market Factors, Unemployment, and Poverty on Community Homeless Rates,” Housing Policy Debate 27, no. 4 (March 20, 2017): 1-16; Chris Glynn and Emily B. Fox, “Dynamics of Homelessness in Urban America,” (Durham: College of Business and Economics, University of New Hampshire, 2017).

Homelessness in Oregon: Determinants and Recent Trends
ECONorthwest 7
Figure 1. Rates of Homelessness in U.S. Metros Accelerate As Rents Become Less Affordable
Source: Zillow Economic Research: Analysis by Zillow Research Fellow Chris Glynn of the University of New Hampshire, Thomas Byrne of Boston University, and Dennis Culhane of the University of Pennsylvania. Analysis of housing markets in 386 HUD Continuums of Care.
Additionally, our analysis across the 50 states indicates that median gross rents explain 42.6 percent of the variance in rates of homelessness. UCLA economist William Yu finds the same strong links and describes homelessness as a conjunction of bad circumstances: having difficult personal circumstances in the wrong kind of housing market.16
16 William Yu, “Homelessness in the U.S., California, and Los Angeles.”
Homelessness in Oregon: Determinants and Recent Trends
ECONorthwest 8
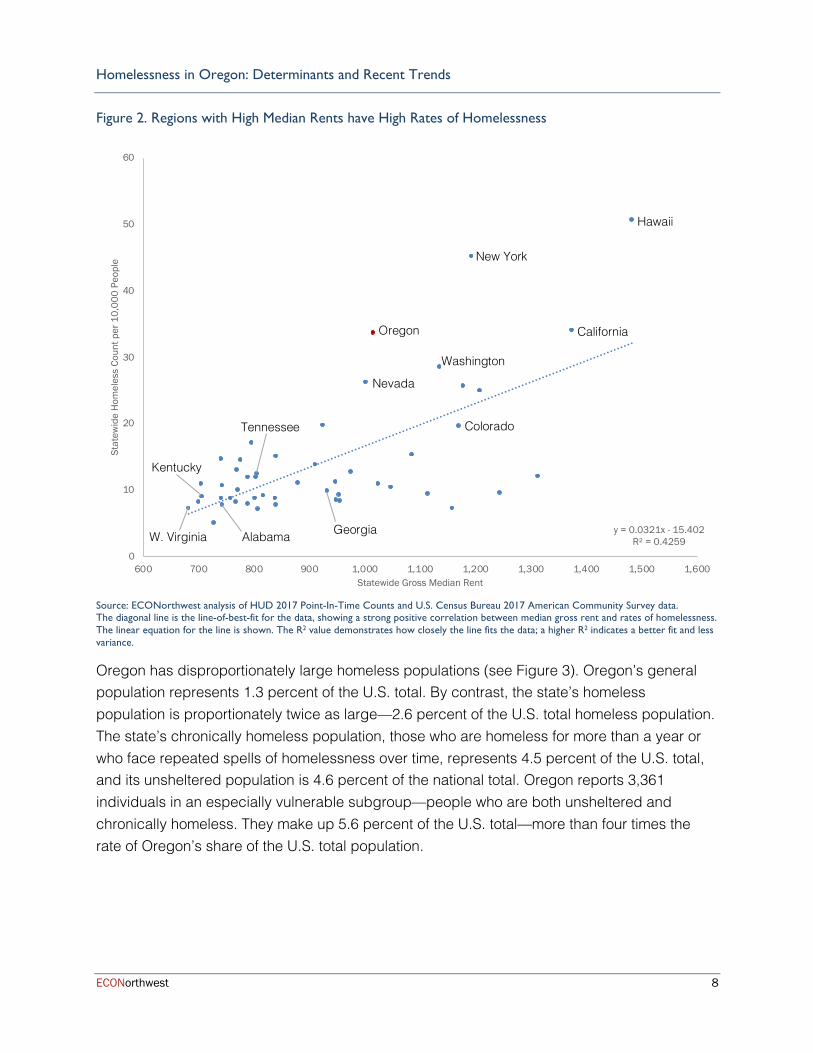
Figure 2. Regions with High Median Rents have High Rates of Homelessness
Source: ECONorthwest analysis of HUD 2017 Point-In-Time Counts and U.S. Census Bureau 2017 American Community Survey data. The diagonal line is the line-of-best-fit for the data, showing a strong positive correlation between median gross rent and rates of homelessness. The linear equation for the line is shown. The R2 value demonstrates how closely the line fits the data; a higher R2 indicates a better fit and less variance.
Oregon has disproportionately large homeless populations (see Figure 3). Oregon’s general population represents 1.3 percent of the U.S. total. By contrast, the state’s homeless population is proportionately twice as large—2.6 percent of the U.S. total homeless population. The state’s chronically homeless population, those who are homeless for more than a year or who face repeated spells of homelessness over time, represents 4.5 percent of the U.S. total, and its unsheltered population is 4.6 percent of the national total. Oregon reports 3,361 individuals in an especially vulnerable subgroup—people who are both unsheltered and chronically homeless. They make up 5.6 percent of the U.S. total—more than four times the rate of Oregon’s share of the U.S. total population.
y = 0.0321x - 15.402R² = 0.4259
0
10
20
30
40
50
60
600 700 800 900 1,000 1,100 1,200 1,300 1,400 1,500 1,600
Stat
ewid
e H
omel
ess
Coun
t per
10,
000
Peop
le
Statewide Gross Median Rent
Hawaii
New York
California Oregon
Washington
Nevada
Colorado
Alabama Georgia
Kentucky
Tennessee
W. Virginia

Homelessness in Oregon: Determinants and Recent Trends
ECONorthwest 9
Figure 3. Oregon Has Disproportionately Large Homeless Populations
Source: ECONorthwest analysis of HUD 2017 Point-In-Time Counts, U.S. Census Bureau 2018 Annual Estimates of the Resident Population for the United States, Regions, States, and Puerto Rico, and United Nations World Population Prospects Division (2017). Notes: Although American Samoa is a U.S. Territory, it is not included in the HUD PIT data, so we have excluded it from the U.S. Total General Population for consistency. Other U.S. Territories are included. HUD only requires CoCs to conduct an unsheltered count in odd-years, so 2018 PIT data include 2017 unsheltered figures.
Homelessness in Oregon Findings from Recent PIT Counts Seven CoCs gather homeless statistics and coordinate services across Oregon. Three CoCs serve the Portland metropolitan area. Individual CoCs serve areas that are roughly comparable to the Eugene, Bend, and Medford metropolitan areas. The “Balance of the State” CoC serves Salem, Corvallis, and non-metropolitan parts of the state (e.g., the Oregon Coast, the Columbia Gorge, Eastern Oregon, and Southern Oregon outside of Jackson county) (see Figure 4).
0.0% 1.0% 2.0% 3.0% 4.0% 5.0% 6.0%
General Population
Total HomelessPopulation
Chronically HomelessPopulation
Unsheltered HomelessPopulation
Unsheltered and ChronicallyHomeless Population
Oregon's Share of U.S. Totals
Homelessness in Oregon: Determinants and Recent Trends
ECONorthwest 10
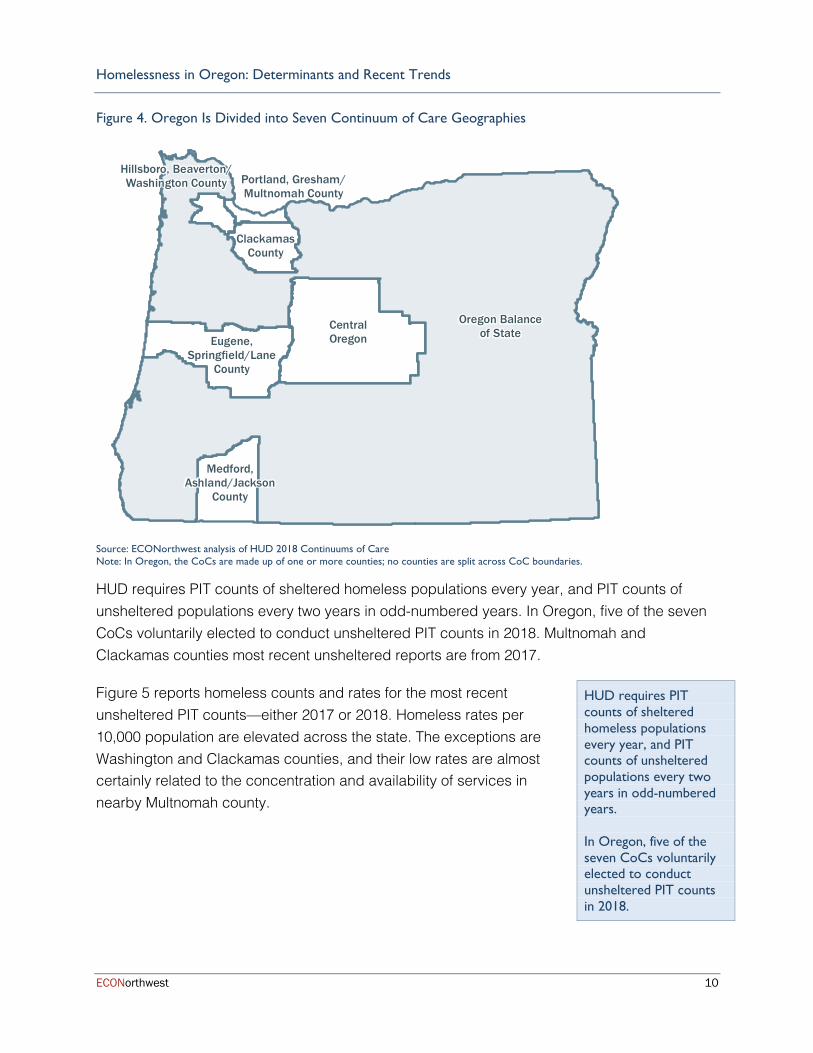
Figure 4. Oregon Is Divided into Seven Continuum of Care Geographies
Source: ECONorthwest analysis of HUD 2018 Continuums of Care Note: In Oregon, the CoCs are made up of one or more counties; no counties are split across CoC boundaries.
HUD requires PIT counts of sheltered homeless populations every year, and PIT counts of unsheltered populations every two years in odd-numbered years. In Oregon, five of the seven CoCs voluntarily elected to conduct unsheltered PIT counts in 2018. Multnomah and Clackamas counties most recent unsheltered reports are from 2017.
Figure 5 reports homeless counts and rates for the most recent unsheltered PIT counts—either 2017 or 2018. Homeless rates per 10,000 population are elevated across the state. The exceptions are Washington and Clackamas counties, and their low rates are almost certainly related to the concentration and availability of services in nearby Multnomah county.
Eugene,Springfield/Lane
County
Portland, Gresham/Multnomah County
Medford,Ashland/Jackson
County
CentralOregon
Oregon Balanceof State
Hillsboro, Beaverton/Washington County
ClackamasCounty
HUD requires PIT counts of sheltered homeless populations every year, and PIT counts of unsheltered populations every two years in odd-numbered years. In Oregon, five of the seven CoCs voluntarily elected to conduct unsheltered PIT counts in 2018.

Homelessness in Oregon: Determinants and Recent Trends
ECONorthwest 11
Chronically homeless populations across Oregon stand out. In 2018, the Oregon Balance of State CoC reported more chronically homeless individuals (1,503)17 than the entire of state of Illinois (1,470).18
Figure 5. Rates of Homelessness Are High Across Most of Oregon
Continuum of
Care Year
Total
Population
Episodic
Homeless
Chronic
Homeless
Total
Homeless
Chronic
Homeless
per 10,000
Total
Homeless
Per 10,000
Percent
Un-
sheltered
Eugene-Springfield-Lane County
2018 375,120 929 712 1,641 19.0 43.7 69.1%
Portland-Gresham-Multnomah Co.
2017 803,000 2,887 1,290 4,177 16.1 52.0 39.9%
Medford-Ashland-Jackson Co.
2018 219,200 473 259 732 11.8 33.4 44.9%
Central Oregon 2018 235,250 615 172 787 7.3 33.5 70.5%
Oregon Balance of State
2018 1,526,725 4,889 1,503 6,392 9.8 41.9 70.9%
Hillsboro-Beaverton-Washington Co.
2018 606,280 356 166 522 2.7 8.6 68.8%
Clackamas Co. 2017 413,000 343 154 497 3.7 12.0 69.6%
Oregon Totals not reported because CoC reporting schedules are inconsistent Source: ECONorthwest analysis of HUD 2017 and 2018 Point-In-Time Counts, Portland State University County Population Estimates, and U.S. Census Bureau 2018 Annual Estimates of the Resident Population for the United States, Regions, States, and Puerto Rico. Notes: Year varies because some CoC’s voluntarily conducted unsheltered counts in 2018. Homeless population counts and total population estimates are provided for the year listed.
The high shares of people experiencing unsheltered homelessness also set Oregon apart. HUD’s 2018 Annual Report to Congress showed Oregon with the second highest rate of unsheltered homeless people (61.7 percent)—behind only California. Multnomah and Jackson counties, with relatively more shelter capacity and lower rates of unsheltered homelessness, nonetheless have unsheltered rates that exceed those of a sizable majority of states.
17 “2007-2018 PIT Counts by CoC,” U.S. Department of Housing and Urban Development, www.hudexchange.info/resource/3031/pit-and-hic-data-since-2007/, (December 2018).
18 HUD, Annual Homeless Assessment Report (AHAR) to Congress , 2018.
Homelessness in Oregon: Determinants and Recent Trends
ECONorthwest 12
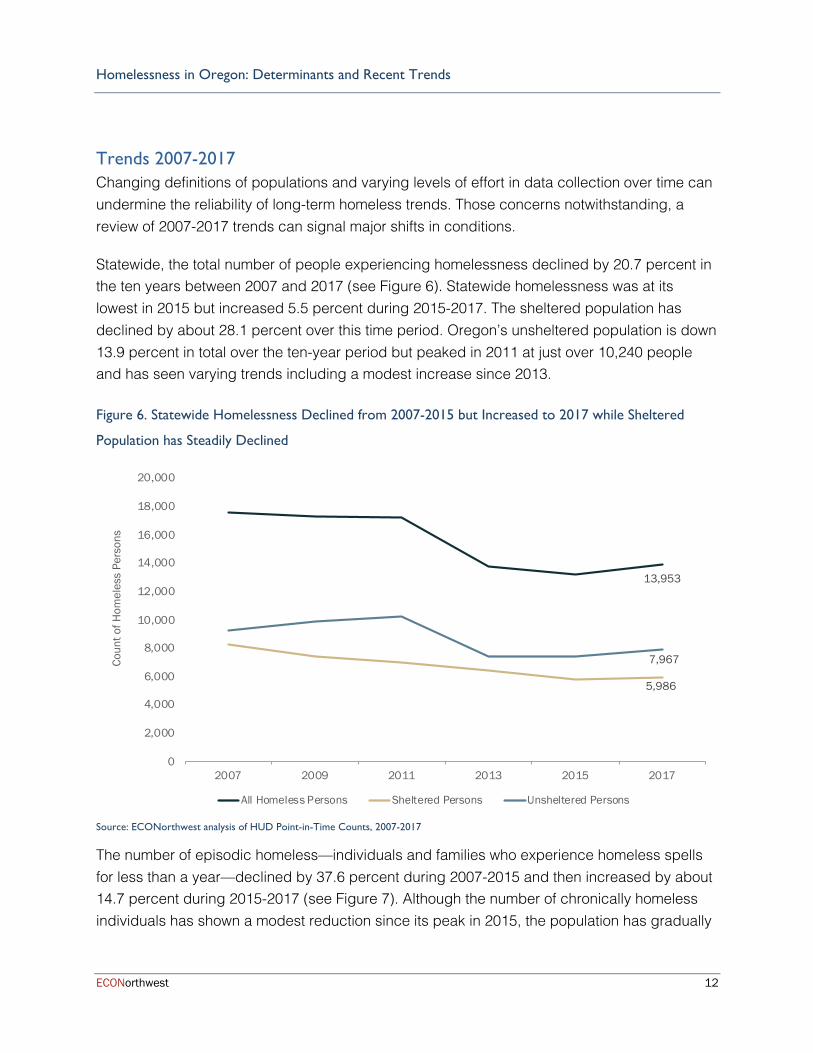
Trends 2007-2017 Changing definitions of populations and varying levels of effort in data collection over time can undermine the reliability of long-term homeless trends. Those concerns notwithstanding, a review of 2007-2017 trends can signal major shifts in conditions.
Statewide, the total number of people experiencing homelessness declined by 20.7 percent in the ten years between 2007 and 2017 (see Figure 6). Statewide homelessness was at its lowest in 2015 but increased 5.5 percent during 2015-2017. The sheltered population has declined by about 28.1 percent over this time period. Oregon’s unsheltered population is down 13.9 percent in total over the ten-year period but peaked in 2011 at just over 10,240 people and has seen varying trends including a modest increase since 2013.
Figure 6. Statewide Homelessness Declined from 2007-2015 but Increased to 2017 while Sheltered
Population has Steadily Declined
Source: ECONorthwest analysis of HUD Point-in-Time Counts, 2007-2017
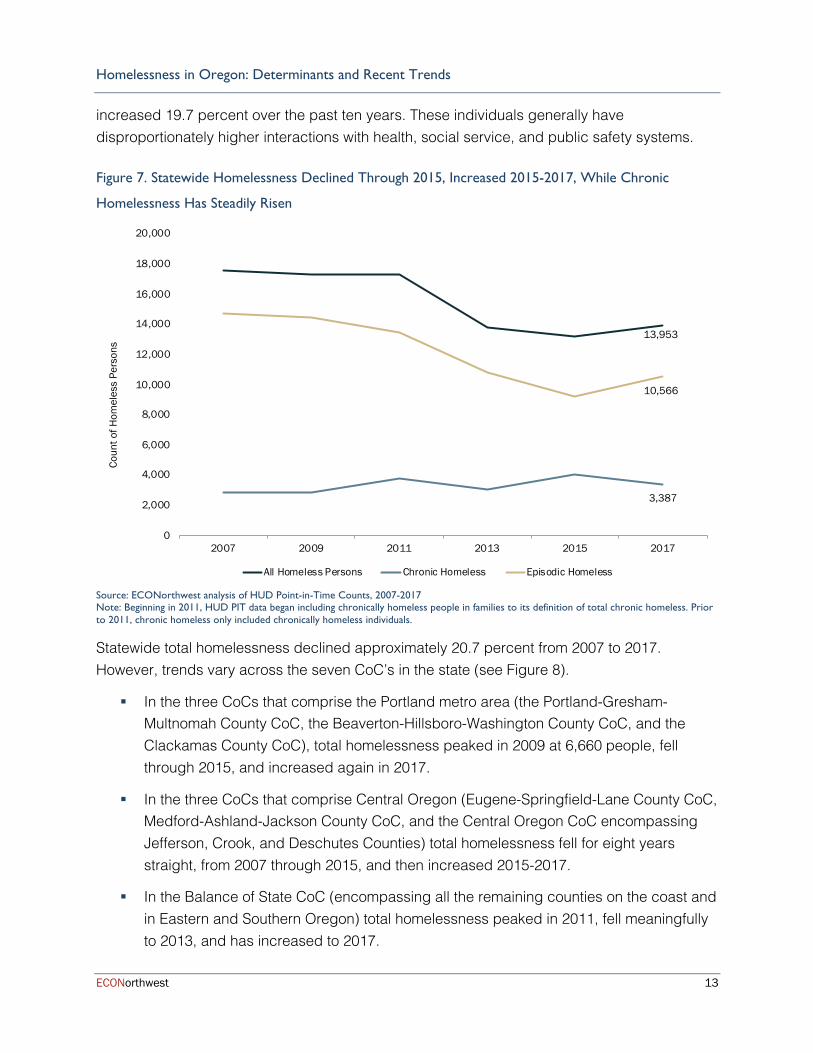
The number of episodic homeless—individuals and families who experience homeless spells for less than a year—declined by 37.6 percent during 2007-2015 and then increased by about 14.7 percent during 2015-2017 (see Figure 7). Although the number of chronically homeless individuals has shown a modest reduction since its peak in 2015, the population has gradually
13,953
5,986
7,967
0
2,000
4,000
6,000
8,000
10,000
12,000
14,000
16,000
18,000
20,000
2007 2009 2011 2013 2015 2017
Coun
t of H
omel
ess
Pers
ons
All Homeless Persons Sheltered Persons Unsheltered Persons
Homelessness in Oregon: Determinants and Recent Trends
ECONorthwest 13
increased 19.7 percent over the past ten years. These individuals generally have disproportionately higher interactions with health, social service, and public safety systems.
Figure 7. Statewide Homelessness Declined Through 2015, Increased 2015-2017, While Chronic
Homelessness Has Steadily Risen
Source: ECONorthwest analysis of HUD Point-in-Time Counts, 2007-2017 Note: Beginning in 2011, HUD PIT data began including chronically homeless people in families to its definition of total chronic homeless. Prior to 2011, chronic homeless only included chronically homeless individuals.
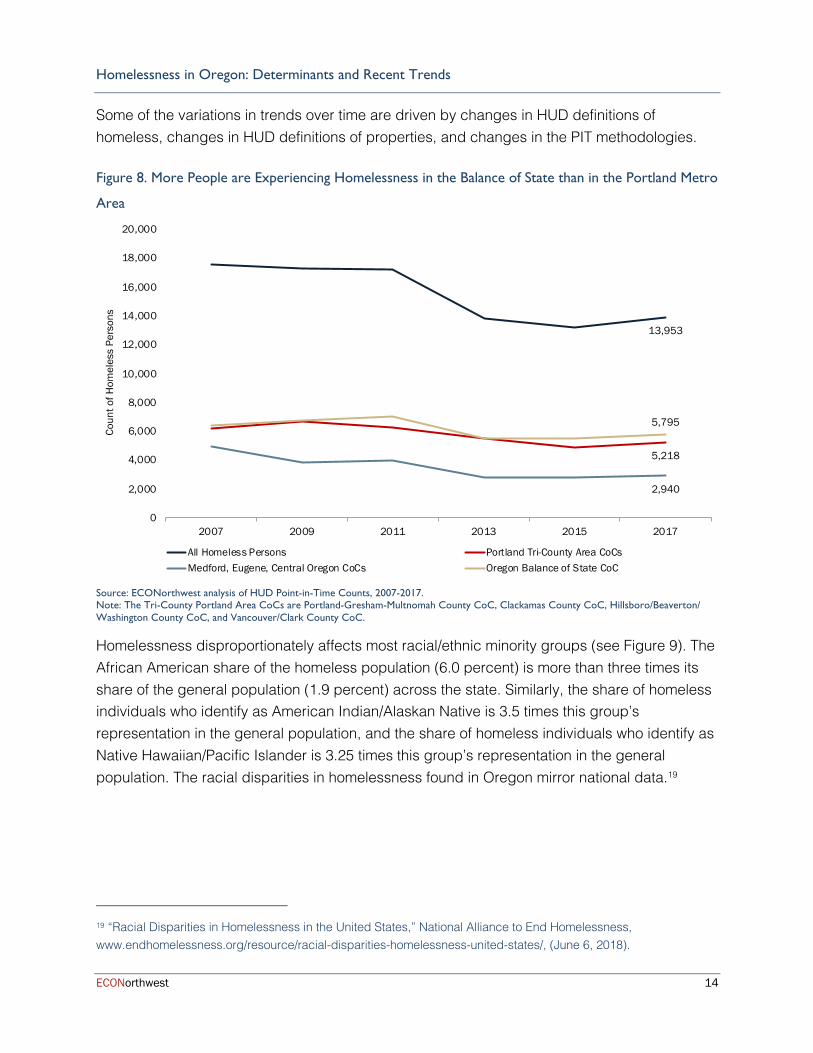
Statewide total homelessness declined approximately 20.7 percent from 2007 to 2017. However, trends vary across the seven CoC’s in the state (see Figure 8).
§ In the three CoCs that comprise the Portland metro area (the Portland-Gresham-Multnomah County CoC, the Beaverton-Hillsboro-Washington County CoC, and the Clackamas County CoC), total homelessness peaked in 2009 at 6,660 people, fell through 2015, and increased again in 2017.
§ In the three CoCs that comprise Central Oregon (Eugene-Springfield-Lane County CoC, Medford-Ashland-Jackson County CoC, and the Central Oregon CoC encompassing Jefferson, Crook, and Deschutes Counties) total homelessness fell for eight years straight, from 2007 through 2015, and then increased 2015-2017.
§ In the Balance of State CoC (encompassing all the remaining counties on the coast and in Eastern and Southern Oregon) total homelessness peaked in 2011, fell meaningfully to 2013, and has increased to 2017.
13,953
3,387
10,566
0
2,000
4,000
6,000
8,000
10,000
12,000
14,000
16,000
18,000
20,000
2007 2009 2011 2013 2015 2017
Coun
t of H
omel
ess
Pers
ons
All Homeless Persons Chronic Homeless Episodic Homeless
Homelessness in Oregon: Determinants and Recent Trends
ECONorthwest 14
Some of the variations in trends over time are driven by changes in HUD definitions of homeless, changes in HUD definitions of properties, and changes in the PIT methodologies.
Figure 8. More People are Experiencing Homelessness in the Balance of State than in the Portland Metro
Area
Source: ECONorthwest analysis of HUD Point-in-Time Counts, 2007-2017. Note: The Tri-County Portland Area CoCs are Portland-Gresham-Multnomah County CoC, Clackamas County CoC, Hillsboro/Beaverton/ Washington County CoC, and Vancouver/Clark County CoC.
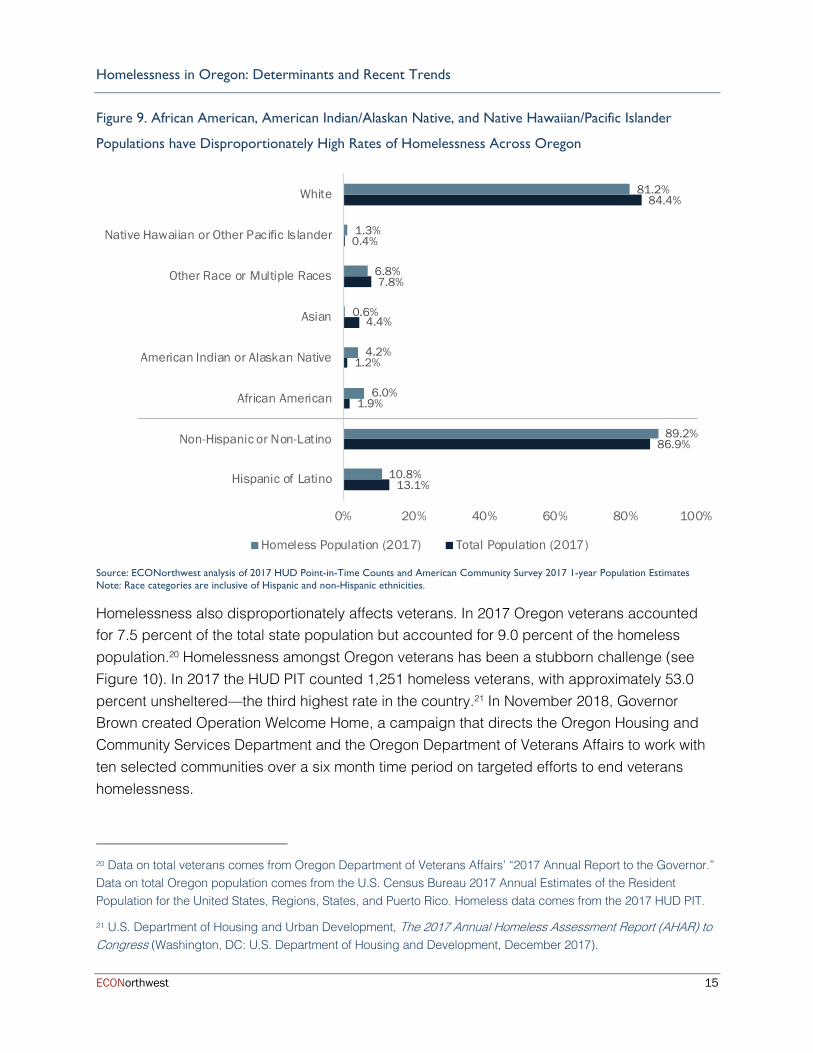
Homelessness disproportionately affects most racial/ethnic minority groups (see Figure 9). The African American share of the homeless population (6.0 percent) is more than three times its share of the general population (1.9 percent) across the state. Similarly, the share of homeless individuals who identify as American Indian/Alaskan Native is 3.5 times this group’s representation in the general population, and the share of homeless individuals who identify as Native Hawaiian/Pacific Islander is 3.25 times this group’s representation in the general population. The racial disparities in homelessness found in Oregon mirror national data.19
19 “Racial Disparities in Homelessness in the United States,” National Alliance to End Homelessness, www.endhomelessness.org/resource/racial-disparities-homelessness-united-states/, (June 6, 2018).
13,953
5,218
2,940
5,795
0
2,000
4,000
6,000
8,000
10,000
12,000
14,000
16,000
18,000
20,000
2007 2009 2011 2013 2015 2017
Coun
t of H
omel
ess
Pers
ons
All Homeless Persons Portland Tri-County Area CoCsMedford, Eugene, Central Oregon CoCs Oregon Balance of State CoC
Homelessness in Oregon: Determinants and Recent Trends
ECONorthwest 15
Figure 9. African American, American Indian/Alaskan Native, and Native Hawaiian/Pacific Islander
Populations have Disproportionately High Rates of Homelessness Across Oregon
Source: ECONorthwest analysis of 2017 HUD Point-in-Time Counts and American Community Survey 2017 1-year Population Estimates Note: Race categories are inclusive of Hispanic and non-Hispanic ethnicities.
Homelessness also disproportionately affects veterans. In 2017 Oregon veterans accounted for 7.5 percent of the total state population but accounted for 9.0 percent of the homeless population.20 Homelessness amongst Oregon veterans has been a stubborn challenge (see Figure 10). In 2017 the HUD PIT counted 1,251 homeless veterans, with approximately 53.0 percent unsheltered—the third highest rate in the country.21 In November 2018, Governor Brown created Operation Welcome Home, a campaign that directs the Oregon Housing and Community Services Department and the Oregon Department of Veterans Affairs to work with ten selected communities over a six month time period on targeted efforts to end veterans homelessness.
20 Data on total veterans comes from Oregon Department of Veterans Affairs’ “2017 Annual Report to the Governor.” Data on total Oregon population comes from the U.S. Census Bureau 2017 Annual Estimates of the Resident Population for the United States, Regions, States, and Puerto Rico. Homeless data comes from the 2017 HUD PIT.
21 U.S. Department of Housing and Urban Development, The 2017 Annual Homeless Assessment Report (AHAR) to Congress (Washington, DC: U.S. Department of Housing and Development, December 2017).
13.1%
86.9%
1.9%
1.2%
4.4%
7.8%
0.4%
84.4%
10.8%
89.2%
6.0%
4.2%
0.6%
6.8%
1.3%
81.2%
0% 20% 40% 60% 80% 100%
Hispanic of Latino
Non-Hispanic or Non-Latino
African American
American Indian or Alaskan Native
Asian
Other Race or Multiple Races
Native Hawaiian or Other Pacific Islander
White
Homeless Population (2017) Total Population (2017)

Homelessness in Oregon: Determinants and Recent Trends
ECONorthwest 16
Figure 10. Homelessness Amongst Oregon Veterans has Remained Relatively Constant Over Time
Source: ECONorthwest analysis of HUD Point-in-Time Counts, 2007-2017.
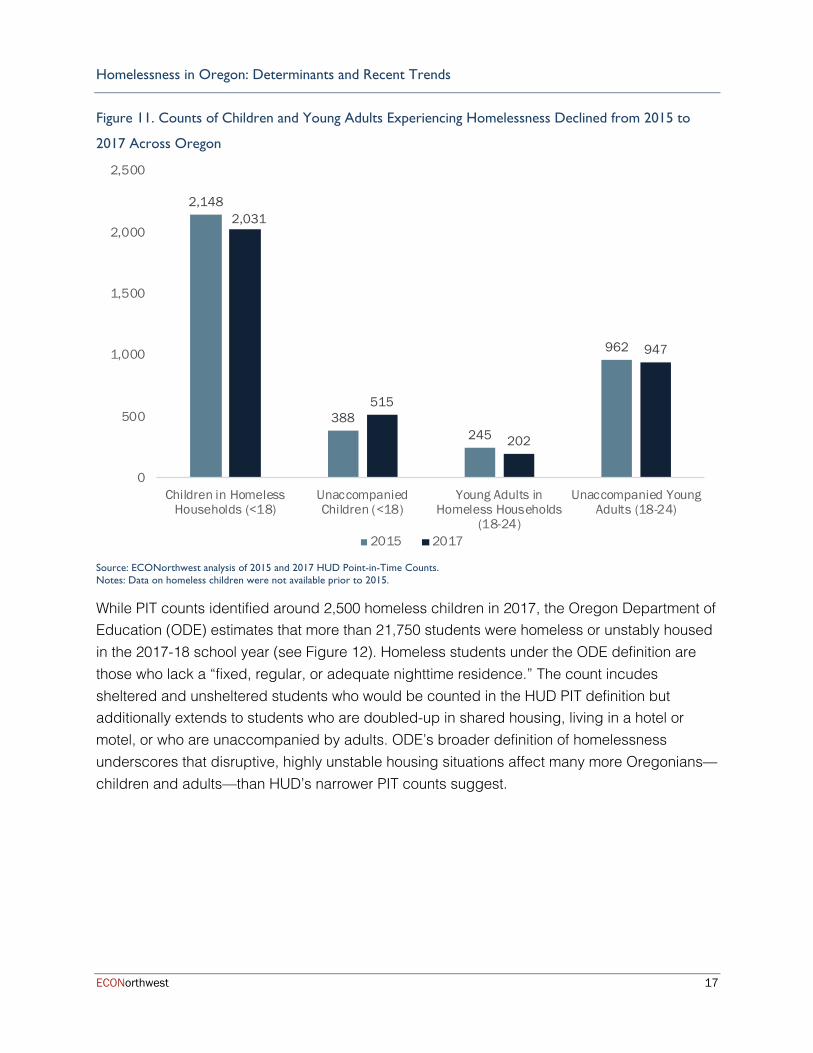
Homelessness can be particularly destabilizing for children and young adults. Figure 11 uses PIT data to show homelessness counts among children (under 18 years old) and young adults (between 18 and 24 years old) in 2015 and 2017 across the state. The counts of homeless children in households, young adults in households, and unaccompanied young adults all declined between 2015 and 2017 while the number of unaccompanied children experiencing homelessness across the state increased.
13,953
1,251
0
2,000
4,000
6,000
8,000
10,000
12,000
14,000
16,000
18,000
20,000
2007 2009 2011 2013 2015 2017
Coun
t of H
omel
ess
Pers
ons
Total Homeless All Homeless Veterans
Homelessness in Oregon: Determinants and Recent Trends
ECONorthwest 17
Figure 11. Counts of Children and Young Adults Experiencing Homelessness Declined from 2015 to
2017 Across Oregon
Source: ECONorthwest analysis of 2015 and 2017 HUD Point-in-Time Counts. Notes: Data on homeless children were not available prior to 2015.
While PIT counts identified around 2,500 homeless children in 2017, the Oregon Department of Education (ODE) estimates that more than 21,750 students were homeless or unstably housed in the 2017-18 school year (see Figure 12). Homeless students under the ODE definition are those who lack a “fixed, regular, or adequate nighttime residence.” The count incudes sheltered and unsheltered students who would be counted in the HUD PIT definition but additionally extends to students who are doubled-up in shared housing, living in a hotel or motel, or who are unaccompanied by adults. ODE’s broader definition of homelessness underscores that disruptive, highly unstable housing situations affect many more Oregonians—children and adults—than HUD’s narrower PIT counts suggest.
2,148
388245
962
2,031
515
202
947
0
500
1,000
1,500
2,000
2,500
Children in HomelessHouseholds (<18)
UnaccompaniedChildren (<18)
Young Adults inHomeless Households
(18-24)
Unaccompanied YoungAdults (18-24)
2015 2017

Homelessness in Oregon: Determinants and Recent Trends
ECONorthwest 18
Figure 12. More than 21,750 Students are Experiencing Homelessness by the Department of Education’s
Definition, Considerably More Than HUD’s Definition
Source: ECONorthwest analysis of Oregon Department of Education Statewide Report Card 2017-2018 data. Available from: www.oregon.gov/ode/schools-and-districts/reportcards/Pages/Statewide-Annual-Report-Card.aspx.
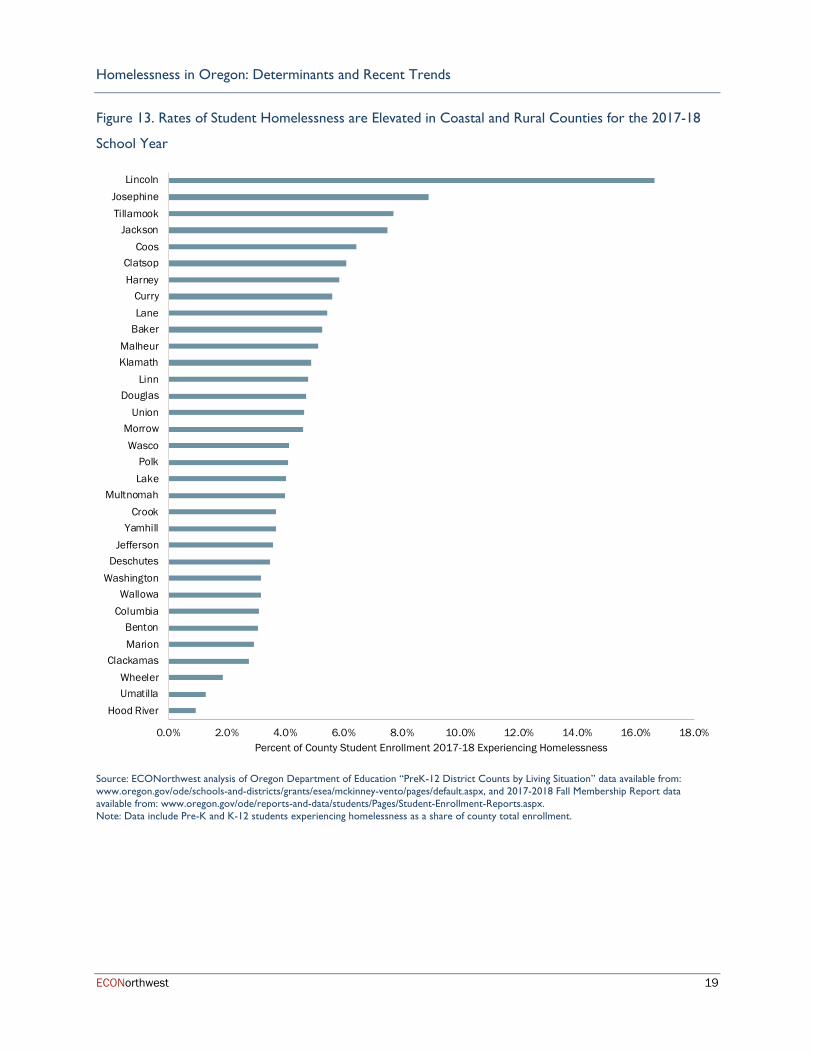
The steady increase in unstably housed students—19.8 percent from the 2012-13 school year—varies across the state. Rates of student homelessness are elevated in coastal and rural counties (see Figure 13). High student mobility, which accompanies homelessness, slows achievement, increases absenteeism, and lowers the chances of high school graduation.22 Addressing homelessness and providing resources for unstably housed students is a critical issue.
22 Sarah D. Sparks, “Student Mobility: How It Affects Learning,” Education Week, www.edweek.org/ew/ issues/student-mobility/index.html, (August 11, 2016).
0
5,000
10,000
15,000
20,000
25,000
2012-13 2013-14 2014-15 2015-16 2016-17 2017-18
Stud
ents
Uns
tabl
y H
ouse
d
School Year
Homelessness in Oregon: Determinants and Recent Trends
ECONorthwest 19
Figure 13. Rates of Student Homelessness are Elevated in Coastal and Rural Counties for the 2017-18
School Year
Source: ECONorthwest analysis of Oregon Department of Education “PreK-12 District Counts by Living Situation” data available from: www.oregon.gov/ode/schools-and-districts/grants/esea/mckinney-vento/pages/default.aspx, and 2017-2018 Fall Membership Report data available from: www.oregon.gov/ode/reports-and-data/students/Pages/Student-Enrollment-Reports.aspx. Note: Data include Pre-K and K-12 students experiencing homelessness as a share of county total enrollment.
0.0% 2.0% 4.0% 6.0% 8.0% 10.0% 12.0% 14.0% 16.0% 18.0%
Hood RiverUmatillaWheeler
ClackamasMarionBenton
ColumbiaWallowa
WashingtonDeschutes
JeffersonYamhill
CrookMultnomah
LakePolk
WascoMorrow
UnionDouglas
LinnKlamathMalheur
BakerLaneCurry
HarneyClatsop
CoosJackson
TillamookJosephine
Lincoln
Percent of County Student Enrollment 2017-18 Experiencing Homelessness

Homelessness in Oregon: Determinants and Recent Trends
ECONorthwest 20
23 Teresa Wiltz, “States Struggle with ‘Hidden’ Rural Homelessness,” The Pew Charitable Trusts, www.pewtrusts.org/en/research-and-analysis/blogs/stateline/2015/6/26/states-struggle-with-hidden-rural-homelessness, (June 26, 2015).
24 “The State of the Nation’s Housing 2018,” Harvard Joint Center for Housing Studies, www.jchs.harvard.edu/sites/default/files/Harvard_JCHS_State_of_the_Nations_Housing_2018.pdf, (2018).
Homelessness Differs in Urban and Rural Areas Homelessness occurs in communities large and small across the U.S. However, as noted in a 2015 Pew Charitable Trust report, States Struggle with ‘Hidden’ Rural Homelessness, important differences exist between urban and rural homelessness with regard to the demographic makeup of homeless populations, the services and funding available, the housing market conditions, and cultural views of homelessness.23 Combined, these differences make rural homelessness less visible, undercounted, and underserved. Demographics The Pew research report notes that causes of homelessness in rural areas are similar to those in urban areas—poverty, mental illness, inadequate housing, domestic violence, and post-war psychological issues. However, people experiencing rural homelessness are more likely to be white and female, and families with children represent larger shares of rural homeless populations than urban homeless populations. Visibility and Funding The report also suggests that people experiencing homelessness in rural areas are often less visible—staying in the woods, barns, sheds, tents, or campers. Much research exists documenting the difficulty of accurately counting people experiencing homelessness in rural areas (see the Appendix). Undercounts would translate to less funding for services. In addition, people experiencing homelessness and living in poverty in rural areas have less transit options to reach services they may need. These issues make addressing rural homelessness particularly challenging. Housing Market Conditions Because rural areas are growing more slowly than urban areas, developers have fewer incentives to build housing. According to the Joint Center for Housing Solutions, in 2016, 97.0 percent of all recently completed, market-rate, multifamily housing units were located in metro areas, further increasing the concentration of multifamily rental construction in metro areas and especially principal cities.24

Comprehensive Framework of Responses to Homelessness
ECONorthwest 21
Comprehensive Framework of Responses to Homelessness
Homelessness Dynamics and Implications for Policy Communities often build their homelessness reduction strategies on inflow and outflow models. They design programming to prevent housing and personal crises (i.e., the inflow) and expedite exits into adequate, long-term housing (i.e., the outflow). Required efforts to improve outflow processes are easier to describe. At any point in time, agencies have some sense, albeit imperfect, of the number of individuals and families experiencing chronic and episodic homelessness, the general kinds of programming needed, and a range of possible programs that could be deployed to house people. Outflow modeling has plenty of challenges, but the broad boundaries of populations, costs, and solutions are known.
Inflow modeling is considerably harder. As Multnomah County’s A Home for Everyone housing workgroup noted, “The true number of people who are on the verge of homelessness is difficult to predict and is affected by multiple external economic and social factors like recessions and rental housing markets.”25 The workgroup’s plan assumes a baseline with a stable inflow of newly homeless and returning homeless individuals.
It’s the complex interaction of housing and personal circumstances that makes inflow modeling and homelessness prevention so hard. Economist Brendan O’Flaherty argues that the most reliable indicator of who will be homeless tomorrow is that a person is homeless today. He notes, and many service providers have likely experienced, that it is extremely difficult to predict the next homeless cases among those who are currently housed. This is because high housing costs put tens of thousands of households at risk of homelessness at any given time. It is impossible to know which of those households will experience domestic violence, the loss of a job, a death, a health event, or other adverse circumstances that can trigger homelessness.
In their book, How to House the Homeless, Gould Ellen and O’Flaherty have likened a region with high housing costs to a forest under severe drought conditions.26 During an extended drought, firefighters know the likelihood of wildfire is elevated. But they do not know where the lightening will strike. Given the unpredictability of new homeless
25 A Home for Everyone, Housing Work Group Action Plan (March 3, 2015).
26 Ingrid Gould Ellen and Brendan O’Flaherty, eds., How to House the Homeless (New York: Russell Sage Foundation, 2010).
“Homelessness is not an indelible characteristic like a birthmark or a Social Security number. Almost everyone who will be homeless two years from today is housed now, and almost everyone who is homeless today will be housed two years from now. Homeless spells are more like semesters than careers. Some homeless spells are many years long, but these are rare. What is important about these spells is that at their starts they are unpredictable.” Brendan O’Flaherty
Comprehensive Framework of Responses to Homelessness
ECONorthwest 22
spells, agencies will continue to struggle in their attempts to narrowly tailor prevention activities among those who are currently housed. In short, the at-risk population is simply too broad. That said, broader inflow modeling can be improved. Forecasts of key housing market indicators like rents, rent-to-income ratios, and vacancy rates can strengthen assumptions about the direction of the inflow: increasing, decreasing, or staying the same.
The interplay of housing and personal circumstances has implications for the scope of policies that should be addressed in a plan to end homelessness. The demonstrated importance of broad housing market conditions points to a need to widen the scope considerably. Gould Ellen and O’Flaherty organize a comprehensive response across four policy fronts:27
§ Market-based supply responses. These include a suite of policies that would expand the supply of housing, such as deregulation of local zoning, state overrides of local zoning, and incentive-based regulations.
§ Means-tested, subsidized housing. This includes demand- and supply-side subsidies that increase tenants’ abilities to compete for housing in the private market.
§ Targeted programming for high-needs, high-cost homeless individuals. These are more comprehensive services to quickly move individuals and families experiencing homelessness back into housing that includes wraparound services.
§ Shelters. The last-resort policy response for emergencies. Shelters serve a necessary role in the housing continuum, providing temporary access to a crisis bed and a gateway to permanent housing, but are primarily for safety and do not provide a long-term solution to issues of homelessness.
The balance of this section steps through each policy category, reviews current policy and programming, and estimates today’s regional public and private expenditures. Then, the section turns to a discussion of the funding gap and focuses on the most cost-effective approaches to moving the state’s population experiencing homelessness into stable housing.
Market-Based Supply Responses
Housing Underproduction in the U.S. and Oregon The U.S. Interagency Council on Homelessness notes that homelessness prevention is not the exclusive responsibility of crisis response systems and that reducing the risk of housing crises
27 Ibid.
Comprehensive Framework of Responses to Homelessness
ECONorthwest 23
requires action across a range of community actors.28 Our interregional findings on the relationship between rent and homelessness suggests prevention starts with a better functioning housing market.
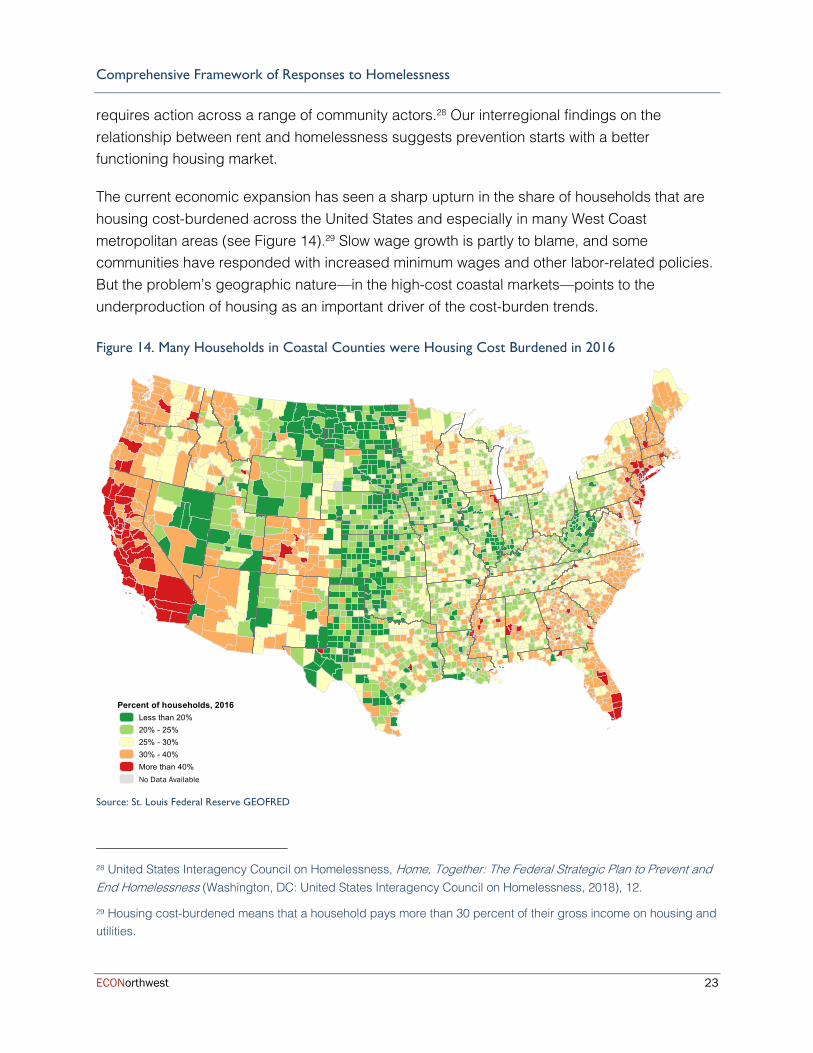
The current economic expansion has seen a sharp upturn in the share of households that are housing cost-burdened across the United States and especially in many West Coast metropolitan areas (see Figure 14).29 Slow wage growth is partly to blame, and some communities have responded with increased minimum wages and other labor-related policies. But the problem’s geographic nature—in the high-cost coastal markets—points to the underproduction of housing as an important driver of the cost-burden trends.
Figure 14. Many Households in Coastal Counties were Housing Cost Burdened in 2016
Source: St. Louis Federal Reserve GEOFRED
28 United States Interagency Council on Homelessness, Home, Together: The Federal Strategic Plan to Prevent and End Homelessness (Washington, DC: United States Interagency Council on Homelessness, 2018), 12.
29 Housing cost-burdened means that a household pays more than 30 percent of their gross income on housing and utilities.
Percent of households, 2016Less than 20%20% - 25%25% - 30%30% - 40%More than 40%No Data Available
Comprehensive Framework of Responses to Homelessness
ECONorthwest 24
We evaluated trends from 1963-2015 across the United States and estimated that national housing production fell short by as many as 7.3 million units between 2000 and 2015.30 The problem is most easily illustrated by a comparison of housing construction and household formation over time. The U.S. built 1.10 units for every new household during the half century from 1963-2016 which roughly kept pace with population growth while allowing for a vacancy factor, second homes, and the demolition of older, unsafe stock. Since 2010, the national pace of building has slowed considerably, with only 0.72 units built per new household formed.
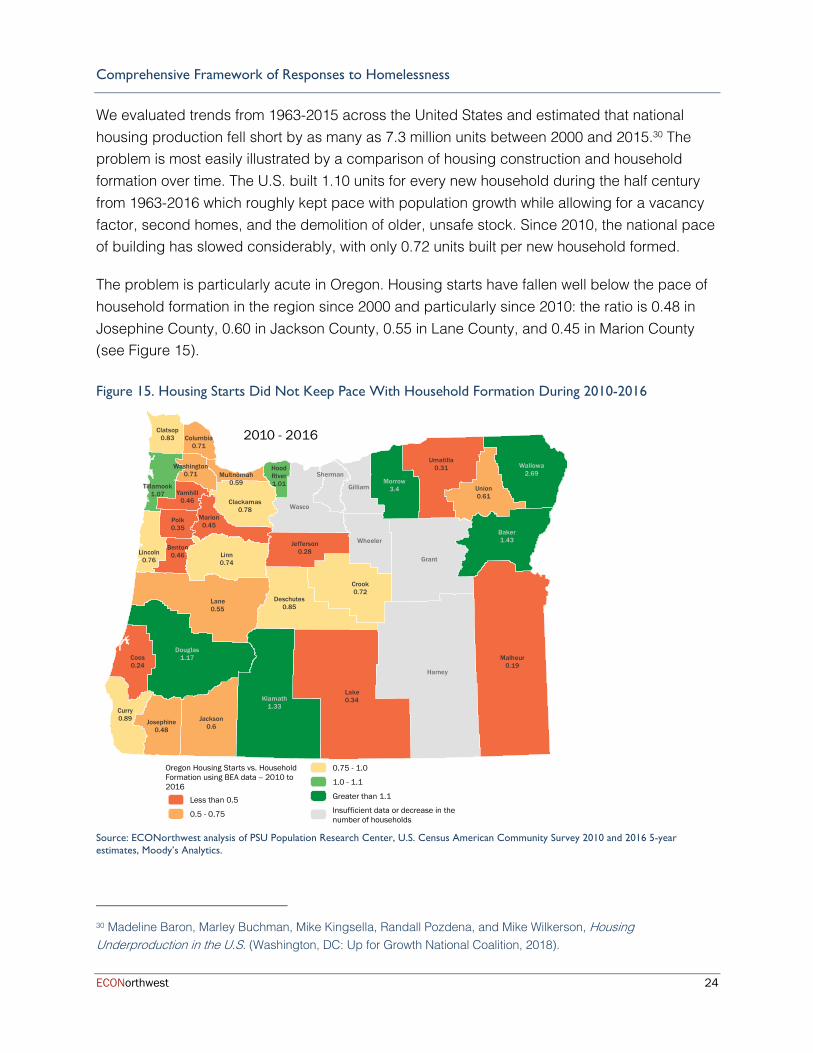
The problem is particularly acute in Oregon. Housing starts have fallen well below the pace of household formation in the region since 2000 and particularly since 2010: the ratio is 0.48 in Josephine County, 0.60 in Jackson County, 0.55 in Lane County, and 0.45 in Marion County (see Figure 15).
Figure 15. Housing Starts Did Not Keep Pace With Household Formation During 2010-2016
Source: ECONorthwest analysis of PSU Population Research Center, U.S. Census American Community Survey 2010 and 2016 5-year estimates, Moody’s Analytics.
30 Madeline Baron, Marley Buchman, Mike Kingsella, Randall Pozdena, and Mike Wilkerson, Housing Underproduction in the U.S. (Washington, DC: Up for Growth National Coalition, 2018).
Harney
Gilliam
Wasco
Sherman
Grant
Wheeler
Jackson
0.6
Deschutes
0.85
Curry
0.89
Coos
0.24
Malheur
0.19
Lake
0.34
Lane
0.55
Josephine
0.48
Hood
River
1.01
Clackamas
0.78
Clatsop
0.83 Columbia
0.71
Washington
0.71
Union
0.61
Polk
0.35
Multnomah
0.59Tillamook
1.07
Umatilla
0.31
Yamhill
0.46
Marion
0.45
Crook
0.72
Benton
0.46Lincoln
0.76Linn
0.74
Jefferson
0.28
Douglas
1.17
Klamath
1.33
Wallowa
2.69
Morrow
3.4
Baker
1.43
Source: U.S. Census, BEA, Moody's Analytics
Oregon Housing Starts vs. HouseholdFormation using BEA data -- 2010 to2016
Less than 0.5
0.5 - 0.75
0.75 - 1.0
1.0 - 1.1
Greater than 1.1
Insufficient data or decrease in thenumber of households
2010 - 2016

Comprehensive Framework of Responses to Homelessness
ECONorthwest 25
The statewide average ratio, 0.63, indicates that 63 new units of housing were produced for every 100 new households formed during 2010-2016. This underproduction has decreased vacancy rates, put upward pressure on housing costs, and contributed to high rents and cost burdening across the state. In this time period, only a handful of counties produced enough housing to keep up with household formation. In some rural counties both the numerator, new housing, and the denominator, new households, may be low. In other counties, new housing produced may be vacation homes or vacation rentals which do not contribute to the overall housing stock.
The Role of Land-Use Regulation in Housing Underproduction and Implications for Homelessness Looking for causes of underproduction, economists examine housing’s three inputs: land, labor, and capital (construction materials, machinery, etc.). Tight housing markets may trigger shortages of labor and capital. If that happens, construction costs increase, and development feasibility declines in areas where prices do not keep pace. As a result, developers build fewer units in the region. Over the last several decades, inflation-adjusted housing prices have routinely outpaced inflation-adjusted construction costs which suggests that labor and capital are not the key drivers of housing inflation or constraints on production.31
The availability and cost of land has been the dominant factor in determining production levels across regions, and economists see land-use regulations playing a major role. Regulations take many forms: minimum lot sizes, minimum off-street parking requirements, maximum square footage constructions, maximum heights, adequate infrastructure requirements, historic preservation, and other factors that limit and influence the design, size, and type of homes produced.
Regulatory design and implementation affect the cost of development and ultimately housing supply. For example, holding other factors constant, regulations that limit the number of units per acre increase the cost of the land per unit and often lead to higher cost housing. Historic preservation districts, industrial zoning, and infrastructure requirements limit or close off access to development in certain parts of town. And in Oregon, urban growth boundaries limit the development of rural lands on the fringe of cities and towns to preserve forest and farmland. In addition to limiting what can be built where, regulations add costs as they are processed by
31 Jason Furman, Barriers to Shared Growth: The Case of Land Use Regulation and Economic Rents (Washington, DC: Urban Institute, November 20, 2015), 4, Figure 1.
“Modest improvements in the affordability of rental housing or its availability can substantially reduce the incidence of homelessness in the United States.” John Quigley and Steve Raphael
Comprehensive Framework of Responses to Homelessness
ECONorthwest 26
government agencies. Building permitting, design, and review processes require time to complete, create uncertainty, and add to the cost of development.
Policymakers enact regulations with positive goals in mind. Some serve critical health, safety, and environmental protection purposes. Others seek to optimize the use of existing public infrastructure and, importantly, some encourage the development of lower cost housing units that the market otherwise would not deliver.
While a number of economists have demonstrated the link between housing affordability and land-use regulations, Steven Raphael takes the analysis a step further and investigates the importance of regulation on homelessness.32 He compares regulatory regimes to PIT homeless counts across states and then controls for other determinants of homelessness. He estimates that if highly regulated states reduced their regulatory effort to the median, the number of people experiencing homelessness would fall by 7.2 percent nationally. If all states adopted the policies of the least-regulated states (e.g., Arkansas, Iowa, Missouri, Kansas), homeless populations would decline by 22.0 percent nationally. Raphael’s finding does not necessarily imply that housing deregulation is the first step in a plan to eradicate homelessness. The study does, however, identify the relationship between land-use regulation and homelessness that local policymakers should consider as they add to or subtract from their regulatory frameworks.
Development Challenges in Non-Metropolitan Oregon As the map in Figure 15 demonstrates, the underproduction of housing is a pervasive issue in urban and rural counties alike. Despite low costs of land in rural areas, the cost to construct new housing can be the same or higher. Since prices are lower, housing developers do not have many incentives to build in rural areas when profits may be higher in urban markets. Over the long-term, the market could reach an equilibrium where the lack of supply in rural areas would increase prices to the point at which developers see opportunity and build new units, thereby bringing prices back down. However, this does not account for variations in where people want to live, which is driven by macroeconomic conditions, job and educational opportunities, and demographic preferences. While regulatory barriers to development may not be limiting supply in rural areas, the lack of strong demand for new housing at price points that will cover construction costs will limit development interest. In this case, new construction of housing may not be feasible in rural areas without subsidies.
32 Steven Raphael, “Housing Market Regulation and Homelessness,” in How to House the Homeless (New York: Russell Sage Foundation, 2010), 136-37.
Comprehensive Framework of Responses to Homelessness
ECONorthwest 27
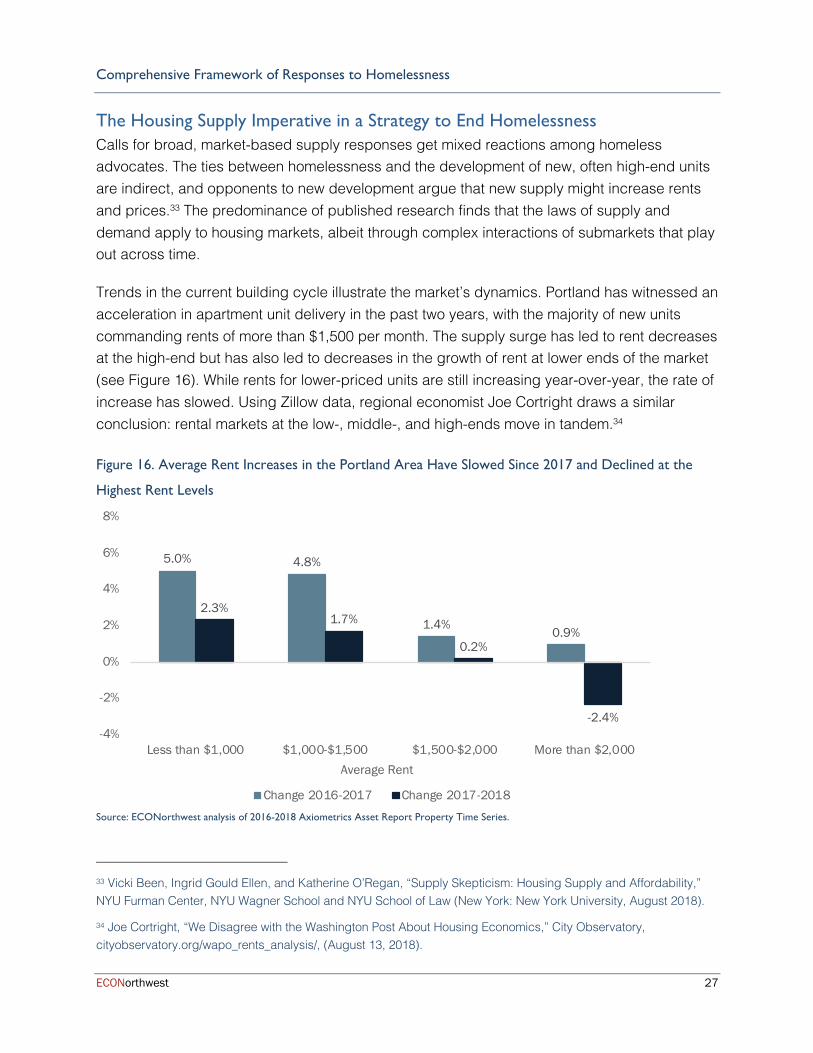
The Housing Supply Imperative in a Strategy to End Homelessness Calls for broad, market-based supply responses get mixed reactions among homeless advocates. The ties between homelessness and the development of new, often high-end units are indirect, and opponents to new development argue that new supply might increase rents and prices.33 The predominance of published research finds that the laws of supply and demand apply to housing markets, albeit through complex interactions of submarkets that play out across time.
Trends in the current building cycle illustrate the market’s dynamics. Portland has witnessed an acceleration in apartment unit delivery in the past two years, with the majority of new units commanding rents of more than $1,500 per month. The supply surge has led to rent decreases at the high-end but has also led to decreases in the growth of rent at lower ends of the market (see Figure 16). While rents for lower-priced units are still increasing year-over-year, the rate of increase has slowed. Using Zillow data, regional economist Joe Cortright draws a similar conclusion: rental markets at the low-, middle-, and high-ends move in tandem.34
Figure 16. Average Rent Increases in the Portland Area Have Slowed Since 2017 and Declined at the
Highest Rent Levels
Source: ECONorthwest analysis of 2016-2018 Axiometrics Asset Report Property Time Series.
33 Vicki Been, Ingrid Gould Ellen, and Katherine O’Regan, “Supply Skepticism: Housing Supply and Affordability,” NYU Furman Center, NYU Wagner School and NYU School of Law (New York: New York University, August 2018).
34 Joe Cortright, “We Disagree with the Washington Post About Housing Economics,” City Observatory, cityobservatory.org/wapo_rents_analysis/, (August 13, 2018).
5.0% 4.8%
1.4% 0.9%
2.3%1.7%
0.2%
-2.4%-4%
-2%
0%
2%
4%
6%
8%
Less than $1,000 $1,000-$1,500 $1,500-$2,000 More than $2,000Average Rent
Change 2016-2017 Change 2017-2018

Comprehensive Framework of Responses to Homelessness
ECONorthwest 28
A supply strategy starts with a top-line production goal. In Oregon’s case that will require returning to annual production levels that keep pace with household formation while simultaneously adding production to address the legacy of decades of underbuilding. Accelerating production requires a re-examination of the regulatory environment—both what is allowed in code and the processes by which regulations are implemented. Local zoning that prohibits high-density development in high-demand areas is a key production constraint and an important driver of the affordability problem.
Urban economist Ed Glaeser argues that the locus of regulatory control (local government) inherently leads to underproduction as neighborhoods organize in their own interests to limit growth and protect property values.35 He sees an important state role in regulatory reform—a combination of carrots and sticks and demonstrates that Massachusetts has examples of each. Once the state has determined a locality’s rules are too restrictive, it can deploy one of two models. The more powerful (but less politically popular) tool allows the state to override local rules entirely. A second tool requires communities that underproduce housing to make transfer payments to communities that build more. New Jersey has implemented similar state-level overrides of local zoning decisions, and California is considering related approaches.
Oregon House Speaker, Tina Kotek, will propose state-level interventions in the 2019 Legislative session aimed at accelerating housing supply. One concept that has received national attention would end single-family zoning in cities of 10,000 or more. 36 If implemented, proponents argue that the change could accelerate the development of duplexes, triplexes, and quads, which could provide a wider range of options for low- and middle-income households. The approach addresses development of the so-called “missing middle housing”—units between single-family homes and apartment complexes. Related legislative concepts could also encourage localities to build more housing around existing transit networks.
State lawmakers will also consider a modified version of rent control—a concept that economists believe has adverse effects on housing affordability in the longer term.37 A study of San Francisco’s program showed improved housing stability for the renters directly covered by
35 Ed Glaeser, Reforming Land Use Regulations (Washington, DC: The Brookings Institution, April 24, 2017), www.brookings.edu/research/reforming-land-use-regulations/.
36 Elliot Njus, “Oregon House Speaker proposes to abolish single-family zoning in many urban areas," The Oregonian, www.oregonlive.com/politics/2018/12/oregon-house-speaker-proposes-to-abolish-single-family-zoning-in-many-urban-areas.html, (December 14, 2018).
37 “Rent Control,” IGM Forum, www.igmchicago.org/surveys/rent-control, (February 7, 2012).

Comprehensive Framework of Responses to Homelessness
ECONorthwest 29
the program; however, researchers also found the policy slowed housing supply and caused a 5.1 percent increase in citywide rent.38
Means-Tested, Subsidized Housing Addressing the rates and types of housing produced by the market will have the largest impacts on the costs and availability of housing across the entire continuum. While benefits may accrue in the market for lower-cost housing, it may take decades. For many households at the lowest income levels (e.g., below 50% median family income [MFI]), the market fails to deliver any suitable housing at affordable costs.
For this segment of the market, action by federal, state, and/or local governments is needed to encourage housing production or provide programs and services that enable households to compete in the private market. Housing challenges at this end of the income spectrum are generally addressed through two broad policy approaches:
§ Demand-side approaches. Voucher programs that help low-income households compete in the private market for housing.
§ Supply-side approaches. Public housing, project-based rental assistance, tax credits, and regulatory approaches that reduce the operational cost of affordable housing developments thereby making it easier and more cost effective to develop.
Demand-Side Approaches Federal, state, and local governments intervene on the demand side of the housing market by directly providing housing to low-income households.
HUD Housing Choice Voucher (HCV) The largest program providing demand-side subsidies is HUD’s HCV tenant-based programs which assist an estimated 1.4 million households across the United States.39 These programs are targeted to extremely low-income (under 30% MFI) and very low-income (under 50% MFI) households by allowing them to pay only 30 percent of their income on housing. The subsidy pays the difference between the tenant’s portion of the rent and a fair market rent (FMR) set by HUD based on unit location and size. HCV and other rent assistance programs assign the subsidy to the household, giving them freedom to choose suitable housing in any neighborhood within the FMR area.
38 Rebecca Diamond, Timothy McQuade and Franklin Qian, “The Effects of Rent Control Expansion on Tenants, Landlords, and Inequality: Evidence from San Francisco,” NBER Working Paper No. 24181, (January 2018).
39 HUD’s project-based voucher program is described with the supply-side approaches.
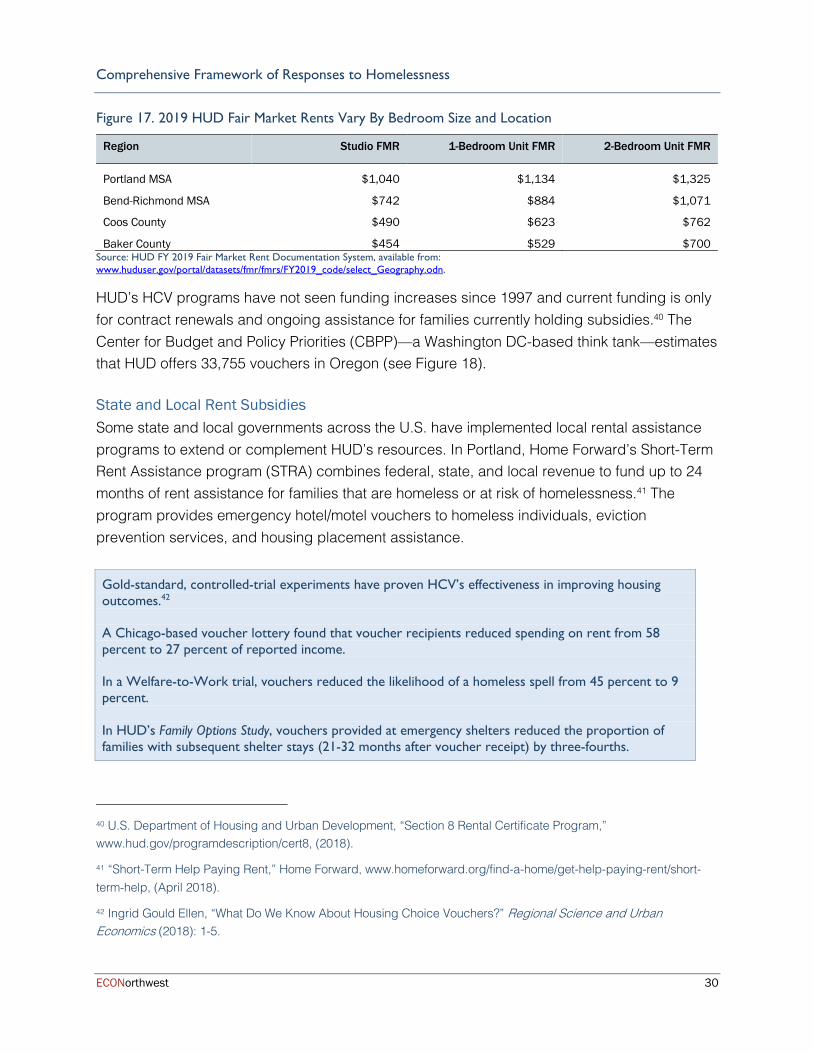
Comprehensive Framework of Responses to Homelessness
ECONorthwest 30
Figure 17. 2019 HUD Fair Market Rents Vary By Bedroom Size and Location
Region Studio FMR 1-Bedroom Unit FMR 2-Bedroom Unit FMR
Portland MSA $1,040 $1,134 $1,325
Bend-Richmond MSA $742 $884 $1,071
Coos County $490 $623 $762
Baker County $454 $529 $700 Source: HUD FY 2019 Fair Market Rent Documentation System, available from: www.huduser.gov/portal/datasets/fmr/fmrs/FY2019_code/select_Geography.odn.
HUD’s HCV programs have not seen funding increases since 1997 and current funding is only for contract renewals and ongoing assistance for families currently holding subsidies.40 The Center for Budget and Policy Priorities (CBPP)—a Washington DC-based think tank—estimates that HUD offers 33,755 vouchers in Oregon (see Figure 18).
State and Local Rent Subsidies Some state and local governments across the U.S. have implemented local rental assistance programs to extend or complement HUD’s resources. In Portland, Home Forward’s Short-Term Rent Assistance program (STRA) combines federal, state, and local revenue to fund up to 24 months of rent assistance for families that are homeless or at risk of homelessness.41 The program provides emergency hotel/motel vouchers to homeless individuals, eviction prevention services, and housing placement assistance.
Gold-standard, controlled-trial experiments have proven HCV’s effectiveness in improving housing outcomes.42 A Chicago-based voucher lottery found that voucher recipients reduced spending on rent from 58 percent to 27 percent of reported income. In a Welfare-to-Work trial, vouchers reduced the likelihood of a homeless spell from 45 percent to 9 percent. In HUD’s Family Options Study, vouchers provided at emergency shelters reduced the proportion of families with subsequent shelter stays (21-32 months after voucher receipt) by three-fourths.
40 U.S. Department of Housing and Urban Development, “Section 8 Rental Certificate Program,” www.hud.gov/programdescription/cert8, (2018).
41 “Short-Term Help Paying Rent,” Home Forward, www.homeforward.org/find-a-home/get-help-paying-rent/short-term-help, (April 2018).
42 Ingrid Gould Ellen, “What Do We Know About Housing Choice Vouchers?” Regional Science and Urban Economics (2018): 1-5.
Comprehensive Framework of Responses to Homelessness
ECONorthwest 31
Supply-Side Approaches Federal, state, and local governments can also intervene on the supply side of the housing market, either by directly providing housing to low-income households or by encouraging the private market to do so.
Public Housing Between 1940 and 1970, the federal government funded the construction of millions of public housing units across the country.43 HUD served 4,756 Oregon families in public housing facilities in 2016—a small program compared to the HCV program. Congress has underfunded public housing and, nationally, buildings require an estimated $26 billion in capital repairs.44 HUD is encouraging local housing agencies to convert their public housing into project-based rent assistance programs (see below), which would allow agencies to leverage public and private funding to pay for repairs and upgrades.45
Project-Based Rent Assistance Project-based rent assistance is provided by a few HUD programs and the U.S. Department of Agriculture’s (USDA) Rural Development (RD) program. In general, project-based assistance is similar to tenant-based assistance, but the subsidy is tied to an affordable housing unit rather than a household.46 This subsidy bypasses the tenant and is paid directly from HUD to the landlord, thereby increasing the supply of affordable housing units.
Project-based rent assistance programs are often deeply subsidized, allowing units to be affordable for households with extremely low incomes (below 30% MFI). These programs are a direct federal subsidy to the local economy and are incredibly valuable from a subsidized housing and economic impact perspective. In Oregon, HUD served 9,210 families in project-based rent assistance in 2016 while the USDA RD program served another 4,629 families (see Figure 18). These programs are dwarfed by the total need in Oregon.
43 Katharine L. Shester, “The Local Economic Effects of Public Housing in the United States, 1940–1970,” The Journal of Economic History 73, no. 4 (2013): 978-1016.
44 Terner Center for Housing Innovation, Lessons for the Future of Public Housing: Assessing the Early Implementation of the Rental Assistance Demonstration Program (Berkeley: UC Berkeley, October 2017).
45 U.S. Department of Housing and Urban Development, “Rental Assistance Demonstration,” www.hud.gov/RAD, (2019).
46 The unit has a Fair Market Rent determined by HUD relative to the location and size. The tenant pays 30 percent of their income to the landlord, and HUD pays the difference between the tenant’s portion and the FMR.

Comprehensive Framework of Responses to Homelessness
ECONorthwest 32
Figure 18. Major Federal Rent Assistance Programs Do Not Reach all Low Income Renters
Program
Assistance Program
Total
Assisted
Unassisted
Low-Income
Renters HUD
Vouchers
HUD
Public
Housing
HUD Sec. 8
Project Based
HUD Supportive
Elderly &
Disabled
USDA RD
Sec 521
Oregon 33,755 4,756 9,210 1,942 4,629 56,000 153,000
Washington 52,022 11,923 14,387 3,068 5,937 92,000 230,000
California 303,162 28,699 97,669 15,736 17,072 491,000 1,680,000 Source: Center for Budget and Policy Priorities, 2016-2017 Fact Sheet on Federal Rent Assistance. Available from: www.cbpp.org/research/housing/national-and-state-housing-fact-sheets-data. Note: Total figures are rounded and will not sum. Some of the difference comes from other small federal rent assistance programs.
USDA Rural Development Program The USDA RD program is an important source of affordable rental housing for rural America. Among its many community development, housing, and anti-poverty programs focused on rural areas, RD provides direct lending to developers (RD Section 515 program) and offers project-based rent assistance to very low income seniors, families, and people with disabilities (RD Section 521 program).47
These two programs are linked and at risk. A recent report from the Housing Assistance Council—a nationwide nonprofit that researches, advocates, and build homes in rural America—indicates that no new funding for the Section 515 program has been provided in several years, and a significant number of program loans are maturing, putting the rent assistance and residents at risk.48 Residents in these properties are often seniors or people with disabilities, have a nationwide average income of only $13,600, and are “among the most vulnerable households in the nation.” The CBPP suggests that in Oregon
47 “USDA Rural Development Summary of Major Programs”, United States Department of Agriculture, www.rd.usda.gov/files/RD_ProgramMatrix.pdf, (November 2017).
48 Housing Assistance Council, Rental Housing for a 21st Century Rural America: A Platform for Preservation (Washington, DC: Housing Assistance Council, September 2018).
USDA RD 515 Loans are critical “Once a loan is paid off, the property owner is no longer subject to government oversight or regulations on use of their property, the federal government is no longer paying to support that housing, any remaining or replacement financing has a higher interest rate than the USDA loan, the tenants are no longer eligible for USDA Rental Assistance, and in some instances, the homes may no longer be affordable for their tenants.” -Housing Assistance Council
Comprehensive Framework of Responses to Homelessness
ECONorthwest 33
8,700 non-metropolitan households receive federal rent assistance (15.5 percent of all federally assisted households), and RD assists 4,629 of them (about 53.2 percent).49
Market Subsidies Market subsidies are a much more common supply-side intervention and include tax incentives (like the Low Income Housing Tax Credit [LIHTC]), zoning requirements, and reduced fees or expedited land use, design, and permitting reviews. These interventions range from requiring rent-restricted affordable rental housing to be built (e.g., inclusionary zoning) or incentivizing it by reducing upfront development costs (such as reduced fees or the LIHTC) or reductions in ongoing operations (such as tax incentives, LIHTC, or project-based rent assistance). The LIHTC is the largest program to develop rent-restricted affordable housing.
Publicly Funded Construction of Affordable Housing Through a variety of tax or fee mechanisms, state and local governments can directly finance the construction of affordable housing. In 2016, voters in the City of Portland approved a $258.4 million general-obligation bond with the goal of creating 1,300 newly affordable homes.50 In November 2018, Metro-area voters approved a $652.8 million bond to finance affordable housing.
Inclusionary Zoning Inclusionary Zoning (IZ) requires or incents developers to set aside a certain share of new housing at a price affordable to people of low or middle income. In 2016, the Oregon Legislature passed Senate Bill 1533 which allows a jurisdiction to implement an inclusionary zoning policy if it meets certain requirements. These requirements relate to the income at which the units are affordable (80 percent MFI or 60 percent MFI), the percent of the project set aside as affordable (no more than 20 percent of the project), the size of the project (only if greater than 20 units), and the offering of both an in-lieu fee option and incentive package.
In theory, private market-rate development supports some portion of the cost of the affordable units in an inclusionary project. However, in almost all cases, public incentives are also required. These incentives can be regulatory (reduced parking requirements or density bonuses, for example) or financial (property tax abatements or other forms of public investment). Funds can come from general funds, urban renewal, or other municipal sources.
49 “2016-2017 Fact Sheet on Federal Rent Assistance,” Center for Budget and Policy Priorities, www.cbpp.org/research/housing/national-and-state-housing-fact-sheets-data.
50 Portland Housing Bureau, Portland’s Housing Bond Policy Framework (Portland: Portland Housing Bureau, October 2, 2017).

Comprehensive Framework of Responses to Homelessness
ECONorthwest 34
Oregon’s Affordable Housing Gap: An Upper Bound on the Cost of Homelessness Prevention Broad trends in housing and the availability of housing assistance—in its variety of forms—are key affordability drivers. Unlike other aspects of the safety net, housing programs do not automatically expand or contract with need.51 Increases in rents or big downturns in the job market do not trigger additional assistance. By and large, Congress determines the level of assistance through its annual appropriations process. The CBPP has calculated the gap between the number of households that received federal housing assistance and the total number of households that would be served if the housing programs functioned as a means-tested entitlement program.
The CBPP estimated that in 2016 Oregon had 209,000 low-income renter households who either received federal assistance or were in need of it.52 Of those, slightly more than one-quarter (56,000 households) received federal housing assistance. Seventy-three percent (153,000 households) received no assistance and were severely cost-burdened (i.e., paid more than one-half of household income for rent and utilities). Oregon has the ninth lowest share of federally rent assisted households compared to the total number of low-income households (see Figure 19) and is joined by many other states in the West. Low coverage across the West is driven by high rents and disproportionately high need. Congressional appropriations for housing assistance do not take need into account in the same way entitlement programs do (e.g., Medicaid, Medicare, SNAP). Consequently, federal assistance does not stretch as far in high housing cost regions.
51 Most of the federal housing portfolio is part of the discretionary budget and is subject to the Congressional appropriation process. By contrast, Medicaid, Medicare, and SNAP are entitlement programs with budgets that automatically expand or contract with the number of people deemed eligible to receive them.
52 CBPP defined low-income as households that have incomes that do not exceed 80 percent of local area median rent. It characterizes households in need of rent assistance as those who are low income and have severe housing cost burdens.
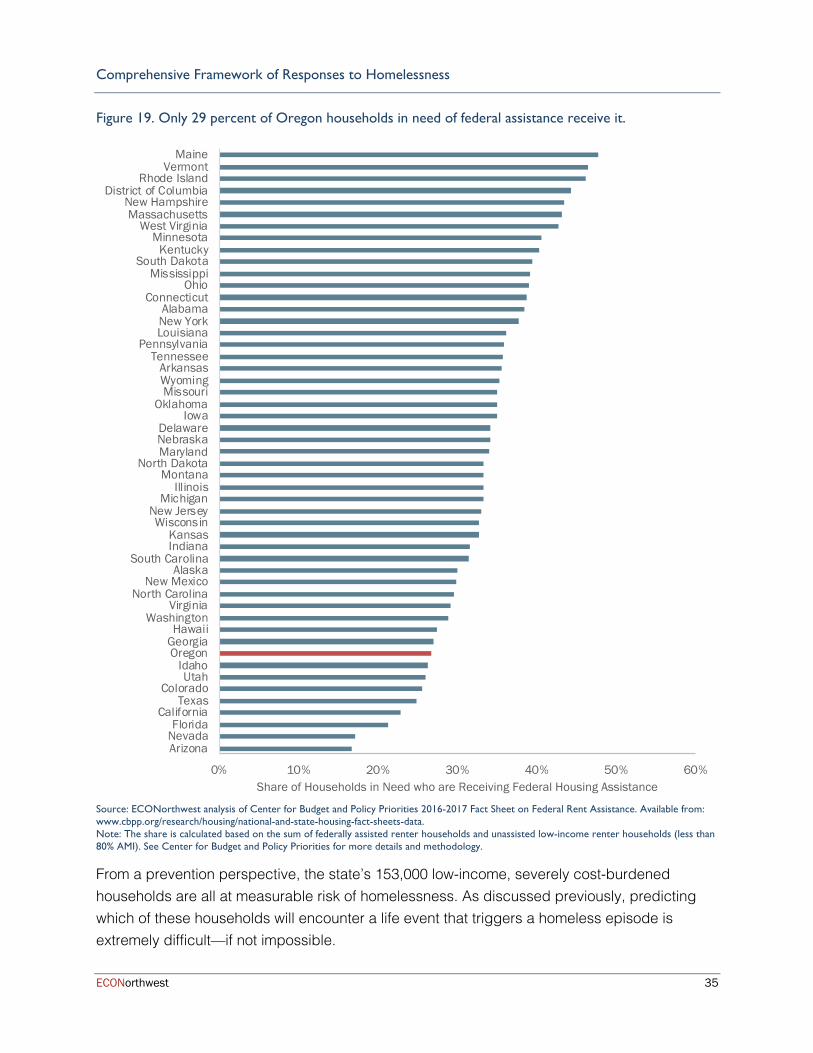
Comprehensive Framework of Responses to Homelessness
ECONorthwest 35
Figure 19. Only 29 percent of Oregon households in need of federal assistance receive it.
Source: ECONorthwest analysis of Center for Budget and Policy Priorities 2016-2017 Fact Sheet on Federal Rent Assistance. Available from: www.cbpp.org/research/housing/national-and-state-housing-fact-sheets-data. Note: The share is calculated based on the sum of federally assisted renter households and unassisted low-income renter households (less than 80% AMI). See Center for Budget and Policy Priorities for more details and methodology.
From a prevention perspective, the state’s 153,000 low-income, severely cost-burdened households are all at measurable risk of homelessness. As discussed previously, predicting which of these households will encounter a life event that triggers a homeless episode is extremely difficult—if not impossible.
0% 10% 20% 30% 40% 50% 60%
ArizonaNevadaFlorida
CaliforniaTexas
ColoradoUtah
IdahoOregonGeorgiaHawaii
WashingtonVirginia
North CarolinaNew Mexico
AlaskaSouth Carolina
IndianaKansas
WisconsinNew Jersey
MichiganIllinois
MontanaNorth Dakota
MarylandNebraskaDelaware
IowaOklahoma
MissouriWyomingArkansas
TennesseePennsylvania
LouisianaNew YorkAlabama
ConnecticutOhio
MississippiSouth Dakota
KentuckyMinnesota
West VirginiaMassachusetts
New HampshireDistrict of Columbia
Rhode IslandVermont
Maine
Share of Households in Need who are Receiving Federal Housing Assistance
Comprehensive Framework of Responses to Homelessness
ECONorthwest 36
The cost of extending subsidies to these low-income, severely cost-burdened households can serve as an upper bound of the cost of homelessness prevention. The federal government spent an average of $7,250 per year on assisted households in 2016. Extending assistance to these 153,000 unaided, severely cost-burdened households would cost almost $1.1 billion annually. Rough estimates suggest that homelessness would fall by four people for every 100 additional households served.53 By this measure, extending universal housing assistance to all low-income, severely cost-burdened households could reduce the region’s homeless count by about 6,120 people.
No state has attempted to fill the housing assistance gap in this way.54 Policy discussions typically turn to redesigned, targeted programs that could serve broader populations at lower cost and ideally achieve a similar level of homelessness prevention at a lower price. Alternative programming of shallow and temporary subsidies (e.g., payment of rent and utility arrears, move-in expenses, time-limited rent assistance) have been deployed but evidence on effectiveness is limited. Along these lines, the Bipartisan Policy Center’s Millennial Housing Commission recommended making one-time emergency rental assistance available to all households with incomes between 30 percent and 80 percent MFI.55 Similarly, experts at the Urban Institute recommended testing a flat subsidy equal to 35 percent of area FMR.56 Either of these approaches, or variations of them, could serve as useful demonstration projects.
The $1.1 billion annual affordability gap underscores a central challenge of homeless policy in a tight housing market like Oregon’s. If the region cannot manage to slow rent inflation, the number of severely cost burdened households will continue to grow. Each of those households has an elevated likelihood of becoming homeless. To date, no community has demonstrated how to cost-effectively prioritize pre-crisis prevention assistance across this broad, at-risk population. So, policymakers are left with choices: urge federal action, attempt to rally political support for a locally funded expansion of conventional housing assistance, or experiment with shallow and temporary subsidies.
53 Gould Ellen and O’Flaherty, How to House the Homeless, 9.
54 Mary Cunningham, Josh Leopold, and Pamela Lee, A Proposed Demonstration of a Flat Rental Subsidy for Very Low-Income Households (Washington, DC: Urban Institute, January 2014), 9.
55 “Housing American’s Future: New Directions for National Policy,” Bipartisan Policy Center, www.bipartisanpolicy.org/wp-content/uploads/sites/default/files/BPC_Housing%20Report_web_0.pdf, (2013).
56 Cunningham et al., 18
Comprehensive Framework of Responses to Homelessness
ECONorthwest 37
Targeted Services for High-Needs, High-Cost Homeless Individuals and Families The next level of policy intervention pairs housing subsidies with intensive supportive services for individuals or families with the highest likelihood of long spells of homelessness and associated service costs. Rigorous client-selection criteria and carefully designed policies are keys to success.
Targeting the Chronically Homeless Coordinated, national initiatives to address chronic homelessness started in the early 2000s. Ethical concerns together with the recognition of high-service costs associated with the population motivated federal policy.57 Early policy interventions often involved multi-step processes that required demonstrated progress in treatment programs before a homeless individual would become eligible for housing services. Recognized best practices then shifted to permanent supportive housing (PSH), which provides rent assistance and supportive services focused on mental health, substance abuse treatment, and employment for residents with no time limit. The Oregon Statewide Supportive Housing Strategy Workgroup (SSHSW)—jointly sponsored by the Oregon Health Authority (OHA) and Oregon Housing and Community Services (OHCS)—additionally recommends a Housing First model, which does not require treatment of mental illness or substance abuse as a condition of housing assistance.58
The indefinite duration of services and high costs pose a challenge for program targeting. Higher cost programming is more likely to sustain political support if program managers can show that the benefits of services outweigh the costs. PSH per person per year costs are estimated at $17,000 ($11,000 for rent assistance and $6,000 for supportive services).59 If a PSH program can demonstrate its beneficiaries would have induced even higher spending in the program’s absence, the net savings could be deployed to additional homeless services or other public purposes.
57 Libby Perl and Erin Bagelman, Chronic Homelessness: Background, Research, and Outcomes (Washington, DC: Congressional Research Service, December 8, 2015), 2.
58 “Resources: Housing First,” National Alliance to End Homelessness, www.endhomelessness.org/resource/housing-first/, (April 2016).
59 Halil Toros and Daniel Flaming, Prioritizing Which Homeless People Get Housing Using Predictive Algorithms: An Evidence-Based Approach to Prioritizing High-Cost and High-Need Homeless Persons for Permanent Supportive Housing (Los Angeles: Economic Roundtable, 2018).
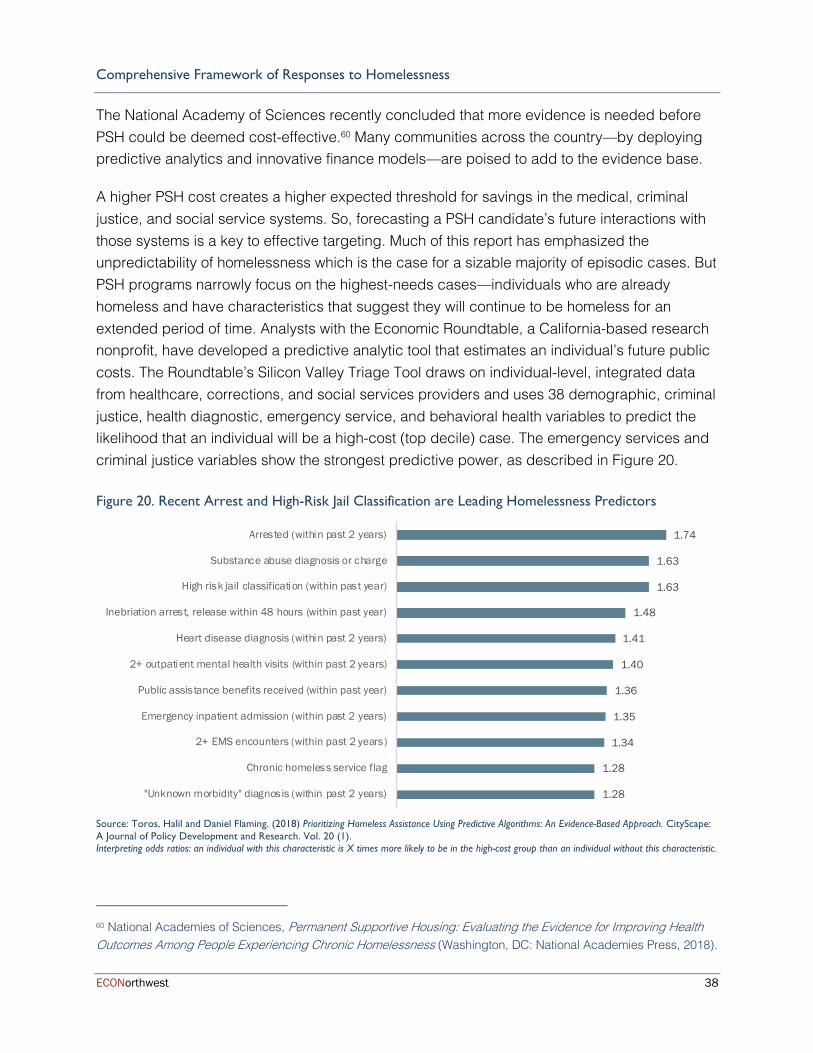
Comprehensive Framework of Responses to Homelessness
ECONorthwest 38
The National Academy of Sciences recently concluded that more evidence is needed before PSH could be deemed cost-effective.60 Many communities across the country—by deploying predictive analytics and innovative finance models—are poised to add to the evidence base.
A higher PSH cost creates a higher expected threshold for savings in the medical, criminal justice, and social service systems. So, forecasting a PSH candidate’s future interactions with those systems is a key to effective targeting. Much of this report has emphasized the unpredictability of homelessness which is the case for a sizable majority of episodic cases. But PSH programs narrowly focus on the highest-needs cases—individuals who are already homeless and have characteristics that suggest they will continue to be homeless for an extended period of time. Analysts with the Economic Roundtable, a California-based research nonprofit, have developed a predictive analytic tool that estimates an individual’s future public costs. The Roundtable’s Silicon Valley Triage Tool draws on individual-level, integrated data from healthcare, corrections, and social services providers and uses 38 demographic, criminal justice, health diagnostic, emergency service, and behavioral health variables to predict the likelihood that an individual will be a high-cost (top decile) case. The emergency services and criminal justice variables show the strongest predictive power, as described in Figure 20.
Figure 20. Recent Arrest and High-Risk Jail Classification are Leading Homelessness Predictors
Source: Toros, Halil and Daniel Flaming. (2018) Prioritizing Homeless Assistance Using Predictive Algorithms: An Evidence-Based Approach. CityScape: A Journal of Policy Development and Research. Vol. 20 (1). Interpreting odds ratios: an individual with this characteristic is X times more likely to be in the high-cost group than an individual without this characteristic.
60 National Academies of Sciences, Permanent Supportive Housing: Evaluating the Evidence for Improving Health Outcomes Among People Experiencing Chronic Homelessness (Washington, DC: National Academies Press, 2018).
1.28
1.28
1.34
1.35
1.36
1.40
1.41
1.48
1.63
1.63
1.74
"Unknown morbidity" diagnosis (within past 2 years)
Chronic homeless service flag
2+ EMS encounters (within past 2 years)
Emergency inpatient admission (within past 2 years)
Public assistance benefits received (within past year)
2+ outpatient mental health visits (within past 2 years)
Heart disease diagnosis (within past 2 years)
Inebriation arrest, release within 48 hours (within past year)
High risk jail classification (within past year)
Substance abuse diagnosis or charge
Arrested (within past 2 years)

Comprehensive Framework of Responses to Homelessness
ECONorthwest 39
The tool identifies the highest cost individuals: males aged 35-44 who are tri-morbid (i.e., diagnosed with a mental disorder, a chronic medical condition, and abuse drugs or alcohol) and are frequent users of hospital emergency rooms, psychiatric facilities, and jail mental health cell blocks. In the tool’s valuation exercises, the individuals correctly predicted as “high cost” generated cross-agency service costs of $60,000-$90,000 annually during 2008-2012. Individuals predicted as “lower costs” generated costs of less than $10,000 annually.
The promise of well-targeted PSH models has inspired a number of “pay for success” demonstrations. In one of the longer-running collaborations, the Massachusetts Housing and Shelter Alliance is partnering with Santander Bank, the United Way of Massachusetts Bay and Merrimack Valley, and the Corporation for Supportive Housing to provide 500 PSH units that house up to 800 chronically homeless individuals over eight years.61 An April 2018 report indicated the program had housed 640 individuals and that 93 percent of the participants were either still enrolled in the program or had a positive exit. A triage tool indicated that in the six months prior to enrollment PSH beneficiaries had accumulated almost 51,669 nights in shelter, 3,243 days in the hospital, 1,233 emergency room visits, 889 nights in detox, and 582 ambulance calls.62 An early impact study estimates the program saved $5,966 per participant over six months.63
Expansion of PSH services is already high on the state’s homeless policy agenda. In December 2018, the Statewide Supportive Housing Strategy Workgroup (SSHSW) issued its PSH recommendations, including a call for capital to build new units.64 The state’s PIT count of chronically homeless individuals gives a rough sense of need. The number of people experiencing chronic homelessness across the state gradually rose from about 2,800 people in 2007 to 4,000 in 2015 (a 41.8 percent increase) and then declined to 3,400 in 2017 (a 19.7 percent increase over the ten year period).
Chronic homelessness is strongly related to, but not synonymous with, the highest cost cases that would yield net savings through PSH programming. Given the cost of programming, a
61 “Massachusetts Launches Pay for Success Initiative to Reduce Chronic Individual Homelessness,” Commonwealth of Massachusetts Executive Department Office of Governor Deval L. Patrick, archives.lib.state.ma.us/bitstream/handle/2452/217588/ocn795183245-2014-12-08b.pdf?sequence=1&isAllowed=y, (December 8, 2014).
62 Massachusetts Housing and Shelter Alliance, Pay For Success 2018 Fact Sheet, www.mhsa.net/sites/default/files/PFS%20Factsheet%20April%202018.pdf, (March 29, 2018).
63 Harvard Kennedy School Government Performance Lab, “Reducing Chronic Homelessness in Massachusetts,” (Boston: Harvard University, March 8, 2018).
64 Oregon Housing and Community Services, (2018).
Comprehensive Framework of Responses to Homelessness
ECONorthwest 40
rigorous triage tool—backed by integrated health, criminal justice, and social service data—is an important input to service expansion. Along these lines, Lane County and the Corporation for Supportive Housing (CSH) have launched a Frequent User System Engagement (FUSE) initiative and report reductions in use of jail, police contacts, and emergency services for program participants.65 CSH’s FUSE initiatives are extending in Bend and Portland as well.66
Targeting Assistance to Homeless Families Drawing on the progress of PSH services for chronically homeless individuals, policy experts are exploring program designs for families with children. The dynamics are similar: homelessness and housing instability impose high costs on families and especially on children (e.g., learning loss, lower rates of educational attainment, lower lifetime earnings). If targeted well, benefits to taxpayers more than offset the service costs.
Experts see possibilities in a number of areas.67 HUD’s Family Options Study showed that long-term, conventional housing subsidies provided to homeless families significantly reduced homelessness over the subsequent three years.68 Less effective, but also less costly, Rapid Rehousing programs (RRH)—time-limited rental assistance and light case management—show some promise as a crisis intervention tool. And paralleling the work with chronically homeless individuals, programming could target higher cost PSH services to high-need families involved in the child welfare system.
65 Jessica Babb, “New Program for Homeless Saves Taxpayer Money,” www.kezi.com/content/news/New-program-for-homeless-saves-taxpayer-money-474656433.html, (February 20, 2018).
66 “The FUSE Model of Supportive Housing in Oregon: Community Activation to Create Housing for Frequent Users,” Housing First Partners Conference 2018, static1.squarespace.com/static/513e08bfe4b0b5df0ec24cda/t/5adf716870a6ad6627972a55/1524593003524/WO8F15%7E1.PDF.
67 Maya Brennan, Mary Cunningham, James Gastner, and Jamie Taylor, Ending Family Homelessness (Washington, DC: Urban Institute, August 15, 2017).
68 U.S. Department of Housing and Urban Development, Office of Policy Development and Research, Family Options Study: 3-Year Impacts of Housing and Services Interventions for Homeless Families (Washington, DC: U.S. Department of Housing and Urban Development, October 2016).
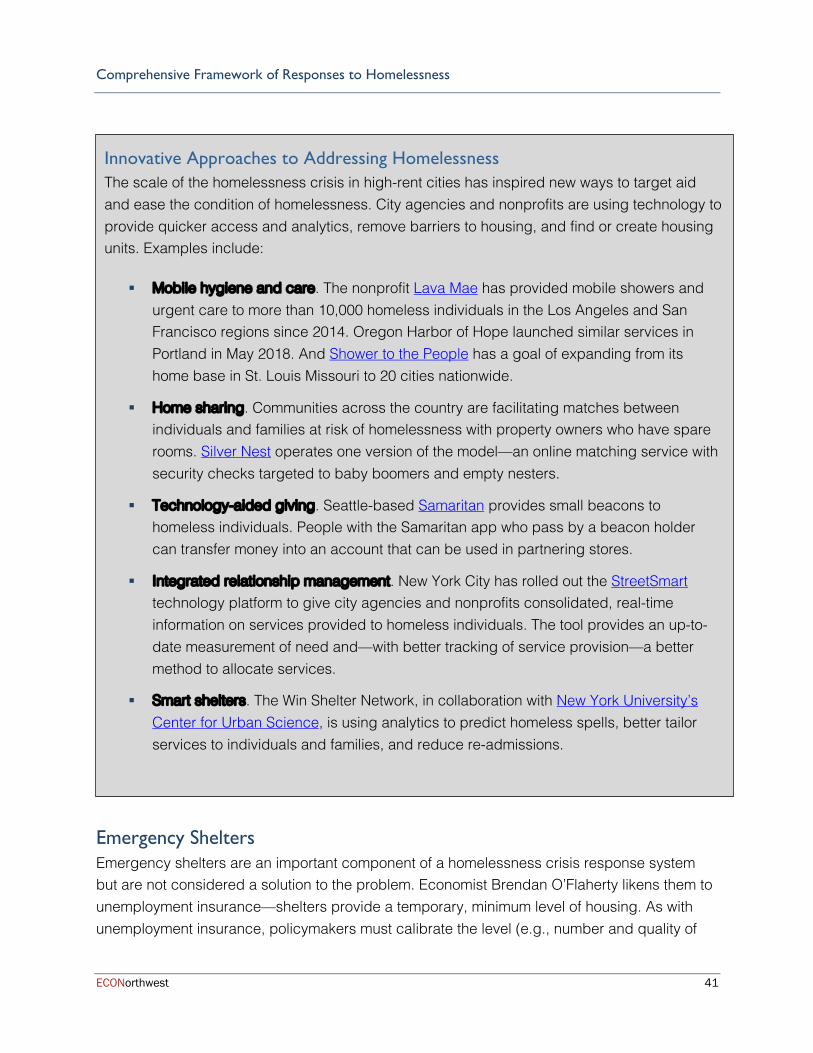
Comprehensive Framework of Responses to Homelessness
ECONorthwest 41
Emergency Shelters Emergency shelters are an important component of a homelessness crisis response system but are not considered a solution to the problem. Economist Brendan O’Flaherty likens them to unemployment insurance—shelters provide a temporary, minimum level of housing. As with unemployment insurance, policymakers must calibrate the level (e.g., number and quality of
Innovative Approaches to Addressing Homelessness The scale of the homelessness crisis in high-rent cities has inspired new ways to target aid and ease the condition of homelessness. City agencies and nonprofits are using technology to provide quicker access and analytics, remove barriers to housing, and find or create housing units. Examples include:
§ Mobile hygiene and care. The nonprofit Lava Mae has provided mobile showers and urgent care to more than 10,000 homeless individuals in the Los Angeles and San Francisco regions since 2014. Oregon Harbor of Hope launched similar services in Portland in May 2018. And Shower to the People has a goal of expanding from its home base in St. Louis Missouri to 20 cities nationwide.
§ Home sharing. Communities across the country are facilitating matches between individuals and families at risk of homelessness with property owners who have spare rooms. Silver Nest operates one version of the model—an online matching service with security checks targeted to baby boomers and empty nesters.
§ Technology-aided giving. Seattle-based Samaritan provides small beacons to homeless individuals. People with the Samaritan app who pass by a beacon holder can transfer money into an account that can be used in partnering stores.
§ Integrated relationship management. New York City has rolled out the StreetSmart technology platform to give city agencies and nonprofits consolidated, real-time information on services provided to homeless individuals. The tool provides an up-to-date measurement of need and—with better tracking of service provision—a better method to allocate services.
§ Smart shelters. The Win Shelter Network, in collaboration with New York University’s Center for Urban Science, is using analytics to predict homeless spells, better tailor services to individuals and families, and reduce re-admissions.
Comprehensive Framework of Responses to Homelessness
ECONorthwest 42
beds) and duration of assistance to ensure shelters do not delay re-entry to permanent housing.
Shelters are the policy of last resort. Effective system management diverts entries if safe housing alternatives exists, provides temporary access to a crisis bed, and offers a gateway to permanent housing. Following this philosophy, many regions across the U.S. de-emphasized shelters in the early 2000s and redirected limited resources to permanent housing solutions. Oregon’s tight housing market broke the model: high rents put more low-income households into severe cost-burdened status, personal crises pushed some of those households into homelessness, and the evidence-based solution to housing re-entry—deep, sustained rental subsidies—were expensive and in short supply. Inflow to shelters exceeded outflows into permanent housing, and visible, unsheltered homelessness expanded. And, in 2018, HUD reported that Oregon had the third highest rate of unsheltered homeless individuals in the U.S.69
Oregon has company. A number of Western states—with generally temperate climates—have not expanded their shelter capacity to match their sizable homeless populations (see Figure 21). In other parts of the country, the supply of shelter beds roughly matches the size of the homeless population. In some places, that’s driven by “right to shelter” laws that entitle some or all homeless individuals to shelter and board. New York City’s right to shelter ordinance is the best known.70 Supporters of the law point to the city’s low unsheltered homeless rate while opponents argue that spending on temporary beds crowds out investments in treatment services and permanent housing solutions.71
In 2016, Multnomah County attempted to implement a right to shelter policy for families, but demand quickly outpaced the supply of beds, and the County reinstituted a waitlist in November 2017.72 California state senator Scott Weiner, who has earned national attention for a
69 U.S. HUD, 2018 “Annual Homeless Assessment Report to Congress,” 27.
70 Supreme Court of the State of New York, County of New York, “The Callahan Consent Decree,” (New York: Coalition for the Homeless, 1981).
71 Heather Knight, “Radical notion: State Sen. Wiener works on plan to shelter every homeless person in California,” The San Francisco Chronicle, www.sfchronicle.com/bayarea/heatherknight/article/Radical-notion-Sen-Wiener-works-on-plan-to-13455768.php, (December 11, 2018).
72 Rachel Monahan, “Portland’s Family Shelter Will No Longer Take Anyone Who Comes to Its Door,” Willamette Week, www.wweek.com/news/city/2017/11/10/portlands-family-shelter-will-no-longer-take-anyone-who-comes-to-its-door/, (November 10, 2017).

Comprehensive Framework of Responses to Homelessness
ECONorthwest 43
variety of proposals aimed at easing the state’s housing crisis, recently introduced a bill to ensure a safe place to sleep and keep one’s belongings.73
Figure 21. Oregon and Other Western States Stand Out for Low Emergency Bed Inventories Relative to
Homeless Populations
Source: ECONorthwest analysis of HUD 2017 Point-In-Time Counts, HUD 2017 Housing Inventory Counts, and U.S. Census Bureau 2018 Annual Estimates of the Resident Population for the United States, Regions, States, and Puerto Rico. Notes: Shelter beds per 10,000 people include all year round emergency shelter beds, transitional housing units, and safe haven beds for currently homeless individuals divided by state population. Line demonstrates a relationship of 1:1 shelter bed to individual experiencing homelessness (line is not the line of best fit to the data).
While these variations across the nation are dramatic, different shelter inventories and capacities exist across the seven CoCs in Oregon. The Portland-Gresham-Multnomah County CoC had approximately 31.9 emergency shelter beds for every 10,000 people in the county, whereas the Beaverton-Hillsboro-Washington County CoC only had 4.2 and Clackamas County had 2.1 beds available.
73 “Senator Wiener Introduces Right to Shelter Bill, to Ensure Homeless Individuals and Families Throughout California Have Access to Shelter,” California State Senate District 11, www.sd11.senate.ca.gov/news/20181205-senator-wiener-introduces-right-shelter-bill-ensure-homeless-individuals-and-families, (December 5, 2018).
0
10
20
30
40
50
60
0 10 20 30 40 50 60
Shel
ter B
eds
per 1
0,00
0 Pe
ople
Homeless Population per 10,000 People
Hawaii
New York
California
Oregon Washington
Nevada

Comprehensive Framework of Responses to Homelessness
ECONorthwest 44
Figure 22: Shelter Bed Availability for Currently Homeless Individuals Varies Across the State
2017 Housing Inventory
Count
Emergency
Shelter Beds
Transitional & Safe
Haven Beds
Total Beds Available to
Currently Homeless
Beds per
10,000
Population
Eugene-Springfield-Lane County CoC
475 96 571 15.4
Portland-Gresham-Multnomah County CoC
1,749 813 2,562 31.9
Medford-Ashland-Jackson County CoC
170 165 335 15.4
Central Oregon CoC 211 61 272 11.9
Oregon Balance of State CoC
1,390 1,185 2,575 17.0
Hillsboro-Beaverton-Washington County CoC
96 152 248 4.2
Clackamas County CoC 16 69 85 2.1
Source: ECONorthwest analysis of U.S. HUD 2017 Housing Inventory Counts.
Public opinion on unsheltered homelessness is clear. When asked about solutions for their immediate neighborhoods, 82 percent of Portlanders responding to a survey favored building permanent shelters. Only 26 percent of respondents supported camping in neighborhood parks.74 The inherent challenge to shelter policy—particularly in a tight housing market—is finding the balance between the public’s strong support for system expansion and experts’ equally strong warnings that an overbuilt shelter system becomes an expensive permanent solution for too many individuals and families. Recognizing the health, public safety, and sanitation concerns associated with unsheltered populations, many community plans, such as Multnomah County’s A Home For Everyone’s plan, call for expanded emergency beds.
How the shelter system scales from here is unclear. No standard ratios or formulas exist. That said, Oregon, California, Washington, and Hawaii—which collectively have 16.1 percent of the U.S. population and 57.9 percent of country’s unsheltered homeless population—are testing the policy frontier.
74 DHM Research, KGW News Homelessness Survey (Portland: December 2017), 159-162.
The inherent challenge in shelter policy is finding the balance between the public’s strong support for system expansion and experts’ equally strong warnings that an overbuilt shelter system becomes an expensive permanent solution for too many individuals and families.

Comprehensive Framework of Responses to Homelessness
ECONorthwest 45
Better progress on the state’s vision of ending chronic homelessness would free up emergency shelter capacity. That’s a necessary first step. Deeper analysis of Homeless Management Information System (HMIS) data might yield insights into patterns of shelter use, identify frequent users, offer ideas on how to further reduce the state’s already below-average shelter spells, and boost capacity. The situation also calls for alternative shelter and support models (e.g., relocation centers, tiny home villages, mobile hygiene, and storage facilities).
Conclusions and Recommendations
ECONorthwest 46
Conclusions and Recommendations Oregon faces two, related homelessness crises.
One involves roughly 3,400 chronically homeless individuals facing persistent barriers to housing, such as mental and physical disabilities, substance abuse issues, criminal records, and/or other problematic circumstances. Many of the chronically homeless would struggle to maintain stable housing regardless of the cost of housing or job prospects.
The second crisis involves more than 150,000 households: the episodic, short-term homeless plus the growing numbers of low-income severely cost-burdened renters on the verge of homelessness. Oregon’s second crisis has two causes: an under-supplied housing market and a discretionary rental assistance program that does not rise with need.
The two crises require different strategies and tactics. The first—given its scale—can turn to state and locally financed interventions implemented by a familiar network of public and nonprofit agencies. The second crisis is massive by comparison and requires action by a diverse array of government and private-sector actors. Universal and deep rent subsidies would be one way to address the crisis, but it comes with a price tag—for Oregon, more than $1 billion annually—that no other state in the country has been willing to bear.
So, where do we go from here?
Plans to address homelessness should always be mindful of key takeaways from experts Gould Ellen and O’Flaherty: 1) housing matters—broad trends in the housing market will drive the flow into homeless status, and 2) targeting matters—individuals with high needs or high systems costs today are strong predictors of high needs and high costs tomorrow.
Oregon’s elected leaders appear to grasp the breadth and complexity of the homeless challenge. The Governor’s Housing Policy Agenda draws an explicit link between homeless and housing-supply policies, and emerging legislative concepts are similarly comprehensive. And importantly, state policymakers have elevated equity and racial justice in their homeless and affordable housing plans, which is an imperative given the disproportionate representation of underrepresented minorities in populations experiencing homelessness. Communities of color must be integral to policy development and implementation for these initiatives to succeed.
The following recommendations should be considered reinforcements of—and complements to—strong work that has been underway.

Conclusions and Recommendations
ECONorthwest 47
1. Accelerate housing supply at all price points. A dysfunctional, undersupplied housing market is the root of Oregon’s homeless crisis. If the state continues the practice of building 63 housing units for every new 100 households formed, rents would continue to rise, vacancy rates would fall, and the effectiveness of all the following recommendations in this report would be diminished.
Future homelessness reduction strategies would be appropriately scoped if they articulated broad housing production goals and associated rent and vacancy rate targets. Appropriately scoped plans would pull more actors to the table: planning agencies that design and oversee housing regulations, permitting agencies that help determine the pace and nature of housing development, state legislators with land-use regulatory oversight responsibilities, and the region’s Congressional delegation who help determine the scope of federal rental assistance.
Expanded plans by themselves would do nothing to ease the homelessness crisis. Once the undersupply problem is broadly accepted, the work would turn to politically difficult implementation. Local politics work against accelerated housing supply responses. Current residents usually like their neighborhoods the way they are. To overcome the opposition, localities would need to hold themselves accountable to clear, broadly disseminated production goals; prune land-use regulations that don’t serve a clear health, safety, or environmental protection purpose; accelerate permit process timetables; explore little-used but promising policies such as land-value or split-rate taxes; and cede regulatory power to the state for some zoning decisions.
On the latter point, the 2019 Legislature appears poised to act with state-level concepts that could ban single-family zoning in larger communities and require higher housing density along transit corridors. State lawmakers could extend their housing policy packages to provide fiscal rewards and penalties tied to housing goals.
2. Increase the supply of affordable housing units. Rent-restricted units, regardless of what income bracket they target, provide stable housing for people who need it. They are also an important component of any comprehensive approach to addressing homelessness. Rent vouchers stretch further when they are used to buy down rent from 60 percent of MFI to 30 percent MFI, than when they are buying down market rate rent. Moreover, moving people into units that more closely match their financial capacity,
The state could expand emergency shelter capacity, innovate around mobile hygiene facilities, harness data to end chronic homelessness, and identify cost-effective temporary vouchers. But, if the region continues its recent practice of building 63 housing units for every new 100 households formed, rents would continue to rise, vacancy rates would fall, and the crisis system would be overwhelmed.

Conclusions and Recommendations
ECONorthwest 48
frees up lower-cost market-rate and other affordable units to those who may need them more—a benefit that reverberates through the entire housing continuum. In the past, rent-restricted units were primarily federally funded, but those resources have diminished and are insufficient to meet the regional need. Local revenue-raising efforts are important steps. To ensure that those resources go as far as they can, local governments should evaluate opportunities for additional incentives, such as state-enabled tax abatement programs, fee waivers or reductions, and land write-downs for affordable units. They should also identify and remove regulatory barriers that drive development costs up or unintentionally reduce the number of units possible on a site. These include costly parking requirements, building height and bulk restrictions, design guidelines, and requirements for ground-floor non-residential uses.
3. Strengthen connections between the affordable housing and homeless services sectors. Two sectors that operate a range of related, interdependent programming could improve coordination. For example, local governments could revisit their affordable housing screening guidelines, which sometimes penalize families and individuals with low credit scores or evictions—rendering too many ineligible. Localities should look into innovative programs like Come Home NYC—a rent guarantee program that reduces a landlord’s risk of accepting an application from a homeless family. And agencies could also consider targeting their limited, local rent subsidy dollars to help further reduce the rent of tenants in units built with the Low Income Housing Tax Credit (LIHTC) program.
4. Expand and add analytic rigor to the effort to end chronic homelessness. One-half of the country’s chronically homeless people live in four states: Oregon, California, Washington, and Hawaii. Given the unusually high concentration, public agencies and nonprofits across these states should partner to gain a much deeper understanding of the barriers faced by the West’s long-term homeless.
PSH is the best policy response for a share of the chronic population. But the programming is expensive and, as broadly implemented, has not yet proven to be cost-beneficial. Service agencies will need to invest in better analytic capabilities—like the Silicon Valley Triage Tool—to target the highest cost, highest needs individuals. Lane County has had early success through the Corporation for Supportive Housing’s (CSH) Frequent User Systems Engagement (FUSE) initiative, but agencies have much more to learn in this rapidly evolving service area. Success here would deliver sustained support to the region’s most vulnerable populations, reduce health and public safety expenditures, and free up emergency shelter capacity for more appropriate short stays.
5. Identify populations—in addition to chronically homeless single adults—that supportive housing models could serve cost effectively. Public and nonprofit agencies in a number
Conclusions and Recommendations
ECONorthwest 49
of regions across the country are testing the costs and benefits of extending supportive housing interventions to families with children. Some of the collaborations are organized under “pay for success” frameworks, in which investors commit funding upfront in return for calculable, downstream savings. These demonstrations may yield insights into specific populations (e.g., families involved in the child welfare system) that could be cost-effectively targeted for PSH interventions.
6. Recognize that shallow, temporary subsidies require additional evidence, and enter into partnerships to identify next-generation, low-cost alternatives to the HCV. The federal government’s HCV program is a proven homelessness prevention tool, but it covers only a quarter of eligible households. To spread limited resources to unserved HCV-eligible populations, communities across Oregon have experimented with shallow and temporary rent subsidies. HUD’s Family Options Study delivered disappointing news in this area and showed that long-term vouchers were more effective in reducing future spells of homelessness, improving housing stability, and helping beneficiaries live independently. Shallow, temporary subsidies remain promising but unproven. Here, Oregon would be well-served by recognizing the policy unknowns, partnering with think thanks and communities from across the country, and continuing the investigation for effective, lower-cost alternatives to the HCV. One approach worth a test: target a larger share of federally-funded, long-term vouchers to formerly homeless individuals and shift some locally-funded, short-term vouchers to HCV applicants with less severe needs.
7. Increase the emergency shelter bed inventory to ensure the safety of vulnerable populations. U.S. emergency shelter policy broadly falls into East Coast and West Coast schools. The East Coast approach, driven by climate and past litigation, generally expands its emergency bed capacity to meet the need. The West Coast approach does not tie capacity to need which has led to sizable, unsheltered populations.
Safety of vulnerable populations, children, women, and adults with disabilities, is the top priority of a crisis system, and Oregon’s bed inventory is too small to ensure that safety. When it comes to expansion, no recommended formulas exist. Neither New York (4.7 percent unsheltered) nor California (68.9 percent unsheltered) are models to replicate. An overbuilt shelter system becomes an expensive, semi-permanent solution for too many individuals and families while an underbuilt system exposes vulnerable populations to unsafe conditions. Adding emergency beds across the state to bring the unsheltered rate to 40 percent would be an appropriate, short-term goal.75
75 This would bring Oregon’s statewide unsheltered homeless rate into line with Multnomah County’s rate and close to the U.S, average.
Conclusions and Recommendations
ECONorthwest 50
While no one should have to experience unsheltered homelessness, tradeoffs abound in shelter expansion. Every dollar spent on emergency beds is a dollar that could be spent on programming with stronger evidence of improving long-term housing outcomes (e.g., long-term vouchers and permanent supportive housing).
The state will not make progress on homelessness if the hard work is done only by those who directly serve the homeless on a daily basis. The problem is too big for that. Progress will require collective action by a range of actors: public and nonprofit agencies that work on not only homeless issues but also broader housing and land-use regulatory policies; federal partners willing to re-examine—and invest in—rental assistance; state policymakers who can chart new state roles in housing policy; business leaders who will provide leadership and support strategies; philanthropies willing to convene and invest in research and development; and universities that can lead in research and policy innovation.

Appendix A: Measuring Homelessness
ECONorthwest 51
Appendix A: Measuring Homelessness Point-in-Time Counts The most commonly cited source of data on homelessness is the Point-in-Time Counts (PIT) organized by the U.S. Department of Housing and Urban Development (HUD). Conducted by local Continuums of Care (CoCs), HUD requires a count of the total number and characteristics of all people experiencing homelessness in each CoC’s region on a specific night in January. CoCs count people living in emergency homeless shelters, transitional housing, and safe havens every year, and count unsheltered homeless persons every other year (the latest of which was 2017).
Shortcomings in HUD’s PIT approach were highlighted in a recent Portland State University report and include: 76
§ Counting methods vary across regions. The biennial counts are large coordinated efforts and can require hundreds of trained volunteers. Each CoC chooses from among a number of HUD-approved counting methods that will work for their region and resources. For example, Portland officials attempt to survey each homeless person while Seattle uses a combination of one-night headcounts followed by surveys of a sample of the homeless. Varied methods create challenges for interregional comparisons.
§ Counts are inherently low and miss hard-to-locate populations. Researchers and volunteers’ best efforts inevitably miss individuals who are sleeping in obscure places or who double-up with friends and families. Language barriers can contribute to undercounts. This can be particularly difficult in larger CoCs and rural areas.
§ Counts rely on unverified, self-reported conditions. Measurement of key subpopulations (e.g., chronic, disabled) are based on self-reported conditions and are not subject to verification.
§ Changes in a categorization and purpose of a housing facility can change the homeless
count. In Portland, a building that was once operated as transitional housing became permanent supportive housing (PSH) providing longer term housing and services to its residents. While the building’s residents did not change, its operations and purpose did. The residents were considered homeless when the building was deemed
76 Jessica Chanay, Nishant Desai, Yuxuan Luo, and Davaadorj Purvee, An Analysis of Homelessness and Affordable Housing in Multnomah County, 2018 (Portland: Portland State University School of Business, July 2018).
Appendix A: Measuring Homelessness
ECONorthwest 52
transitional housing and were not when its status changed. Thus, the count of sheltered homeless dropped from one year to the next but the change was somewhat artificial.
Despite the well-known limitations, the PIT counts do convey useful information and are helpful in signaling big shifts in homelessness across time and geography. Additional research and analysis is often necessary to properly interpret and draw conclusions using PIT data.
Translating PIT Snapshots to Estimated Annual Counts The PIT counts, by definition, represent conditions on specific days in January, and a majority of homeless spells are short. Consequently, the PIT approach fails to measure the total share of a region’s population that experiences homelessness over the course of year. The Home for Everyone work group used Homeless Management Information System (HMIS) data to produce an annual count in 2013 and estimated 9,650 people experienced homelessness in 2013 in Multnomah County, 2.17 times more than were counted in the January snapshot.77
Along similar lines, California’s Economic Roundtable used a series of point-in-time snapshots from their HMIS shelter data to estimate the number of individuals who are “ever-homeless” over the course of year.78 They started by calculating the probability of homeless exits (i.e., returning to housing) for cohorts who had been homeless for different durations of time. For example, they estimated two-thirds of individuals who had been homeless for one month would return to housing in the next month. Half of those who had been homeless for two months would return to housing in the next month, and so on. The statistical exercise yielded multipliers for each spell duration to arrive at a simulated estimate of the total population that experienced homelessness at any time during the year (see Figure 23). The analysis concluded that almost half (48 percent) of Los Angeles’s annual homeless population is homeless for one month or less.
While the data and findings are specific to conditions in Los Angeles, the analytic exercise illustrates the differences in the snapshot (PIT) and annual count methods. A comparable, periodically updated analysis for Portland would make a valuable complement to the biennial PIT counts.
77 A Home for Everyone, 4.
78 Daniel Flaming, Patrick Burns, and Jane Carlen, Escape Routes: Meta-Analysis of Homelessness in Los Angeles (Los Angeles, CA: Economic Roundtable, April 2018).

Appendix A: Measuring Homelessness
ECONorthwest 53
Figure 23. Hypothetical Size and Composition of an Annual Population Experiencing Homelessness
Based on Applying Available Data to a PIT Population of 1,000 Individuals
Total Duration of Homelessness
Observed Percent Duration in
Truncated1 HMIS Data
Estimated Percent of Monthly Cohort Exiting Homelessness (by end
of month)
Projected Percent of Annual Homeless
Population
Number of People in Annual
Homeless Population
Multiplier
1 month 16% 67% 48% 1,323 8.4
2 months 8% 50% 13% 353 4.4
3 months 7% 50% 7% 200 2.8
4 months 4% 33% 3% 80 2.0
5 months 3% 33% 2% 61 2.0
6 months 6% 25% 2% 58 1.0
7 months 2% 25% 1% 35 1.8
8 months 3% 25% 1% 32 1.1
9 months 1.4% 25% 1% 27 1.9
10 months 1.2% 25% 1% 23 1.9
11 months 0.7% 25% 1% 19 2.7
12+ months 48% - 19% 529 1.1
Total 100% - 100% 2,739 - Source: Daniel Flaming, Patrick Burns, and Jane Carlen, Escape Routes: Meta-Analysis of Homelessness in Los Angeles (Los Angeles, CA: Economic Roundtable, 2018). Note: HMIS data only records duration of homelessness up until the data are collected. They are “truncated” because they do not necessarily capture the entire duration of homelessness for respondents.