high!performing!primary!schools:!! what!do ... - dyslexia … · ayear!for!the!last!five!years!and...
TRANSCRIPT

High performing primary schools: What do they have in common? William Louden 24 June 2015 [V4.0]

2
High performing primary schools: What do they have in common? Table of Contents Executive Summary ..................................................................................................................................... 3 1. Introduction ............................................................................................................................................... 4 2. School selection ........................................................................................................................................ 4 3. Data collection and analytic framework ........................................................................................ 6 4. Case study schools ................................................................................................................................... 7 4.1 School A ................................................................................................................................................ 7
4.2 School B ................................................................................................................................................ 8
4.3 School C ................................................................................................................................................ 9
4.4 School D ............................................................................................................................................. 10
4.5 School E .............................................................................................................................................. 11
4.6 School F .............................................................................................................................................. 12
4.7 School G .............................................................................................................................................. 13
4.8 School H ............................................................................................................................................. 14
4.9 School I ............................................................................................................................................... 15
5. Cross-‐case analysis ................................................................................................................................ 16 5.1 School organisation and leadership ...................................................................................... 16
5.2 Curriculum and assessment ...................................................................................................... 17
5.3 Pedagogy ........................................................................................................................................... 20
5.4 Professional learning ................................................................................................................... 22
6. Conclusions ............................................................................................................................................. 24 Appendix: Case study school longitudinal mean NAPLAN data ............................................. 26

3
Executive Summary
1. This purpose of this study was to explore similarities and differences among high performing Western Australian Government primary schools.
2. Nine schools were selected, on the basis of trends in their NAPLAN scores from
2010 to 2014, as well as their students’ absolute and relative achievements in 2013 and 2014.
3. The Index of Community Socio-‐Educational Advantage (ICSEA) scores for case
study schools ranged from 1084 (Decile 2) to 911 (Decile 9). They included two schools with significant numbers of students for whom English was a second language and two schools with significant numbers of students of Aboriginal or Torres Strait Islander descent. One of the schools was in a rural location.
4. There were at least three common characteristics among all nine schools:
• Stable long-‐term school leadership, with principals averaging 12 years in their school;
• Well-‐developed school improvement plans; and
• Reading programs based on explicit teaching of synthetic phonics in the early years.
5. Seven of the schools had moved towards lower variation teaching, with some or
all of the following characteristics:
• School-‐based scope and sequence plans;
• Mandated textbook series and resources;
• Formally timetabled literacy and numeracy blocks;
• Fine-‐grained achievement targets for individual students and for each term and school year;
• Explicit teaching; and
• Direct instruction intervention programs.
6. Lower variation schools made significant investments in teachers’ professional
development, including some or all of the following strategies:
• In-‐class coaching;
• Peer observation programs;
• Study tours to explicit teaching schools; and
• Participation in John Fleming’s explicit instruction professional development program.
7. Two of the high performing schools, including the second highest performing
school, did not adopt lower variation teaching strategies. Within the scope of the Australian Curriculum, they left decisions about what and how to teach to individual classroom teachers.

4
High performing primary schools: What do they have in common?
1. Introduction The purpose of this study is to explore the similarities and differences among primary schools whose students achieve better than expected NAPLAN scores compared with all schools and statistically similar schools.
2. School selection Three selection criteria were used:
• A positive five-‐year trend in NAPLAN scores from 2010 to 2014; • At least average absolute NAPLAN scores for both 2013 and 2014; and • At least three out of four positive relative achievement results (taking into
account ICSEA) for Year 3 and 5 in 2013 and 2014. These criteria yielded eight schools with ICSEA scores ranging from 1084 to 944. As none of these eight schools was in a rural area, an additional school was included with one selection criterion slightly relaxed (positive five-‐year trend and three out of four positive relative achievements, but below slightly below average absolute achievement results). Together, the schools chosen for the study represent a variety of high improving/high achieving schools. There is a wide range of socio-‐economic circumstances, from an ICSEA of Decile of 2 to an ICSEA Decile of 9. There are seven suburban schools, one rural and one outer metropolitan. Eight are Class 5 primary schools, with total enrolments ranging from 400 to 650. The one Class 4B school has a total enrolment under 200. In one school, 60 per cent of students have a home language other than English; in another there are 44 per cent EALD students. In one school students of Aboriginal and Torres Strait Islander descent comprise 20 per cent of total enrolments; in another they comprise a little over 10 per cent. All nine schools had stable, long-‐term leadership teams. None changed principal between 2010 and 2014, and the average tenure of principals was 12 years. Six of the schools are Independent Public Schools. One was the subject of an adverse Expert Review Group report several years ago. The nine case study schools are presented in Table 1, below. The five-‐year trend for each school is a measure of growth in students’ achievement, based on a standardized residual analysis using 2010 and 2014 NAPLAN scores. The trend growth is expressed as a standard deviation. Absolute achievement for each school is based on a standardised residual analysis using 2013 and 2014 NAPLAN mean scores for all Western Australian primary schools, expressed as a standard deviation. Year 3 relative achievement is based on a standardised residual analysis using the students’ NAPLAN mean and the school’s ICSEA; Year 5 relative achievement is based on a standardised residual analysis using the students’ NAPLAN mean, the students’ prior NAPLAN achievement and the school’s ICSEA expressed as a standard deviation. The School Performance Branch of the Education Department of Western Australia provided all calculations.

5
Table 1: Case study school NAPLAN scores, ranked by ICSEA Decile
School Name ICSEA Decile
5 Year Trend
Absolute NAPLAN
Relative NAPLAN
2010-‐14
2013
2014
Year 3 2013
Year 5 2013
Year 3 2014
Year 5 2014
School C 2 1.7 1.1 1.6 0.4 1.2 2.0 0.8
School E 3 1.5 0.4 0.8 0.7 0.5 1.6 -‐0.4
School H 3 3.0 0.9 1.4 0.9 1.0 1.5 0.9
School G 4 0.9 0.6 0.6 0.8 0.6 1.3 0.0
School A 5 2.4 1.1 1.5 1.7 2.2 2.1 2.9
School F 5 2.0 0.7 0.7 0.8 2.1 1.4 0.8
School D 7 0.5 0 0.1 1.5 0.2 2.0 0.0
School B 8 0.1 0 0.3 0.8 0.4 2.1 0.5
School I 9 0.6 -‐0.6 -‐0.3 0.0 -‐0.2 0.8 0.7 In order to estimate the relative impact of school planning and teaching on academic achievement among these nine schools, schools were ranked according to their relative 2014 NAPLAN scores in Year 3 reading, writing and numeracy. This ranking narrowed measures of achievement in four ways: focusing on the most recent scores; relative rather than absolute achievement; the three most robust NAPLAN scales (reading, writing and numeracy); and Year 3 relative scores rather than those for Year 5. Year 3 relative scores were preferred to Year 5 scores because Year 5 relative scores tend to underestimate relative achievement of schools which have already been very effective in lifting Year 3 scores two years earlier. Rank order is represented in Table 2, below. Table 2: Case study schools, ranked by Year 3, 2014 relative NAPLAN scores Relative Standard Deviation
School Name
Year 3 Reading
Year 3 Writing
Year 3 Numeracy
School A 2.5 2.7 1.9
School B 1.6 2.4 2.3
School C 1.4 2.6 2.2
School D 0.9 2.7 2.3
School E 1.8 1.2 1.9
School F 1.0 1.7 1.6
School G 1.6 1.4 1.2
School H 0.9 1.0 2.3
School I 1.3 0.6 0.8

6
Schools in Table 2 have also been sorted into broad groups on their relative standard deviations in Year 3 reading, writing and numeracy. The highest achieving group (School A, School B, School C and School D) all have relative standard deviations greater than 2.0 in two test domains. The next highest achieving group (School E, School F and School G), have relative standard deviations greater than 1.0 but less than 2.0 in three test domains. The third group (School H and School I) have relative standard deviations greater than 0 but less than 2.0 in two test domains.
3. Data collection and analytic framework The nine schools selected for the study were asked to provide a full set of school plans and review documents prior to a school visit. School visits typically entailed 20-‐30 minute visits to three classrooms by the researcher and several hours of discussion with the principal and one or more members of the curriculum leadership team in the school. The discussions focused on identifying the key steps in the school’s improvement trajectory, the curriculum resources used in the school, pedagogy and the approach taken to developing teachers’ skills. The documents, classroom observations and interview data were synthesised for each school separately, and a cross-‐case analysis was then completed. Section 3 provides a brief case study of each school, Section 4 provides a cross-‐case analysis and Section 5 draws some conclusions.

7
4. Case study schools
4.1 School A School A is a Class 5 primary school with about 640 students from Kindergarten to Year 6. The school, which was opened in the late 1980s, has an Index on Community Socio-‐Cultural Advantage score in Decile 5 and is an Independent Public School. NAPLAN relative standard deviations of 2.5, 2.7 and 1.9 were achieved in Year 3 reading, writing and numeracy in 2014. A My School “similar schools” display for writing appears in Figure 1. Figure 1: School A My School similar schools display, Year 3 Writing, 2014
In the eight years that the principal has been at the school, teaching has become much more explicit. Among other influences, the move to more explicit teaching has been supported by their collaboration with John Fleming. He has visited the school four times a year for the last five years and there have been three study tours to his school, Haileybury, in Victoria. Now, as they say at this school, teaching is not a matter of “choose your own journey”. An annual operational plan details the strategies and resources available to build staff capacity, achievement targets in literacy and numeracy, intervention strategies, data analysis protocols and evaluation and communication strategies. The professional learning operational plan identifies research-‐based principles of professional learning and provides guidelines for class visits, a formal coaching program and a professional improvement program. Clear and public expectations are set for students’ behaviour, bookwork and school uniforms. School A has a scope and sequence chart for every learning area in every year. In literacy, for example, this details the phonological awareness, phonics, reading, spelling, grammar and writing content, resources and expectations for each year of schooling.

8
4.2 School B School B is a Class 5 primary school with about 450 students and an ICSEA score in Decile 8. The principal has been at the school for almost 20 years. Forty-‐four per cent of the children at the school speak a language other than English at home, and they speak a total 35 different languages. The school is in very good physical condition and includes several new classroom blocks built with BER funds. With the departure of Year 7 classes to high school, spare classrooms have become special-‐purpose spaces for music, history and the P&C. The school has chosen not to pursue Independent Public School status. NAPLAN relative standard deviations of 1.6, 2.4 and 2.3 were achieved in Year 3 reading, writing and numeracy in 2014. A My School similar schools display for writing appears in Figure 2. Figure 2 School B My School similar schools display, Year 3 Writing, 2014
The school leadership team identified the introduction of a consistent phonics program as the biggest change in the school in recent years. They began with Diana Rigg’s PLD synthetic phonics in Kindergarten and Pre-‐primary in 2010 and have extended this program to Years 1, 2 and 3 in subsequent years. The strong literacy program continues to draw on First Steps procedures and the deputy principal with curriculum responsibility is an experienced First Steps trainer. Unlike School A, School B does not have a common scope and sequence chart for each curriculum area, or a commitment to explicit teaching beyond phonics in the early years. There is, as one senior staff member said, “none of that John Fleming stuff” which “doesn’t respect the teacher”. What the school does have, however, is a very clear and public commitment to monitoring and improving student achievement. The staffroom walls, for example, are covered with the details of On Entry and NAPLAN results for classes and children, and the recent years of high achievement are celebrated in a display of My School data in the school foyer.

9
4.3 School C School C is a Class 5 primary school with an ICSEA score in Decile 2. An Independent Public School since 2012, it has a long-‐standing commitment to school improvement through explicit teaching. NAPLAN relative standard deviations of 1.4, 2.6 and 2.2 were achieved in Year 3 reading, writing and numeracy in 2014. A My School similar schools display for writing appears in Figure 3. Figure 3. School C My School similar schools display, Year 3 Writing, 2014
2015 is the sixth year in the current cycle of school improvement. In the first year of his appointment, the principal focused on building relationships in the school. The next year, the leadership team focused attention on early childhood education, and in particular on the introduction of synthetic phonics. Significant improvements in students’ achievement were noted, and they wondered whether it was possible to get the same sort of effects in other areas of the school. Working with staff on understanding the school’s achievement data, they drew the conclusion that compared with statistically similar schools achievement was satisfactory, but no more than that. The next phase was to work with staff to create a vision of what levels of achievement might be possible, then to hold themselves accountable for achieving those levels of student performance. School C follows a detailed scope and sequence chart in each learning area, fine-‐grained analysis of achievement data, extensive use of commercial curriculum materials, a strong teacher development strategy and a commitment to John Fleming’s model of explicit teaching.
10
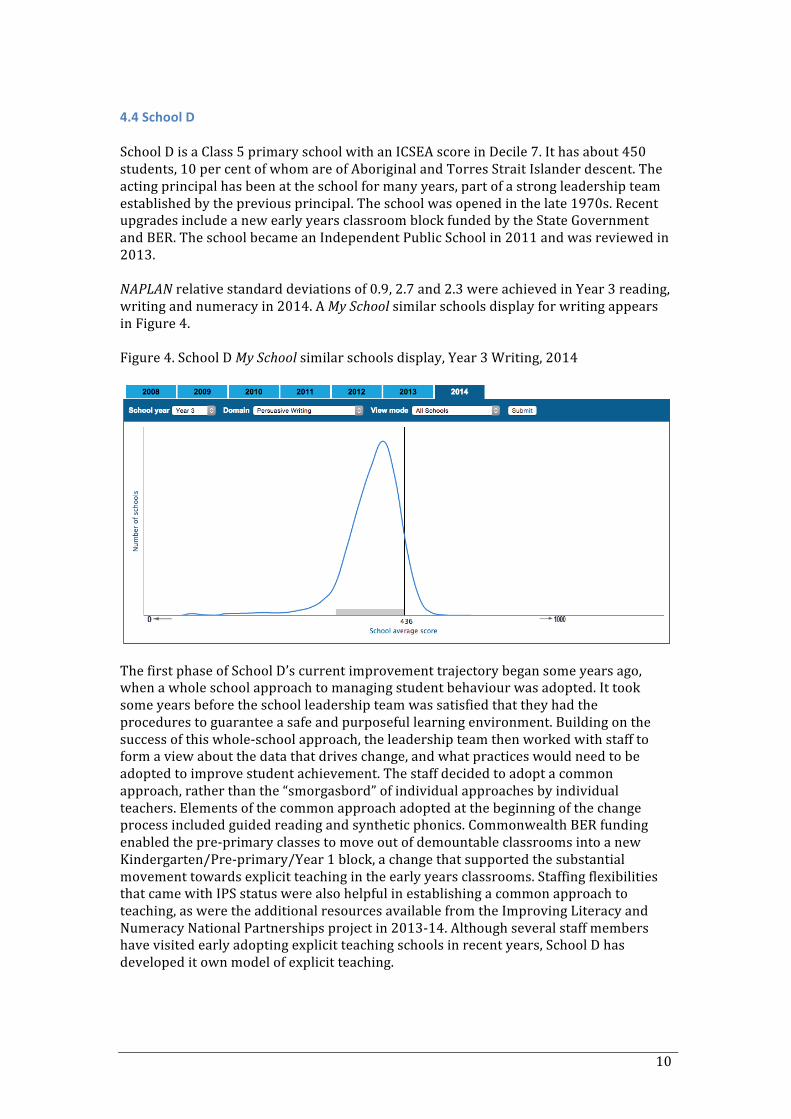
4.4 School D School D is a Class 5 primary school with an ICSEA score in Decile 7. It has about 450 students, 10 per cent of whom are of Aboriginal and Torres Strait Islander descent. The acting principal has been at the school for many years, part of a strong leadership team established by the previous principal. The school was opened in the late 1970s. Recent upgrades include a new early years classroom block funded by the State Government and BER. The school became an Independent Public School in 2011 and was reviewed in 2013. NAPLAN relative standard deviations of 0.9, 2.7 and 2.3 were achieved in Year 3 reading, writing and numeracy in 2014. A My School similar schools display for writing appears in Figure 4. Figure 4. School D My School similar schools display, Year 3 Writing, 2014
The first phase of School D’s current improvement trajectory began some years ago, when a whole school approach to managing student behaviour was adopted. It took some years before the school leadership team was satisfied that they had the procedures to guarantee a safe and purposeful learning environment. Building on the success of this whole-‐school approach, the leadership team then worked with staff to form a view about the data that drives change, and what practices would need to be adopted to improve student achievement. The staff decided to adopt a common approach, rather than the “smorgasbord” of individual approaches by individual teachers. Elements of the common approach adopted at the beginning of the change process included guided reading and synthetic phonics. Commonwealth BER funding enabled the pre-‐primary classes to move out of demountable classrooms into a new Kindergarten/Pre-‐primary/Year 1 block, a change that supported the substantial movement towards explicit teaching in the early years classrooms. Staffing flexibilities that came with IPS status were also helpful in establishing a common approach to teaching, as were the additional resources available from the Improving Literacy and Numeracy National Partnerships project in 2013-‐14. Although several staff members have visited early adopting explicit teaching schools in recent years, School D has developed it own model of explicit teaching.

11
4.5 School E School E is a Class 5 primary school with an ICSEA score in Decile 3. The principal has led the school for seven years. The school has sought Independent Public School status but was not successful. Two important changes have underpinned the improvement is student achievement in recent years: the pressure of an unfavourable Expert Review Group report in 2012 and the availability of support and resources for the Improving Literacy and Numeracy National Partnerships program from 2012 to 2014. NAPLAN relative standard deviations of 1.8, 1.2 and 1.9 were achieved in Year 3 reading, writing and numeracy in 2014. A My School similar schools display for numeracy appears in Figure 5. Figure 5. School E My School similar schools display, Year 3 Numeracy, 2014
Before the ERG report, people in the school community were happy with students’ relatively high average achievement, but when the school’s performance was compared with statistically similar schools the results were disappointing. According to the school leadership team, the ERG changed staff dynamics and “staff who had been happy to focus on their own classes realised that they had something to contribute”. There are now a number of common teaching practices across the school. Consistent phonics and spelling programs are used, including Jolly Phonics, Jolly Grammar, Diana Rigg’s PLD resources, and Pearson’s Words Their Way for vocabulary and spelling in the later years. Intervention programs include the direct instruction MULTILIT. Mathematics programs are based on the Queensland Studies Authority version of the Australian Curriculum, which provides a more detailed scope and sequence chart than the national version. First Steps strategies are widely used, as is guided reading. In addition, the school has invested in professional development on cooperative learning strategies. Crucially, ILNNP funding supported appointment of specialist literacy and numeracy teachers who helped others with planning and teaching, working side-‐by-‐side in classrooms, modelling and coaching new teaching strategies.

12
4.6 School F School F is a Class 5 primary school with about 550 students from Kindergarten to Year 6. The school is a local intake school and has an ICSEA score in Decile 5. The principal has led the school for many years. School F became an Independent Public School in 2011 and received a very positive independent review in 2013. The review noted that the school’s two key themes, “hard on standards of learning” and “hard on standards of behaviour” were well understood by staff and parents and effectively embedded across the school. NAPLAN relative standard deviations of 1.0, 1.7 and 1.6 were achieved in Year 3 reading, writing and numeracy in 2014. A My School similar schools display for writing appears in Figure 6. Figure 6. School F My School similar schools display, Year 3 Writing, 2014
School F, which had been deeply committed to outcome based education, began a process of change in 2006 when a synthetic phonics program was introduced to the Pre-‐primary program. In the first year of implementation, teachers’ use of Jolly Phonics was optional, but improvements in student achievement persuaded the leadership team that the program should be used across the whole early years program. All staff participated in Jolly Phonics professional development sessions and a staff visit to School C was arranged. Subsequently, the school introduced the Firefly Education Sound Waves phonemic spelling program and the Hawker Brownlow CARS and STARS structured approach to reading comprehension. A variety of mathematics resources have been used since the school increased its focus on explicit teaching. A little after the time Jolly Phonics was introduced, the school adopted the Nelson Maths Building Mental Strategies followed by the Pearson Signpost Maths program. The ACER Junior Elementary Math Mastery and Elementary Math Mastery direct instruction materials have also been used. In 2014 the Scholastic PR1ME mathematics program was introduced. Based on the Singapore mathematics curriculum, the PR1ME series provides an explicit teaching model, through a concrete-‐pictorial-‐abstract approach to learning. Mathematics classes in the senior years are cross-‐set, allowing for some ability grouping.

13
4.7 School G School G is a Class 5 primary school with an ICSEA score in Decile 4. Although only 70 per cent of students were born in Australia, a relatively small number are students for whom English is a second language (about four per cent). A similar proportion of students are of Aboriginal or Torres Strait Islander descent. The principal has led the school since of opened; it became an Independent Public School in 2010 and received its first independent review in 2012. NAPLAN relative standard deviations of 1.6, 1.4 and 1.2 were achieved in Year 3 reading, writing and numeracy in 2014. A My School similar schools display for reading appears in Figure 7. Figure 7. School G My School similar schools display, Year 3 Reading, 2014
School G is committed to explicit instruction, beginning with synthetic phonics in Kindergarten and Pre-‐primary and lesson structures based on John Fleming’s explicit teaching model in the primary grades. The school sets clear benchmarks and targets in reading, writing, spelling and mathematics from Kindergarten onwards. Scope and sequence documents in mathematics, grammar, spelling, vocabulary and reading detail what is to be taught each week. There is a two-‐hour literacy and one-‐hour numeracy block every day, with some ability-‐group cross-‐setting. The school runs two challenge classes, where students are expected to work approximately two years above grade level. Intervention programs for students at risk are additional to their regular class activities, rather than instead of them, and make extensive use of direct instruction materials: Reading Mastery, Spelling Mastery and Let’s Decode. The school has made a particular effort to eliminate time-‐wasting activities, such as cutting and pasting and dress-‐up days, in order to maximise active learning time.

14
4.8 School H School H is a Class 4 primary school with an ICSEA score in Decile 3. Sixty per cent of the students have English as a second language. The principal has been in the school for many years and the school has a very stable long-‐term staff of the teachers have had ESL training, and are supported by a very experienced ESL specialist. Although School H has older-‐style linear classrooms they are very well equipped and the school has extensive curriculum resources and computer facilities. School H is not an Independent Public School. NAPLAN relative standard deviations of 0.9, 1.0 and 2.3 were achieved in Year 3 reading, writing and numeracy in 2014. A My School similar schools display for numeracy appears in Figure 8. Figure 8. School H My School similar schools display, Year 3 Numeracy, 2014
Jolly Phonics was introduced from Kindergarten to Year 1 at School H about eight years ago. Although this resource is not the ESL community’s preferred synthetic phonics resource, the school has found it very effective and prefers that all teachers use a common structured approach to phonics. The Diana Rigg PLD Phonics, Grammar and Spelling programs are used with older children. Guided reading is used from Years 2-‐4 and the New Wave mental maths program is used from Years 2 -‐6. The school does not use explicit teaching methods in the specific formulation of John Fleming’s lesson structures, but the leadership team believes that the best ESL teaching is highly explicit. NAPLAN literacy and numeracy targets are expressed in terms of the proportion of students from the school’s stable cohort above national minimum standards, and ESL student targets expressed in terms of band scales and the number of years in Australian schools. First Cut results show that the achievement of ESL students is at least as good as those of non-‐ESL students in Year 3 and 5 reading, writing and numeracy.

15
4.9 School I School I is a Class 5 primary school with an ICSEA score in Decile 9. The school was opened in the late 1950s. About 20 per cent of its students are of Aboriginal or Torres Strait Islander descent. The principal has been at the school for many years. Several attractive new cluster buildings have recently supplemented the older linear classrooms. School I is an Independent Public School and is scheduled for its first IPS Review in 2015. NAPLAN relative standard deviations of 1.3, 0.6 and 0.8 were achieved in Year 3 reading, writing and numeracy in 2014. A My School similar schools display for reading appears in Figure 9. Figure 9. School I My School similar schools display, Year 3 Reading, 2014
School I’s current improvement trajectory began in 2011. After some years of concern about NAPLAN results that “bounced around”, the principal was looking for ways to improve students’ achievement. He heard John Fleming speak at a WAPPA conference, and visited School C Primary School to look at their explicit teaching approach. In 2012, more than a dozen teachers attended a Fleming workshop, the school decided to introduce a series of more explicit teacher resources (Jolly Phonics, Sound Waves and Decodeable Books), and participated in some synthetic phonics professional development. In 2013 staff developed a year-‐by-‐year scope and sequence plan for literacy and numeracy. This was the first of the whole-‐school initiatives introduced. They implemented the CARS and STARS reading comprehension programs, and some staff began to work together with peer observation and feedback on their explicit teaching strategies. Funds available through the ILNNP program were used to support professional development, coaching, resource purchases and one-‐to-‐one support for children at risk. In 2014 a literacy and numeracy block was introduced to all Years, John Fleming made a two-‐day visit to the school, and four teachers visited his school, Haileybury. Literacy and numeracy policies were updated, achievement targets were established for every year level and Signpost mathematics program was introduced.

16
5. Cross-‐case analysis No two schools are the same; they have their own histories, circumstances and trajectories of change. The short case studies in the previous section, however, have identified a series of characteristics shared by most or all of the schools. These characteristics are explored in the section that follows under four headings: school organisation and leadership, curriculum and assessment, pedagogy and professional learning.
5.1 School organisation and leadership All nine of the case study schools had stable, long-‐term leadership, many — but not all — were Independent Public Schools; all had explicit and published agendas for school improvement; and several noted that recent improvements in student achievement had been supported by access to the Improving Literacy and Numeracy National Partnership. These characteristics are summarised in Table 3, below. Table 3. School organisation and leadership
School A
School B
School C
School D
School E
School F
School G
School H
School I
Organisation and leadership
Stable, long-‐term leadership
Independent Public School
Explicit improvement plans
ILNNP support
Stable, long-‐term leadership All of the schools have experienced and stable senior leadership teams. Four of the schools have had the same principal for approximately 20 years; four of the schools have had the same principal for between five and eight years; and one has a long term deputy as acting principal, following the transfer of a principal who hade been in the post six years. Independent Public Schools Most of the case study schools are Independent Public Schools. One school has explicitly rejected the idea of becoming an IPS school and another has sought IPS status but been unsuccessful. This school was the subject of an adverse Expert Review Group report several years ago, but has since seen a substantial turn-‐around in students’ achievement. The chief advantage of IPS status cited by schools was the opportunities it offered for selecting staff members who support the vision, ethos and culture of the school. Several schools reported significant turnover of staff as the school moved to IPS

17
status. More importantly, local selection of staff has enabled schools to develop more thorough selection processes. At School C, for example, potential new staff members are not only interviewed but are also expected to teach a lesson and be observed as part of the process. The school chooses the level, subject and topic of a demonstration lesson and invites prospective staff members to prepare and be observed teaching a lesson. Explicit improvement plans All of the schools have explicit improvement agendas, typically articulated through operational plans, business plans, learning area plans and professional learning plans. Although every school has explicit improvement plans, some are more explicit than others. School A and School C use Geoff Masters’ 2010 “Teaching and learning school improvement framework"1 to articulate their school improvement plans, focusing on an explicit improvement agenda, analysis and discussion of data, a culture that promotes learning, targeted use of resources, an expert teaching team, systematic curriculum delivery, and effective teaching practices. These strategic directions are supported by more detailed operational plans. At School A, for example, the 2014 curriculum improvement plan identified targets, strategies, resources and milestones under eleven headings: improving teacher capacity; literacy; numeracy; response to intervention; policy, accountability and evaluation; marketing and communication; student well-‐being; ICT; financial management; grounds and building; and resource planning. ILNNP support School D, School E, School F and School I all received ILNNP funding in recent years. The ILNNP program provided a range of additional opportunities including time to analyse achievement data and plan whole-‐school responses, funding for new textbook series and externally-‐provided professional development, and employment of in-‐school literacy and numeracy experts who helped teachers improve their planning, teaching and assessment.
5.2 Curriculum and assessment The bulk of the case study schools have moved towards what might be called “lower variation teaching”, seeking school-‐wide agreement on what and how to teach, rather than leaving these decisions to individual teachers. Lower variation strategies included school-‐based scope and sequence progressions; mandated textbook series and resources; formally timetabled literacy and numeracy blocks; and fine-‐grained achievement targets for individual students and for each term and school year (see Table 4, below).
1 Masters, Geoff N., "Teaching and learning school improvement framework" (2010). http://research.acer.edu.au/monitoring_learning/16

18
Table 4. Curriculum and assessment
School A
School B
School C
School D
School E
School F
School G
School H
School I
Curriculum & assessment
School-‐based curriculum
Mandated textbook series
Timetabled literacy and numeracy blocks
Achievement targets for every school year
School-‐based curriculum Three approaches were observed to ensuring a common school-‐based curriculum. The first is to develop school-‐based scope and sequence charts, consistent with but more fine-‐grained than the Australian Curriculum. These school-‐based curriculum guides typically identify the content to be covered in each term of each school year. At School G, for example, staff members have produced a scope and sequence document for maths, grammar, spelling, vocabulary and reading. This document details what will be taught each week, and includes time for revision and testing breaks. By way of example, for the number and algebra strand of Year 3 mathematics, week 2, term 1, this document identifies the number and place value objectives (decompose two digit numbers in different ways including standard place value), operations (two digit addition; two digit subtraction, no regrouping) and mental maths warm-‐up activities (backwards by 1s from 100, count by 3s to 99, and many other similar expectations). Elsewhere, in schools such as School F, the school-‐wide adoption of textbook series in literacy and numeracy ensures that there is a common approach to the scope and sequence of learning in the school. The third approach is to leave curriculum scope and sequence decisions to individual teachers, within the clear constraints of the Australian Curriculum. At School B, for example, teachers are encouraged to collaborate and share what they intend to cover each term. At School H, the operational plan relies on the Australian Curriculum for scope and sequence but specifies focus areas such as number facts, mental maths and operations for Kindergarten to Pre-‐primary, Years 1-‐2 and Years 3-‐7. Mandated textbook series Commercially produced textbooks and online resources were used in all schools to support the Australian Curriculum. In seven of these schools, adoption of textbooks was a whole school decision; in the other two schools there was more in-‐school variation in the use of these resources.

19
The reasons commonly given for whole-‐school adoption of textbooks was that it allows teachers to focus on how to teach rather than what to teach, and supports uniform approaches across the school. Among the most commonly mandated resources were the synthetic phonics resources used in every school, the CARS and STARS reading comprehension program used in seven of the schools and the range of whole school published mathematics programs used in more than half of the schools. Whole school mathematics texts included the Singapore-‐based PR1ME resources, Signpost Maths, Blake Maths, Cambridge Maths and the RIC Australian Curriculum mathematics series. Timetabled literacy and numeracy blocks All of the schools expect teachers to work in literacy and numeracy blocks, and in eight of them literacy and numeracy blocks are timetabled to protect optimal academic learning time. At School F there are common expectations of daily mathematics, reading, spelling and writing, and handwriting three times a week. Two formal teaching blocks are scheduled every day, followed by a late lunch. Additional formal learning time is scheduled for some children who would benefit from extra time. Teachers’ timetables have been analysed to reduce wasted time, and teachers have been expected to speed up transition time between lessons. At School E, timetables ensure that there are no DOTT-‐time interruptions for at least one block of time each morning, before recess for Years 1, 2 and 3, and between recess and lunch for Years 4, 5 and 6. At School B teachers are expected to have a literacy and numeracy teaching block, but there is no formal requirement about the number of hours or days on which this occurs, and DOTT requirements mean that some classes have physical education during the early morning sessions. Achievement targets for all years All of the case study schools publish achievement targets for students, but there is some variation in the scope of these targets. At School B and School H, targets are expressed in terms of NAPLAN scores in each of the test domains in Years 3, 5 and 7, compared with past scores and scores in statistically similar schools. At School F, school leaders report that consistent data analysis and presentation by the leadership team has had an impact on teachers’ willingness to embrace more explicit teaching approaches. Although the leadership team report that the staff member are much less interested in the data analysis than they are, the consistent evidence of improvement has been essential in the long-‐term change from outcome-‐based approaches to more explicit teaching. The school undertakes school-‐wide PAT testing in March and October each year, and uses these data to guide planning, resource allocation and reemployment of temporary staff. The school does not, however, set improvement targets for each year and test domain. Rather than setting safe, low improvement targets that are likely to be achieved, they prefer to take the view that every child should be encouraged to work to their maximum potential. Instead, their Delivery and Performance Agreement specifies targets in terms in increases or decreases in the proportion of the top or bottom 20 per cent of Australian children for each of the gender and diversity categories. The one school year for which there are explicit targets is Pre-‐primary, where there are clear school readiness targets: Jolly Phonics Tricky Hat 70 and Oxford 40 sight words, plus the ability to count to 100 by the end of the year. In other schools, NAPLAN targets are supplemented by a range of assessments such as PIPS testing at the beginning and end of Pre-‐primary; sight reading lists such as Magic

20
Words, the Fry High Frequency Word List and the Oxford Word List; PM Benchmark book levels for each year; Progressive Achievement Test stanines at each year level; and individual student NAPLAN targets. At School I, for example, a variety of standardised assessment instruments are used to identify individual problems, monitor progress and identify possible weaknesses in the school program. In literacy, for example, these include the Education Department’s On Entry Assessment, NAPLAN, PM Assess, Magic 100-‐900 sight words, A-‐Z Reading Fluency Assessments and assessments of phonological awareness and phonics. Individual student benchmarks are set for reading and spelling, at three levels of proficiency: extension, benchmark and support. In Year 1, for example, all three groups of students are expected to read 200 high frequency words with 100 per cent accuracy and achieve 70 word per minute reading fluency at Level F, with 90% reading accuracy. Benchmark students are expected to read Level 15 PM Benchmark book levels, spell Magic 200 high frequency words with 60% accuracy and achieve a 6.5 year spelling age on the South Australian Spelling Test. School-‐wide, 85 per cent of students are expected to be at or above the NAPLAN minimum standards and 30 per cent of students above the NAPLAN national average.
5.3 Pedagogy All of the case study schools use explicit teaching strategies for teaching phonological awareness and phonics; most have been influenced by John Fleming’s explicit teaching model; and more than half are using direct instruction intervention programs. These are summarised in Table 5, below. Table 5. Pedagogy
School A
School B
School C
School D
School E
School F
School G
School H
School I
Pedagogy Synthetic phonics
Explicit teaching
Fleming explicit teaching
Direct instruction intervention programs
Synthetic phonics Synthetic phonics is a systematic approach to teaching reading by beginning with sounds (phonemes) and blending (synthesising) these sounds to make words. All of the case study schools have implemented synthetic phonics programs in the early years. All schools use either (or both) of Jolly Phonics and Diana Rigg’s PLD Phonics. These programs teach phonemes (letter and digraph sounds), letter formation, blending of sounds together to form new words, segmenting sounds in read and write new words,

21
and teaching specific “tricky words” with irregular spelling. Supplementary programs in use include Lorraine Hammond’s Let’s Decode, the ABC’s Reading EGGS and THRASS. Explicit teaching Almost all of the schools have implemented explicit instruction of reading, spelling and mathematics, in addition to the explicit synthetic phonics teaching adopted by all of the schools. School A, School C, School G and School I have all adopted John Fleming’s model of explicit instruction. At School A, for example, the school leadership team expects teacher directed learning in all classes, explicit instruction and high levels of repetition to move students’ knowledge from short-‐term to long-‐term memory. Using the Fleming explicit teaching model, each lesson begins with a “warm up” designed to activate existing knowledge followed by explicit teaching (“I do”), guided practice (“we do”), independent practice (“you do”) and review (“ploughing back”).2 Other schools have developed more explicit teaching models in recent years. At School F the curriculum resource purchasing decisions have led to much greater emphasis on explicit teaching in the school. Although the Fleming “I do, we do, you do” approach was common in the school, the leadership team characterised the school as “Fleming-‐ish”, rather than strictly following Fleming’s approach. Two of the case study schools, School E and School D, have seen bottom-‐up increases in the amount of explicit teaching flowing from their success with explicit early years phonics teaching, and from their participation in ILNNP program. At School E warm-‐ups are used in all classrooms to reinforce facts and knowledge. There is explicit teaching in all year levels and all areas of English and mathematics, as well as a school-‐wide focus on explicit cooperative learning strategies. Staff members don’t see this in terms of the Fleming “I do, we do, you do” routine but the gradual release of responsibility model championed by First Steps: familiarising, analysing, modelling, sharing, guiding and applying.3 Similarly, although teachers from School D have visited early-‐adopting explicit teaching schools in recent years, the school has developed it own model of explicit teaching drawing on the gradual release of responsibility model. At School H, a school with a majority of students with a first language other than English, the source of their explicit teaching is ESL methodology rather than any of the mainstream explicit teaching models. School B, one of the highest achieving schools identified by the data protocols in this study, is the outlier with regard to explicit teaching. Beyond its use of synthetic phonics programs in the early years, the school has not adopted any common approach to explicit teaching.
2 For a research-‐based analysis of the effectiveness of such explicit instructional processes, see: Archer, A., & Hughes, C. (2011). Explicit Instruction: Effective and Efficient Teaching. NY: Guilford Publications. 3 The gradual release of responsibility model was first described by Pearson and Gallagher: Pearson, P.D. & Gallagher, M. (1983). The Instruction of Reading Comprehension, Contemporary Educational Psychology, 8, 317-‐344.

22
Direct instruction intervention programs Eight of the case study schools use at least one direct or explicit instruction program for tier-‐two (small group) or tier-‐three (individual) intervention with students at risk. These include the direct instruction Reading Mastery and Spelling Mastery, the explicit early reading programs MINILIT and Cracking the ABC Code, and the direct instruction Elementary Maths Mastery and Junior Elementary Maths Mastery mathematics resources.
5.4 Professional learning All of the nine case study schools have mature professional learning programs. The most elaborate of these includes instructional rounds, peer observation, inter-‐school visits and study tours, and in-‐class coaching and support. Five schools have participated in John Fleming’s explicit instruction program, five have developed peer observation programs and seven have some form of in-‐class coaching for teachers. These approaches are summarised in Table 6 (below). Table 6. Professional learning
School A
School B
School C
School D
School E
School F
School G
School H
School I
Professional learning
Explicit instruction professional development
Site visits to explicit instruction schools
Peer observation
In-‐class coaching
Explicit instruction professional development programs All of the case study schools have well-‐developed professional learning plans involving school-‐based and generated activities, and most of them have benefited from externally provided programs. Among these schools, School B and School H have made most use of internal resources and least use of externally provided professional development. School H has relied on the daily presence in classrooms of a very skilful ESL specialist rather than purchase external professional development programs in recent years, and at School B, there has been a greater focus on what they call ”home brewed’ professional learning. Although they had made significant investments in the Diana Rigg PLD Phonics professional development in the past, the school leadership team is very confident in the abilities of the teaching team and they now prefer that teachers take the lead with other staff in their areas of interest and expertise. The most common external professional development was John Fleming’s explicit teaching programs undertaken by School A, School C, School F, School G and School I. Other valuable external programs include ILNNP programs undertaken School D, School E and School I and the cooperative learning program implemented at School E.

23
Inter-‐school visits Many of the case study schools that have become interested in explicit teaching have visited early adopting explicit teaching schools. These include interstate visits to John Fleming’s school by teachers from School A, School C and School I; visits to School C by teachers from School F and School I; and visits by School G staff members to Challis Early Childhood Centre, a school with a focus on Hollingsworth and Ybarra’s Explicit Direct Instruction.4 Peer observation and in-‐class coaching Most of the case study schools have developed, or are planning to develop, a program of peer observation or in-‐class coaching. There is, however a broad spectrum of such activities. There is no formal peer observation program at School D, but the literacy coach employed through ILNNP funding engaged in a range of informal in-‐class coaching and modelling activities. A new program of peer observation is scheduled to begin at School B in 2015 with an initial focus on positive feedback, but there have been no formal in-‐class coaching arrangements or peer observation programs up to now. At School H, there is no formal program of peer observation or in-‐class coaching, but the daily in-‐class presence of an expert ESL specialist has provided many opportunities for sharing and modelling of good teaching practice. Further down the spectrum, School I is has recently begun a program of peer observation and in-‐class coaching, and John Fleming observed eight teachers as part of his school visit in 2014. At School E there is no formal program of peer observation but there is a well-‐developed tradition of in-‐class coaching, building on the work of literacy and numeracy specialists funded by the ILNNP program. At School F, there is a program of peer observation and coaching, with self-‐selected peers observing a lesson and providing written feedback that is also shared with the school leadership team. At School A, School C and School G relatively mature and increasingly intensive models of observation and coaching that have been negotiated over time. At School C, for example, the professional learning program is highly scaffolded, with any new strategy first being piloted by an expert teacher and then modelled to others. Coaching and feedback are a standard part of the school experience for teachers. Each teacher has a coach, who is not the person responsible for his or her performance management. The strong focus on coaching was evident in classroom observations undertaken for this project, where senior staff discussed and made mental notes about development opportunities for teachers observed, and teachers sought feedback, in passing, from the senior staff visiting their rooms. One teacher, for example, was unhappy with the level of student involvement in the lesson observed, and afterwards asked the deputy principal for advice about what he could have done differently in that particular lesson.
4 See: Hollingsworth, J., & Ybarra, S. (2009). Explicit Direct Instruction – The Power of the Well‐Crafted, Well‐Taught Lesson. Moorabin, Victoria: Hawker Brownlow.

24
6. Conclusions This short study, based on desktop document analysis and a single short visit to each school, has attempted to identify common characteristics among nine high-‐performing schools in Western Australia. A consolidated summary of these appears in Table 7, below. Table 7. Organisational and curriculum characteristics of case study schools
School A
School B
School C
School D
School E
School F
School G
School H
School I
Organisation and leadership
Stable, long-‐term leadership
Independent Public School
Explicit improvement plans
ILNNP support
Curriculum & assessment
School-‐based curriculum
Mandated textbook series
Timetabled literacy and numeracy blocks
Achievement targets for every school year
Pedagogy Synthetic phonics
Explicit teaching
Fleming explicit teaching
Direct instruction intervention programs
Professional learning
Explicit instruction professional development
Site visits to explicit instruction schools
Peer observation
In-‐class coaching

25
At the broadest level of generalisation, it could be said that all nine schools did a few of the same things, seven of the schools did most of the same things, and two high-‐performing schools did hardly any of the things that characterised the other seven schools. Four more specific conclusions may be drawn. First, every one of the nine schools had at least three things in common: stable, long-‐term leadership; explicit school improvement plans; and reading programs that included synthetic phonics in the early years of school. The second, more tentative, conclusion concerns a move towards lower variation teaching. Seven of the schools, including three of the four schools identified in Table 2 as the highest performing schools, had moved to various towards lower variation teaching, developing school-‐wide positions on curriculum, assessment and pedagogy. Four of these schools, including two of the four in the highest performing group, had adopted John Fleming’s explicit teaching model. Three other schools had increased the amount of explicit teaching in recent years, but had not formally adopted the Fleming lesson model. The third conclusion is that the schools moving towards lower variation teaching all made significant investments in teachers’ professional learning. All seven lower variation schools developed some form of in-‐class coaching for teachers, five implemented peer observation programs, five (but not the same five) schools sponsored staff members’ study tours to explicit teaching schools and five participated in John Fleming’s explicit instruction program development programs. Finally, it must be observed the nine high performing schools included two that contradicted this trend towards lower variation teaching. School B and School H achieved their excellent NAPLAN results without mandating textbooks, timetables, teaching methods, scope and sequence charts or annual student achievement targets. Like all of the other case study schools, and a very large number of non-‐case study schools, they had introduced synthetic phonics in recent years. Beyond that, the impetus to their success appeared to be excellent ESL teaching in one case; in the other it appeared to result from close attention to NAPLAN and continued use of a range of conventional teaching strategies.

26
Appendix: Case study school longitudinal mean NAPLAN data
SCHOOL A

27
SCHOOL B

28
SCHOOL C

29
SCHOOL D

30
SCHOOL E

31
SCHOOL F

32
SCHOOL G

33
SCHOOL H

34
SCHOOL I