high-speed discrimination and sorting of submicron ...clelandlab.uchicago.edu/pdf/rajauria sort...
TRANSCRIPT
High-Speed Discrimination and Sorting of Submicron Particles Usinga Microfluidic DeviceSukumar Rajauria,†,∥ Christopher Axline,†,⊥ Claudia Gottstein,‡ and Andrew N. Cleland*,§,¶
†Department of Physics, University of California, Santa Barbara, California 93106, United States‡Neuroscience Research Institute, University of California, Santa Barbara, California 93106, United States§Department of Physics and California Nanosystems Institute, University of California, Santa Barbara, California 93106, United States
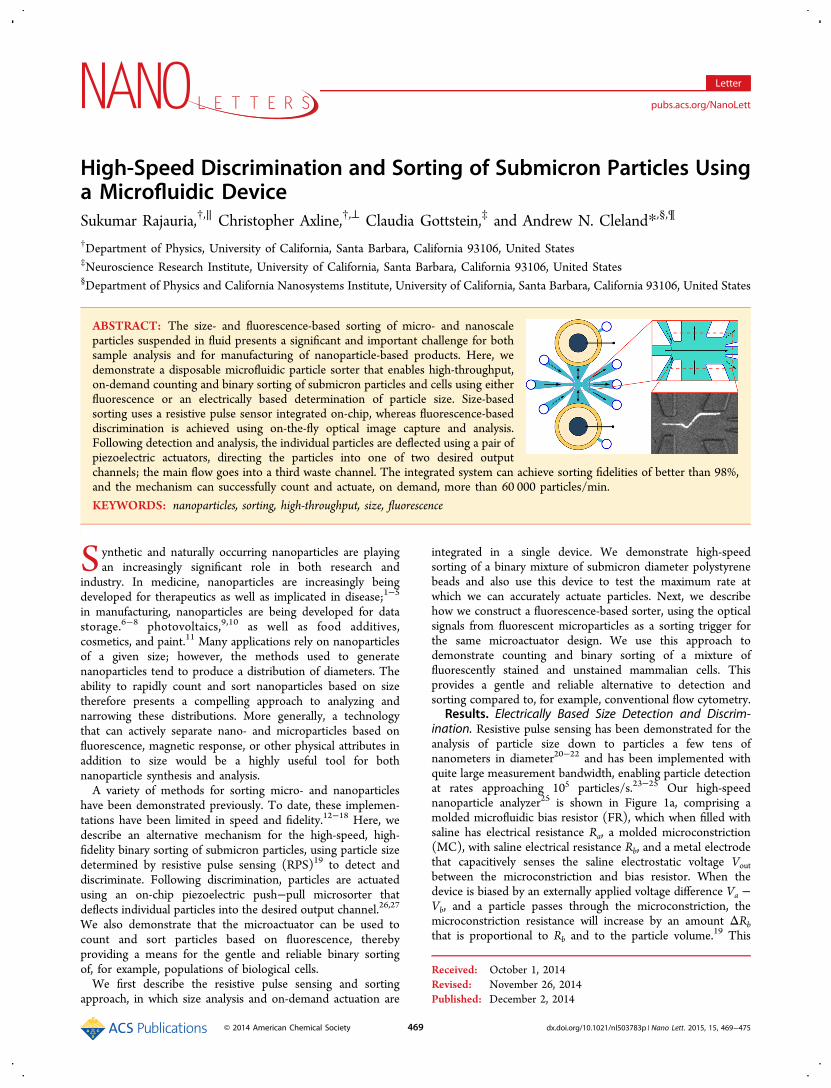
ABSTRACT: The size- and fluorescence-based sorting of micro- and nanoscaleparticles suspended in fluid presents a significant and important challenge for bothsample analysis and for manufacturing of nanoparticle-based products. Here, wedemonstrate a disposable microfluidic particle sorter that enables high-throughput,on-demand counting and binary sorting of submicron particles and cells using eitherfluorescence or an electrically based determination of particle size. Size-basedsorting uses a resistive pulse sensor integrated on-chip, whereas fluorescence-baseddiscrimination is achieved using on-the-fly optical image capture and analysis.Following detection and analysis, the individual particles are deflected using a pair ofpiezoelectric actuators, directing the particles into one of two desired outputchannels; the main flow goes into a third waste channel. The integrated system can achieve sorting fidelities of better than 98%,and the mechanism can successfully count and actuate, on demand, more than 60 000 particles/min.
KEYWORDS: nanoparticles, sorting, high-throughput, size, fluorescence
Synthetic and naturally occurring nanoparticles are playingan increasingly significant role in both research and
industry. In medicine, nanoparticles are increasingly beingdeveloped for therapeutics as well as implicated in disease;1−5
in manufacturing, nanoparticles are being developed for datastorage.6−8 photovoltaics,9,10 as well as food additives,cosmetics, and paint.11 Many applications rely on nanoparticlesof a given size; however, the methods used to generatenanoparticles tend to produce a distribution of diameters. Theability to rapidly count and sort nanoparticles based on sizetherefore presents a compelling approach to analyzing andnarrowing these distributions. More generally, a technologythat can actively separate nano- and microparticles based onfluorescence, magnetic response, or other physical attributes inaddition to size would be a highly useful tool for bothnanoparticle synthesis and analysis.A variety of methods for sorting micro- and nanoparticles
have been demonstrated previously. To date, these implemen-tations have been limited in speed and fidelity.12−18 Here, wedescribe an alternative mechanism for the high-speed, high-fidelity binary sorting of submicron particles, using particle sizedetermined by resistive pulse sensing (RPS)19 to detect anddiscriminate. Following discrimination, particles are actuatedusing an on-chip piezoelectric push−pull microsorter thatdeflects individual particles into the desired output channel.26,27
We also demonstrate that the microactuator can be used tocount and sort particles based on fluorescence, therebyproviding a means for the gentle and reliable binary sortingof, for example, populations of biological cells.We first describe the resistive pulse sensing and sorting
approach, in which size analysis and on-demand actuation are
integrated in a single device. We demonstrate high-speedsorting of a binary mixture of submicron diameter polystyrenebeads and also use this device to test the maximum rate atwhich we can accurately actuate particles. Next, we describehow we construct a fluorescence-based sorter, using the opticalsignals from fluorescent microparticles as a sorting trigger forthe same microactuator design. We use this approach todemonstrate counting and binary sorting of a mixture offluorescently stained and unstained mammalian cells. Thisprovides a gentle and reliable alternative to detection andsorting compared to, for example, conventional flow cytometry.
Results. Electrically Based Size Detection and Discrim-ination. Resistive pulse sensing has been demonstrated for theanalysis of particle size down to particles a few tens ofnanometers in diameter20−22 and has been implemented withquite large measurement bandwidth, enabling particle detectionat rates approaching 105 particles/s.23−25 Our high-speednanoparticle analyzer25 is shown in Figure 1a, comprising amolded microfluidic bias resistor (FR), which when filled withsaline has electrical resistance Ra, a molded microconstriction(MC), with saline electrical resistance Rb, and a metal electrodethat capacitively senses the saline electrostatic voltage Voutbetween the microconstriction and bias resistor. When thedevice is biased by an externally applied voltage difference Va −Vb, and a particle passes through the microconstriction, themicroconstriction resistance will increase by an amount ΔRbthat is proportional to Rb and to the particle volume.19 This
Received: October 1, 2014Revised: November 26, 2014Published: December 2, 2014
Letter
pubs.acs.org/NanoLett
© 2014 American Chemical Society 469 dx.doi.org/10.1021/nl503783p | Nano Lett. 2015, 15, 469−475

changes the electrostatic potential of the saline above the metalsense electrode by an amount
Δ = −+
Δ−V
R RR R
RR
V V( )
( )a b
a b
b
ba b2
(1)
In an optimally designed circuit the MC and FR resistances arebalanced, Ra = Rb, and the first term in eq 1 is equal to 1/4. Inthe limit where the amplifier circuit connected to the electrodehas infinite input impedance, the voltage change at the amplifierinput is given by eq 1, yielding a large bandwidth voltage signalproportional to the particle volume.Figure 1b demonstrates the electrical detection of a single 1
μm diameter polystyrene particle. It shows both the highsensitivity and the rapid electrical response of the device,corresponding to the short transient (∼100 μs) generated bythe particle passage through the microconstriction. Theamplitude of the voltage signal can be used to discriminateparticle size, as in Figure 1c, showing signals generated by a
mixture of 0.75 and 1 μm diameter polystyrene beads. Twodistinct signal amplitudes are visible in the time trace, which areaccumulated to generate the histogram also shown in Figure 1c.
Particle Actuation.We actively displace particles using a pairof metal bimorph disc actuators, made from a lead zirconate-titanate piezoelectric material and purchased commercially. Theactuators bend in a concave-up or concave-down fashion,determined by the sign of an externally applied voltage. Theseactuators are placed symmetrically on either side of the sortingregion of the microfluidic device, each above a small volume offluid connected by a narrow channel to the main channelthrough which particles pass (see Figure 2a). The actuators areused in a tandem push−pull arrangement, one driven by avoltage pulse with polarity chosen so that it pushes theunderlying fluid, and the other driven by the opposite polarityvoltage pulse, so that it pulls on the fluid underneath, motionthat generates fluid flow with minimal static pressure change.When a particle passes through the sorting region of the device,
Figure 1. Electrical detection of particles: (a) Electrical particle size analyzer. Upper drawing shows layout, with input flow (IN) passing through afluidic resistor (FR) and a microconstriction (MC), in between which a sensor electrode senses the output voltage Vout due to the bias Va and Vb.Following the microconstriction, particles are flow-focused (FF1 and FF2) and then actuated (A1 and A2) into one of the three output channels.Image below shows the microfluidic device with magnified views of the fluid resistor and microconstriction. (b) Output voltage Vout as a function oftime when a single 1 μm diameter latex bead passes through the microconstriction, with good time resolution and signal-to-noise ratio. The peakvoltage change is proportional to the applied potential difference Vb − Va across the microconstriction as well as to the volume of the particle. Thesign of the voltage pulse is inverted by a following amplifier. (c) Left: Accumulated voltage pulses from a mixture of 1 and 0.75 μm diameter beads.Right: Histogram of Gaussian-fit voltage amplitudes from data similar to that shown on left.
Figure 2. Push−pull actuator: (a) Overview: Primary flow is from input (IN) to waste port (OUT B). Focusing flow (FF1 and FF2, dashed arrows)confines the particle lateral distribution in main flow. A pair of disc transducers (A1 and A2) generate fluid flow to or from the actuators (verticalarrows); a volume below each actuator (not shown) is filled using FA1 and FA2. The resulting transverse drag flow displaces particles toward outputports OUT A and OUT C (dashed-dot arrows). (b) Expanded view of sorting region in (a), roughly the microscope field of view. (c) Long exposureshowing a single fluorescent polystyrene bead (0.5 μm diameter) during an actuation directing the particle to OUT A. Scale bar L = 10 μm. Layoutfor fluorescence-based sorting is similar, but with 10× scale, so L = 100 μm; blue dashed box indicates region of interest (ROI) for fluorescencesignal. (d) Individual actuator tune-up: Bead displacement when actuating just upper (red) or lower (green) actuator in push mode, with voltageadjusted to give equal bead displacement from each actuator. Driving both actuators (black) shows good balance, with no net bead displacement.Images to right show time tracks for a particle corresponding to data in green (upward displacement, top image), black (no net displacement, middleimage) and red (downward displacement, bottom image). A similar tune-up was done for the pull mode actuation.
Nano Letters Letter
dx.doi.org/10.1021/nl503783p | Nano Lett. 2015, 15, 469−475470

these opposite polarity voltage pulses (VA1, VA2) are generatedand applied to the actuators. The resulting pulse of fluid flow,transverse to the main channel flow in which the particle isentrained, displaces the particle toward one of the outputchannels.The microfluidic device shown in Figure 2 was fabricated by
molding polydimethylsiloxane (PDMS) using a lithographicallydefined mold made from photodefinable epoxy. The actuatorswere embedded in the PDMS structure, with a very thin PDMSlayer separating the actuator from the fluid, thus yielding strongand efficient mechanical coupling to the fluid. We mounted thecompleted device on the stage of an inverted fluorescencemicroscope, with the active area of the device focused through adry objective onto the plane of a CCD camera. For the initialexperiments, we used fluorescent polystyrene beads, 0.5 μm indiameter. The microfluidic channels were completely filled witheither filtered saline or deionized water, and fluid flow wasestablished by regulating the air pressure at each of the deviceports. We then introduced the beads into the input port on thedevice, and used parallel flow in the two flow-focusing ports oneither side of the input port to hydrodynamically focus the flow,yielding bead velocities of ∼1 mm/s. The beads weresufficiently diluted prior to injection that only one bead passedthrough the active area of the device at a time.To deflect a bead, two opposite-polarity electrical pulses with
amplitude 1−5 V and duration 10 ms were applied to thetransducers, generating the desired push−pull drag flow in thefluid channel connecting the two transducers. Figure 2c displaysthe resulting response of an individual bead to this kind ofsignal, with the bead directed to output port A. Reversing thepolarity of the signals would instead deflect the particle tooutput port C. In the absence of an actuation signal, particleswould flow into the waste port B.Size-Based Sorting of Particles. We combined the electrical
size analyzer and the microactuator to demonstrate all-electronic size-based sorting. We established pressure-drivenflow of the analyte through the main channel of the deviceusing flow-focusing to maintain tight lateral spacing of theparticles. Particles passed one at a time through the sizeanalyzer, resulting in the generation of an output pulse whoseamplitude, proportional to the particle volume, was used todiscriminate and drive the piezoelectric actuators. Themicroactuator flow pulse then directed the particle to thedesired output port. The electrical schematic is shown in Figure3a; the electrical signal from the particle analyzer wasdiscriminated and a trigger generated, after a programmabletime delay, that was then amplified and used to drive theactuators.In Figure 3b, we show the results of a size-based sorting
experiment, using a mixture of polystyrene beads with 0.75 and1 μm diameters. The figure displays the input size histogram,color-coded for where the input particles were directed (red foroutput A, green for output C). We also mark the size (voltage)at which the binary sort discriminator and trigger was set. Asingle pass through the device produces highly enrichedoutputs, with monodisperse populations achieving (in thisexperiment) 100% sorting fidelity at each output port, definedas the fraction of beads appearing at each output port that wereintentionally directed there. The fidelity of the sorter isultimately limited by variations in the particle speed and byinsufficient drag force on some particles, both of which arise forparticles near the bottom and top of the channel, where the
Poiseuille flow velocity and the microactuator induced dragboth fall to zero.Very high speed sorting can be achieved using this
microactuator design. Figure 3c shows the high-speed binarysorting of 1 μm diameter polystyrene particles, where wesignificantly increased the flow rate of particles over theprevious experiments. The voltage pulse from the particle sizeanalyzer was directly amplified to generate an actuation voltagethat sent the first N particles to output A. The actuation voltagewas then shut off, and the next N particles were directed tooutput B. Red and green dots show the final positions ofparticles in the output region. An output fidelity of around 98%was achieved, as shown in Table 1. For the actuated particles,the actuation signal pulse width was about 500 μs, whichcorresponds to a maximum sorting speed of about 60 000particles/min, assuming a 50% duty cycle. The sorting rate islimited in this case by the compliance of the actuators; stiffer
Figure 3. Electrical sorting of microparticles: (a) Schematic for size-based microsorter, which performs a binary sort based on particle size.The electrical particle detection signal Vout is amplified (AMP) thenused to generate a delayed binary signal (TRIG) that passes through ahigh-voltage amplifier (HV AMP) which drives the actuators (A1 andA2). (b) Histogram of effective particle diameters measured using theparticle analyzer, for a mixture of polystyrene beads 0.75 and 1 μm indiameter. The 1 μm peak is used to calibrate the horizontal axis. Thehistogram is color-coded according to the sorter output, where red andgreen corresponds to particles sent to outputs ports A and C,respectively. The sorter was operated using a discriminator set to thevoltage corresponding to a particle diameter of 0.86 μm (black arrow).(c) High speed actuation. Red and green dots show the final positionsof particles with (port A) and without (port B) actuation. For theactuated particles the pulse width of the actuation signal was 500 μs,which corresponds to a sorting speed of ∼60 000 particles/min, with afidelity of around 98%.
Nano Letters Letter
dx.doi.org/10.1021/nl503783p | Nano Lett. 2015, 15, 469−475471

actuators would be required to achieve sorting speedssignificantly higher than this.Fluorescence-Based Particle and Cell Sorting. In addition
to the size-based sorting, we also used the microactuator inconjunction with microscope-based fluorescent image analysisto construct a fluorescence-based sorter. This was then appliedto the sorting of different size fluorescent beads, as well as thesorting of stained from unstained biological cells. Theimplementation and its tune-up, which required scaled-upmicrofluidic design to accommodate larger diameter beads andcells, are described in the Methods section. We were able tobring the fidelity of this sorter, defined as the fraction offluorescent beads that went to the desired output port, up to avalue of 94%.To demonstrate the ability of this device to sort biological
cell populations, we used murine macrophages, a model systemfor stem cells, stained with a Hoechst dye. In a stem cell sortingexperiment, this cell-permeable dye is rapidly transported out ofstem cells, allowing discrimination of stem cells from nonstemcells through the resulting side population in, for example, flow-cytometry-based assays. In our model system, where we used asingle type of cells, a differentiated population was achieved byspiking the stained cells into a nonstained cell population at aratio of 3:1. This mixture was then passed through thefluorescence-based sorter.Figure 4a shows the discrimination we can achieve between
Hoechst-bright and Hoechst-negative cells. The Hoechst-brightcells had significantly higher intensity at the emissionwavelength of 461 nm than the Hoechst-negative cells, evenaccounting for cell size; cell size was analyzed by evaluating the
width of the Gaussian intensity profile for each cell. Theintensity difference between the Hoechst-bright and Hoechst-negative cells when passed through the ROI was used todiscriminate between the two cell types, and trigger thetransducers accordingly. The inset to Figure 4b shows the initialpositions of cells inside the ROI, as well as each cell’s finalposition in the output port, where we directed the Hoechst-negative cells to port A, Hoechst-bright cells to port C, andunidentified cells to port B. A single pass sorting produceshighly purified and enriched output solutions, as displayed inTable 2. The two output ports (A and C) received 94.5% of the
total cell population, with 6.5% of the cells passing to the wasteport B. The sorting fidelity for the cells, defined as the fractionof cells at an output port that were intentionally directed there,was 95% at output port A, whereas the fidelity at output port Cwas 100%.This experiment demonstrates a powerful and potentially
useful application for this device, enabling the on-demandsorting of cells based on functional parameters or based onsurface or internal marker expression, following which thesorted cells can be used for further study. In the fluorescencemode, this device achieves a sorting throughput of ∼6000 cells/min with a fidelity of better than 95%, which is comparable tothe results reported in the literature.13,26 This approachpromises an alternative and significantly more flexible approachto cell sorting than is possible using conventional flowcytometry.
Conclusions. In conclusion, we have developed afluorescence-based as well as a size-based high-speed micro-sorter, both implemented in a disposable microfluidic format.The two versions of the device enable discrimination ofindividual submicron particles and cells with good signal-to-noise ratio, which control an integrated push−pull micro-actuator, yielding a sorter that can be operated at high speedwith high fidelity. The sorting scheme is label-free, and we havedemonstrated the ability to perform binary sorts of bothsynthetic polystyrene beads as well as biological cells.This concept can be extended to sort multicomponent
nanoparticle solutions. A multichannel output design can easilybe configured to allow more complex configurations,combining both electrical and optical detection techniques aswell as doing higher-order sorting, with different binary sortelements cascaded to allow multiplexed operation. A cascadedarrangement could also be used to correct sorting errors fromprevious sorting elements. It could also be possible to equip theCCD camera with a Bayer mask or use a triple-CCD device inorder to obtain optical images of the cells, similar to imagingflow cytometry but with added sorting capability. The low cost,scalable fabrication, and simple on-chip detection and sortingability, make this device potentially useful in a wide range ofapplications.
Table 1. Size-Based Sorting: Results of Sorting PolydisperseParticles with 0.75 and 1 μm Diameters, Showing theNumber of Beads in Each Output Port As Well As theSorting Fidelity, Defined in the Text
outputport
target size(μm)
output(1 μm)
output(0.75 μm)
fidelity(%)
A 1 180 0 100B 0 14C 0.75 0 207 100
Figure 4. Fluorescence-activated cell sorting: (a) Discriminationbetween Hoechst-bright (red) and Hoechst-negative (blue) mamma-lian cells, where each cell is evaluated for its size (width of Gaussian fitto intensity image) and for its integrated fluorescent intensity. (b)Histogram of sorting results, as a function of final vertical displacementof cells following the actuation pulse. Inset shows positions of cellsbefore (yellow, white, magenta) and after (red, aqua, green) thesorting process. Yellow and red dots are for Hoechst-bright cells, whiteand aqua are for Hoechst-negative cells, and magenta and green werecells not actuated correctly.
Table 2. Fluorescence-Activated Cell Sorting of Hoechst-Bright versus Hoechst-Negative J774 Macrophagea
outputport
target celltype
negative cells(number)
bright cells(number) fidelity %
A negative 110 6 95B waste 4 12C bright 0 106 100
aThis table shows the sorting results in numbers of cells; the lastcolumn shows the sorting fidelity, defined in the text.
Nano Letters Letter
dx.doi.org/10.1021/nl503783p | Nano Lett. 2015, 15, 469−475472

Methods. Device Fabrication. The micromold used todefine the microfluidic sorter poly(dimethylsiloxane) (PDMS)structure was fabricated using two thicknesses of the photo-definable epoxy SU-8 (MicroChem Corp.), patterned usingoptical lithography; see Figure 5. The substrate consisted of abare 100 mm silicon wafer onto which we defined goldalignment marks using a photoresist liftoff process. The thinregions of the micromold (2 μm thick), which includes thefluidic resistor (FR) and microconstriction (MR), werepatterned first. The fluidic resistor was defined using 17parallel ribs of SU-8, each rib 50 μm long and 3 μm wide. Themicroconstriction was a rib of SU-8 that was 2 μm long and 2μm wide. The remaining, thicker portions of the microfluidicstructure were defined following this using thick (15 μm) SU-8.This mold was used to cast PDMS, also shown in Figure 5, andcould be reused to fabricate many PDMS elements. Once cast,the PDMS was bonded to a clean glass slide that, for the size-based microsorter, included a sensing electrode (10 nm Ti, 50nm Au), fabricated using a conventional photoresist liftoffprocess.Steady-State Device Operation. The microfluidic channels
were completely filled with either filtered saline or deionizedwater, and fluid flow was established by regulating the airpressure at each of the device ports. Usually, IN, FF1, and FF2ports (refer to Figure 2a) were set to very similar values tocreate a pressure head on the analyte input side. The beads orcells were introduced into the IN port on the device, and FF1and FF2 flow-focusing ports were used to hydrodynamicallyfocus the input beads toward the OUT B port. On the otherside of the microsorter, OUT A, B, C ports were set at lowerpressure than IN port, yielding the bead velocities of 1 mm/s.Actuator Tune-Up. Using the microactuator to successfully
drive particles to the desired output port depends on transducer
pulse amplitude, pulse timing as well as on the height of theparticle in the channel. The time delay from detection to theactuation point is inversely proportional to velocity, so finding apulse delay that works for the range of expected velocities isclearly necessary. The height of a particle in the channeldetermines its velocity, due to the Poiseuille distribution offlow; this also controls the effectiveness of the sorting flowpulse, which has the same Poiseuille flow distribution, so that,for example, a slow particle will feel a smaller sorting force thana fast particle. As slower particles are in the sorting regionproportionally longer than fast particles, the integrated impulsecan be made almost independent of velocity. In order toachieve the highest fidelity actuation, we tuned each trans-ducer’s actuation voltage separately and ensured that nearly thesame end result could be achieved independent of the particle’smeasured horizontal velocity. Figure 2d shows part of the tune-up for the push mode actuation, in which the voltage applied toone actuator acting by itself was adjusted to give the samedisplacement as for the other actuator acting by itself (red andgreen data points). This was verified by applying the samepolarity pulse to each actuator, giving a net null displacement(black data points). For example, for the device used here, wefound the upper actuator (A1) would balance the loweractuator (A2) if we used pulses of amplitude +2.5 V and +4.5 V,respectively, the difference in voltage reflecting a difference inthe transducers or in how they were mounted. A similar tune-up procedure was used for the pull mode actuation.
Operation of Electrical Size-Based Sorter. Constant andopposite voltages Va and Vb (typically a few volts in amplitude)were applied to bias electrodes A and B, respectively (Figure4a). The bias voltages were adjusted in such a way as to keepthe average sensor output voltage Vout near zero, to avoidelectrolytic corrosion of the sensing electrode. The instanta-
Figure 5. Fabrication process: (a) Fabrication process flow for fabricating the PDMS-based devices. The first six steps show how the micromold waspatterned, using the photodefinable epoxy SU-8 (MicroChem Corp.). The first three steps are to define the thinner (2 μm thick) fluidic resistor andmicroconstriction. The next three steps were used to define the thicker (15 μm) main features of the structure, including the fluidic channels and thevolumes for the actuator elements. We then used to define the actual PDMS device in two different stages. First (steps 7 and 8), a very thin PDMSlayer was spin-coated on the mold, to a thickness of about 100 μm, and was then cured by baking for 30 min at 100 °C. Then, two PZT actuators(Digikey part number 668-1000-ND) were placed on the predefined sorter location on the mold. Additional PDMS was then poured on the mold,step 9, to a total thickness of about 5 mm and cured for 2 h at 80 °C. The hardened elastomer was then peeled off of the mold, and ports 1 mm indiameter were punched in the PDMS for fluid access, and the PDMS then cleaned in isopropanol. Following this, the PDMS surface treated for 10min in a UV-ozone discharge immediately prior to bonding to a clean glass substrate. (b) Left: Optical micrographs of the complete device bondedon the glass substrate. Right: shows a magnified view of the region including the electrical sense electrode and the microsorter.
Nano Letters Letter
dx.doi.org/10.1021/nl503783p | Nano Lett. 2015, 15, 469−475473
neous voltage Vout was monitored and compared to a setthreshold voltage, with voltages beyond the threshold triggeringthe sorter actuation. The trigger (Stanford Research DG535)would in turn generate a square pulse of 10 ms duration andVp−p = 1 V amplitude, which was amplified by a dual-outputamplifier (Krohn-Hite 3602M) to generate positive andnegative polarity pulses, which were applied to the two PZTtransducers. The voltages used to drive the PZTs were tunedup as described above.Operation of Fluorescence-Based Sorter. For fluorescence-
based sorting, which was used designed to sort both fluorescentbeads as well as biological cells with dimensions of order 10μm, a much larger microfluidic design was used, where inFigure 2b and c the layout was scaled up uniformly by a factorof 10 from the microparticle sorter. In this implementation, theparticles to be sorted were illuminated with a mercury lampthrough a DAPI filter cube, and the return fluorescent signalcaptured using a 60× dry objective before illuminating a charge-coupled device (CCD) camera (QICAM 12-bit, 100 fps). Thepixels in the CCD lying inside a software-defined rectangular“region of interest” (ROI), shown in Figure 2c, were digitallyanalyzed and summed in real time to evaluate the ROI totalintensity. When a bead passes through the ROI, the summedintensity increases sharply, and this intensity is used to generatea software-programmable delayed trigger pulse on a functiongenerator (Stanford Research Systems DS345, square pulses of10 ms duration and Vp−p = 1 V amplitude). This pulse wasamplified by a dual-output amplifier (Krohn-Hite 3602M) togenerate positive and negative polarity pulses with amplitudesas per the tune-up procedure described above. The oppositepolarity pulses were applied to the two transducers, generatingthe desired push−pull drag flow in the channel connecting thetwo transducers. In the absence of an actuation signal, particlesin the flow stream would flow into the waste port B in Figure 2.The fidelity of this sorter, defined as the fraction of
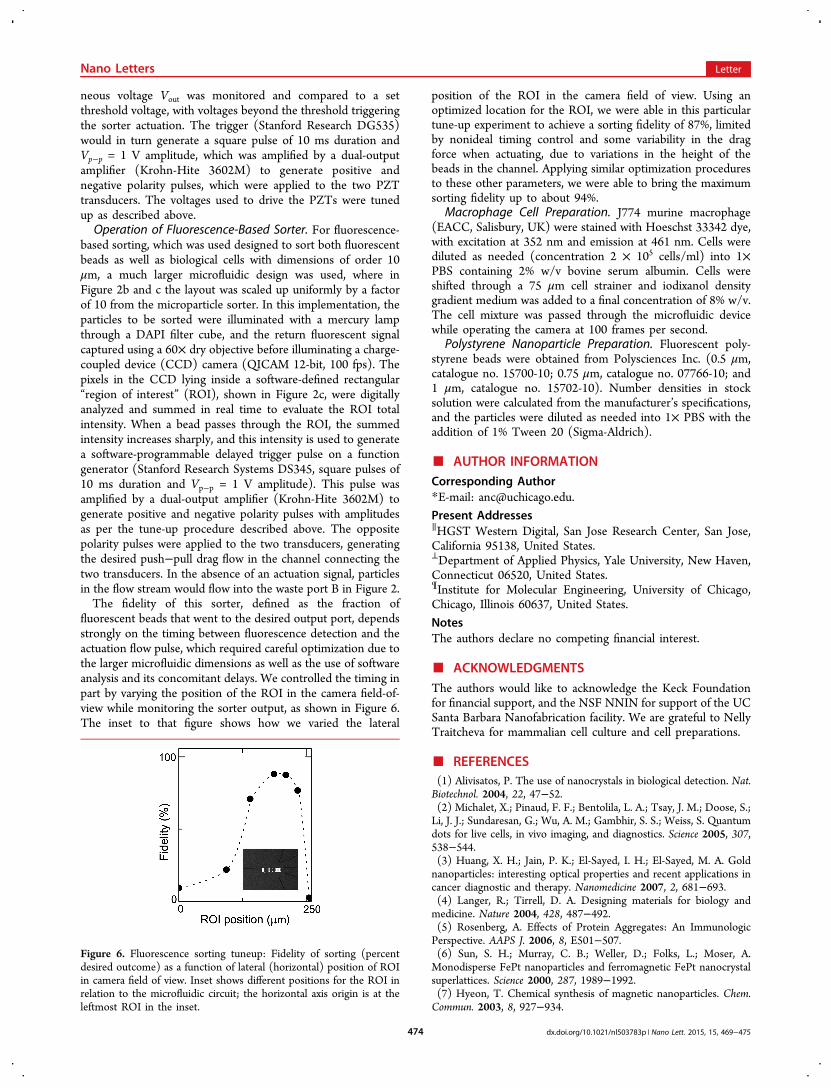
fluorescent beads that went to the desired output port, dependsstrongly on the timing between fluorescence detection and theactuation flow pulse, which required careful optimization due tothe larger microfluidic dimensions as well as the use of softwareanalysis and its concomitant delays. We controlled the timing inpart by varying the position of the ROI in the camera field-of-view while monitoring the sorter output, as shown in Figure 6.The inset to that figure shows how we varied the lateral
position of the ROI in the camera field of view. Using anoptimized location for the ROI, we were able in this particulartune-up experiment to achieve a sorting fidelity of 87%, limitedby nonideal timing control and some variability in the dragforce when actuating, due to variations in the height of thebeads in the channel. Applying similar optimization proceduresto these other parameters, we were able to bring the maximumsorting fidelity up to about 94%.
Macrophage Cell Preparation. J774 murine macrophage(EACC, Salisbury, UK) were stained with Hoeschst 33342 dye,with excitation at 352 nm and emission at 461 nm. Cells werediluted as needed (concentration 2 × 10⁵ cells/ml) into 1×PBS containing 2% w/v bovine serum albumin. Cells wereshifted through a 75 μm cell strainer and iodixanol densitygradient medium was added to a final concentration of 8% w/v.The cell mixture was passed through the microfluidic devicewhile operating the camera at 100 frames per second.
Polystyrene Nanoparticle Preparation. Fluorescent poly-styrene beads were obtained from Polysciences Inc. (0.5 μm,catalogue no. 15700-10; 0.75 μm, catalogue no. 07766-10; and1 μm, catalogue no. 15702-10). Number densities in stocksolution were calculated from the manufacturer’s specifications,and the particles were diluted as needed into 1× PBS with theaddition of 1% Tween 20 (Sigma-Aldrich).
■ AUTHOR INFORMATIONCorresponding Author*E-mail: [email protected].
Present Addresses∥HGST Western Digital, San Jose Research Center, San Jose,California 95138, United States.⊥Department of Applied Physics, Yale University, New Haven,Connecticut 06520, United States.¶Institute for Molecular Engineering, University of Chicago,Chicago, Illinois 60637, United States.
NotesThe authors declare no competing financial interest.
■ ACKNOWLEDGMENTSThe authors would like to acknowledge the Keck Foundationfor financial support, and the NSF NNIN for support of the UCSanta Barbara Nanofabrication facility. We are grateful to NellyTraitcheva for mammalian cell culture and cell preparations.
■ REFERENCES(1) Alivisatos, P. The use of nanocrystals in biological detection. Nat.Biotechnol. 2004, 22, 47−52.(2) Michalet, X.; Pinaud, F. F.; Bentolila, L. A.; Tsay, J. M.; Doose, S.;Li, J. J.; Sundaresan, G.; Wu, A. M.; Gambhir, S. S.; Weiss, S. Quantumdots for live cells, in vivo imaging, and diagnostics. Science 2005, 307,538−544.(3) Huang, X. H.; Jain, P. K.; El-Sayed, I. H.; El-Sayed, M. A. Goldnanoparticles: interesting optical properties and recent applications incancer diagnostic and therapy. Nanomedicine 2007, 2, 681−693.(4) Langer, R.; Tirrell, D. A. Designing materials for biology andmedicine. Nature 2004, 428, 487−492.(5) Rosenberg, A. Effects of Protein Aggregates: An ImmunologicPerspective. AAPS J. 2006, 8, E501−507.(6) Sun, S. H.; Murray, C. B.; Weller, D.; Folks, L.; Moser, A.Monodisperse FePt nanoparticles and ferromagnetic FePt nanocrystalsuperlattices. Science 2000, 287, 1989−1992.(7) Hyeon, T. Chemical synthesis of magnetic nanoparticles. Chem.Commun. 2003, 8, 927−934.
Figure 6. Fluorescence sorting tuneup: Fidelity of sorting (percentdesired outcome) as a function of lateral (horizontal) position of ROIin camera field of view. Inset shows different positions for the ROI inrelation to the microfluidic circuit; the horizontal axis origin is at theleftmost ROI in the inset.
Nano Letters Letter
dx.doi.org/10.1021/nl503783p | Nano Lett. 2015, 15, 469−475474

(8) Lu, An-Hui; Salabas, E. L.; Schueth, F. Magnetic nanoparticles:Synthesis, protection, functionalization, and application. Angew. Chem.2007, 46, 1222−1244.(9) Seow, Z. L. S.; Wong, A. S. W.; Thavasi, V.; Jose, R.;Ramakrishna, S.; Ho, G. W. Controlled synthesis and application ofZnO nanoparticles, nanorods and nanospheres in dye-sensitized solarcells. Nanotechnology 2009, 20, 045604.(10) Yella, A.; Lee, H. W.; Tsao, H. N.; Yi, C. Y.; Chandiran, A. K.;Nazeeruddin, M. K.; Diau, E. W. G.; Yeh, C. Y.; Zakeeruddin, S. M.;Gratzel, M. Porphyrin-Sensitized Solar Cells with Cobalt (II/III)-Based Redox Electrolyte Exceed 12% Efficiency. Science 2011, 334,629−634.(11) Weir, A.; Westeroff, P.; Fabricius, L.; Hristovski, K.; von Goetz,N. Titanium Dioxide Nanoparticles in Food and Personal CareProducts. Environ. Sci. Technol. 2012, 46, 2242−2250.(12) Huang, L. R.; Cox, E. C.; Austin, R. H.; Sturm, J. C. Continuousparticle separation through deterministic lateral displacement. Science2004, 304, 987−990.(13) Baret, J. C.; Miller, O. J.; Taly, V.; Ryckelynck, M.; El-Harrak,A.; Frenz, L.; Rick, C.; Samuels, M. L.; Hutchison, J. B.; Agresti, J. J.;Link, D. R.; Weitz, D. A.; Griffiths, A. D. Fluorescence-activateddroplet sorting (FADS): efficient microfluidic cell sorting based onenzymatic activity. Lab Chip 2009, 9, 1850−1858.(14) Han, J.; Craighead, H. G. Separation of Long DNA Molecules ina Microfabricated Entropic Trap Array. Science 2000, 288, 1026−1029.(15) Stavis, S. M.; Geist, J.; Gaitan, M. Separation and metrology ofnanoparticles by nanofluidic size exclusion. Lab Chip 2010, 10, 2618−2621.(16) Fu, A. Y.; Spence, C.; Scherer, A.; Arnold, F. H.; Quake, S. R. Amicrofabricated fluorescence-activated cell sorter. Nat. Biotechnol.1999, 17, 1109−1111.(17) Miltenyi, S.; Muller, W.; Weichel, W.; Radbruch, A. HighGradient Magnetic Cell Separation With MACS. Cytometry 1990, 11,231−238.(18) Lee, C. S.; Lee, H.; Westervelt, R. M. Microelectromagnets forthe control of magnetic nanoparticles. Appl. Phys. Lett. 2001, 79,3308−3310.(19) DeBlois, R. W.; Bean, C. P. Counting and Sizing of SubmicronParticles by the Resistive Pulse Technique. Rev. Sci. Instrum. 1970, 41,909−916.(20) Saleh, O. A.; Sohn, L. L. An artificial nanopore for molecularsensing. Nano Lett. 2003, 3, 37−38.(21) Li, J. L.; Gershow, M.; Stein, D.; Brandin, E.; Golovchenko, J. A.DNA molecules and configurations in a solid-state nanoporemicroscope. Nat. Mater. 2003, 2, 611−615.(22) Dekker, C. Solid-State Nanopores. Nat. Nanotechnol. 2007, 2,209−215.(23) Wood, D. K.; Oh, S. H.; Lee, S. H.; Soh, H. T.; Cleland, A. N.High-bandwidth radio frequency Coulter counter. Appl. Phys. Lett.2005, 87, 184106.(24) Wood, D. K.; Requa, M. V.; Cleland, A. N. High-bandwidthradio frequency Coulter counter. Rev. Sci. Instrum. 2007, 78, 104301.(25) Fraikin, J. L.; Teesalu, T.; McKenney, C. M.; Ruoslahti, E.;Cleland, A. N. A high-throughput label-free nanoparticle analyser. Nat.Nanotechnol. 2011, 6, 308−313.(26) Chen, C. H.; Cho, S. H.; Tsai, F.; Erten, A.; Lo, Y. H.Microfluidic cell sorter with integrated piezoelectric actuator. Biomed.Microdevices 2009, 11, 1223−1231.(27) Zhou, Y.; Amirouche, F. An Electromagnetically-Actuated All-PDMS Valveless Micropump for Drug Delivery. Micromachines 2011,2, 345−355.(28) Duffy, D. C.; McDonald, J. C.; Schueller, O. J. A.; Whitesides, G.M. Rapid prototyping of microfluidic systems in poly-(dimethylsiloxane). Anal. Chem. 1998, 70, 4974−4984.(29) Unger, M. A.; Chou, H. P.; Thorsen, T.; Scherer, A.; Quake, S.R. Monolithic microfabricated valves and pumps by multilayer softlithography. Science 2000, 288, 113−116.(30) Wang, M. M.; Tu, E.; Raymond, D. E.; Yang, J. M.; Zhang, H.C.; Hagen, N.; Dees, B.; Mercer, E. M.; Forster, A. H.; Kariv, I.;
Marchand, P. J.; Butler, W. F. Microfluidic sorting of mammalian cellsby optical force switching. Nat. Biotechnol. 2005, 23, 83−87.(31) Nagrath, S.; Sequist, L. V.; Maheswaran, S.; Bell, D. W.; Irimia,D.; Ulkus, L.; Smith, M. R.; Kwak, E. L.; Digumarthy, S.; Muzikansky,A.; Ryan, P.; Balis, U. J.; Tompkins, R. G.; Haber, D. A.; Toner, M.Isolation of rare circulating tumour cells in cancer patients bymicrochip technology. Nature 2007, 450, 1235−U10.
Nano Letters Letter
dx.doi.org/10.1021/nl503783p | Nano Lett. 2015, 15, 469−475475