plasticity size eects in free-standing submicron
TRANSCRIPT
Journal of the Mechanics and Physics of Solids52 (2004) 667–689
www.elsevier.com/locate/jmps
Plasticity size e'ects in free-standing submicronpolycrystalline FCC -lms subjected to
pure tensionH.D. Espinosa∗, B.C. Prorok, B. Peng
Department of Mechanical Engineering, Northwestern University, 2145 Sherida Rd., Evanston,IL 60208-3111, USA
Received 3 December 2002; accepted 23 July 2003
Abstract
The membrane de8ection experiment developed by Espinosa and co-workers was used to ex-amine size e'ects on mechanical properties of free-standing polycrystalline FCC thin -lms. Wepresent stress–strain curves obtained on -lms 0.2, 0.3, 0.5 and 1:0 �m thick including speci-men widths of 2.5, 5.0, 10.0 and 20:0 �m for each thickness. Elastic modulus was consistentlymeasured in the range of 53–55 GPa for Au, 125–129 GPa for Cu and 65–70 GPa for Al. Sev-eral size e'ects were observed including yield stress variations with membrane width and -lmthickness in pure tension. The yield stress of the membranes was found to increase as mem-brane width and thickness decreased. It was also observed that thickness plays a major role indeformation behavior and fracture of polycrystalline FCC metals. A strengthening size scale ofone over -lm thickness was identi-ed. In the case of Au free-standing -lms, a major transitionin the material inelastic response occurs when thickness is changed from 1 to 0:5 �m. In thistransition, the yield stress more than doubled when -lm thickness was decreased, with the 0:5 �mthick specimen exhibiting a more brittle-like failure and the 1 �m thick specimen exhibiting astrain softening behavior. Similar plasticity size e'ects were observed in Cu and Al. Scanningelectron microscopy performed on Au -lms revealed that the number of grains through the thick-ness essentially halved, from approximately 5 to 2, as thickness decreased. It is postulated thatthis feature a'ects the number of dislocations sources, active slip systems, and dislocationmotion paths leading to the observed strengthening. This statistical e'ect is corroborated by thestress–strain data in the sense that data scatter increases with increase in thickness, i.e., plasticityactivity.
The size e'ects here reported are the -rst of their kind in the sense that the measure-ments were performed on free-standing polycrystalline FCC thin -lms subjected to macroscopic
∗ Corresponding author. Tel.: +1-847-467-5989; fax: +1-847-491-3915.E-mail address: [email protected] (H.D. Espinosa).
0022-5096/$ - see front matter ? 2003 Elsevier Ltd. All rights reserved.doi:10.1016/j.jmps.2003.07.001
668 H.D. Espinosa et al. / J. Mech. Phys. Solids 52 (2004) 667–689
homogeneous axial deformation, i.e., in the absence of deformation gradients, in contrast tonanoindentation, beam de8ection, and torsion, where deformation gradients occur. To the best ofour understanding, continuum plasticity models in their current form cannot capture the observedsize scale e'ects.? 2003 Elsevier Ltd. All rights reserved.
Keywords: Thin -lms; Plasticity; Strengthening; MEMS; Failure
1. Introduction
Knowledge of a material’s mechanical properties has long been essential to thedesign and development of structures and systems. At the millimeter or larger sizescale, these properties are well known for most materials and well-established testingprocedures and constitutive models are available. Specimens at this size scale typicallyhave dimensions far exceeding the scale of the underlying material microstructure.Hence, homogenization and averaging schemes are used to interpret experiments andformulate constitutive models.
Over the past decade, there has been a substantial thrust to reduce the size of manyelectronic and electromechanical systems to the micron and sub-micron scale by fab-ricating devices out of thin -lm materials. In these applications, successful devicedevelopment requires a thorough understanding of thin -lm mechanical properties. Atthis scale, device geometry and dimensions are similar in size to the material mi-crostructural features. Therefore, tests capable of accurately measuring the e'ect ofmicrostructure on mechanical properties need to be used (Espinosa et al., 2001a, b,2003). In this article, we report unique -ndings in this regard.
1.1. Size e6ects
The mechanical response of thin -lms depends on many factors. Of main relevanceis the existence of -lm thickness e'ects that arise because of geometrical constraintson dislocation motion. Size e'ects on mechanical properties begin to play a dominantrole when one or more of the structure’s dimensions begin to approach the scale of thematerial microstructural features. For thin -lms and MEMS materials this characteristicdimension is on the order of 0.1–10:0 �m. At this size scale, there is no signi-cant e'ecton the material elastic properties since they depend on the bonding nature between theconstituent atoms. By contrast, the onset of plastic deformation depends strongly onthe ability of dislocations to move under an induced stress (Nix, 1989; Weertman andWeertman, 1992; Hull and Bacon, 1984; Arzt, 1998). The ease of their movement canbe hindered by any number of obstacles such as grain boundaries, precipitates, twins,forest dislocation, and interfaces. Specimen size then begins to govern plastic behaviorby creating geometrical constraints and surface e'ects, which force dislocations tomove only in preferred directions. Other e'ects that specimen size can have on plasticdeformation involve microstructural features. This includes grain size, morphology, and
H.D. Espinosa et al. / J. Mech. Phys. Solids 52 (2004) 667–689 669
crystallographic texture. Preferential grain orientations during -lm growth result fromminimization of surface energies (Borodkina and Orekhova, 1982; Lejeck and Sima,1983). Likewise, the average grain size scales with the -lm thickness due to an e'ectcalled the “specimen thickness e'ect,” which depends upon grain boundaries beingpinned by their surface grooves, occurring when the mean equivalent grain diameter ison the order of the -lm thickness (Beck et al., 1948; Mullins, 1958).
Several pioneering studies have experimentally identi-ed the existence of size ef-fects on plasticity of polycrystalline metals. Fleck et al. (1994) investigated plasticitysize e'ects by applying a torque to copper rods of varying diameter in the range of12–170 �m. An increase in strength by a factor of three was observed for the smallestdiameter wire over the largest. Ma and Clark (1995), obtained experimental nanoinden-tation data showing a strong size e'ect on material hardness. They found that hardnessdecreases as indentation depth increases. Their results were veri-ed and extended insubsequent studies (Atkinson, 1995; Poole et al., 1996; Nix, 1997; Nix and Gao, 1998;McElhaney et al., 1998; Begley and Hutchinson, 1998; Goken et al., 1999; StKolkenand Evans, 1998) identi-ed plasticity size e'ects in the bending of strips, of varyingthickness between 12 and 50 �m, around a rigid rod. The experimental results showeda strength increase for the thinner -lms over the thicker -lms. These studies motivatedthe investigation of the nature of size e'ects at this scale.
In these pioneering studies, the size dependence of the mechanical properties hasbeen considered to be a result of non-uniform straining (Fleck and Hutchinson, 1993;Fleck et al., 1994; Nix and Gao, 1998). It was shown that classical continuum plas-ticity could not predict the size dependence in this regime. The generally acceptedsize limit for accurate description of plasticity by the classical theory is systems withdimensions larger than 100 �m. At the other end of the spectrum, molecular mechanicscan accurately describe material behavior. Due to limitations on performing atomisticsimulations for more than 1 million atoms, the maximum size regime computation-ally approachable is systems with dimensions smaller than 0:1 �m in size (Hutchinson,2000). This leaves an intermediate region where strain gradient plasticity theory hasbeen proposed to describe material behavior (Aifantis, 1992; Fleck and Hutchinson,1993, 1997; Fleck et al., 1994; Gao et al., 1999a, b; Huang et al., 2000; Hutchinson,2000; Bazant and Guo, 2001). In the aforementioned work of Fleck et al. (1994),direct tensile tests were also performed on identically sized copper wires. The authorsconcluded that for the most part, no size e'ects existed for this case. It should be notedthat the smallest rod diameter investigated by this group was 12 �m. The homogeneousmanner in which the uni-axial tests were conducted appears to have hindered gradientsin plasticity from occurring. The question can be raised then whether size e'ects existin polycrystalline metal -lms possessing constant grain size, in the absence of straingradients.
Doerner et al. (1986), Nix (1989), Venkatraman et al. (1990) and Venkatraman andBravman (1992) examined strengthening size e'ects in pure Al and Al alloys thin -lmsby means of wafer curvature measurements. Thin -lms were grown on passivated Sisubstrates and biaxial strength measured as a function of -lm thickness and temperature.Doerner et al. (1986) deposited -lms with various thicknesses, which resulted in anaverage grain size of about 1.3 times the -lm thickness. Venkatraman and Bravman
670 H.D. Espinosa et al. / J. Mech. Phys. Solids 52 (2004) 667–689
PV
Wafer
Optics
Mirau Microscope Objective
PMPM
θ
LM
∆
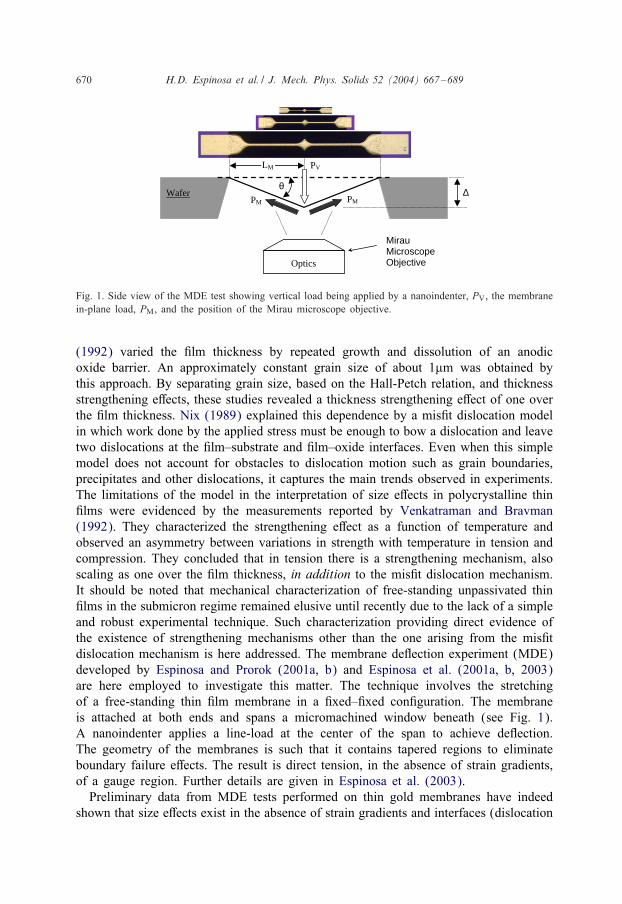
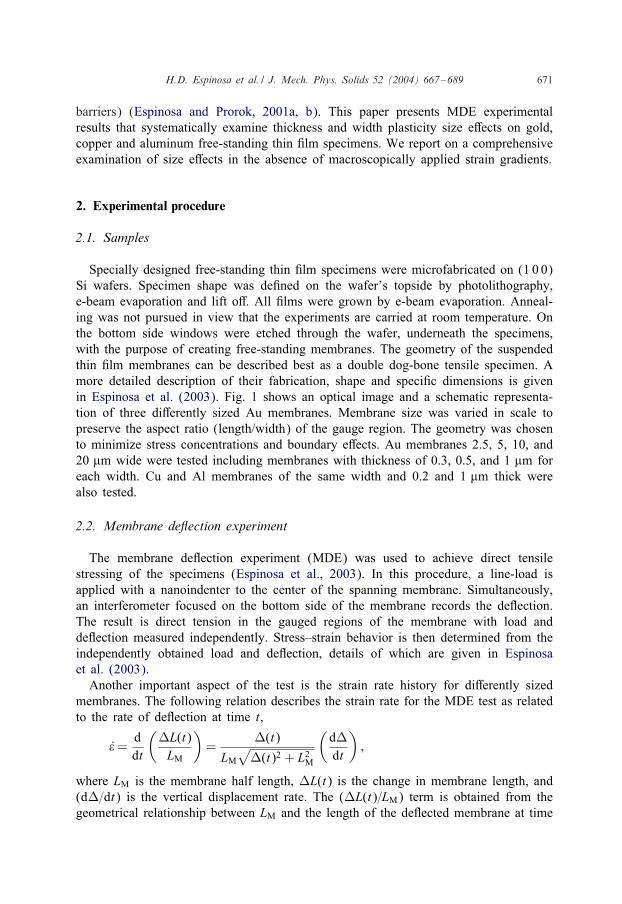
Fig. 1. Side view of the MDE test showing vertical load being applied by a nanoindenter, PV, the membranein-plane load, PM, and the position of the Mirau microscope objective.
(1992) varied the -lm thickness by repeated growth and dissolution of an anodicoxide barrier. An approximately constant grain size of about 1�m was obtained bythis approach. By separating grain size, based on the Hall-Petch relation, and thicknessstrengthening e'ects, these studies revealed a thickness strengthening e'ect of one overthe -lm thickness. Nix (1989) explained this dependence by a mis-t dislocation modelin which work done by the applied stress must be enough to bow a dislocation and leavetwo dislocations at the -lm–substrate and -lm–oxide interfaces. Even when this simplemodel does not account for obstacles to dislocation motion such as grain boundaries,precipitates and other dislocations, it captures the main trends observed in experiments.The limitations of the model in the interpretation of size e'ects in polycrystalline thin-lms were evidenced by the measurements reported by Venkatraman and Bravman(1992). They characterized the strengthening e'ect as a function of temperature andobserved an asymmetry between variations in strength with temperature in tension andcompression. They concluded that in tension there is a strengthening mechanism, alsoscaling as one over the -lm thickness, in addition to the mis-t dislocation mechanism.It should be noted that mechanical characterization of free-standing unpassivated thin-lms in the submicron regime remained elusive until recently due to the lack of a simpleand robust experimental technique. Such characterization providing direct evidence ofthe existence of strengthening mechanisms other than the one arising from the mis-tdislocation mechanism is here addressed. The membrane de8ection experiment (MDE)developed by Espinosa and Prorok (2001a, b) and Espinosa et al. (2001a, b, 2003)are here employed to investigate this matter. The technique involves the stretchingof a free-standing thin -lm membrane in a -xed–-xed con-guration. The membraneis attached at both ends and spans a micromachined window beneath (see Fig. 1).A nanoindenter applies a line-load at the center of the span to achieve de8ection.The geometry of the membranes is such that it contains tapered regions to eliminateboundary failure e'ects. The result is direct tension, in the absence of strain gradients,of a gauge region. Further details are given in Espinosa et al. (2003).
Preliminary data from MDE tests performed on thin gold membranes have indeedshown that size e'ects exist in the absence of strain gradients and interfaces (dislocation
H.D. Espinosa et al. / J. Mech. Phys. Solids 52 (2004) 667–689 671
barriers) (Espinosa and Prorok, 2001a, b). This paper presents MDE experimentalresults that systematically examine thickness and width plasticity size e'ects on gold,copper and aluminum free-standing thin -lm specimens. We report on a comprehensiveexamination of size e'ects in the absence of macroscopically applied strain gradients.
2. Experimental procedure
2.1. Samples
Specially designed free-standing thin -lm specimens were microfabricated on (1 0 0)Si wafers. Specimen shape was de-ned on the wafer’s topside by photolithography,e-beam evaporation and lift o'. All -lms were grown by e-beam evaporation. Anneal-ing was not pursued in view that the experiments are carried at room temperature. Onthe bottom side windows were etched through the wafer, underneath the specimens,with the purpose of creating free-standing membranes. The geometry of the suspendedthin -lm membranes can be described best as a double dog-bone tensile specimen. Amore detailed description of their fabrication, shape and speci-c dimensions is givenin Espinosa et al. (2003). Fig. 1 shows an optical image and a schematic representa-tion of three di'erently sized Au membranes. Membrane size was varied in scale topreserve the aspect ratio (length/width) of the gauge region. The geometry was chosento minimize stress concentrations and boundary e'ects. Au membranes 2.5, 5, 10, and20 �m wide were tested including membranes with thickness of 0.3, 0.5, and 1 �m foreach width. Cu and Al membranes of the same width and 0.2 and 1 �m thick werealso tested.
2.2. Membrane de8ection experiment
The membrane de8ection experiment (MDE) was used to achieve direct tensilestressing of the specimens (Espinosa et al., 2003). In this procedure, a line-load isapplied with a nanoindenter to the center of the spanning membrane. Simultaneously,an interferometer focused on the bottom side of the membrane records the de8ection.The result is direct tension in the gauged regions of the membrane with load andde8ection measured independently. Stress–strain behavior is then determined from theindependently obtained load and de8ection, details of which are given in Espinosaet al. (2003).
Another important aspect of the test is the strain rate history for di'erently sizedmembranes. The following relation describes the strain rate for the MDE test as relatedto the rate of de8ection at time t,
�̇=ddt
(OL(t)LM
)=
O(t)
LM
√O(t)2 + L2
M
(dOdt
);
where LM is the membrane half length, OL(t) is the change in membrane length, and(dO=dt) is the vertical displacement rate. The (OL(t)=LM) term is obtained from thegeometrical relationship between LM and the length of the de8ected membrane at time
672 H.D. Espinosa et al. / J. Mech. Phys. Solids 52 (2004) 667–689
t (Fig. 1). From this relation, it is clear that if the vertical displacement rate is constant,the strain rate is not a constant value but increases with vertical de8ection. A secondobservation is that for a constant vertical displacement rate, membranes with di'erenthalf-length are subjected to slightly di'erent strain rate histories. These aspects will befurther discussed in the experimental results section.
3. Results and discussion
3.1. Au membrane microstructure characterization
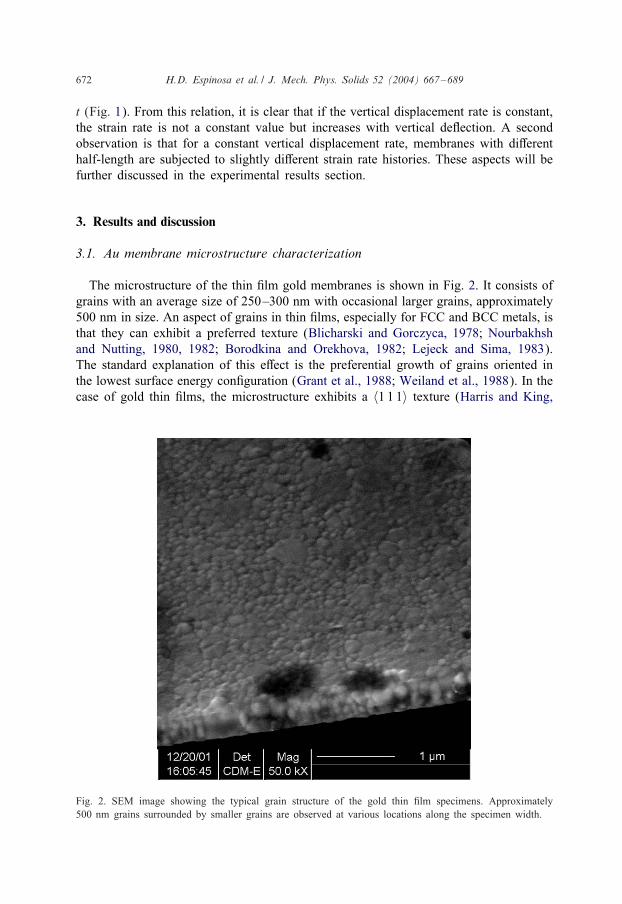
The microstructure of the thin -lm gold membranes is shown in Fig. 2. It consists ofgrains with an average size of 250–300 nm with occasional larger grains, approximately500 nm in size. An aspect of grains in thin -lms, especially for FCC and BCC metals, isthat they can exhibit a preferred texture (Blicharski and Gorczyca, 1978; Nourbakhshand Nutting, 1980, 1982; Borodkina and Orekhova, 1982; Lejeck and Sima, 1983).The standard explanation of this e'ect is the preferential growth of grains oriented inthe lowest surface energy con-guration (Grant et al., 1988; Weiland et al., 1988). In thecase of gold thin -lms, the microstructure exhibits a 〈1 1 1〉 texture (Harris and King,
Fig. 2. SEM image showing the typical grain structure of the gold thin -lm specimens. Approximately500 nm grains surrounded by smaller grains are observed at various locations along the specimen width.
H.D. Espinosa et al. / J. Mech. Phys. Solids 52 (2004) 667–689 673
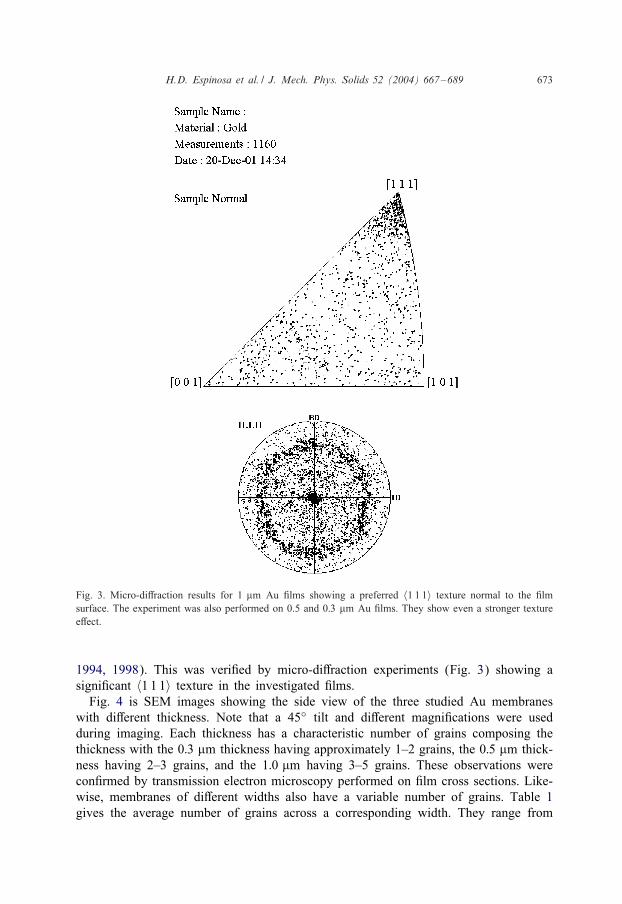
Fig. 3. Micro-di'raction results for 1 �m Au -lms showing a preferred 〈1 1 1〉 texture normal to the -lmsurface. The experiment was also performed on 0.5 and 0:3 �m Au -lms. They show even a stronger texturee'ect.
1994, 1998). This was veri-ed by micro-di'raction experiments (Fig. 3) showing asigni-cant 〈1 1 1〉 texture in the investigated -lms.
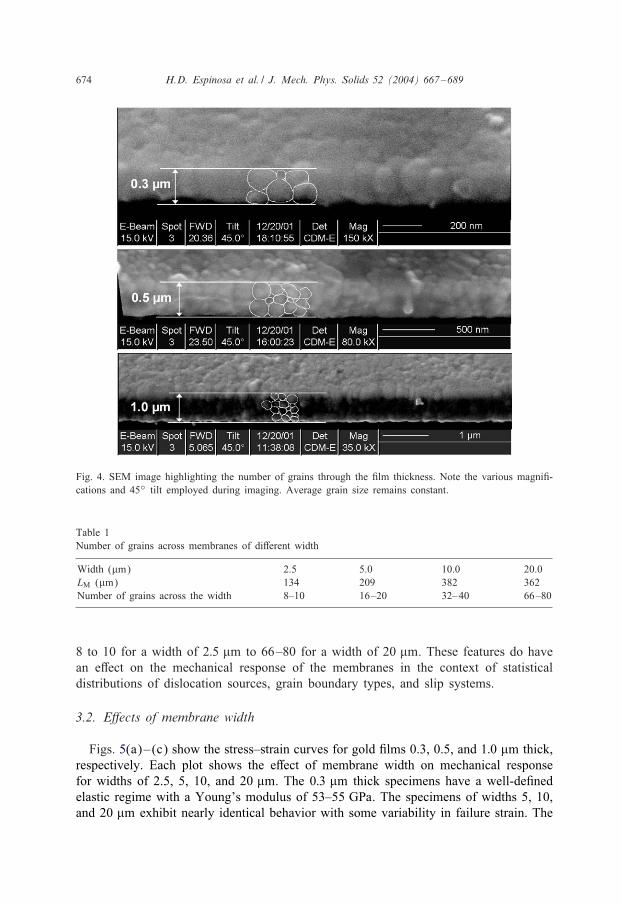
Fig. 4 is SEM images showing the side view of the three studied Au membraneswith di'erent thickness. Note that a 45◦ tilt and di'erent magni-cations were usedduring imaging. Each thickness has a characteristic number of grains composing thethickness with the 0:3 �m thickness having approximately 1–2 grains, the 0:5 �m thick-ness having 2–3 grains, and the 1:0 �m having 3–5 grains. These observations werecon-rmed by transmission electron microscopy performed on -lm cross sections. Like-wise, membranes of di'erent widths also have a variable number of grains. Table 1gives the average number of grains across a corresponding width. They range from
674 H.D. Espinosa et al. / J. Mech. Phys. Solids 52 (2004) 667–689
Fig. 4. SEM image highlighting the number of grains through the -lm thickness. Note the various magni--cations and 45◦ tilt employed during imaging. Average grain size remains constant.
Table 1Number of grains across membranes of di'erent width
Width (�m) 2.5 5.0 10.0 20.0LM (�m) 134 209 382 362Number of grains across the width 8–10 16–20 32–40 66–80
8 to 10 for a width of 2:5 �m to 66–80 for a width of 20 �m. These features do havean e'ect on the mechanical response of the membranes in the context of statisticaldistributions of dislocation sources, grain boundary types, and slip systems.
3.2. E6ects of membrane width
Figs. 5(a)–(c) show the stress–strain curves for gold -lms 0.3, 0.5, and 1:0 �m thick,respectively. Each plot shows the e'ect of membrane width on mechanical responsefor widths of 2.5, 5, 10, and 20 �m. The 0:3 �m thick specimens have a well-de-nedelastic regime with a Young’s modulus of 53–55 GPa. The specimens of widths 5, 10,and 20 �m exhibit nearly identical behavior with some variability in failure strain. The
H.D. Espinosa et al. / J. Mech. Phys. Solids 52 (2004) 667–689 675
0
50
100
150
200
250
300
350
400
0 0.002 0.004 0.006 0.008 0.01
w = 2.5 µmw = 5.0 µmw = 10.0 µmw = 20.0 µm
Str
ess
(MP
a)
Strain
thickness = 0.3 microns
0
50
100
150
200
250
300
350
400
0 0.002 0.004 0.006 0.008 0.01
w = 2.5 µmw = 5.0 µmw = 10.0 µmw = 20.0 µm
Str
ess
(MP
a)Strain
thickness = 0.5 microns
0
20
40
60
80
100
120
0 0.002 0.004 0.006 0.008 0.01
w = 2.5 µmw = 5.0 µmw = 10.0 µmw = 20.0 µm
Str
ess
(MP
a)
Strain
thickness = 1.0 micron
(c)
(b)(a)
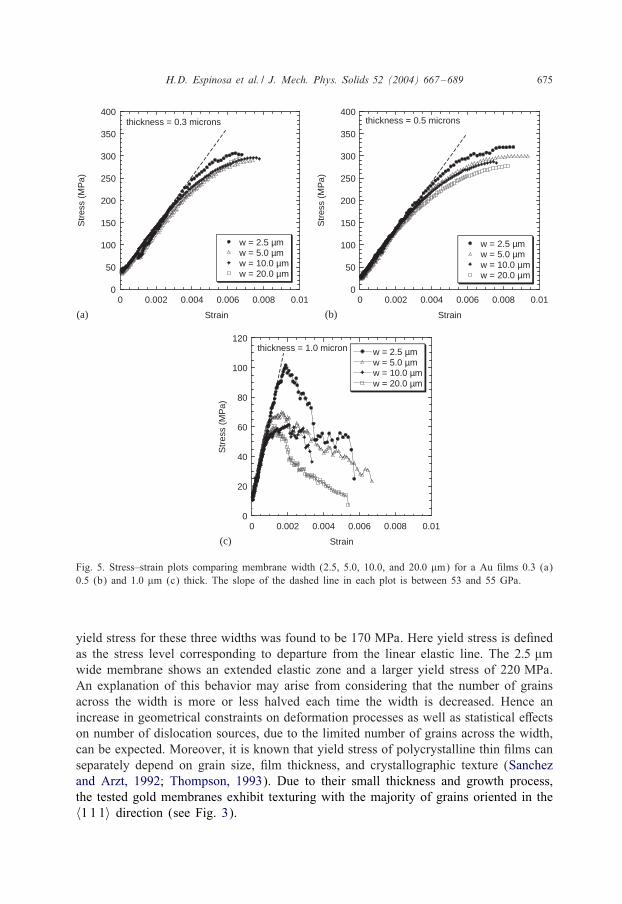
Fig. 5. Stress–strain plots comparing membrane width (2.5, 5.0, 10.0, and 20:0 �m) for a Au -lms 0.3 (a)0.5 (b) and 1:0 �m (c) thick. The slope of the dashed line in each plot is between 53 and 55 GPa.
yield stress for these three widths was found to be 170 MPa. Here yield stress is de-nedas the stress level corresponding to departure from the linear elastic line. The 2:5 �mwide membrane shows an extended elastic zone and a larger yield stress of 220 MPa.An explanation of this behavior may arise from considering that the number of grainsacross the width is more or less halved each time the width is decreased. Hence anincrease in geometrical constraints on deformation processes as well as statistical e'ectson number of dislocation sources, due to the limited number of grains across the width,can be expected. Moreover, it is known that yield stress of polycrystalline thin -lms canseparately depend on grain size, -lm thickness, and crystallographic texture (Sanchezand Arzt, 1992; Thompson, 1993). Due to their small thickness and growth process,the tested gold membranes exhibit texturing with the majority of grains oriented in the〈1 1 1〉 direction (see Fig. 3).
676 H.D. Espinosa et al. / J. Mech. Phys. Solids 52 (2004) 667–689
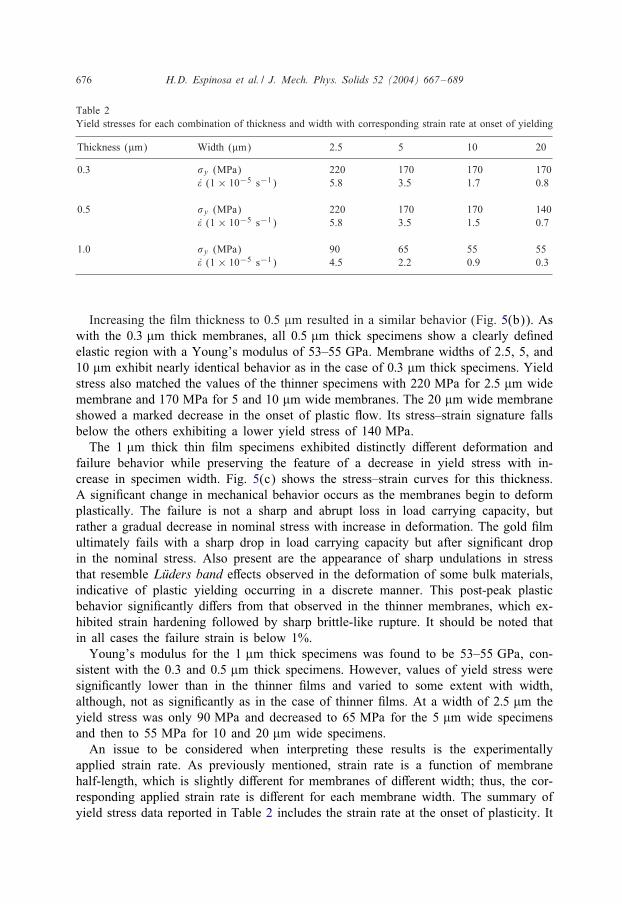
Table 2Yield stresses for each combination of thickness and width with corresponding strain rate at onset of yielding
Thickness (�m) Width (�m) 2.5 5 10 20
0.3 �y (MPa) 220 170 170 170�̇ (1 × 10⁻⁵ s−1) 5.8 3.5 1.7 0.8
0.5 �y (MPa) 220 170 170 140�̇ (1 × 10⁻⁵ s−1) 5.8 3.5 1.5 0.7
1.0 �y (MPa) 90 65 55 55�̇ (1 × 10⁻⁵ s−1) 4.5 2.2 0.9 0.3
Increasing the -lm thickness to 0:5 �m resulted in a similar behavior (Fig. 5(b)). Aswith the 0:3 �m thick membranes, all 0:5 �m thick specimens show a clearly de-nedelastic region with a Young’s modulus of 53–55 GPa. Membrane widths of 2.5, 5, and10 �m exhibit nearly identical behavior as in the case of 0:3 �m thick specimens. Yieldstress also matched the values of the thinner specimens with 220 MPa for 2:5 �m widemembrane and 170 MPa for 5 and 10 �m wide membranes. The 20 �m wide membraneshowed a marked decrease in the onset of plastic 8ow. Its stress–strain signature fallsbelow the others exhibiting a lower yield stress of 140 MPa.
The 1 �m thick thin -lm specimens exhibited distinctly di'erent deformation andfailure behavior while preserving the feature of a decrease in yield stress with in-crease in specimen width. Fig. 5(c) shows the stress–strain curves for this thickness.A signi-cant change in mechanical behavior occurs as the membranes begin to deformplastically. The failure is not a sharp and abrupt loss in load carrying capacity, butrather a gradual decrease in nominal stress with increase in deformation. The gold -lmultimately fails with a sharp drop in load carrying capacity but after signi-cant dropin the nominal stress. Also present are the appearance of sharp undulations in stressthat resemble L:uders band e'ects observed in the deformation of some bulk materials,indicative of plastic yielding occurring in a discrete manner. This post-peak plasticbehavior signi-cantly di'ers from that observed in the thinner membranes, which ex-hibited strain hardening followed by sharp brittle-like rupture. It should be noted thatin all cases the failure strain is below 1%.
Young’s modulus for the 1 �m thick specimens was found to be 53–55 GPa, con-sistent with the 0.3 and 0:5 �m thick specimens. However, values of yield stress weresigni-cantly lower than in the thinner -lms and varied to some extent with width,although, not as signi-cantly as in the case of thinner -lms. At a width of 2:5 �m theyield stress was only 90 MPa and decreased to 65 MPa for the 5 �m wide specimensand then to 55 MPa for 10 and 20 �m wide specimens.
An issue to be considered when interpreting these results is the experimentallyapplied strain rate. As previously mentioned, strain rate is a function of membranehalf-length, which is slightly di'erent for membranes of di'erent width; thus, the cor-responding applied strain rate is di'erent for each membrane width. The summary ofyield stress data reported in Table 2 includes the strain rate at the onset of plasticity. It
H.D. Espinosa et al. / J. Mech. Phys. Solids 52 (2004) 667–689 677
is seen that yield stress changes little with strain rate, case in point being the 0:3 �mthick specimens. Therefore, the moderate di'erence in strain rate between specimensof di'erent width is not considered to greatly a'ect the yielding behavior.
These results clearly indicate that specimen width does have a mild in8uence on-lm strength. As it will be shown later, the measured variation in yield stress withspecimen width is slightly larger than the data scatter identi-ed by repeating the teston -ve identically sized specimens. In the case of decreasing membrane width, it isclear that the number of grains contained in that width, especially when it falls belowabout 10 grains, directly a'ect the onset of plastic yielding. The more grains, the lowerthe yield stress. This could result from geometric constraints in deformation mecha-nisms and from strong statistical e'ects associated to the small number of grains, i.e.,fewer dislocation sources. Membrane thickness also plays a major role in deformationbehavior. In the plots presented thus far, it is a little cumbersome to directly observethickness e'ects. The next section re-examines the data by plotting thickness data formembranes of equal width.
3.3. Thickness e6ects
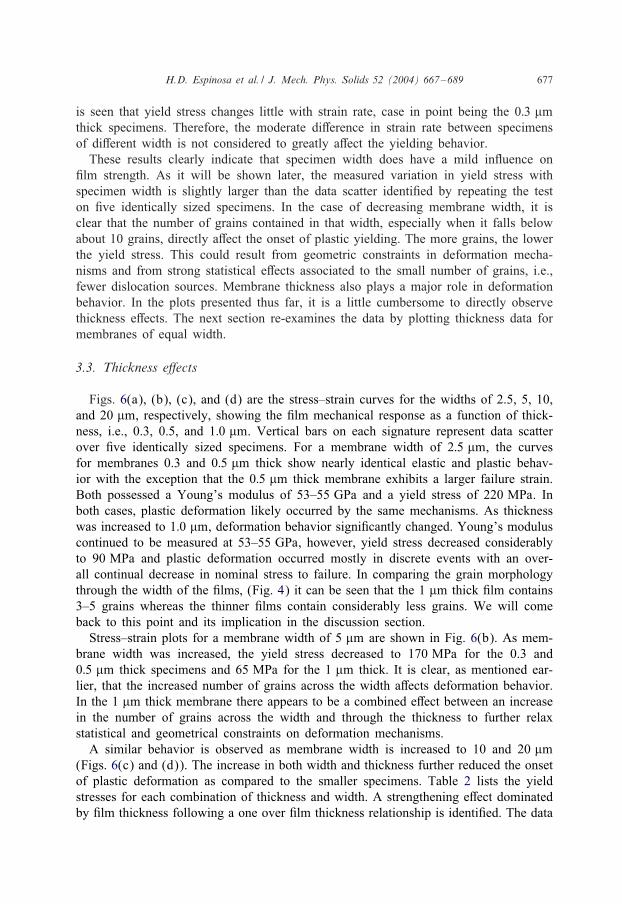
Figs. 6(a), (b), (c), and (d) are the stress–strain curves for the widths of 2.5, 5, 10,and 20 �m, respectively, showing the -lm mechanical response as a function of thick-ness, i.e., 0.3, 0.5, and 1:0 �m. Vertical bars on each signature represent data scatterover -ve identically sized specimens. For a membrane width of 2:5 �m, the curvesfor membranes 0.3 and 0:5 �m thick show nearly identical elastic and plastic behav-ior with the exception that the 0:5 �m thick membrane exhibits a larger failure strain.Both possessed a Young’s modulus of 53–55 GPa and a yield stress of 220 MPa. Inboth cases, plastic deformation likely occurred by the same mechanisms. As thicknesswas increased to 1:0 �m, deformation behavior signi-cantly changed. Young’s moduluscontinued to be measured at 53–55 GPa, however, yield stress decreased considerablyto 90 MPa and plastic deformation occurred mostly in discrete events with an over-all continual decrease in nominal stress to failure. In comparing the grain morphologythrough the width of the -lms, (Fig. 4) it can be seen that the 1 �m thick -lm contains3–5 grains whereas the thinner -lms contain considerably less grains. We will comeback to this point and its implication in the discussion section.
Stress–strain plots for a membrane width of 5 �m are shown in Fig. 6(b). As mem-brane width was increased, the yield stress decreased to 170 MPa for the 0.3 and0:5 �m thick specimens and 65 MPa for the 1 �m thick. It is clear, as mentioned ear-lier, that the increased number of grains across the width a'ects deformation behavior.In the 1 �m thick membrane there appears to be a combined e'ect between an increasein the number of grains across the width and through the thickness to further relaxstatistical and geometrical constraints on deformation mechanisms.
A similar behavior is observed as membrane width is increased to 10 and 20 �m(Figs. 6(c) and (d)). The increase in both width and thickness further reduced the onsetof plastic deformation as compared to the smaller specimens. Table 2 lists the yieldstresses for each combination of thickness and width. A strengthening e'ect dominatedby -lm thickness following a one over -lm thickness relationship is identi-ed. The data
678 H.D. Espinosa et al. / J. Mech. Phys. Solids 52 (2004) 667–689
0
50
100
150
200
250
300
350
400
0 0.002 0.004 0.006 0.008 0.01
t = 0.3 µmt = 0.5 µmt = 1.0 µm
Str
ess (
MP
a)
Strain
width = 2.5 microns
0
50
100
150
200
250
300
350
400
0 0.002 0.004 0.006 0.008 0.01
t = 0.3 µmt = 0.5 µmt = 1.0 µm
Str
ess (
MP
a)
Strain
width = 5.0 microns
0
50
100
150
200
250
300
350
400
0 0.002 0.004 0.006 0.008 0.01
t = 0.3 µmt = 0.5 µmt = 1.0 µm
Str
ess (
MP
a)
Strain
width = 10.0 microns
0
50
100
150
200
250
300
350
400
0 0.002 0.004 0.006 0.008 0.01
t = 0.3 µmt = 0.5 µmt = 1.0 µm
Str
ess (
MP
a)
Strain
width = 20.0 microns
(a) (b)
(c) (d)
Fig. 6. Stress–strain plots comparing -lm thickness (0.3, 0.5, and 1:0 �m thick) for Au membrane widthsof 2.5 (a), 5.0 (b), 10.0 (c), and 20:0 �m (d). The slope of the dashed line in each plot is approximately53–55 GPa. The vertical bars on each signature represent the data scatter over -ve identically sized mem-branes. Also note the limited -lm ductility with values of failure strain below 1%.
indicate the existence of two behavioral regimes with thickness or width e'ects actingindependently or in combination. The -rst regime is where membrane dimensions aretheir smallest, width=2:5 �m and thickness=0:3 �m. Here, the onset of plastic yieldingis the highest with the grain morphology across the membrane’s width consisting of8–10 grains and 1–2 grains through the thickness (Fig. 4). It is clear that such smallnumbers of grains restrict the number of dislocation sources and number of dislocationmotion paths available as well as the probability for intragranular deformation processesto occur. Because so few grains span the thickness and width, the sources of plasticdeformation are reduced resulting in -lm strengthening.
The second behavioral regime exists at the upper end of the membrane dimensions,width = 20 �m and thickness = 1:0 �m. Here, the onset of plastic yielding is the lowest
H.D. Espinosa et al. / J. Mech. Phys. Solids 52 (2004) 667–689 679
with the grain structure consisting of approximately 66–80 grains across the widthand 4–5 grains through the thickness (Fig. 4). This assemblage of grains is beginningto approach the dimensions of a representative volume element for a polycrystallinematerial; hence, the reduced yield point is the result of the availability of more degreesof freedom for deformation mechanisms to occur. Of the two-dimensional changes,increasing the thickness above 0:5 �m appears to have the greatest e'ect in reducingyield strength, although, both appear to be acting simultaneously by their respectivemechanisms. It is not clear if the lowest yield stress in this regime describes the bulkpolycrystalline behavior or is merely still within the transitional regime. Thicker -lmsneed to be examined to elucidate this point.
Strain rate is not considered an issue when comparing membranes of di'erent thick-ness since the specimens being compared have identical shape, i.e., same membranehalf-length and width, and, therefore, identical straining history. Although the resultsreported in Table 2 for specimens of identical thickness indicate that the onset of plas-ticity occurred at slightly di'erent strain rates, they should only be interpreted as thestrain rate at which �y is being measured. The strain rate di'erences are not largeenough for strain rate e'ects to be identi-ed. This is a topic that is left for futureinvestigation.
Given that all membranes of varying size and shape behave identically in the elasticregion it is clear that the specimen size has a major e'ect only on -lm plasticity andstrengthening. It is interesting to note that Young’s modulus was consistently mea-sured at 53–55 GPa regardless of membrane dimension and for more than 100 testedmembranes. This value is signi-cantly lower than the value of 78 GPa for bulk Au;however, values reported for thin -lm Au varied from 30 to 78 GPa (Nix, 1989). Sincethe -lms exhibit a strong 〈1 1 1〉 texture a low modulus may result from di'erences inmoduli along di'erent directions. For instance, E〈1 1 1〉 = 117 GPa and E〈1 0 0〉 = 43 GPa,which shows the wide degree of elastic anisotropy in Au (Courtney, 1990). Thus,with 〈1 1 1〉 primarily normal to the -lm surface, the measured 53–55 GPa modulusseems realistic. Given the 〈1 1 1〉 texture, one would expect that the measured Young’smodulus would be consistent with calculations of the lower bound estimate (Reuss) inthis plane, which yields an average modulus of 81 GPa (Corcoran, 2002). However,this estimate is signi-cantly larger than the experimental value. The di'raction data inFig. 3 shows a strong 〈1 1 1〉 texture, but with a fair mix of other orientations. Clearly,the lower modulus measured in the experiments is an indication of the importance ofgrain orientation distribution.
3.4. Results from other FCC metals
The MDE methodology was applied to test other FCC metals, namely Cu and Al.The main feature that separates these two metals from Au, is that each possesses anative oxide surface -lm under ambient conditions. Work by Saif et al. (2002) hasshown that for submicron thick Al -lms this layer has no e'ect on the elastic properties.However, it is expected to play a role in plastic deformation by acting as a barrier todislocations reaching the surface (Nix, 1989).
680 H.D. Espinosa et al. / J. Mech. Phys. Solids 52 (2004) 667–689
0
100
200
300
400
500
600
700
800
0 0.004 0.008 0.012
w = 20 µmw = 10 µmw = 5 µm
Str
ess
(MP
a)
Strain
0
50
100
150
200
250
300
0 0.01 0.02 0.03 0.04 0.05 0.06 0.07
w = 20 µmw = 10 µmw = 5 µm
Str
ess
(MP
a)Strain
0
100
200
300
400
500
600
700
800
0 0.005 0.01 0.015
t = 1.0 µmt = 0.2 µm
Str
ess
(MP
a)
Strain
50
100
150
200
250
300
350
400
0 0.005 0.01 0.015 0.02 0.025 0.03
t = 1.0 µmt = 0.2 µm
Str
ess
(MP
a)
Strain
Copper
Copper
Aluminum
Aluminum
(b)
(a)
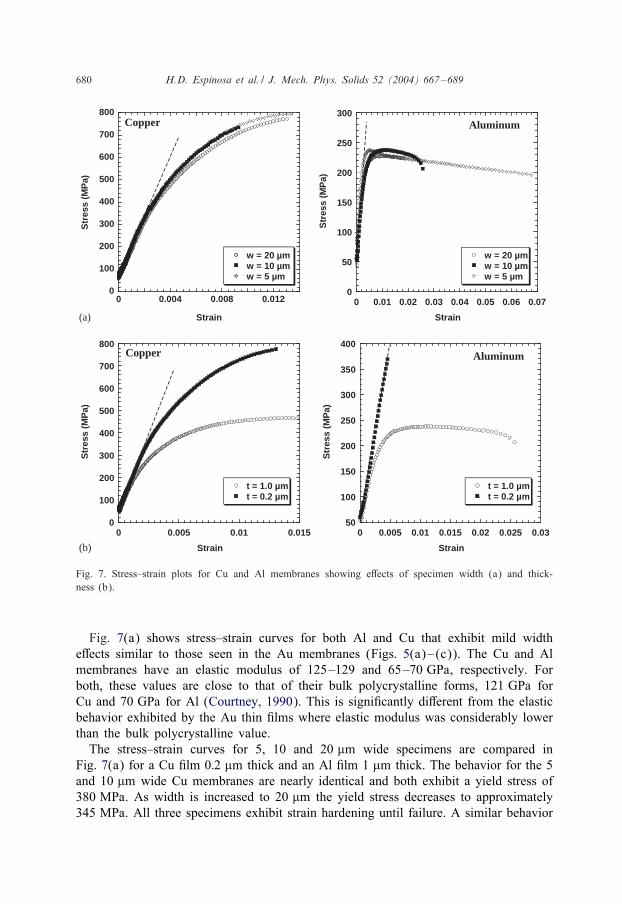
Fig. 7. Stress–strain plots for Cu and Al membranes showing e'ects of specimen width (a) and thick-ness (b).
Fig. 7(a) shows stress–strain curves for both Al and Cu that exhibit mild widthe'ects similar to those seen in the Au membranes (Figs. 5(a)–(c)). The Cu and Almembranes have an elastic modulus of 125–129 and 65–70 GPa, respectively. Forboth, these values are close to that of their bulk polycrystalline forms, 121 GPa forCu and 70 GPa for Al (Courtney, 1990). This is signi-cantly di'erent from the elasticbehavior exhibited by the Au thin -lms where elastic modulus was considerably lowerthan the bulk polycrystalline value.
The stress–strain curves for 5, 10 and 20 �m wide specimens are compared inFig. 7(a) for a Cu -lm 0:2 �m thick and an Al -lm 1 �m thick. The behavior for the 5and 10 �m wide Cu membranes are nearly identical and both exhibit a yield stress of380 MPa. As width is increased to 20 �m the yield stress decreases to approximately345 MPa. All three specimens exhibit strain hardening until failure. A similar behavior
H.D. Espinosa et al. / J. Mech. Phys. Solids 52 (2004) 667–689 681
is observed in the Al membranes having the same width but a thickness of 1 �m. Here,the yield stress is about 205 MPa for all membranes. Small variations in yield stressare observed but they fall within the data scatter. The post-yield behavior exhibited bythe Al membranes is quite di'erent (see Fig. 7(a) right).
The yield stress in Cu and Al membranes also exhibits strong thickness e'ects.Fig. 7(b) shows stress–strain curves for Cu and Al membranes 0.2 and 1:0 �m thick.For Cu, the yield stress more than doubles from about 160 MPa to approximately345 MPa when thickness is decreased from 1 to 0:2 �m. Al also exhibits a similar be-havior, however the 0:2 �m membranes show no evidence of plastic deformation andfail in a completely brittle manner. The yield stress of 1 �m membranes was approx-imately 150 MPa and the failure stress of the 0:2 �m membranes was approximately375 MPa. Since the native oxide layer composes a larger portion of the cross-sectionalarea in the thinner membrane, the observed brittle behavior may be the result of brit-tle failure of the SiO2 layer, which in turn may trigger inhomogeneous deformationand failure in the Al -lm. Prorok and Espinosa (2002) performed experiments on Aumembranes intentionally passivated by nanometer layers of SiO2. Their work showsthat passivation may have the e'ect of reducing the ductility and strength of the -lmdue to deposition induced residual stress and cracking of the passivation layer followedby localized plastic deformation of the -lm.
In contrast to the softening behavior observed in Au -lms of identical thickness,the 1 �m thick membranes of both Cu and Al showed deformation to occur in auniform manner until failure occurs. The cause of these di'erences in deformation isnot apparent requiring additional investigation of grain morphology, texture, disloca-tion structures, etc. A complete characterization of the -lms by X-ray and electronmicroscopy will be performed and reported in a future publication.
3.5. Necking and fracture observations
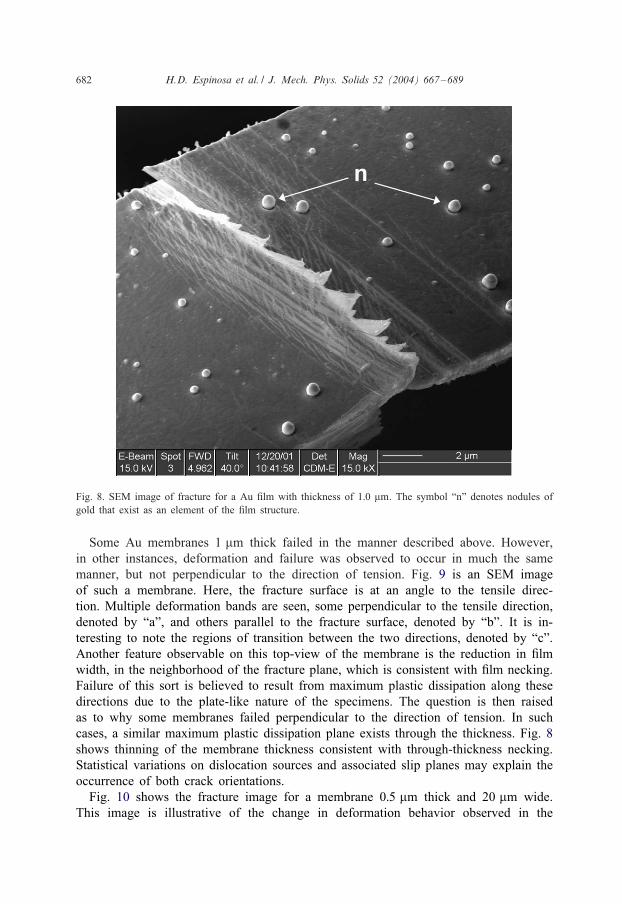
Fig. 8 is an SEM image of a Au membrane, 1:0 �m thick and 20 �m wide, whichwas stressed until failure. The image shows that the left half of the membrane slightlyoverlaps the right half. Several features are apparent. Multiple striations or deformationbands are seen near the failure region. They run in a direction perpendicular to thetensile load. These are regions where discrete permanent deformation has occurred onthe surface of the -lm and may be correlated to the jogs seen in the stress–strain curves.Bands of this sort are seen in bulk materials during the development of texture withdeformation (Brown, 1972). They are described as regions where grains slightly rotateto another orientation to accommodate an applied strain. Likewise, shear localization insingle crystals and metallic glasses has lead to similar surface features. The formationof multiple bands is a clear indication that the membrane was uniformly loaded. Thefailure of the membrane can easily be described as ductile in nature. Along the fracturesurface, which is perpendicular to the tensile direction but at an angle through thethickness, as observed by TEM imaging of cross sections, the gold appears to haveundergone large localized plastic deformation with ductile like -ngers in the stretchingdirection. Other observable features are nodules of gold on the -lms surface, whichwill be discussed later.
682 H.D. Espinosa et al. / J. Mech. Phys. Solids 52 (2004) 667–689
Fig. 8. SEM image of fracture for a Au -lm with thickness of 1:0 �m. The symbol “n” denotes nodules ofgold that exist as an element of the -lm structure.
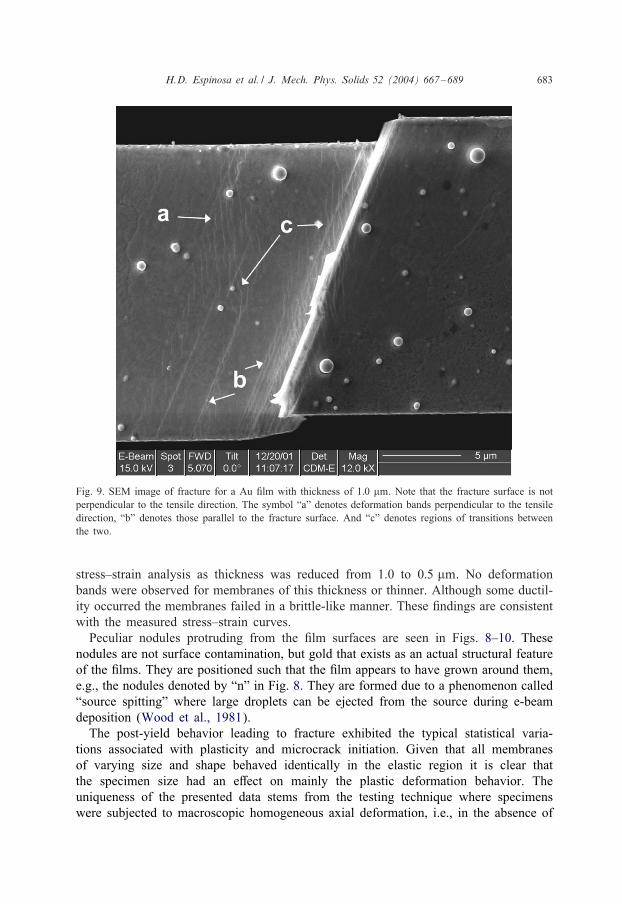
Some Au membranes 1 �m thick failed in the manner described above. However,in other instances, deformation and failure was observed to occur in much the samemanner, but not perpendicular to the direction of tension. Fig. 9 is an SEM imageof such a membrane. Here, the fracture surface is at an angle to the tensile direc-tion. Multiple deformation bands are seen, some perpendicular to the tensile direction,denoted by “a”, and others parallel to the fracture surface, denoted by “b”. It is in-teresting to note the regions of transition between the two directions, denoted by “c”.Another feature observable on this top-view of the membrane is the reduction in -lmwidth, in the neighborhood of the fracture plane, which is consistent with -lm necking.Failure of this sort is believed to result from maximum plastic dissipation along thesedirections due to the plate-like nature of the specimens. The question is then raisedas to why some membranes failed perpendicular to the direction of tension. In suchcases, a similar maximum plastic dissipation plane exists through the thickness. Fig. 8shows thinning of the membrane thickness consistent with through-thickness necking.Statistical variations on dislocation sources and associated slip planes may explain theoccurrence of both crack orientations.
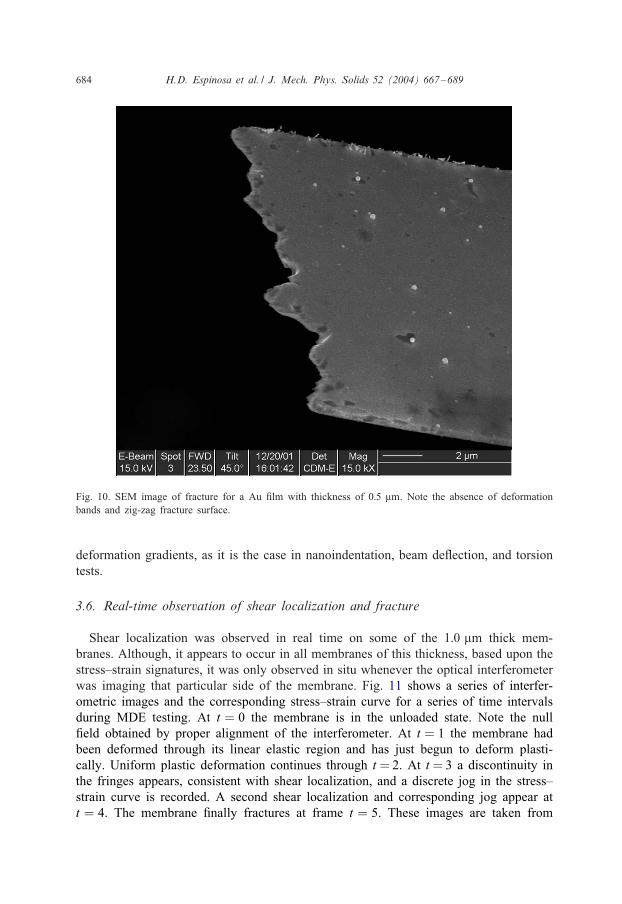
Fig. 10 shows the fracture image for a membrane 0:5 �m thick and 20 �m wide.This image is illustrative of the change in deformation behavior observed in the
H.D. Espinosa et al. / J. Mech. Phys. Solids 52 (2004) 667–689 683
Fig. 9. SEM image of fracture for a Au -lm with thickness of 1:0 �m. Note that the fracture surface is notperpendicular to the tensile direction. The symbol “a” denotes deformation bands perpendicular to the tensiledirection, “b” denotes those parallel to the fracture surface. And “c” denotes regions of transitions betweenthe two.
stress–strain analysis as thickness was reduced from 1.0 to 0:5 �m. No deformationbands were observed for membranes of this thickness or thinner. Although some ductil-ity occurred the membranes failed in a brittle-like manner. These -ndings are consistentwith the measured stress–strain curves.
Peculiar nodules protruding from the -lm surfaces are seen in Figs. 8–10. Thesenodules are not surface contamination, but gold that exists as an actual structural featureof the -lms. They are positioned such that the -lm appears to have grown around them,e.g., the nodules denoted by “n” in Fig. 8. They are formed due to a phenomenon called“source spitting” where large droplets can be ejected from the source during e-beamdeposition (Wood et al., 1981).
The post-yield behavior leading to fracture exhibited the typical statistical varia-tions associated with plasticity and microcrack initiation. Given that all membranesof varying size and shape behaved identically in the elastic region it is clear thatthe specimen size had an e'ect on mainly the plastic deformation behavior. Theuniqueness of the presented data stems from the testing technique where specimenswere subjected to macroscopic homogeneous axial deformation, i.e., in the absence of
684 H.D. Espinosa et al. / J. Mech. Phys. Solids 52 (2004) 667–689
Fig. 10. SEM image of fracture for a Au -lm with thickness of 0:5 �m. Note the absence of deformationbands and zig-zag fracture surface.
deformation gradients, as it is the case in nanoindentation, beam de8ection, and torsiontests.
3.6. Real-time observation of shear localization and fracture
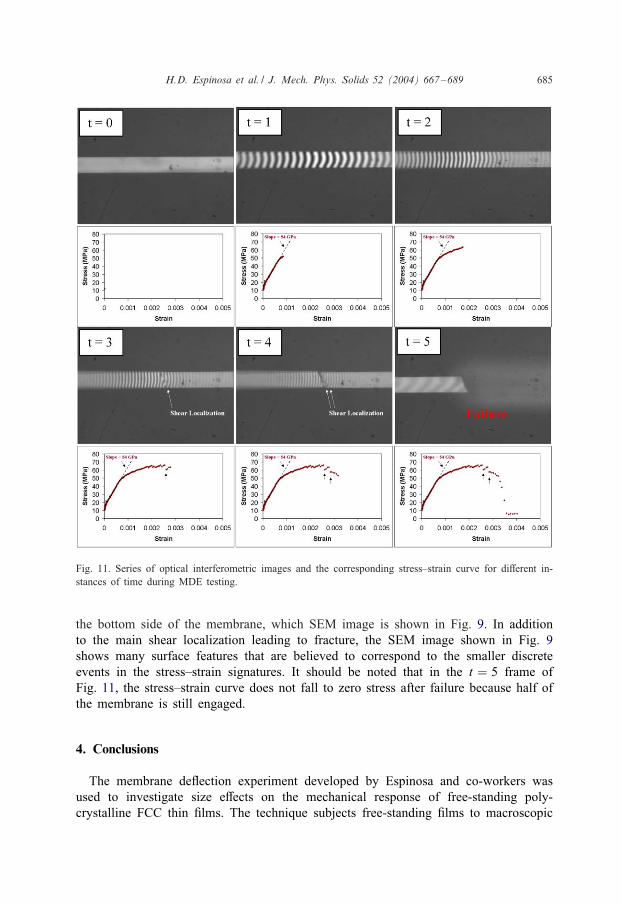
Shear localization was observed in real time on some of the 1:0 �m thick mem-branes. Although, it appears to occur in all membranes of this thickness, based upon thestress–strain signatures, it was only observed in situ whenever the optical interferometerwas imaging that particular side of the membrane. Fig. 11 shows a series of interfer-ometric images and the corresponding stress–strain curve for a series of time intervalsduring MDE testing. At t = 0 the membrane is in the unloaded state. Note the null-eld obtained by proper alignment of the interferometer. At t = 1 the membrane hadbeen deformed through its linear elastic region and has just begun to deform plasti-cally. Uniform plastic deformation continues through t = 2. At t = 3 a discontinuity inthe fringes appears, consistent with shear localization, and a discrete jog in the stress–strain curve is recorded. A second shear localization and corresponding jog appear att = 4. The membrane -nally fractures at frame t = 5. These images are taken from
H.D. Espinosa et al. / J. Mech. Phys. Solids 52 (2004) 667–689 685
Fig. 11. Series of optical interferometric images and the corresponding stress–strain curve for di'erent in-stances of time during MDE testing.
the bottom side of the membrane, which SEM image is shown in Fig. 9. In additionto the main shear localization leading to fracture, the SEM image shown in Fig. 9shows many surface features that are believed to correspond to the smaller discreteevents in the stress–strain signatures. It should be noted that in the t = 5 frame ofFig. 11, the stress–strain curve does not fall to zero stress after failure because half ofthe membrane is still engaged.
4. Conclusions
The membrane de8ection experiment developed by Espinosa and co-workers wasused to investigate size e'ects on the mechanical response of free-standing poly-crystalline FCC thin -lms. The technique subjects free-standing -lms to macroscopic
686 H.D. Espinosa et al. / J. Mech. Phys. Solids 52 (2004) 667–689
homogeneous axial deformation in a simple con-guration. Measured stress–strain re-sponses allow identi-cation of -lm Young’s modulus, onset of plastic deformationand fracture stress. Young’s modulus was consistently measured at 53–55 GPa for Auspecimens, 125–129 GPa for Cu specimens and 65–70 GPa for Al specimens. Measure-ments revealed that -lm width and thickness have an e'ect on yield stress. Althoughboth dimensional parameters exhibited size e'ects, thickness, by far, had the greateste'ect with a major transition in deformation behavior occurring when thickness wasdecreased from 1.0 to 0:5 �m. A strengthening size scale of one over the -lm thicknessis identi-ed. It should be noted that the mis-t dislocation strengthening mechanism isnot present in free-standing unpassivated Au -lms. Therefore, our -ndings constitutedirect evidence of the existence of a strengthening mechanism other than the one aris-ing from mis-t dislocations. This -nding is consistent with the work by Venkatramanand Bravman (1992), and reinforces their observations. Another important experimen-tal result is the limited ductility exhibited by the -lms with strains to failure below1% for the case of Au. This is attributed to a reduction in the degrees of freedom forplastic deformation to occur due to -lm texture and the small number of grains throughthe thickness, i.e., statistical e'ects associated to the existence of dislocation sources,associated slip systems, and number of dislocation motion paths. This argument is sup-ported by the experimental data. In Fig. 6, the stress–strain data for each -lm thicknessand width is plotted as an average of -ve experiments. Vertical bars represent the scat-ter of the data. Examination of this data reveals that scatter increases with the increasein thickness, i.e., with increase in plasticity activity within the specimen.
The implication of these -ndings is very important and raises a fundamental ques-tion, what yield stress should we use in the design of microelectronics and MEMSdevices? Certainly, the importance of -lm deposition technique, substrate and thermalhistory has long been recognized to play a key role on -lm mechanical properties.Here we show that even when substrate and microfabrication processes are maintainedconstant, signi-cant size e'ects arise in the absence of macroscopic strain gradients andpassivation layers. We attribute the measured e'ect to material microstructural e'ects,e.g., texture, grain size, and in particular to the statistics of defects sources. Whilethe size e'ects here reported are structure dependent, the experimental data capturesthe discreteness of plastic events in small volumes of material. It is postulated thatdislocation mechanics in its discrete form can explain the experimental -ndings andpredict the observed structural size scale relationship.
Further investigations on size e'ects should be pursued and a comparison of variousdeposition techniques and substrate e'ects on -lm growth identi-ed. In this study, wehave grown gold, copper and aluminum -lms by means of e-beam evaporation on aSi3N4 -lm. Other possibilities include sputtering, electrodeposition, etc. By varying thematerial microstructure systematically, further insight into its e'ects on the size depen-dent plasticity phenomenon could be obtained. Clearly, extensive -lm microstructurecharacterization would be needed to draw meaningful conclusions. Another key featurethat needs further investigation is the e'ect of strain rates. Sakai et al. (1999) foundthat at room temperature, nanocrystalline gold with a grain size between 20 and 60 nmmay exhibit creep. All of the tests reported in this work were performed at a strainrate in the regime of 1:0 × 10−5 s−1 at room temperature.
H.D. Espinosa et al. / J. Mech. Phys. Solids 52 (2004) 667–689 687
The results reported here shed new light on deformation behavior of free-standingpolycrystalline FCC thin -lms in the submicron regime. Analytical and computationalstudies are required to better understand the fundamental deformation mechanisms,particularly the mechanics of dislocation generation, motion, and interactions and thecompetition between inter- and intragranular deformation processes. These can be in-vestigated through (meso) grain simulations including discrete dislocation con-gura-tions such that the role of lattice-rotation, dislocation-surface, dislocation-dislocation,dislocation-grain boundary, and dislocation-twin interactions is accounted for. Suchstudies will only become meaningful upon availability of a full characterization of thethin -lm morphology, texture and initial imperfections.
Acknowledgements
This work was sponsored by the National Science Foundation under Career AwardNo. CMS-9624364 and the OUce of Naval Research YIP through Award No. N00014-97-1-0550. Work was also supported in part by the Nanoscale Science and EngineeringInitiative of the National Science Foundation under NSF Award Number EEC-0118025.Microscopy was carried out in the Center for Microanalysis of Materials, Universityof Illinois, which is partially supported by the U.S. Department of Energy under grantDEFG02-96-ER45439.
References
Aifantis, E.C., 1992. On the role of gradients in the locations of deformation and fracture. Int. J. Eng. Sci.30, 1279–1299.
Arzt, E., 1998. Size e'ects in materials due to microstructural and dimensional constraints: a comparativereview. Acta Metall. Mater. 46, 5611–5626.
Atkinson, M., 1995. Further analysis of the size e'ect in indentation hardness tests of some metals. J. Mater.Res. 10, 2908–2915.
Bazant, Z., Guo, Z., 2001. Size e'ect asymptotic matching approximations in strain-gradient theories ofmicroscale plasticity. Int. J. Solids Struct. 39, 5633–5657.
Beck, P.A., Kremer, J.C., Demar, L.J., Holzworth, M.L., 1948. Microstructure and grain growth of thin -lms.Metall. Trans. 175, 372–384.
Begley, M.R., Hutchinson, J.W., 1998. The mechanics of size-dependent indentation. J. Mech. Phys. Solids46, 2049–2068.
Blicharski, M., Gorczyca, S., 1978. Structural inhomogeneity of deformed austenitic stainless steel. Met. Sci.12, 303–312.
Borodkina, M.M., Orekhova, T.S., 1982. On mechanism of cubic texture formation in materials with FCClattice. Fiz. Met. I Metalloved. 54, 1204–1207.
Brown, K., 1972. Role of deformation and shear banding in the stability of the rolling textures of aluminumand an Al–0.8% Mg alloy. J. Inst. Met. 100, 341–345.
Corcoran, S., 2002. Personal communication.Courtney, T.H., 1990. Mechanical Behavior of Materials. McGraw-Hill, New York, p. 60.Doerner, M.F., Gardner, D.S., Nix, W.D., 1986. Plastic properties of thin -lms on substrates as measured
by submicron indentation hardness and substrate curvature techniques. J. Mater. Res. 1, 845–851.
688 H.D. Espinosa et al. / J. Mech. Phys. Solids 52 (2004) 667–689
Espinosa, H.D., Prorok, B.C., 2001a. Size e'ects of the mechanical behavior of this gold -lms. Proceedingsof the Symposium on Mechanical Properties of MEMS Structures, the 2001 International MechanicalEngineering Congress in New York, New York, November 11–16.
Espinosa, H.D., Prorok, B.C., 2001b. E'ects of -lm thickness on the yielding behavior of polycrystallinegold -lms. Mater. Res. Soc. Symp. Proc. 688, 365–372.
Espinosa, H.D., Fischer, M., Zhu, Y., Lee, S., 2001a. 3-D computational modeling of RF MEMS switches.In: Laudon, M., Romanowicz, B. (Eds.), Proceedings of the Fourth International Conference on Modelingand Simulation of Microsystems, pp. 402–406.
Espinosa, H.D., Prorok, B.C., Fischer, M., 2001b. A novel experimental technique for testing thin -lms andMEMS materials. Proceedings of the SEM Annual Conference on Experimental and Applied Mechanics,June 4–6, 2001, Portland, Oregon, pp. 446–469.
Espinosa, H.D., Prorok, B.C., Fischer, M., 2003. A novel method for measuring elasticity, plasticity, andfracture of thin -lms and MEMS materials. J. Mech. Phys. Solids 51, 47–67.
Fleck, N.A., Hutchinson, J.W., 1993. A phenomenological theory for strain gradient e'ects in plasticity.J. Mech. Phys. Solids 41, 1825–1857.
Fleck, N.A., Hutchinson, J.W., 1997. Strain gradient plasticity. Adv. Appl. Mech. 33, 295–361.Fleck, N.A., Muller, G.M., Ashby, M.F., Hutchinson, J.W., 1994. Strain gradient plasticity: theory and
experiment. Acta Metall. Mater. 42, 475–487.Gao, H., Huang, Y., Nix, W.D., Hutchinson, J.W., 1999a. Mechanism-based strain gradient plasticity—I.
Theory. J. Mech. Phys. Solids 47, 1239–1263.Gao, H., Huang, Y., Nix, W.D., 1999b. Modeling plasticity at the micrometer scale. Naturwissenschaften
86, 507–515.Goken, M., Kempf, M., Bordenet, M., Vehoof, H., 1999. Microstructural properties of superalloys investigated
by nanoindentations in an atomic force microscope. Acta Mater. 47, 1043–1052.Grant, E.M., Hansen, N., Jensen, D.J., Ralph, B., Stobbs, W.M., 1988. Texture development during grain
growth in thin -lms. In: Kallend, J.S., Gottstein, G. (Eds.), Proceedings of the Eighth InternationalConference on Texture of Materials. Springer-Verlag, New York, pp. 711–716.
Harris, K.E., King, A.H., 1994. Localized texture formation and its detection in polycrystalline thin -lms ofgold. Mater. Res. Soc. Symp. Proc. 317, 425–430.
Harris, K.E., King, A.H., 1998. Direct observation of di'usional creep via TEM in polycrystalline thin -lmsof gold. Acta Mater. 46, 6195–6203.
Huang, Y., Gao, H., Nix, W.D., Hutchinson, J.W., 2000. Mechanism-based strain gradient plasticity—II.Analysis. J. Mech. Phys. Solids 48, 99–128.
Hull, D., Bacon, D.J., 1984. Introduction to Dislocations, 3rd Edition. Pergamon, Oxford.Hutchinson, J.W., 2000. Plasticity at the micron scale. Int. J. Solids Struct. 37, 225–238.Lejeck, P., Sima, V., 1983. Orientational relationships in the secondary recrystallization of pure nickel. Mater.
Sci. Eng. 60, 121–124.Ma, Q., Clark, D.R., 1995. Size dependent hardness of silver single crystals. J. Mater. Res. 10, 853–863.McElhaney, K.W., Vlassak, J.J., Nix, W.D., 1998. Determination of indenter tip geometry and indentation
contact area of depth-sensing indentation experiments. J. Mater. Res. 13, 1300–1306.Mullins, W.W., 1958. Growth kinetics and morphology of thin -lms. Acta Metall. Mater. 6, 414–420.Nix, W.D., 1989. Mechanical properties of thin -lms. Metall. Trans. A 20, 2217–2245.Nix, W.D., 1997. Elastic and plastic properties of thin -lms on substrates. Mater. Sci. Eng. A 234–236,
37–44.Nix, W.D., Gao, H., 1998. Indentation size e'ects in crystalline materials: a law for strain gradient plasticity.
J. Mech. Phys. Solids 46, 411–425.Nourbakhsh, S., Nutting, J., 1980. The high strain deformation of an aluminium–4% copper alloy in the
supersaturated and aged conditions. Acta Metall. 28, 357–365.Nourbakhsh, S., Nutting, J., 1982. Structure and properties of quenched and aged Cu–2Be after deformation
to large strains. Met. Sci. 16, 323–331.
H.D. Espinosa et al. / J. Mech. Phys. Solids 52 (2004) 667–689 689
Poole, W.J., Ashby, M.F., Fleck, N.A., 1996. Micro-hardness of annealed and work-hardened copperpolycrystals. Scr. Metall. Mater. 34, 564–599.
Prorok, B.C., Espinosa, H.D., 2002. E'ects of nanometer thick passivation layers on the mechanical responseof thin gold -lms. J. Nanosci. Nanotechnol. 2, 1–7.
Saif, M.T.A., Zhang, S., Haque, A., Hsia, K.J., 2002. E'ect of native Al2O3 on the elastic response ofnanoscale Al -lms. Acta Mater. 50, 2779–2786.
Sakai, S., Tanimoto, H., Mizubayashi, H., 1999. Mechanical behavior of high-density nanocrystalline goldprepared by gas deposition method. Acta Mater. 47, 211–217.
Sanchez, J.E., Arzt, E., 1992. E'ects of grain orientation on hillock formation and grain growth in aluminum-lms on silicon substrates. Scr. Metall. 27, 285–290.
StKolken, J.S., Evans, A.G., 1998. A microbend test method for measuring the plasticity length scale. ActaMater. 46, 5109.
Thompson, C.V., 1993. The yield stress of polycrystalline thin -lms. J. Mater. Res. 8, 237–238.Venkatraman, R., Bravman, J.C., 1992. Separation of -lm thickness and grain boundary strengthening e'ects
in Al thin -lms on Si. J. Mater. Res. 8, 2040–2048.Venkatraman, R., Davies, P.W., Flinn, P.A., Fraser, D.B, Bravman, J.C., Nix, W.D., 1990. J. Electron Mater.
19, 1231.Weertman, J., Weertman, J.R., 1992. Elementary Dislocation Theory, 2nd Edition. Oxford University Press,
Oxford.Weiland, H., Dahlem-Klein, E., Fiszer, A., Bunge, H.J., 1988. Orientation distribution of grain size classes
in a grain growth texture. In: Kallend, J.S., Gottstein, G. (Eds.), Proceedings of the Eighth InternationalConference on Texture of Materials. Springer-Verlag, New York, pp. 717–724.
Wood, C.E.C., Rathbun, L., Ohno, H., DeSimone, D., 1981. On the origin and elimination of macroscopicdefects in -lms. J. Cryst. Growth 51, 299–303.