high resolution raman measurements of the temperature dependence of the phonon linewidth in lithium...
TRANSCRIPT

Chemical Physics 147 (1990) 155-163 North-Holland
High resolution Raman measurements of the temperature dependence of the phonon linewidth in lithium formate monohydrate crystals
M. Jordan, H.J. Jodl Fachbereich Physik, Universitlit Kaiserskwtem, 6750 ffiiserslautern, FRG
and
Max Maier NaturwissenschajSche Fakultdt II-Physiik, Universitdt Regensburg, 8400 Regensburg, FRG
Received 29 May 1990
Using a coupled interferometer-spectrometer with a resolution ~0.01 cm-’ we have measured the Raman linewidth and inte- grated intensities of some external modes (79 and 104 cm-’ A, modes, 76, 131 and 173 cm-’ A2 modes and 82, 113 and 163 cm-’ B, modes) and of the internal A, mode at 1372 cm-’ of lithium formate monohydrate in the temperature range IO-300 IC. This material is an efficient nonlinear crystal with interesting electrooptic properties and technical applications. The spontaneous Raman data were analyxed and interpreted in terms of phonon relaxation by three-phonon down and up pmcesses, which are described by the cubic anharmonicity of the interaction potential. The data were also used for the explanation of the temperature dependence of the threshold intensity for stimulated Raman scattering.
1. Imrollllctlon
Lithium formate monohydrate is an efficient non- linear crystal, in which second [ I,2 1, third [ 3 ] and fourth [ 41 harmonic generation has been observed. The crystal is pyre-electric [ 51 and p&o-electric [ 6 ] and has good electro-optic and strainoptic properties [ 6,7]. Large single crystals of good optical quality, which are transparent from the ultraviolet (250 nm) to the infrared region ( 1.2 pm ), can be grown from an aqueous solution [ 6,s 1. The threshold intensity for optical damage of the surface has been measured tobehigh (> 2GW/cm2) [9].
Recently, stimulated Raman scattering (SRS) from lithium formate monohydrate crystals has been in- vestigated [ 91. SRS is interesting for the excitation of high population of optical phonons and for the generation of intense short IR and FIR light pulses from excited infrared active phonon modes. The threshold intensity of SRS was measured in lithium formate monohydrate crystals as a function of tem-
perature for different propagation directions in the crystal and different polarization of the laser light. For an interpretation of the stimulated Raman scattering spontaneous Raman data, linewidths and scattering cross sections, are required.
Inspite of the large number of investigations of spontaneous Raman scattering [ 10-l 31 in lithium formate monohydrate no linewidth data are avail- able. In addition, the needed temperature depen- dence of the Raman scattering cross section has not yet been measured in sufficient detail. Although Gal- zerani et al. [ 111 have presented propagation direo tions in the crystal and different laser light polariza- tions at 297, 90 and 5 R, they focused on the determination and interpretation of the frequencies of the about 90 Raman active modes.
Due to the lack of complete data of spontaneous Raman scattering the aim of the investigations pre- sented in this paper was primarily to determine line- widths with high spectral resolution (~0.01 cm-‘)
0301-0104/90/$03.50 6 1990 - Elsevier Science Publishers B.V. (North-Holland)
156 M. Jordan et al. /Raman measurements on lithium formate monohydrate crystals
and integrated intensities at temperatures from 10 to 300 K.
We studied in particular those modes which were observed recently in stimulated Raman scattering, the 76 cm-’ A2 mode, the 79 cm-’ yy A,(z) mode, the 104and1372cm-‘zzA,(z)modes,the82,113and 163 cm-’ Bi (x) modes.
In the course of our investigations, especially when we determined the true Raman linewidths and their homogeneous components r, for TFZ 0, we realized a systematic change in r, from 0.01 cm-’ to several cm-i with increasing frequencies of the phonon modes. Studying the literature (high resolution Ra- man spectra on CO* [ 14 1, on naphthalene [ 15 1, on anthracene [ 161 and on sodium nitrite [ 171) we found our high resolution Raman data on lithium formate monohydrate (LFMH) to be an excellent prototype study of temperature-dependent phonon relaxation mechanisms; our model confirms excel- lently the more general established theory of vibra- tional relaxation in molecular crystals by Califano and Schettino [ 18 1.
2. Theoretical backgronnd
The accurate temperature dependence of line- widths is nowadays a powerful quantity to classify vi- brational relaxation processes (see for general infor- mation ref. [ 18 ] ) : depopulation processes of phonon states via energy transfer, pure dephasing processes due to interaction with thermal bath phonon and scattering processes due to impurities and defects. This model is well tested for molecular crystals such as nitrogen, carbon dioxide, naphthalene and anthra- cene. Recently Becucci and Castelucci [ 17 ] applied this phonon relaxation model to NaN02 to explain the linewidth T( T) of external and internal modes in a manner we suggest useful to interpret our T( T) data: According to this theory the possible channels for phonon decay must obviously fulfill energy and wavevector conservation rules; data which are not known for our material LFMH in terms of dispersion curves or density of phonon states.
Our modes of interest have frequencies of less than 300 cm- ’ and am assigned to external modes; the one at 1372 cm-’ is instead an internal vibration related to the symmetrk stretch of O-C-O [ 111.
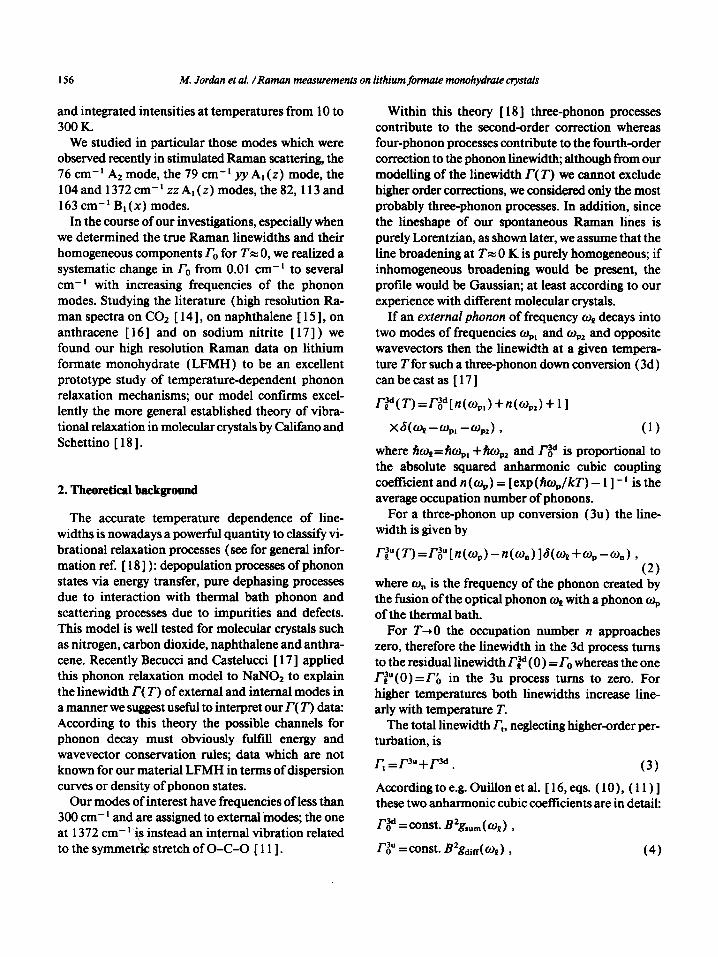
Within this theory [ 181 three-phonon processes contribute to the second-order correction whereas four-phonon processes contribute to the fourth-order correction to the phonon linewidti, although from our modelling of the linewidth r(T) we cannot exclude higher or&r corrections, we considered only the most probably three-phonon processes. In addition, since the lineshape of our spontaneous Raman lines is purely Lorentzian, as shown later, we assume that the line broadening at Tx 0 K is purely homogeneous; if inhomogeneous broadening would be present, the profile would be Gaussian; at least according to our experience with different molecular crystals.
If an external phonon of frequency op decays into two modes of frequencies w,, and o,, and opposite wavevectors then the linewidth at a given tempera- ture Tfor such a three-phonon down conversion (3d) canbecastas [17]
mw, -%, -qd 9 (1)
where fio,=ho,, +fiw,, and r,” is proportional to the absolute squared anharmonic cubic coupling coefficient and n ( wP) = [ exp ( AqJkT) - 1 ] - ’ is the average occupation number of phonons.
For a three-phonon up conversion (3~) the line- width is given by
(2) where o, is the frequency of the phonon created by the fusion of the optical phonon o, with a phonon o, of the thermal bath.
For T-r0 the occupation number n approaches zero, therefore the linewidth in the 3d process turns to the residual linewidth T,$’ ( 0 ) = l-” whereas the one T’P(O)=rb in the 3u process turns to zero. For higher temperatures both linewidths increase line- arly with temperature T.
The total linewidth T,, neglecting higher-order per- turbation, is
r =r3”+rM. t (3)
Accordingtoe.g.Ouillonetal. [16,eqs. (lo), (ll)] these two anharmonic cubic coefficients are in detail:
rzd =const. B2g,,,(on) , rp =const. B2g&C$) , (4)

M. Jo&n et al. /Raman measurements on lithium fwmat monohydrate ctyst& 157
where g,“,( on) is the two-phonon sum density of states at the frequency o+(R= 0) and gairr(& the two-phonon difference density of states. B is the cu- bic term of the crystal Hamiltonian coupling the three phononsop(r=O),o,,(R) ando,( -R) oro,( -A). The anharmonic coupling coefficient Bppll is directly related to the third derivative of the crystal potential with respect to normal coordinates Q,
(5)
(seefordetailsref. 1181). For the particular case of anthracene g,, and gM
are plotted in tig. 7 of ref. [ 16 1, revealing a tendency such that rzd and so r, is increasing with w, making 3d processes more probable, whereas r$‘, and so r&, is more or less constant with w.
Internal modes usually exhibit larger linewidths than external modes due to a larger number of possi- ble decay pathways available owing to their higher frequency. In some cases r(T) cannot be modelled by three-(or four-)phonon energy relaxation pro- cesses and dephasing mechanisms may be dominant; then the line broadening is caused by a modulation due to phonons of the thermal bath and no energy and wavevector conservation is required.
The final experimental value to be determined in our temperature studies is the cross section da/dQ or integrated intensity Ztit which is well known for the Stokes component in spontaneous RS,
Zi,t-wf(aala4)a(1+n), (6)
where wst is there the Stokes frequency (G,- asp= w,,), (aa/aq), the change in polarisability with respect to the suited normal coordinate at equilib- rium position; n the phonon occupation number which governs mainly the temperature dependence Of Ii,,. For a Lorentizian profile of the Raman line the integrated intensity Iin,, the linewidth r and the peak intensity I0 at the center frequency v. of the Raman line are related by
co
&nt = 10
I (v- vo)lP12+ 1 dv=rcZ,r/2. (7)
3. Experimental
The samples were grown, cut in x, y and z direc- tions and polished at surfaces in a manner described in detail elsewhere [ 91.
The cooling was achieved such that the sample (5X5X10 mm3), between thin indium films, was pressed via springs to the cold flange of a closed cycle helium cryostat. We determined the temperature at different points of the sample holder via calibrated Si diodes and we reached 11 K as lowest tempera- ture; the error in temperatures was < 1 K,
Using appropriate scattering geometries corre- sponding to the assignment proposed by Galzerani et al. [ 1 l] we studied the A, modes (79, 104, 1372 cm-‘) in backward scattering x[zz or yy]~, the A2 modes (76, 131, 173 cm-‘) and the B, modes (82, 113,163cm-I) the 90” scatteringgeometriesz[xy]x and z[xz]x, respectively. A conventional Raman spectrum of A2 modes is presented in fig. la.
High resolution Raman scattering was realized by a single mode Ar+ laser (linewidth 0.00 1 cm-‘, power 0.5 W), a conventional triple monochromator (res- olution ~0.5 cm-‘) in tandem with a standard tun- able Fabry-Perot interferometer FPI (our setup al- lows a resolution of 0.01 cm-’ ) and photo-electric registration in conjunction with a computer for data analysis. This idea - of improving the resolution by combining a Raman spectrograph with an interfero- meter - goes back to Pine and Tannenwald [ 191; meanwhile reinvented and slightly modified by oth- ers in the last 20 years. A specific Raman line was preselected in conventional manner (slitwidth z 5 cm-‘) and afterwards the free spectral range of the FPI, located before the monochromator, was swept mechanically by pressure. We used a pinhole of about 100 urn illuminating the FPI and/or selecting spots in the sample; typical instrumental finesse was 40 (see fig. 1 b ) . An interferogram of the A2 mode at 76 cm- ’ at 13 K is presented in fg lb.
Each Raman mode wp was measured several times at each temperature. The stability of the interfero- meter was controlled after each measurement. The true spontaneous Raman linewidth r was deter- mined from the measured width by deconvoluting the Raman profile (Lorentzian) with the instrumental function of FPI (Airy function). The error bars of an individual measurement ri at different Ti of mode w,

M. Jordan et al. /Roman measurements on lithium formate monohydrate crystals
LFMH
T=13K
(4
!!.I 100
Raman .Gfl [cm-‘] 200 250
0 0 0.5 1 .o 1.5
Wavenumber [cm-‘]
Fig. I. Spectra of external phonons of lithium formate monhy- drate. (a) Conventional Raman spectrum of the A2 components in z [ xy ]x scattering geometry. (b ) Interferogram of the A2 mode at 76 cm-’ at T= 13 K, in addition the instrumental function and free spectral range are shown (best fit to experiment by free spectral range of I .7 cm-‘, by finesse 40 yielding a resolution of 0.045 cm-‘).
are incorporated in ligs. 2 and 3, respectively. Of course, we systematically varied the instrumental function, such as modified Airy function for the com- bination pinhole and FPI, and we applied different deconvolution techniques known in the literature to minimize the error in linewidth.
The values of the frequency shifts of the Raman lines (tables 1 and 2 ) were measured against calibra- tion lines with an accuracy of ~0.5 cm-‘. It was planned to determine for each mode WR at each Ti both the linewidth ri and the integrated intensity Zi,,i si-
multaneously through the same arrangement. But due to several problems, such as the necessary exchange of plates in FPI, the mechanical motion of closed cycle cryostat etc., we executed separate runs for Z”i and Zhci. The intensity of each mode was measured therefore without FPI through the monochromator with open slits (see table 2 ) and was corrected via its apparatus function, yielding an accuracy better than 10%.
4. Discussion of results
4.1. Temperature dependence
The experimental values of the linewidths and in- tegrated intensities as a function of temperature are representatively displayed for two external modes (fig. 2) and for the vibron (fig. 3 ). The fitting pro- cedure was executed for the linewidth using eq. ( 1) in case of the three-phonon down process (solid line - d), eq. (2) for the three-phonon up process (solid line - u) and their sum (eq. (3) ) (solid line - t). The integrated intensity was obtained from eq. (6) and the peak intensity IO in the center of the Raman line from eq. ( 7 ) . The solid and broken lines for the integrated intensity will be discussed below. Table 1 contains the best fit of parameters for the linewidth: from the 3d process we gain the homogeneous line- width r. at the lowest accessible temperature and the frequency of the created phonons w, belonging to the phonon bath (two modes of same frequency or two with different frequencies o,, and w,,,); whereas from the 3u process we derive the coupling constant rb and the necessary phonon of the bath o, to create a new one, w,,. Table 2 displays for each mode wQ the used slitwidth and temperature region in which the integrated intensity Zi,t( T) was modelled by the phonon occupation number (parameter ofi,) and Zi,, at T=O K.
4.2. Relaxation of externalphonons
We discuss first the linewidths r( T) of table 1 and then the integrated intensities Z,, ( T) of table 2.
The general behavior of r( T) at high temperatures (kT> ho) of all modes is a pure linear increase (see, e.g., fig. 2) due to the linear increase in the phonon occupation number in the classical limit. This situa-

M. Jordan et al. /Raman measurements on lithium formate monohydrate crystals 159
a b 4,
I 101
I
LFMH
0 100 200 300
3.0
3 2.5
z 3
s! 2.0 5
0
E 8
1.5
ii 1.0
5
E 0.5
0
Temperature [1(1 Temperature [1<1
0 0 100 200 300 0 100 200 300
Temperature [Kl Temperature IN
Fig. 2. Linewidth of A2 modes at 76.3 cm-’ (a) and 173.1 cm-’ (b) versus temperature; lower section demonstrates integrated intensity (solid and broken lines, see text) and maximum intensity IO versus temperature.
tion justifies our assumption to restrict ourselves to 76.3 (fig. 2a), 78.7 and 82.0 cm-’ gives a r0 value of
second-order corrections; i.e. to three-phonon pro- about 0.01 cm-’ and rb between 1 and 3 cm-‘. A cesses governed by cubic anharmonic terms. 3d process would create phonons o,,,,~ in the acoustic
The eight different modes of (table 1) can be region ( < 50 cm-‘, see table 1) which are, in terms grouped with respect to increasing r,,z 0.01 cm-‘, of phonon density of states, less probable, whereas a ~0.1 cm-’ and % 1 cm-‘. According to our model 3u process leads to phonons, which are spectroscop (section 2) the procedure to fit r(T) of the modes ically detected (see table 1, values in parentheses for

160 44. Jordan et al. /Raman measurements on lithium formate monohydrate crystals
4
3
‘;E Y rw r, 2 E 3 E 7
1
0
LFMH
q = 1372.5 cm”
-I
ing to a r,, which is two orders of magnitude larger; on the contrary rb is still of the same order of mag- nitude. The mode at 163 cm -I with B, symmetry contains in principle two components of polarisabil- ity tensor zx and xz, respectively, which can clearly be separated by the suited scattering geometry. In spite of our well chosen geometry z(xz)x and con- trary to Galzerani et al. [ 111, who observed a broad structure, we detected a clear doublet at low temper- atures, which broadens at high temperatures. The fit- ting procedure for the two components at 163 cm-’ is a question of deconvolution but in any case the overall trend is also confirmed here. For the highest mode at 173 cm- ’ (included in table 1) we list only some of the possible decay channels, without pre- tending to be complete since the density of states of LFMH is not known. The temperature dependence of the integrated intensity Ii,,, determined by the phonon population n ( op, T), is calculated from eq. (6) in two ways. First, the measured phonon fre- quencies wp were used to obtain the solid lines in fig. 2; second, the phonon frequencies were used as fit- ting parameters wfi, to obtain the best agreement be- tween calculated and measured intensities (broken line in fig. 2). Both sets of parameters are given in table 2. Within the experimental accuracy both curves describe satisfactorily well the overall behavior; the reasons for the deviation of the two functions from the experimental points are the deconvolution pro- cedures and the specific behavior of the sample (for example some intensity values at 300 K are less than expected due to surface quality - LFMH is hygro- scopic and dehydrating). For the interpretation of the stimulated Raman data we took directly the mea- sured intensities at different temperatures.
0 100 200
Temperature [Kj
300
Fig. 3. Linewidth of the internal zz A, mode y= 1372.5 cm-’ versus temperature.
the assignment [ 111, related to singularities in the one-phonon density of states < 300 cm-’ ). There- fore we assume the relaxation of these low lying phonons to be described mainly by one channel (3~ process) leading to a small r. (see fig. 2a).
Themodesat 104.1, 112.7and 131.1 cm-‘arefit- ted best by a r,, value of about 0.1 cm-’ and rb be- tween 1 and 4 cm-‘. Both 3d processes or 3u pro- cesses can involve now - as additional phonons w,, - spectroscopically measured phonons at R=O (see values in parentheses in table 1); as a consequence more decay channels are now possible giving rise to a larger Z,. But still the 3u processes exceed the 3d processes.
The modes at 163 cm-’ and the one at 173.1 cm-’ possess Z,, values of about 1 cm-’ and r& between 3 and 5 cm -I. 3d and 3u processes can be realized by different combinations of spectroscopically deter- mined phonons leading to much more relaxation pathways, i.e. o,, is lying in the range of measured phonons (values in parentheses in table 1). Due to the frequency dependence of g,,,(& [ 161 the 3d processes are more probable now (see fig. 2b) lead-
4.3. Relaxation of internal phonons
The only internal mode which was observed in stimulated Raman scattering was the zz A, mode at 1372 cm-‘. This mode was assigned by Galzerani et al. [ 111 to q, the symmetric stretch of O-C-G within the LMFH molecule. The linewidth r( T) (see fig. 3) is constant Z( T+O K) k: 1 cm -I up to = 80 K and then increases linearly with temperature.
The most probable down process could be o2 ( 1372 cm-‘)dwg (1070 cm-‘)+a, (x300 cm-‘), less probable are w2-+03 (790 cm-‘)+2ce, (~600

M. Jordan et al. /Raman measurements on lithium formate monohydrate crystalr 161
Table 1 Parameters of the best fit of linewidth versus temperature graphs of some phonons of LPMH (for the meaning of labels sea text); values in parentheses are experimentaUy determined in ref. [ 111 (values in cm-‘)
76.3 0.0086~0.0019 38 38 3.1 kO.2 95f2 171 (90/100) (170/171)
78.7 0.0098 + 0.0004 39.5 39.5 1.13+0.03 85+1 (83/84) (::,167)
82.0 0.0118 + 0.0003 41 41 2.4kO.l 108f2 190 (108/109) (190/191)
104.1 0.0633_+0.017 13+1 91fl 4.6kO.2 150f4 254 (90) (149/151) (249)
112.7 0.0605 +0.0056 18+4 95+4 2.5kO.2 108f6 221
W-100) (109) (217-227) 131.1 0.147*0.003 65.5 65.5 1.3+0.1 76+4 207
(74) (194-217) 163.0 (1) 1.16f0.03 43f 14 120f 14 5.5f 1.3 96+28 259
(50) (116) (90-100) (249) 163.0 (2) 0.547 f 0.005 67f32 96f32 15.2k5.2 160f26 323
(74) (90-100) (162/164) (331) 173.1 1.3450.02 86.5 86.5 3.6kO.8 135f 15 308
(83/W) (83/90) (131-133) (303) (100-105) (75/76) (50-52) (222-227)
Table 2 Parameters of the best tit of intagrated intensity versus temperature graphs of modes of LPh4H
Mode @ (cm-‘)
%I (cm-‘)
I-,, (T=O) (arb. units)
Slitwidth
(cm-‘)
Temperature
range (K)
76.3 86.5f2.7 78.7 65.5f 1.5 82.0 110.723.8
104.1 78.9fl.2 112.7 171.5k5.3 131.1 133.1 k3.3 163.0 (1) 51.1k7.9 163.0 (2) 39.0f 1.7 173.1 156.9k3.3
945+ 13 1180+17 1077f 14 3272 k 27 2618f20 2391 f 19 1556f 100 508f 15
4626 f 25
10 5 5
10 5
10
10
lo-200 IO-270 1 O-200 10-270 10-200 lo-200 10-100 10-100 lo-200
cm-’ ) or a pure four-phonon process. Some up pro- cesses are also conceivable such as o2 (1372 cm-‘)+o, (~~10 cm-‘)+o, (1390 cm-‘) or ~+0,,(=21Ocm-~)+w., (1587cm-1)or2~2+~p ( RS 100 cm-*)+o, (2860 cm-‘). If energy relaxa- tion processes are absent at all, the constant line- width up to k: 80 K suggests the onset of a thermally activated dephasing mechanism as the main cause of line broadening.
Two further reasons for this large residual line-
width r,, of about 1 cm-’ are conceivable: either temperature-independent scattering processes on de- fects (natural abundance of Li, C, 0 isotopes; defects describing the real crystal are not known of our sam- ples) (see ref. [ 18, sect. 2.3.21) or an almost temper- ature-independent broadening mechanism generated by long range dipole-dipole interactions between the CO, units in adjacent LFMH molecules; an experi- mental value r( T-BO K) is used on purpose in theory trying to model the best potential parameters. The

162 h4. Jordan et al. /Raman measurements on lithium formate monohydrate crystals
observed linewidth behavior with temperature of the internal 1372 cm-’ mode is not unusual: i.e. C, large and Z’( T) constant up to 80 K. Pine and Tannenwald [ 191, e.g., measured the mode at 466 cm-’ in quartz and stressed the occurrence of several relaxation channels as the main reason for the large residual linewidth. The slight increase below 50 K in line- width of the 1372 cm-’ mode of LPMH (see fig. 3) may be due to the temperature dependence of several weak modes near the w2 mode obscuring the intrinsic actual behavior.
4.4. Spontaneous and stimulated Raman scattering
Recently, the threshold intensities for stimulated Raman scattering (SRS) from many phonon modes of lithium formate monohydrate have been investi- gated [ 91. It is well known [ 201 that the threshold intensity FthRs of SRS is related to the spontaneous Raman linewidth rand to the integrated Raman cross section du1d.Q in the following way:
r r1 zffs w - N-N-* do/dQ Zi,, 10
(8)
The ratio Z/Z,, has been replaced by the peak inten- sity Z. at the center of the spontaneous Raman line, which is calculated from the integrated intensity Zr, and from the linewidth rassuming a Lorentzian line- shape (see eq. ( 7 ) ) . The threshold intensity for SRS is lowest for strong and narrow spontaneous Raman lines. Eq. ( 8 ) is valid only for stationary Raman scat- tering when the duration of the pump laser pulse is very long compared to the inverse of the spontaneous Raman linewidth.
We explain the interpretation of the stimulated Raman threshold measurements in terms of the spontaneous Raman data by an example. In fg 4 the measured threshold intensity p for the 104 cm - ’ zz A, mode (x(zz)x configuration) is shown as a function of temperature T. The experimental points (open circles) were measured with a &witched ruby laser with a linewidth of 0.7 cm-‘. The solid line has been calculated from the spontaneous Raman data in the following way. The peak intensity IO in the center of the spontaneous Raman line was determined at various temperatures from the ratio of the integrated intensity to the linewidth (using eq. ( 7 ) ) . The exper- imentally determined values of the inverse 1 /IO of the
Temperature T ( K I
Fig. 4. Threshold intensity I&! of stimulated Raman scattering from the 104 cm --I zz A, made versus temperature T. The circle-s represent the experimental points, the solid line has been calcu- lated from the spontaneous Raman data according to eq. (8).
spontaneous peak intensity at various temperatures were interpolated by a continuous curve, which is shown in fg 4. Since the proportionality factor in eq. ( 8 ) is not known, the curve was fitted at one defmite temperature to the corresponding threshold intensity IstiM of SRS. There is good agreement between the experimental points for SRS and the solid curve cal- culated from the spontaneous Raman data. The in- crease of the threshold intensity Z&= with rising tem- perature T is due to the increase of the spontaneous Raman linewidth r (see eq. ( 8 ) ) because the inte- grated spontaneous Raman intensity is approxi- mately constant in the temperature range from 2 to 40 K, where SRS was observed. Since the sponta- neous Raman linewidths of the low frequency modes are very narrow at low temperatures the explanation of the results of SRS was only possible because of the high spectral resolution ( k: 0.0 1 cm- * ) of the appa- ratus for spontaneous Raman scattering.
5. Conelusions
We have measured the spontaneous Raman line- widths and the integrated spontaneous intensities of theA,modesat79,104and1372cm-‘,theA,modes at76,131and173cm-*andtheB,modesat82,113 and 163 cm - ’ of lithium formate monohydrate from

M. Jordan et al. /Raman measurements on lithium formate monohydrate crystals 163
10 to 300 K. Since part of the Raman modes exhibit very narrow spontaneous Raman lines at low tem- peratures high spectral resolution ( ~0.01 cm-‘) was required for the measurements. The spontaneous Ra- man data were used for the explanation of the tem- perature dependence of the threshold intensity for stimulated Raman scattering from these modes. Good agreement between the stimulated and spontaneous Raman data was demonstrated.
The temperature dependence of the spontaneous Raman linewidth r(T) of LFMH, especially of the external modes, are a further convincing application and test of the theory of phonon mode relaxation. Three-phonon processes (up or down) are sufficient to model r( I’); therefore mainly cubic anharmonic- ity rules the phonon-phonon interaction process of LFMH crystals. The increase of the residual line- width r, (for T+O K) with phonon frequency mir- rors the increase in decay pathways according to the two-phonon sum density of states; the almost con- stant coupling factor r6 for phonon up conversion confirms calculations of the dependence of the two- phonon difference density of states on phonon fre- quency. The frequencies of the created or annihilated phonons in the decay of one specific phonon, fulfill- ing energy and wavevector conservation, are quite consistent with the known Raman active phonons of LFMH, which have been used because of unknown dispersion relations and phonon density of states of this material.
References
[ 1 ] S.J. Bastow and M.H. Dunn, Opt. Commun. 35 (1980) 259; V.I. Stroganov, B.I. Kidyarov and V.I. Trunov, Opt. Spectry. 47 (1979) 319; V.I. Stroganov, V.I. Trunov, A.A. Chemenko and A.N. Izrailenko, Soviet J. Quantum Electron. 6 (1976) 601; F.B. Dunning, F.K. Tittel and R.F. Stebbings, Opt. Commun. 7 (1973) 181.
[ 21 S. Singh, WA. Banner, J.R. Potopowicz and LG. van Uitett, Appl. Phys. Letters 17 ( 1970) 292.
[ 31 K Kato, Opt. Quantum Electron. 8 (1976) 261. [4]S.A. Akhmanov, A.N. Dubovik, S.M. Saltiel, I.V. Tomov
and V.G. Tut&in, JETP Letters 20 ( 1974) 117; R.B. Andreev, V.D. Volosov and L.I. Kuznetsova, Soviet. J. Quantum Electron. 5 (1975) 242.
[S] H. Pykacz, Acta Phys. Polon. A 55 (1979) 855. [ 61 A.L. Aleksandrovkii, A.N. Izrailenko and L.N. Rashkovich,
Soviet J. Quantum Electron. 4 (1974) 699. [7] H. Veeser, U. Bogner and W. Eisenmenger, Phys. Stat. Sol.
37a (1976) 161. [ 81 J. Szewcyk, J. Kamiewicz and W. Kolasinski, J. Cryst.
Growth60 (1982) 14. 19) KK. Lai, W. Schiilllbauer, H. Silberbauer, H. Amler, U.
Bogner, M. Maier, M. Jordan and H.-J. Jodl, Phys. Rev. B, to be published.
[lo] Yu.N. Polivanov and K.A. Prokhorov, Soviet Phys. Solid State 22 ( 1980) 768; M. Cadene, Compt. Rend. Acad. Sci. (Paris) B 270 ( 1970) 909; R.S. Krishnan and P.S. Ramanujan, Indian J. Pure Appl. Phya.9 (1971) 910.
[ 111 J.C. Galzerani, R. Srivastava, R.S. Katiyar and S.P.S. Porto, J. Raman Spectty. 6 (1977) 174.
[ 121 O.A. Doil’nitsyna, Yu.N. Polivanov and LA. Prokhorov, Soviet J. Quantum Electron. 11 ( 1981) 1389; Yu.N. Polivanov and K.A. Prokhorov, Soviet Phys. Solid State 21 (1979) 2074; M. Yamamoto, H. Ito and H. Inaba, Phys. Letters 55 A (1975) 303.
[ 13 ] L.I. Kuznetsova, L.A. Kulevskii, Yu.N. Polivanov and K.A. Prokhorov, Soviet J. Quantum Electron. 5 (1975) 1146.
[ 141 P. Ranson, R. Guillon, S. Califano, J. Raman Spectry. 17 (1986) 155.
[ 151 P. Ranson, R. Guillon and S. Califano, Chem. Phys. 86 (1984) 115.
[ 161 R. Guillon, P. Ranson and S. Califano, Chem. Phys. 91 (1984) 119.
[ 171 M. Becucci and E. Castelucci, Chem. Phys. 135 ( 1989) 363. [ 181 S. Califano and V. Schettino, Intern. Rev. Phys. Chem. 7
(1988) p. 19. [ 191 A.S. Pine and P.E. Tannenwald, Phys. Rev. 178 ( 1969)
1424. [20] W. Kaiser and M. Maier, in: Laser Handbook, Vo12, eds.
ET. Arecchi and E.O. Schulz-Dubois (North-Holland, Amsterdam, 1972) p. 1077.