hematology - sei digital library · chemistry immunoassay hematology automation we produce reliable...
TRANSCRIPT
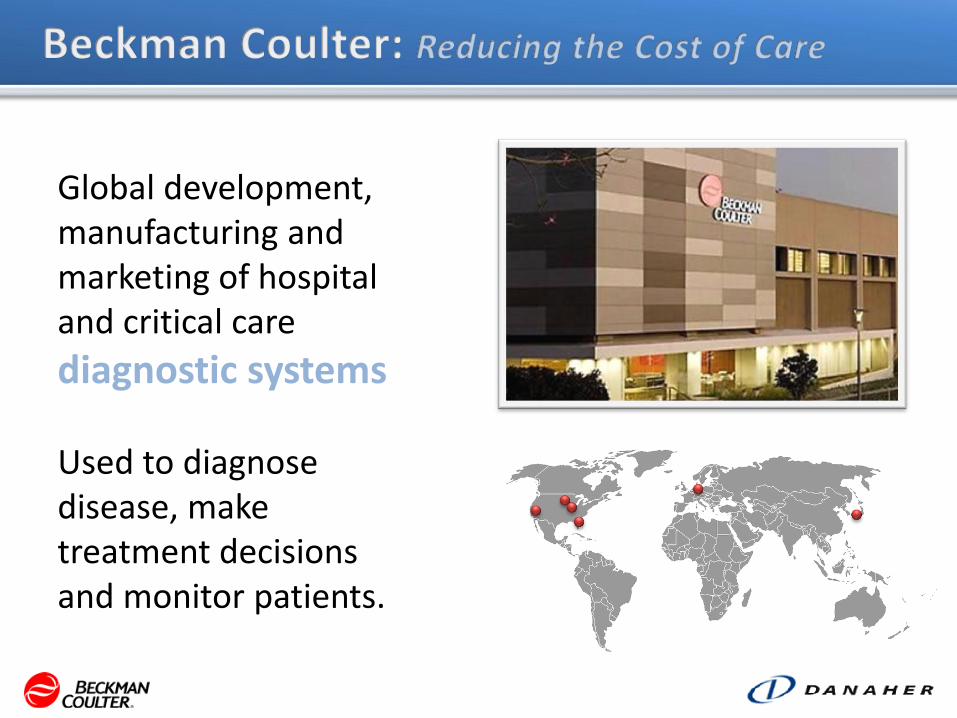
Global development, manufacturing and marketing of hospital and critical care
diagnostic systems Used to diagnose disease, make treatment decisions and monitor patients.
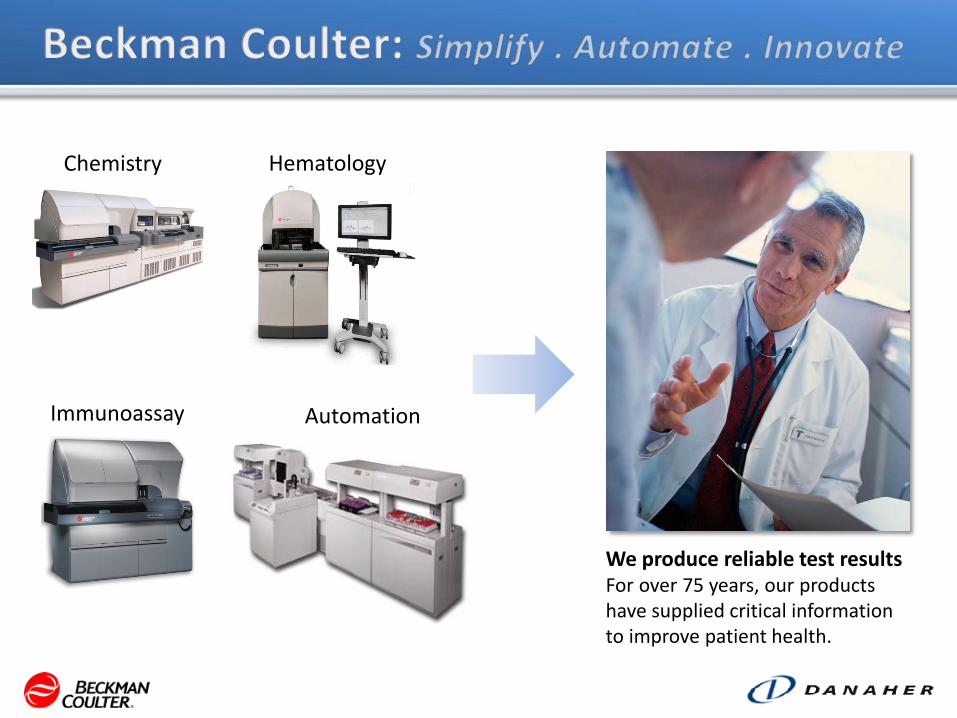
Chemistry
Immunoassay
Hematology
Automation
We produce reliable test results For over 75 years, our products have supplied critical information to improve patient health.
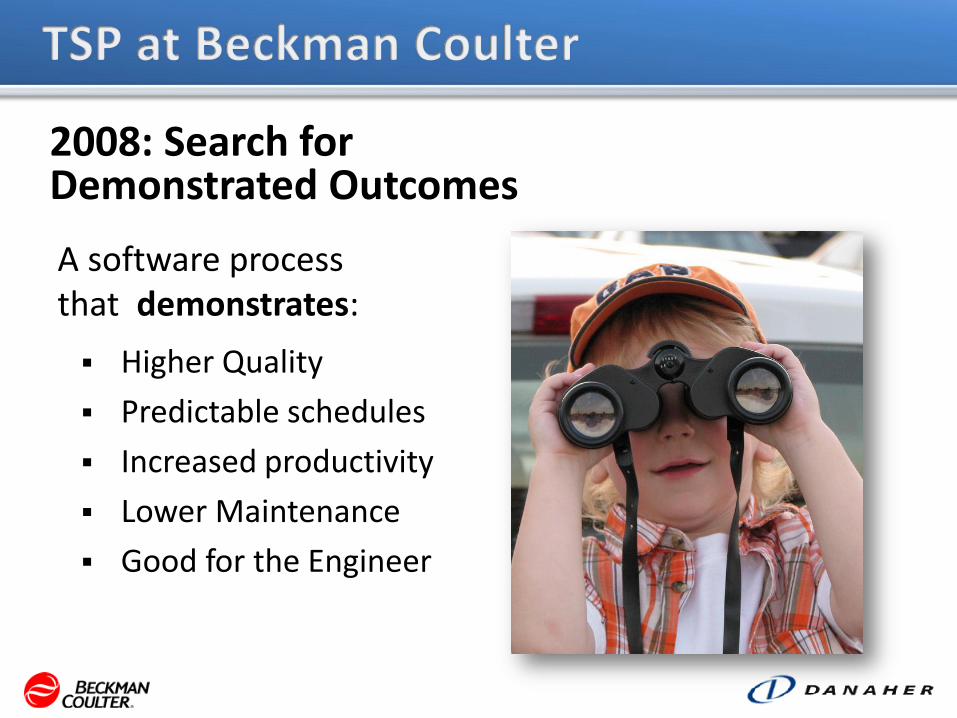
2008: Search for Demonstrated Outcomes
A software process that demonstrates:
Higher Quality
Predictable schedules
Increased productivity
Lower Maintenance
Good for the Engineer

Surveyed Engineers
Contacted Universities
Researched LEAN, Six Sigma, and Agile
Met with Jim Over to understand TSP
Discussed TSP with industry adopters
Selected TSP
Presented overview to engineers, project leads, functional managers
Selected 2 pilot projects
2008: Search for Demonstrated Outcomes

0
10
20
30
40
50
60
70
80
90
100
2008 2009 2010 2011 2012
Pe
rce
nt
Engi
ne
ers
Usi
ng
TSP
In three years, achieved 90% adoption across Diagnostics R&D
Planning 2 Pilots
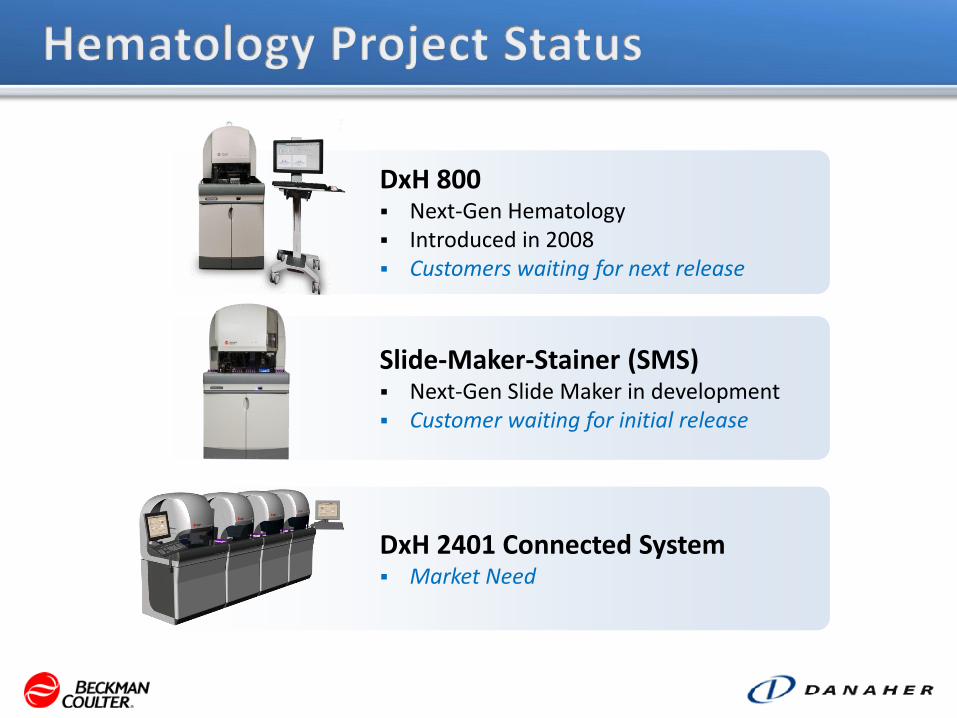
DxH 2401 Connected System Market Need
Slide-Maker-Stainer (SMS) Next-Gen Slide Maker in development Customer waiting for initial release
DxH 800 Next-Gen Hematology Introduced in 2008 Customers waiting for next release
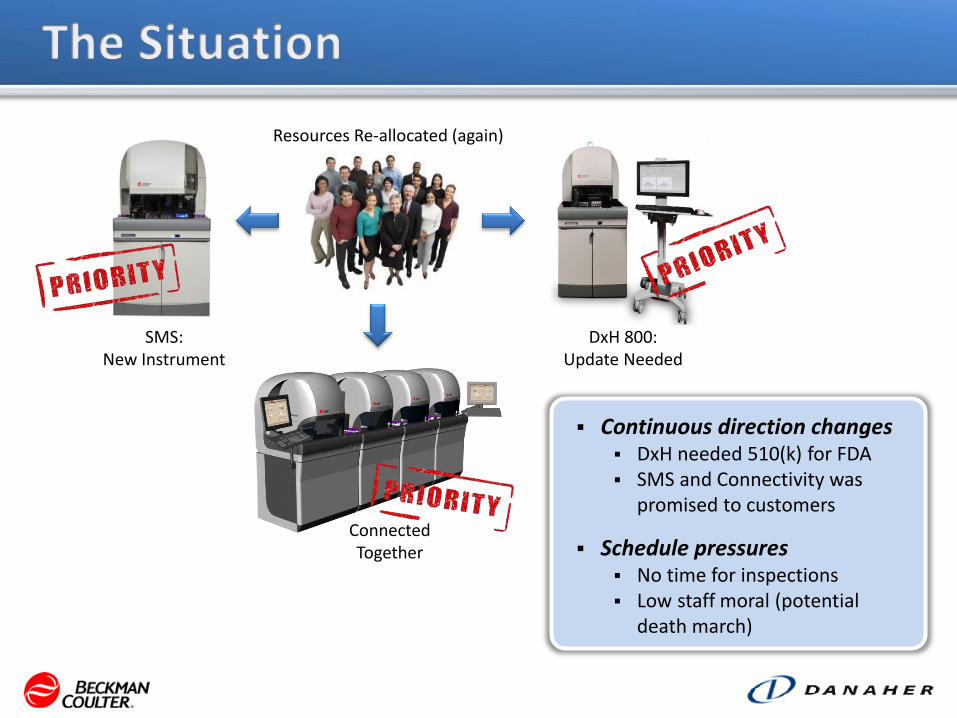
DxH 800: Update Needed
SMS: New Instrument
Connected Together
Resources Re-allocated (again)
Continuous direction changes DxH needed 510(k) for FDA SMS and Connectivity was
promised to customers
Schedule pressures No time for inspections Low staff moral (potential
death march)
Sep
-09
Oct
-09
No
v-0
9
Dec
-09
Jan
-10
Feb
-10
Mar
-10
Ap
r-1
0
May
-10
Jun
-10
Jul-
10
Au
g-1
0
Sep
-10
Oct
-10
No
v-1
0
Dec
-10
SCR
s P
er
Mo
nth
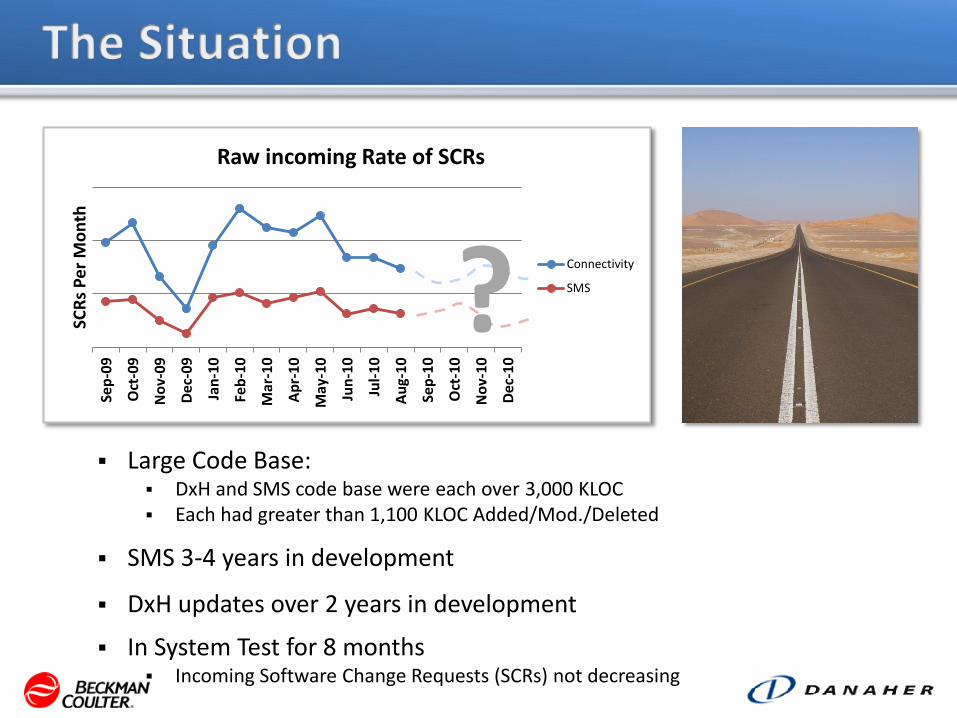
Raw incoming Rate of SCRs
Connectivity
SMS? Large Code Base:
DxH and SMS code base were each over 3,000 KLOC Each had greater than 1,100 KLOC Added/Mod./Deleted
SMS 3-4 years in development
DxH updates over 2 years in development
In System Test for 8 months Incoming Software Change Requests (SCRs) not decreasing
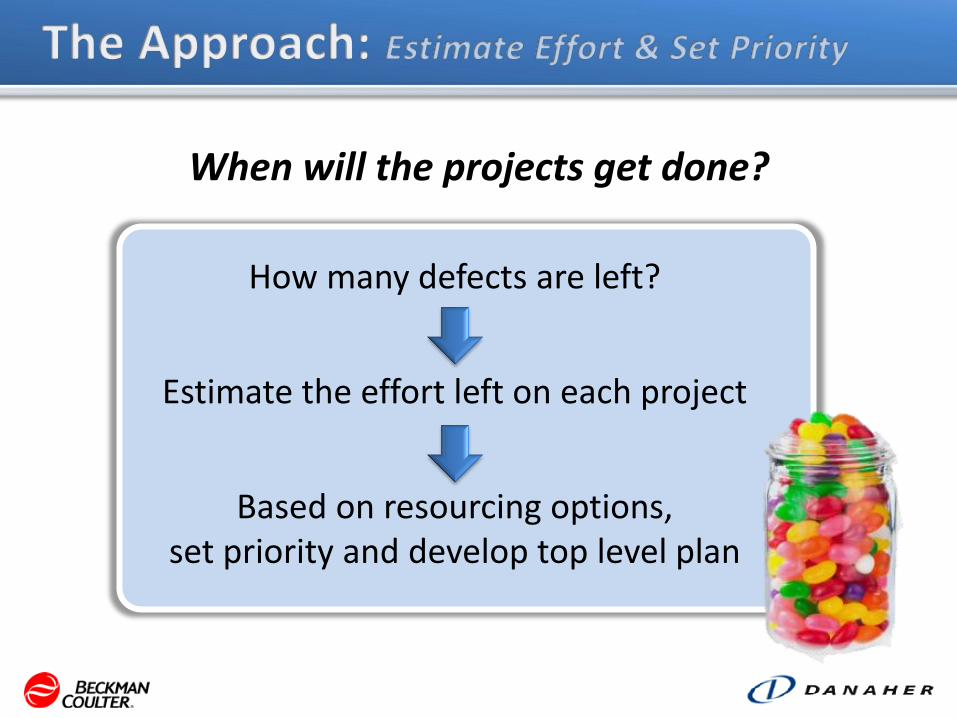
When will the projects get done?
How many defects are left?
Estimate the effort left on each project
Based on resourcing options, set priority and develop top level plan
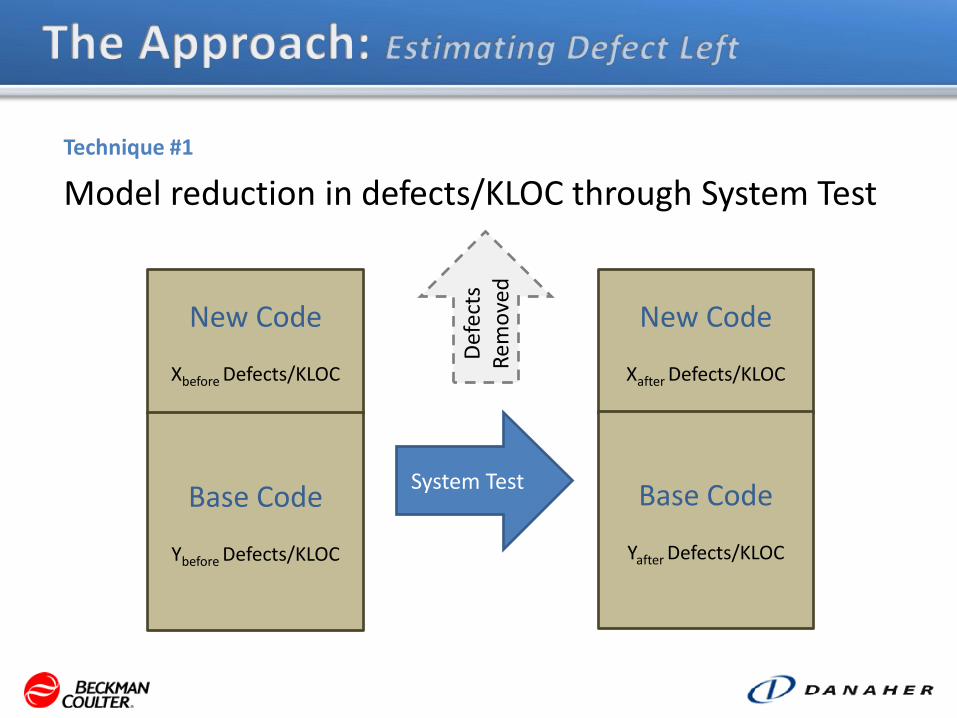
Technique #1
Model reduction in defects/KLOC through System Test
New Code
Xbefore Defects/KLOC
Base Code
Ybefore Defects/KLOC
New Code
Xafter Defects/KLOC
Base Code
Yafter Defects/KLOC
System Test D
efec
ts
Rem
ove
d
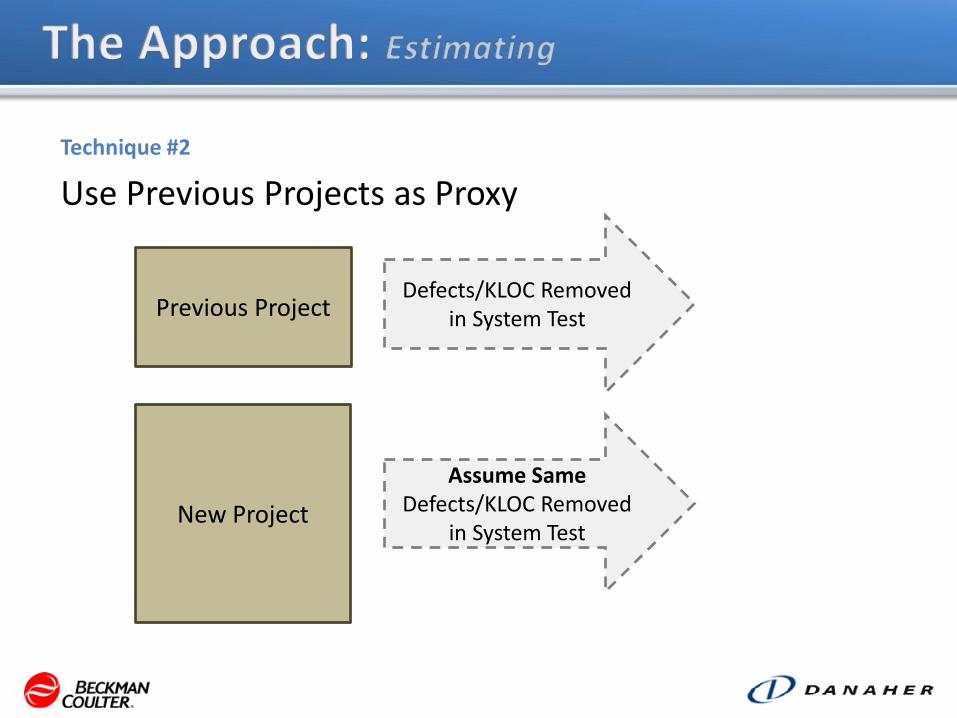
Technique #2
Use Previous Projects as Proxy
Previous Project
New Project
Defects/KLOC Removed in System Test
Assume Same Defects/KLOC Removed
in System Test
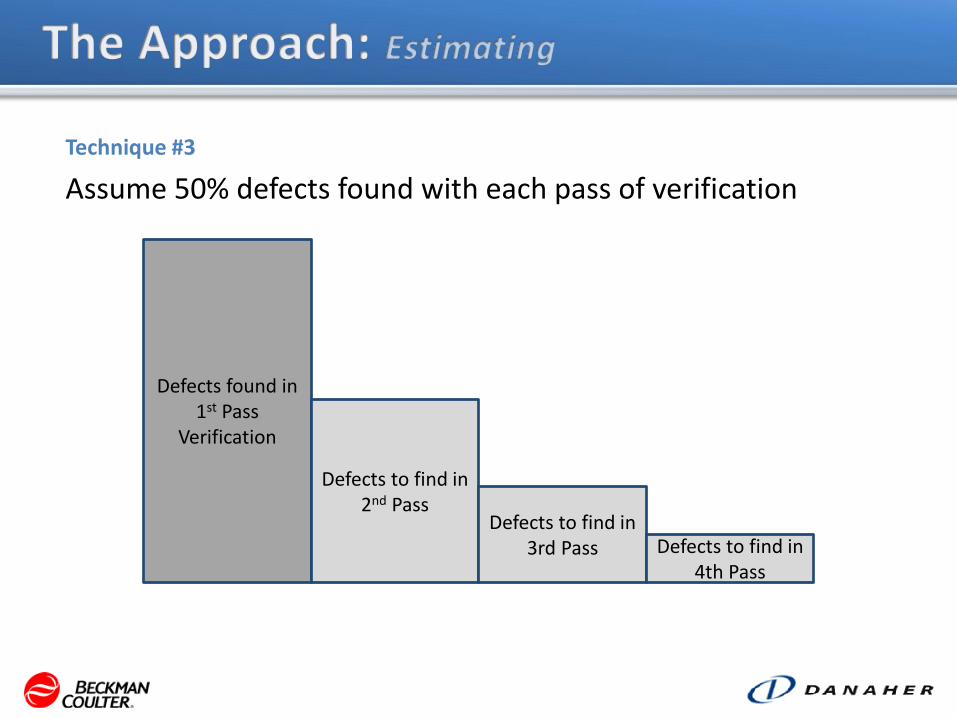
Technique #3
Assume 50% defects found with each pass of verification
Defects found in 1st Pass
Verification
Defects to find in 2nd Pass
Defects to find in 3rd Pass Defects to find in
4th Pass

Developed models for management Total resources available Priority of each project Use best-worse number of defects to estimate ranges
Few
er
Re
sou
rce
s
DxH is Priority
SMS is Priority
Blended Priorities
Mo
re R
eso
urc
es
DxH is Priority
SMS is Priority
Blended Priorities
SMS Completion Range DxH Completion Range

Cycle 0
Message from Management: More people, more time, a better process
Formed Workshop Coordination Team
Introduced PSP/TSP principals based on what was applicable to project in this phase SEI-tailored for just-in-time training Introduced inspections and personal checklists Put time in schedule for inspections and checked rates Cycle planning Data capture for future estimation Role Managers Coaches Weekly Meetings Set expectations of no new defects into
System Test Manage Risks
Trained Development and Verification teams
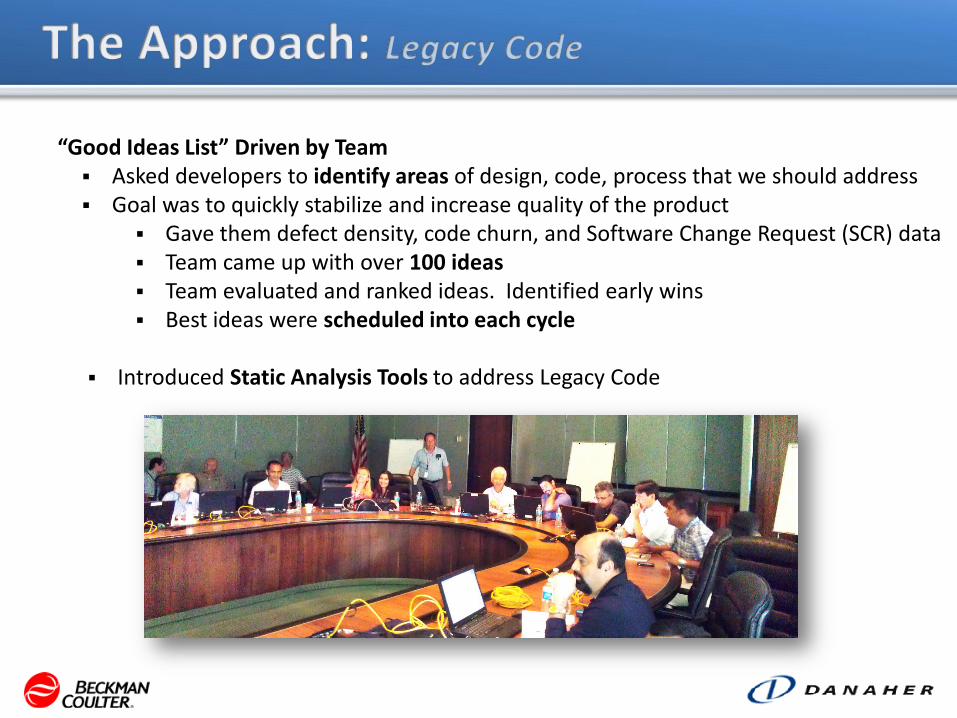
“Good Ideas List” Driven by Team Asked developers to identify areas of design, code, process that we should address Goal was to quickly stabilize and increase quality of the product
Gave them defect density, code churn, and Software Change Request (SCR) data Team came up with over 100 ideas Team evaluated and ranked ideas. Identified early wins Best ideas were scheduled into each cycle
Introduced Static Analysis Tools to address Legacy Code
Remaining Cycles
Introduced topics as needed each cycle Refined estimates with Task Hours vs. Calendar Hours
Used a tool to better capture WBS and estimates
Retrospectives after each cycle
Weekly Recovery Plans when needed
Set Goals Per Cycles based on Project needs
Introduced Monte Carlo modeling to estimate completion date

Monte Carlo Modeling of Triage, Development and Verification
Used to estimate cycle and project completion times throughout project Provided input to cycle planning to establish goals Balanced resources between SMS and DxH projects Balanced resources between Development and Verification (prevent starvation)
SMS
DxH Cycle 0 Cycle 1 Cycle 2 Cycle 4 Cycle 3
Cycle 0 Cycle 1 Cycle 2 Cycle 3

Cycle Ended When: • Planned Development Work for cycle completed • Planned Verification Work for cycle completed • SCRs to Verify < Max Allowed Cycle Duration
Determining Duration of a Cycle
Incoming/Week
New SCRs to Fix
SCRs Fixed SCRs Verified New SCRs
SCR
s C
losed
Planned Dev Work for Cycle Planned Verification Work
SCR/Dev/Week
Triage Rate
SCR/Ver. Person/Week % Closed
Max Allowed SCRs at End of
Cycle
# Developers # Verification Persons
Note: Wide-band Delphi used for initial estimate of Mean and SDs
Cycle n
Inputs (Mean and SD) Inputs (Mean and SD) Inputs (Mean and SD) Inputs (Mean and SD)
Inputs (Mean)
SCRs to Triage SCRs In
Development SCRs to Verify
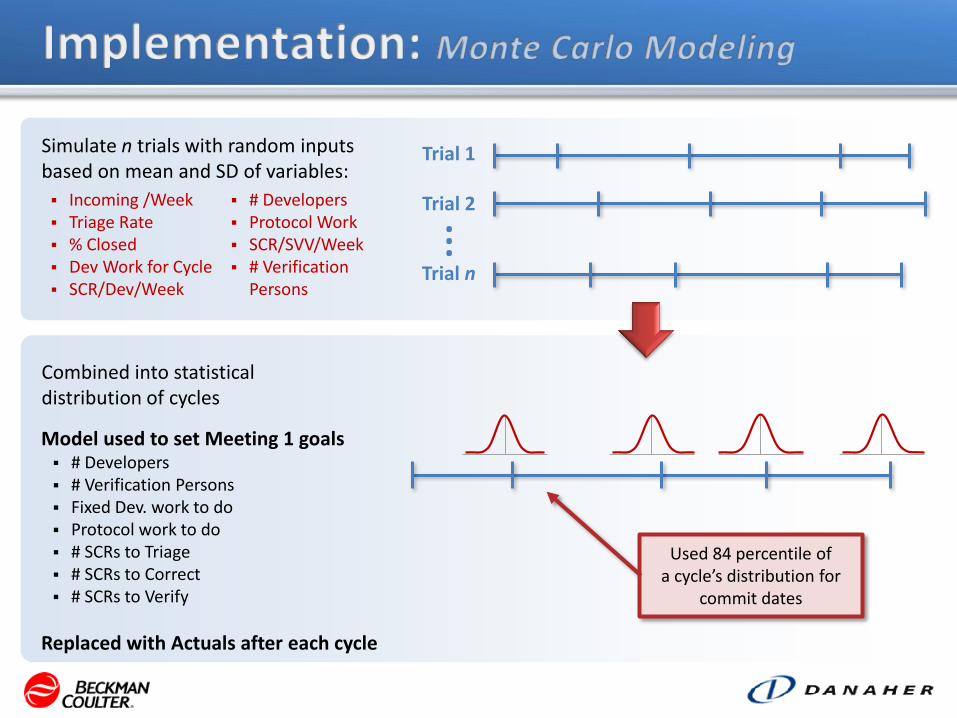
Simulate n trials with random inputs based on mean and SD of variables:
Trial 1
Trial 2
Trial n
Used 84 percentile of a cycle’s distribution for
commit dates
. . .
Model used to set Meeting 1 goals # Developers # Verification Persons Fixed Dev. work to do Protocol work to do # SCRs to Triage # SCRs to Correct # SCRs to Verify
Replaced with Actuals after each cycle
Incoming /Week Triage Rate % Closed Dev Work for Cycle SCR/Dev/Week
# Developers Protocol Work SCR/SVV/Week # Verification
Persons
Combined into statistical distribution of cycles

Cycle 1 Enter Design
Validation 14 weeks
Cycle 2 Complete all
Protocols 12 weeks Cycle 3
Release Candidate 12 weeks
Cycle 0 Stabilization
13 weeks
Planned: 12/13/2010 Actual: 12/13/2010
Cycle 0 Launch 9/13/2010
Planned: 6/22/2011 Actual: 6/30/2011
Planned: 4/1/2011 Actual: 3/31/2011
Planned: 9/14/2011 Actual: 10/17/2011
Initiate Ship Planned: 10/31/2011 Actual: 11/14/2011
Schedule Predictability: 3.4%
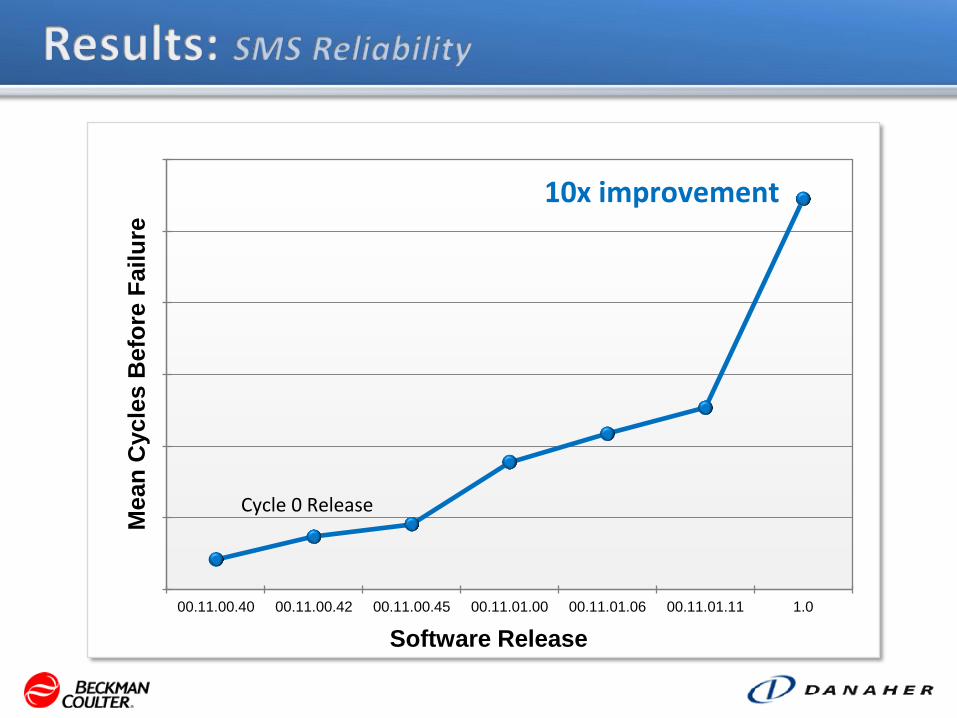
00.11.00.40 00.11.00.42 00.11.00.45 00.11.01.00 00.11.01.06 00.11.01.11 1.0
Mean
Cycle
s B
efo
re F
ail
ure
Software Release
10x improvement
Cycle 0 Release

0
2
4
6
8
10
12
14
Cycle 0 Cycle 1 Cycle 2 Cycle 3
% F
aile
d
% Corrected Defects Failing Verification
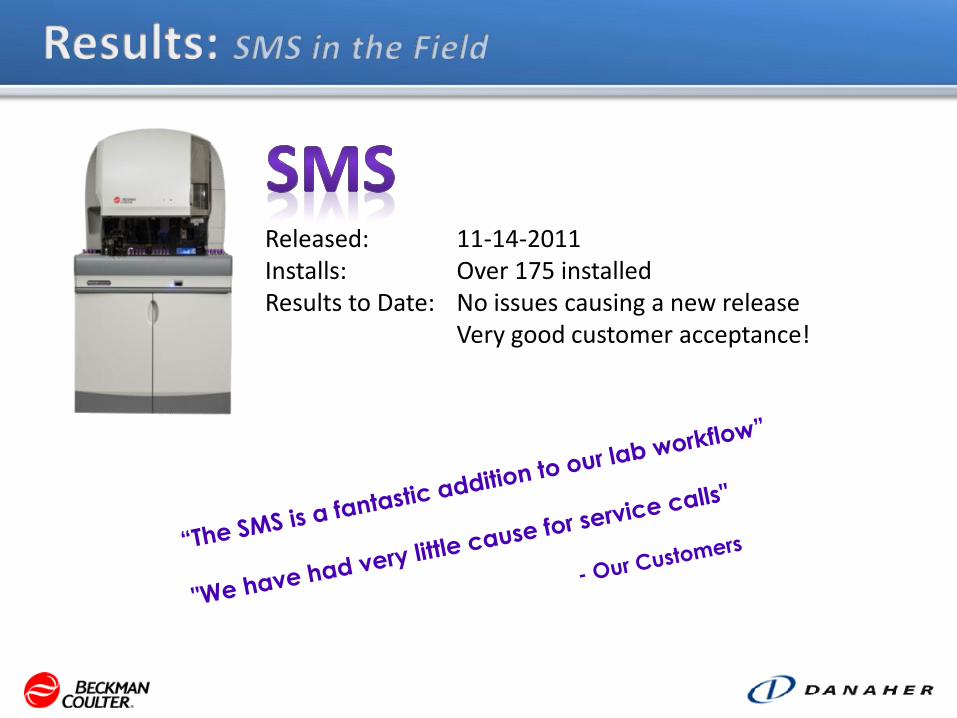
Released: 11-14-2011 Installs: Over 175 installed Results to Date: No issues causing a new release Very good customer acceptance!
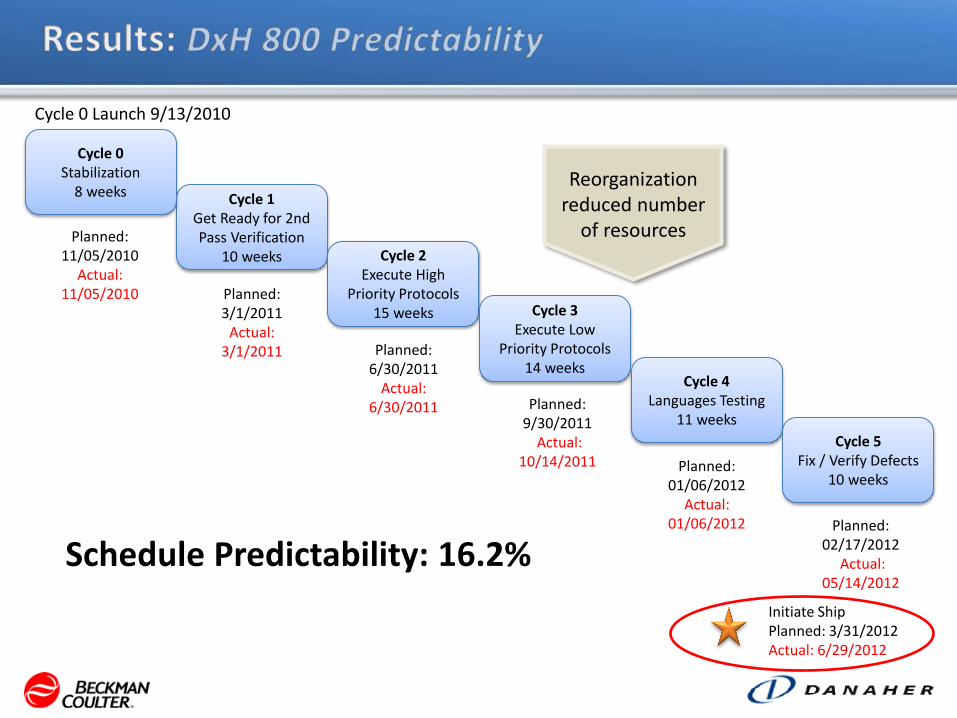
Cycle 1 Get Ready for 2nd Pass Verification
10 weeks Cycle 2 Execute High
Priority Protocols 15 weeks Cycle 3
Execute Low Priority Protocols
14 weeks
Cycle 0 Stabilization
8 weeks
Planned: 11/05/2010
Actual: 11/05/2010
Cycle 0 Launch 9/13/2010
Planned: 6/30/2011
Actual: 6/30/2011
Planned: 3/1/2011
Actual: 3/1/2011
Planned: 9/30/2011
Actual: 10/14/2011
Initiate Ship Planned: 3/31/2012 Actual: 6/29/2012
Schedule Predictability: 16.2%
Cycle 4 Languages Testing
11 weeks
Cycle 5 Fix / Verify Defects
10 weeks Planned:
01/06/2012 Actual:
01/06/2012 Planned: 02/17/2012
Actual: 05/14/2012
Reorganization reduced number
of resources
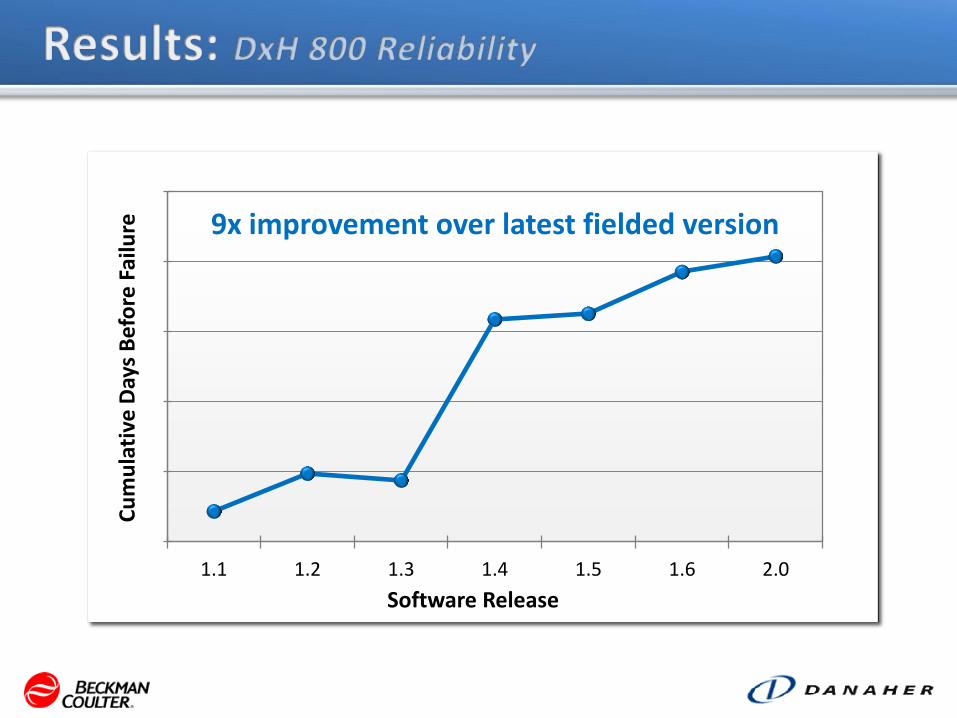
1.1 1.2 1.3 1.4 1.5 1.6 2.0
Cu
mu
lati
ve D
ays
Bef
ore
Fai
lure
Software Release
9x improvement over latest fielded version
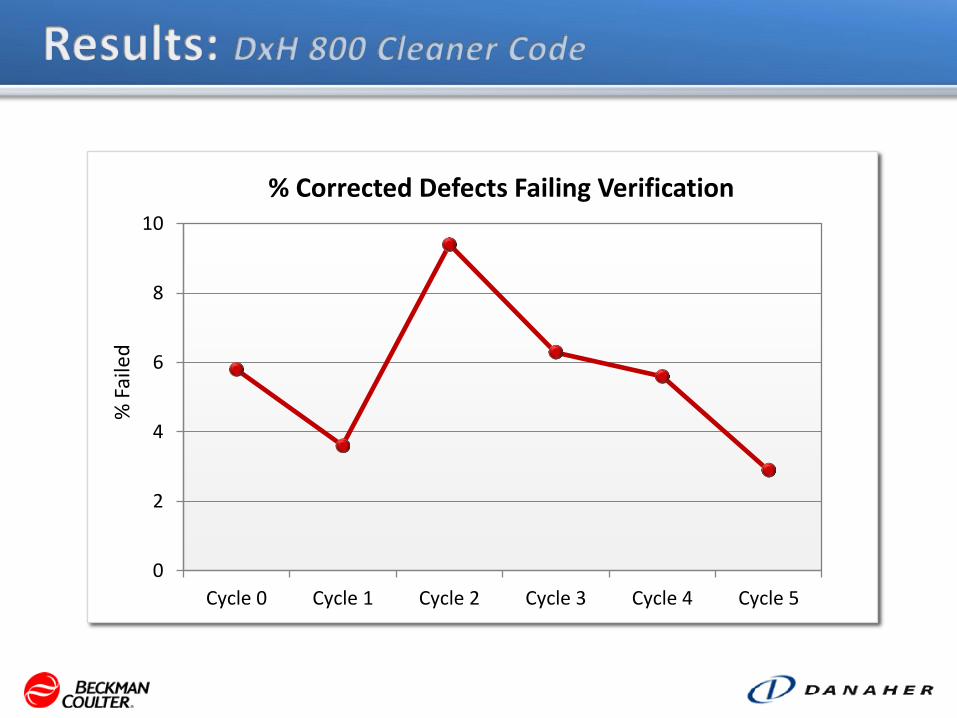
0
2
4
6
8
10
Cycle 0 Cycle 1 Cycle 2 Cycle 3 Cycle 4 Cycle 5
% F
aile
d
% Corrected Defects Failing Verification
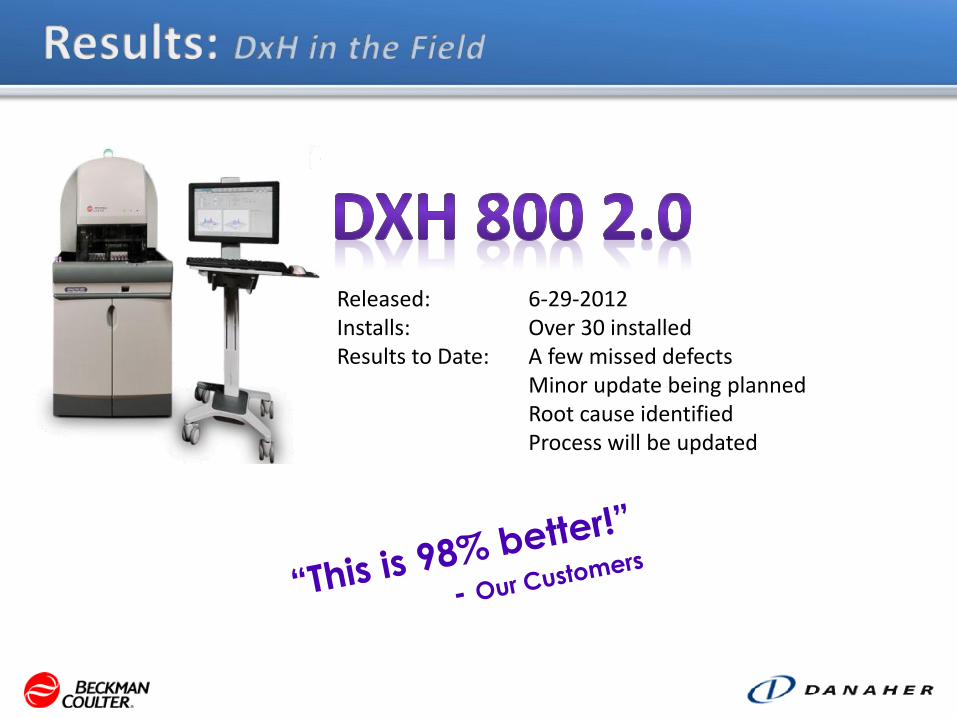
Released: 6-29-2012 Installs: Over 30 installed Results to Date: A few missed defects Minor update being planned Root cause identified Process will be updated
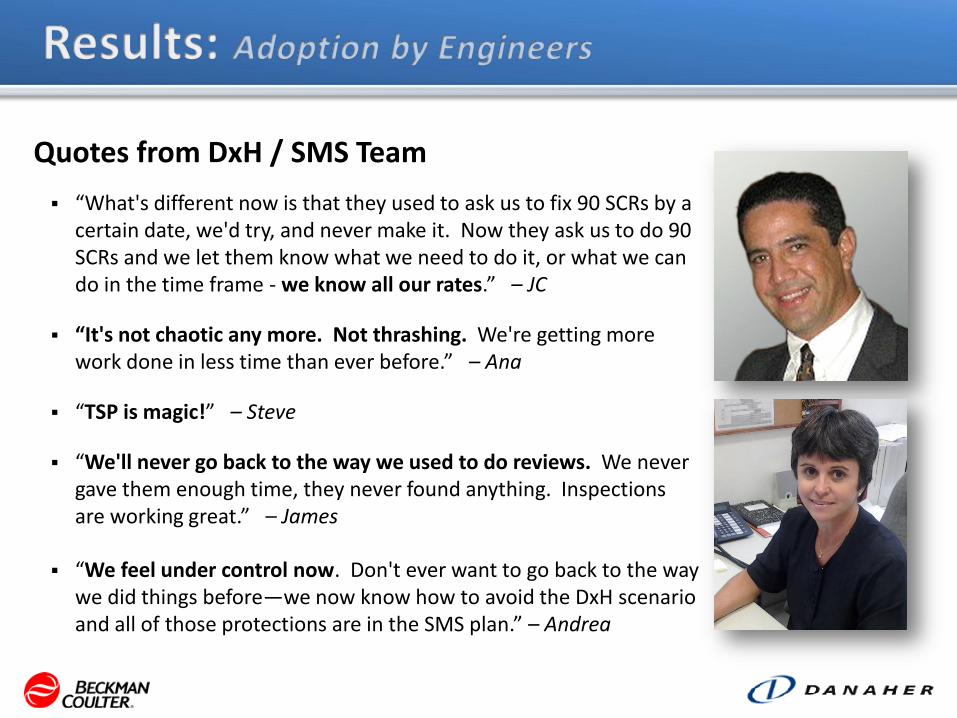
Quotes from DxH / SMS Team
“What's different now is that they used to ask us to fix 90 SCRs by a certain date, we'd try, and never make it. Now they ask us to do 90 SCRs and we let them know what we need to do it, or what we can do in the time frame - we know all our rates.” – JC
“It's not chaotic any more. Not thrashing. We're getting more work done in less time than ever before.” – Ana
“TSP is magic!” – Steve
“We'll never go back to the way we used to do reviews. We never gave them enough time, they never found anything. Inspections are working great.” – James
“We feel under control now. Don't ever want to go back to the way we did things before—we now know how to avoid the DxH scenario and all of those protections are in the SMS plan.” – Andrea

Possible to introduce TSP to a project late in development and still realize significant improvements.
Some TSP concepts are independent of where introduced Personal reviews
Inspections, inspection rates, tracking
Planning and estimation
Knowing your rates/historical data
Use of task hours
Role managers/team structure
Coaching of team lead
Collection and use of data essential to improving
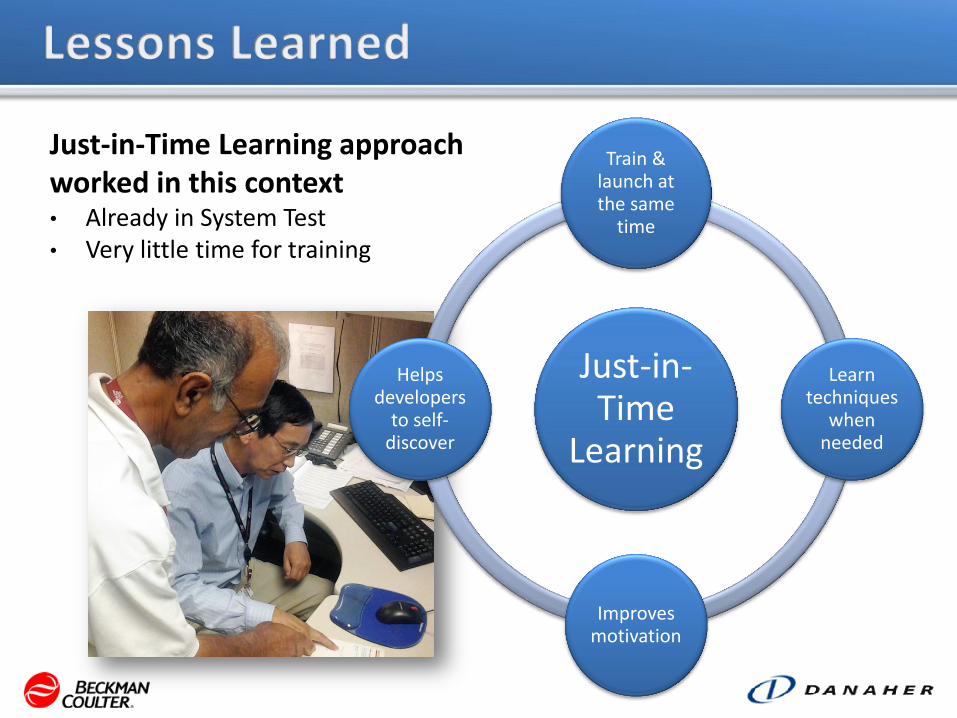
Just-in-Time
Learning
Train & launch at the same
time
Learn techniques
when needed
Improves motivation
Helps developers
to self-discover
Just-in-Time Learning approach worked in this context • Already in System Test • Very little time for training
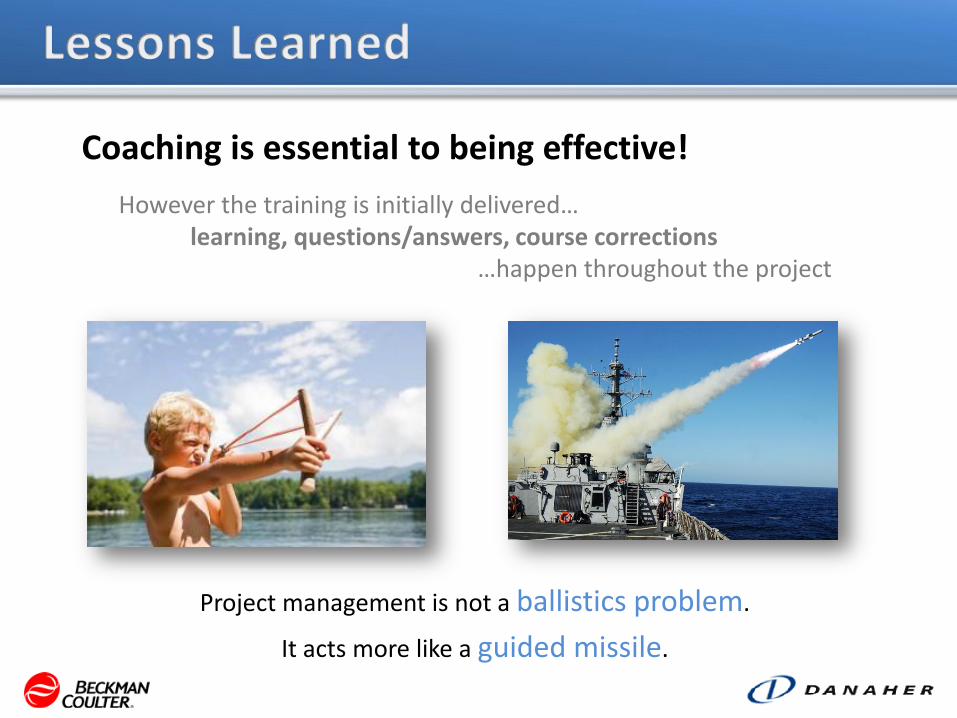
Coaching is essential to being effective! However the training is initially delivered…
learning, questions/answers, course corrections …happen throughout the project
Project management is not a ballistics problem.
It acts more like a guided missile.

0
10
20
30
40
50
60
70
80
90
100
Non-TSPNew
System
DxI 4.4(22 KLOC)
DxI 4.5(26 KLOC)
RMS(9 KLOC)
DxLab(2 KLOC)
SMS(1135KLOC)
DxH(1200KLOC)
NewSystem(>500KLOC)
Hardware(3 Boards)
Pe
rce
nt
of
Ave
rage
No
n-T
SP P
roje
ct
Defects/KLOC as Percent of Non-TSP Average Project (100% = Average Defects/KLOC for Non-TSP Projects)
First-time use of TSP showing 5 to 100 times improvement
3 Electrical boards showing no defects Est.
No
n-T
SP
20% = 5 times improvement
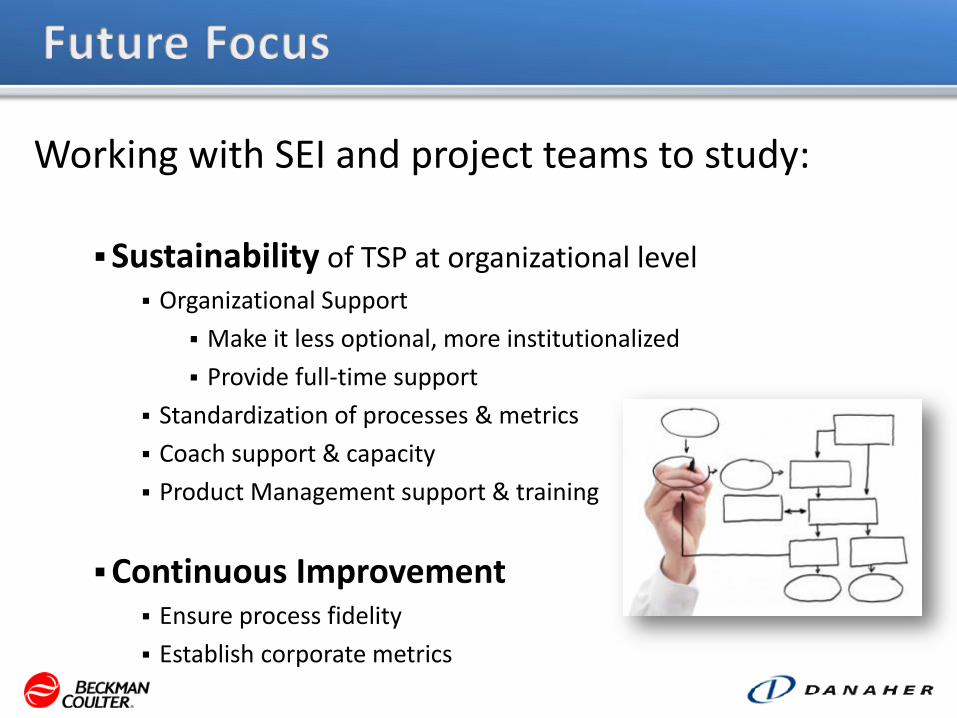
Working with SEI and project teams to study:
Sustainability of TSP at organizational level
Organizational Support
Make it less optional, more institutionalized
Provide full-time support
Standardization of processes & metrics
Coach support & capacity
Product Management support & training
Continuous Improvement Ensure process fidelity
Establish corporate metrics
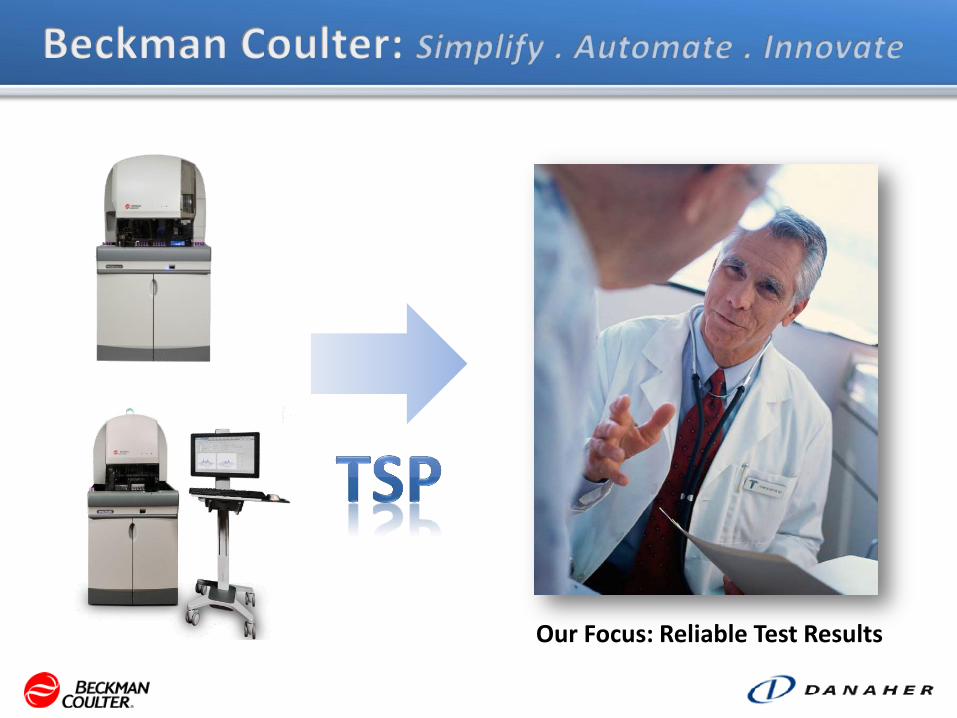
Our Focus: Reliable Test Results

Carl Wyrwa (CW Software Solutions, Inc.) & Lourdes Villanueva (Beckman Coulter)
Uber coaches
Alan Willett (Oxseeker, Inc.)
Helped develop our customized approach
Jim Over (SEI)
Supporting our studies on Improvements and Sustainability
JC Urbina (Beckman Coulter)
Team Lead of DxH
Andrea Britton (Beckman Coulter)
Team Lead of SMS

The
Te
am!
Chaska, MN
Mia
mi,
FL
Bre
a, C
A