hcm unsignalized intersection capacity analysis 1: red ... · hcm unsignalized intersection...
TRANSCRIPT
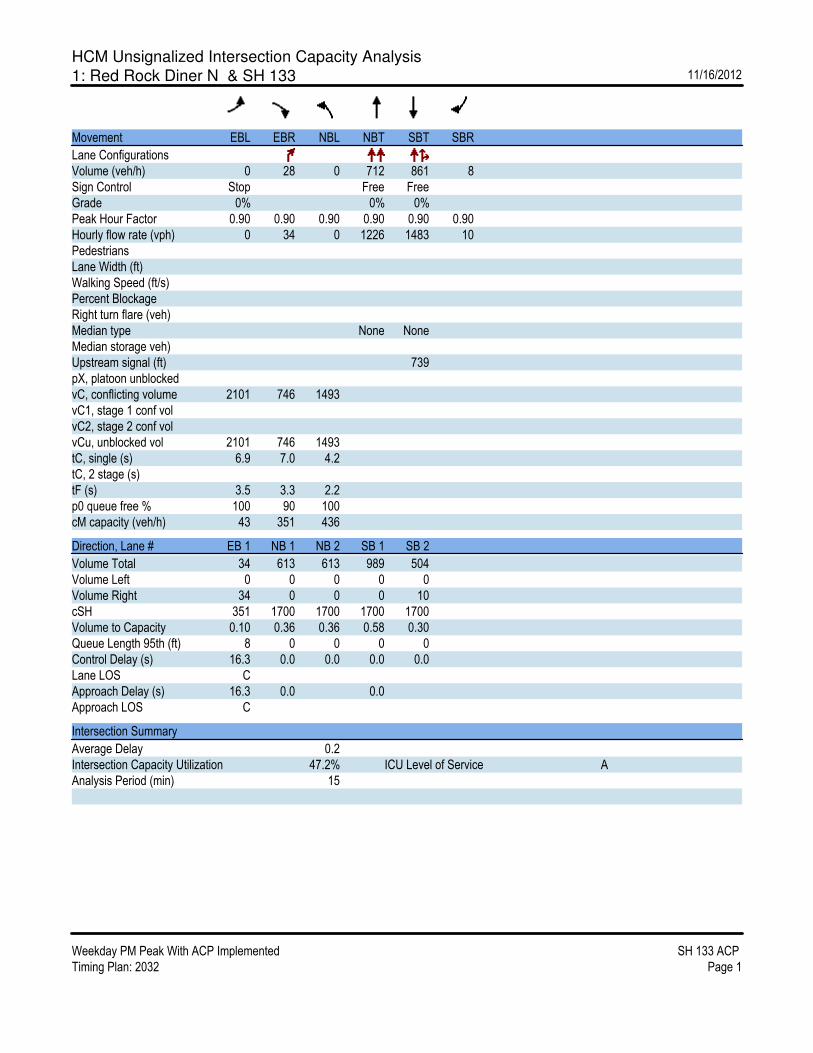
HCM Unsignalized Intersection Capacity Analysis
1: Red Rock Diner N & SH 133 11/16/2012
Weekday PM Peak With ACP Implemented SH 133 ACP
Timing Plan: 2032 Page 1
Movement EBL EBR NBL NBT SBT SBR
Lane Configurations
Volume (veh/h) 0 28 0 712 861 8
Sign Control Stop Free Free
Grade 0% 0% 0%
Peak Hour Factor 0.90 0.90 0.90 0.90 0.90 0.90
Hourly flow rate (vph) 0 34 0 1226 1483 10
Pedestrians
Lane Width (ft)
Walking Speed (ft/s)
Percent Blockage
Right turn flare (veh)
Median type None None
Median storage veh)
Upstream signal (ft) 739
pX, platoon unblocked
vC, conflicting volume 2101 746 1493
vC1, stage 1 conf vol
vC2, stage 2 conf vol
vCu, unblocked vol 2101 746 1493
tC, single (s) 6.9 7.0 4.2
tC, 2 stage (s)
tF (s) 3.5 3.3 2.2
p0 queue free % 100 90 100
cM capacity (veh/h) 43 351 436
Direction, Lane # EB 1 NB 1 NB 2 SB 1 SB 2
Volume Total 34 613 613 989 504
Volume Left 0 0 0 0 0
Volume Right 34 0 0 0 10
cSH 351 1700 1700 1700 1700
Volume to Capacity 0.10 0.36 0.36 0.58 0.30
Queue Length 95th (ft) 8 0 0 0 0
Control Delay (s) 16.3 0.0 0.0 0.0 0.0
Lane LOS C
Approach Delay (s) 16.3 0.0 0.0
Approach LOS C
Intersection Summary
Average Delay 0.2
Intersection Capacity Utilization 47.2% ICU Level of Service A
Analysis Period (min) 15

HCM Unsignalized Intersection Capacity Analysis
3: Cowen Dr & SH 133 11/16/2012
Weekday PM Peak With ACP Implemented SH 133 ACP
Timing Plan: 2032 Page 2
Movement EBL EBT EBR WBL WBT WBR NBL NBT NBR SBL SBT SBR
Lane Configurations
Volume (veh/h) 11 1 20 32 0 81 49 630 45 81 802 23
Sign Control Stop Stop Free Free
Grade 0% 0% 0% 0%
Peak Hour Factor 0.90 0.90 0.90 0.90 0.90 0.90 0.90 0.90 0.90 0.90 0.90 0.90
Hourly flow rate (vph) 13 1 24 55 0 140 60 1085 78 140 1381 28
Pedestrians
Lane Width (ft)
Walking Speed (ft/s)
Percent Blockage
Right turn flare (veh)
Median type TWLTL None
Median storage veh) 2
Upstream signal (ft) 1039 1029
pX, platoon unblocked 0.91 0.91 0.91 0.91 0.91 0.91
vC, conflicting volume 2476 2957 705 2199 2893 542 1409 1162
vC1, stage 1 conf vol 1674 1674 1205 1205
vC2, stage 2 conf vol 802 1282 995 1688
vCu, unblocked vol 2425 2952 705 2121 2883 301 1409 982
tC, single (s) 7.6 6.6 7.0 7.6 6.6 7.0 4.2 4.2
tC, 2 stage (s) 6.6 5.6 6.6 5.6
tF (s) 3.5 4.0 3.3 3.5 4.0 3.3 2.2 2.2
p0 queue free % 79 98 93 47 100 78 87 78
cM capacity (veh/h) 65 64 374 103 50 627 470 625
Direction, Lane # EB 1 EB 2 WB 1 WB 2 NB 1 NB 2 NB 3 NB 4 SB 1 SB 2 SB 3
Volume Total 13 26 55 140 60 542 542 78 140 921 489
Volume Left 13 0 55 0 60 0 0 0 140 0 0
Volume Right 0 24 0 140 0 0 0 78 0 0 28
cSH 65 304 103 627 470 1700 1700 1700 625 1700 1700
Volume to Capacity 0.21 0.08 0.53 0.22 0.13 0.32 0.32 0.05 0.22 0.54 0.29
Queue Length 95th (ft) 18 7 61 21 11 0 0 0 21 0 0
Control Delay (s) 74.9 17.9 74.2 12.4 13.8 0.0 0.0 0.0 12.4 0.0 0.0
Lane LOS F C F B B B
Approach Delay (s) 37.5 29.9 0.7 1.1
Approach LOS E D
Intersection Summary
Average Delay 3.3
Intersection Capacity Utilization 58.6% ICU Level of Service B
Analysis Period (min) 15

HCM Unsignalized Intersection Capacity Analysis
4: Cold Well Banker & SH 133 11/16/2012
Weekday PM Peak With ACP Implemented SH 133 ACP
Timing Plan: 2032 Page 3
Movement WBL WBR NBT NBR SBL SBT
Lane Configurations
Volume (veh/h) 0 12 702 4 0 860
Sign Control Stop Free Free
Grade 0% 0% 0%
Peak Hour Factor 0.90 0.90 0.90 0.90 0.90 0.90
Hourly flow rate (vph) 0 15 1209 5 0 1481
Pedestrians
Lane Width (ft)
Walking Speed (ft/s)
Percent Blockage
Right turn flare (veh)
Median type TWLTL TWLTL
Median storage veh) 2 2
Upstream signal (ft) 729
pX, platoon unblocked 0.88 0.88 0.88
vC, conflicting volume 1952 607 1214
vC1, stage 1 conf vol 1211
vC2, stage 2 conf vol 741
vCu, unblocked vol 1804 269 961
tC, single (s) 6.9 7.0 4.2
tC, 2 stage (s) 5.9
tF (s) 3.5 3.3 2.2
p0 queue free % 100 98 100
cM capacity (veh/h) 238 634 613
Direction, Lane # WB 1 NB 1 NB 2 SB 1 SB 2
Volume Total 15 806 408 741 741
Volume Left 0 0 0 0 0
Volume Right 15 0 5 0 0
cSH 634 1700 1700 1700 1700
Volume to Capacity 0.02 0.47 0.24 0.44 0.44
Queue Length 95th (ft) 2 0 0 0 0
Control Delay (s) 10.8 0.0 0.0 0.0 0.0
Lane LOS B
Approach Delay (s) 10.8 0.0 0.0
Approach LOS B
Intersection Summary
Average Delay 0.1
Intersection Capacity Utilization 40.2% ICU Level of Service A
Analysis Period (min) 15

HCM Unsignalized Intersection Capacity Analysis
5: The Alpine & SH 133 11/16/2012
Weekday PM Peak With ACP Implemented SH 133 ACP
Timing Plan: 2032 Page 4
Movement WBL WBR NBT NBR SBL SBT
Lane Configurations
Volume (veh/h) 0 22 684 30 0 861
Sign Control Stop Free Free
Grade 0% 0% 0%
Peak Hour Factor 0.90 0.90 0.90 0.90 0.90 0.90
Hourly flow rate (vph) 0 27 1178 37 0 1483
Pedestrians
Lane Width (ft)
Walking Speed (ft/s)
Percent Blockage
Right turn flare (veh)
Median type TWLTL TWLTL
Median storage veh) 2 2
Upstream signal (ft) 349
pX, platoon unblocked 0.87 0.87 0.87
vC, conflicting volume 1938 607 1215
vC1, stage 1 conf vol 1196
vC2, stage 2 conf vol 741
vCu, unblocked vol 1779 250 948
tC, single (s) 6.9 7.0 4.2
tC, 2 stage (s) 5.9
tF (s) 3.5 3.3 2.2
p0 queue free % 100 96 100
cM capacity (veh/h) 244 647 616
Direction, Lane # WB 1 NB 1 NB 2 SB 1 SB 2
Volume Total 27 785 429 741 741
Volume Left 0 0 0 0 0
Volume Right 27 0 37 0 0
cSH 647 1700 1700 1700 1700
Volume to Capacity 0.04 0.46 0.25 0.44 0.44
Queue Length 95th (ft) 3 0 0 0 0
Control Delay (s) 10.8 0.0 0.0 0.0 0.0
Lane LOS B
Approach Delay (s) 10.8 0.0 0.0
Approach LOS B
Intersection Summary
Average Delay 0.1
Intersection Capacity Utilization 40.4% ICU Level of Service A
Analysis Period (min) 15

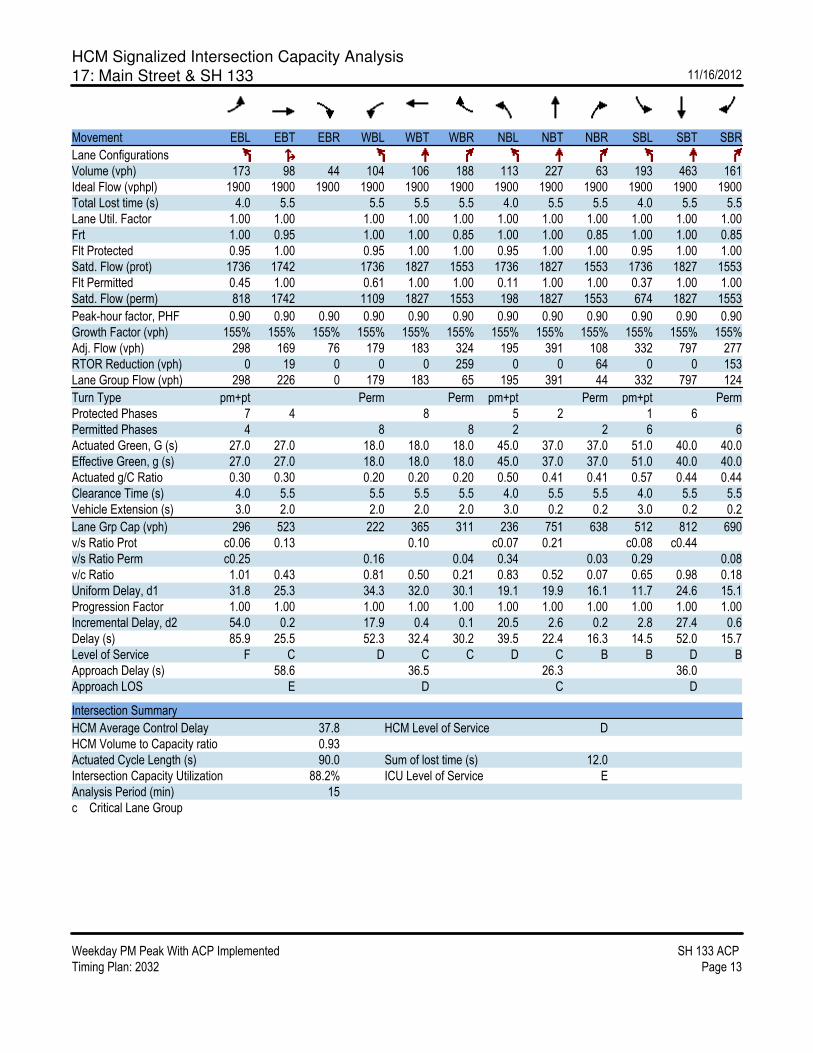
HCM Signalized Intersection Capacity Analysis
6: Village Rd & SH 133 11/16/2012
Weekday PM Peak With ACP Implemented SH 133 ACP
Timing Plan: 2032 Page 5
Movement EBL EBT EBR WBL WBT WBR NBL NBT NBR SBL SBT SBR
Lane Configurations
Volume (vph) 10 7 39 83 4 61 6 643 66 82 765 23
Ideal Flow (vphpl) 1900 1900 1900 1900 1900 1900 1900 1900 1900 1900 1900 1900
Total Lost time (s) 4.5 4.5 4.5 5.0 5.0 5.0 5.0 5.0 5.0
Lane Util. Factor 1.00 1.00 1.00 1.00 0.95 1.00 1.00 0.95 1.00
Frt 0.91 1.00 0.85 1.00 1.00 0.85 1.00 1.00 0.85
Flt Protected 0.99 0.95 1.00 0.95 1.00 1.00 0.95 1.00 1.00
Satd. Flow (prot) 1640 1744 1553 1736 3471 1553 1736 3471 1553
Flt Permitted 0.93 0.64 1.00 0.17 1.00 1.00 0.23 1.00 1.00
Satd. Flow (perm) 1547 1177 1553 317 3471 1553 418 3471 1553
Peak-hour factor, PHF 0.90 0.90 0.90 0.90 0.90 0.90 0.90 0.90 0.90 0.90 0.90 0.90
Growth Factor (vph) 155% 155% 155% 155% 155% 155% 155% 155% 155% 155% 155% 155%
Adj. Flow (vph) 17 12 67 143 7 105 10 1107 114 141 1318 40
RTOR Reduction (vph) 0 55 0 0 0 86 0 0 28 0 0 8
Lane Group Flow (vph) 0 41 0 0 150 19 10 1107 86 141 1318 32
Turn Type Perm Perm Perm Perm Perm Perm Perm
Protected Phases 4 8 2 6
Permitted Phases 4 8 8 2 2 6 6
Actuated Green, G (s) 17.9 17.9 17.9 72.6 72.6 72.6 72.6 72.6 72.6
Effective Green, g (s) 17.9 17.9 17.9 72.6 72.6 72.6 72.6 72.6 72.6
Actuated g/C Ratio 0.18 0.18 0.18 0.73 0.73 0.73 0.73 0.73 0.73
Clearance Time (s) 4.5 4.5 4.5 5.0 5.0 5.0 5.0 5.0 5.0
Vehicle Extension (s) 3.5 3.5 3.5 0.2 0.2 0.2 0.2 0.2 0.2
Lane Grp Cap (vph) 277 211 278 230 2520 1127 303 2520 1127
v/s Ratio Prot 0.32 c0.38
v/s Ratio Perm 0.03 c0.13 0.01 0.03 0.06 0.34 0.02
v/c Ratio 0.15 0.71 0.07 0.04 0.44 0.08 0.47 0.52 0.03
Uniform Delay, d1 34.6 38.6 34.1 3.9 5.5 4.0 5.7 6.1 3.8
Progression Factor 1.00 1.00 1.00 1.00 1.00 1.00 0.82 0.69 0.46
Incremental Delay, d2 0.3 11.1 0.1 0.4 0.6 0.1 3.7 0.6 0.0
Delay (s) 34.9 49.7 34.2 4.2 6.1 4.1 8.3 4.7 1.8
Level of Service C D C A A A A A A
Approach Delay (s) 34.9 43.3 5.9 5.0
Approach LOS C D A A
Intersection Summary
HCM Average Control Delay 9.4 HCM Level of Service A
HCM Volume to Capacity ratio 0.56
Actuated Cycle Length (s) 100.0 Sum of lost time (s) 9.5
Intersection Capacity Utilization 83.1% ICU Level of Service E
Analysis Period (min) 15
c Critical Lane Group

HCM Unsignalized Intersection Capacity Analysis
7: Dolores Way & SH 133 11/16/2012
Weekday PM Peak With ACP Implemented SH 133 ACP
Timing Plan: 2032 Page 6
Movement EBL EBT EBR WBL WBT WBR NBL NBT NBR SBL SBT SBR
Lane Configurations
Volume (veh/h) 0 0 5 1 0 0 40 715 2 3 859 5
Sign Control Stop Stop Free Free
Grade 0% 0% 0% 0%
Peak Hour Factor 0.90 0.90 0.90 0.90 0.90 0.90 0.90 0.90 0.90 0.90 0.90 0.90
Hourly flow rate (vph) 0 0 9 1 0 0 69 1231 2 4 1479 9
Pedestrians
Lane Width (ft)
Walking Speed (ft/s)
Percent Blockage
Right turn flare (veh)
Median type None TWLTL
Median storage veh) 2
Upstream signal (ft) 786
pX, platoon unblocked 0.83 0.83 0.83 0.83 0.83 0.83
vC, conflicting volume 2244 2863 744 2126 2866 617 1488 1234
vC1, stage 1 conf vol 1491 1491 1370 1370
vC2, stage 2 conf vol 753 1372 756 1495
vCu, unblocked vol 2085 2834 269 1942 2837 617 1170 1234
tC, single (s) 7.6 6.6 7.0 7.6 6.6 7.0 4.2 4.2
tC, 2 stage (s) 6.6 5.6 6.6 5.6
tF (s) 3.5 4.0 3.3 3.5 4.0 3.3 2.2 2.2
p0 queue free % 100 100 99 99 100 100 86 99
cM capacity (veh/h) 141 128 597 123 107 428 481 550
Direction, Lane # EB 1 WB 1 NB 1 NB 2 NB 3 SB 1 SB 2 SB 3
Volume Total 9 1 69 821 413 4 986 502
Volume Left 0 1 69 0 0 4 0 0
Volume Right 9 0 0 0 2 0 0 9
cSH 597 123 481 1700 1700 550 1700 1700
Volume to Capacity 0.01 0.01 0.14 0.48 0.24 0.01 0.58 0.30
Queue Length 95th (ft) 1 1 12 0 0 1 0 0
Control Delay (s) 11.1 34.6 13.7 0.0 0.0 11.6 0.0 0.0
Lane LOS B D B B
Approach Delay (s) 11.1 34.6 0.7 0.0
Approach LOS B D
Intersection Summary
Average Delay 0.4
Intersection Capacity Utilization 53.8% ICU Level of Service A
Analysis Period (min) 15

HCM Unsignalized Intersection Capacity Analysis
8: Industry Way & SH 133 11/16/2012
Weekday PM Peak With ACP Implemented SH 133 ACP
Timing Plan: 2032 Page 7
Movement EBL EBT EBR WBL WBT WBR NBL NBT NBR SBL SBT SBR
Right Turn Channelized
Volume (veh/h) 47 0 62 19 0 31 0 682 29 26 820 29
Peak Hour Factor 0.90 0.90 0.90 0.90 0.90 0.90 0.90 0.90 0.90 0.90 0.90 0.90
Hourly flow rate (vph) 81 0 107 23 0 38 0 1175 35 32 1412 50
Approach Volume (veh/h) 188 61 1210 1494
Crossing Volume (veh/h) 1467# 1256# 113 23
High Capacity (veh/h) 422 504 1268 1360
High v/c (veh/h) 0.44 0.12 0.95 1.10
Low Capacity (veh/h) 314 382 1055 1139
Low v/c (veh/h) 0.60 0.16 1.15 1.31
Intersection Summary
Maximum v/c High 1.10
Maximum v/c Low 1.31
Intersection Capacity Utilization 73.7% ICU Level of Service D
# Crossing flow exceeds 1200, method is not applicable

HCM Unsignalized Intersection Capacity Analysis
9: Crystal River Access 1 & SH 133 11/16/2012
Weekday PM Peak With ACP Implemented SH 133 ACP
Timing Plan: 2032 Page 8
Movement EBL EBR NBL NBT SBT SBR
Lane Configurations
Volume (veh/h) 0 0 0 700 898 14
Sign Control Stop Free Free
Grade 0% 0% 0%
Peak Hour Factor 0.90 0.90 0.90 0.90 0.90 0.90
Hourly flow rate (vph) 0 0 0 1206 1547 16
Pedestrians
Lane Width (ft)
Walking Speed (ft/s)
Percent Blockage
Right turn flare (veh)
Median type None None
Median storage veh)
Upstream signal (ft)
pX, platoon unblocked
vC, conflicting volume 2157 781 1562
vC1, stage 1 conf vol
vC2, stage 2 conf vol
vCu, unblocked vol 2157 781 1562
tC, single (s) 6.9 7.0 4.2
tC, 2 stage (s)
tF (s) 3.5 3.3 2.2
p0 queue free % 100 100 100
cM capacity (veh/h) 40 333 410
Direction, Lane # EB 1 NB 1 NB 2 SB 1 SB 2
Volume Total 0 603 603 1031 531
Volume Left 0 0 0 0 0
Volume Right 0 0 0 0 16
cSH 1700 1700 1700 1700 1700
Volume to Capacity 0.00 0.35 0.35 0.61 0.31
Queue Length 95th (ft) 0 0 0 0 0
Control Delay (s) 0.0 0.0 0.0 0.0 0.0
Lane LOS A
Approach Delay (s) 0.0 0.0 0.0
Approach LOS A
Intersection Summary
Average Delay 0.0
Intersection Capacity Utilization 42.3% ICU Level of Service A
Analysis Period (min) 15

HCM Unsignalized Intersection Capacity Analysis
10: Crystal River Access 2 & SH 133 11/16/2012
Weekday PM Peak With ACP Implemented SH 133 ACP
Timing Plan: 2032 Page 9
Movement EBL EBT EBR WBL WBT WBR NBL NBT NBR SBL SBT SBR
Right Turn Channelized
Volume (veh/h) 80 22 66 36 23 65 0 602 55 42 828 66
Peak Hour Factor 0.90 0.90 0.90 0.90 0.90 0.90 0.90 0.90 0.90 0.90 0.90 0.90
Hourly flow rate (vph) 89 24 73 44 26 79 0 1037 67 51 1426 73
Approach Volume (veh/h) 187 149 1104 1551
Crossing Volume (veh/h) 1521# 1126 165 70
High Capacity (veh/h) 403 561 1217 1312
High v/c (veh/h) 0.46 0.27 0.91 1.18
Low Capacity (veh/h) 298 430 1009 1095
Low v/c (veh/h) 0.63 0.35 1.09 1.42
Intersection Summary
Maximum v/c High 1.18
Maximum v/c Low 1.42
Intersection Capacity Utilization 87.7% ICU Level of Service E
# Crossing flow exceeds 1200, method is not applicable

HCM Unsignalized Intersection Capacity Analysis
12: Crystal River Access 3 & SH 133 11/16/2012
Weekday PM Peak With ACP Implemented SH 133 ACP
Timing Plan: 2032 Page 10
Movement EBL EBT EBR WBL WBT WBR NBL NBT NBR SBL SBT SBR
Right Turn Channelized
Volume (veh/h) 147 9 12 20 9 14 144 541 10 17 870 22
Peak Hour Factor 0.90 0.90 0.90 0.90 0.90 0.90 0.90 0.90 0.90 0.90 0.90 0.90
Hourly flow rate (vph) 163 10 21 24 10 17 160 932 12 21 1498 24
Approach Volume (veh/h) 194 52 1104 1544
Crossing Volume (veh/h) 1544# 1255# 194 194
High Capacity (veh/h) 396 504 1190 1189
High v/c (veh/h) 0.49 0.10 0.93 1.30
Low Capacity (veh/h) 292 382 984 984
Low v/c (veh/h) 0.66 0.13 1.12 1.57
Intersection Summary
Maximum v/c High 1.30
Maximum v/c Low 1.57
Intersection Capacity Utilization 91.0% ICU Level of Service F
# Crossing flow exceeds 1200, method is not applicable

HCM Unsignalized Intersection Capacity Analysis
15: Crystal River Access 4 & SH 133 11/16/2012
Weekday PM Peak With ACP Implemented SH 133 ACP
Timing Plan: 2032 Page 11
Movement EBL EBT EBR WBL WBT WBR NBL NBT NBR SBL SBT SBR
Lane Configurations
Volume (veh/h) 0 0 82 0 0 18 0 627 6 14 804 123
Sign Control Stop Stop Free Free
Grade 0% 0% 0% 0%
Peak Hour Factor 0.90 0.90 0.90 0.90 0.90 0.90 0.90 0.90 0.90 0.90 0.90 0.90
Hourly flow rate (vph) 0 0 91 0 0 22 0 1080 7 17 1385 137
Pedestrians
Lane Width (ft)
Walking Speed (ft/s)
Percent Blockage
Right turn flare (veh)
Median type TWLTL None
Median storage veh) 2
Upstream signal (ft) 581
pX, platoon unblocked
vC, conflicting volume 2049 2574 761 1901 2639 544 1521 1087
vC1, stage 1 conf vol 1487 1487 1084 1084
vC2, stage 2 conf vol 562 1087 818 1556
vCu, unblocked vol 2049 2574 761 1901 2639 544 1521 1087
tC, single (s) 7.6 6.6 7.0 7.6 6.6 7.0 4.2 4.2
tC, 2 stage (s) 6.6 5.6 6.6 5.6
tF (s) 3.5 4.0 3.3 3.5 4.0 3.3 2.2 2.2
p0 queue free % 100 100 73 100 100 95 100 97
cM capacity (veh/h) 117 144 344 161 138 478 425 626
Direction, Lane # EB 1 WB 1 NB 1 NB 2 SB 1 SB 2
Volume Total 91 22 720 367 709 829
Volume Left 0 0 0 0 17 0
Volume Right 91 22 0 7 0 137
cSH 344 478 1700 1700 626 1700
Volume to Capacity 0.27 0.05 0.42 0.22 0.03 0.49
Queue Length 95th (ft) 26 4 0 0 2 0
Control Delay (s) 19.2 12.9 0.0 0.0 0.8 0.0
Lane LOS C B A
Approach Delay (s) 19.2 12.9 0.0 0.3
Approach LOS C B
Intersection Summary
Average Delay 0.9
Intersection Capacity Utilization 52.7% ICU Level of Service A
Analysis Period (min) 15

HCM Unsignalized Intersection Capacity Analysis
16: Remax & SH 133 11/16/2012
Weekday PM Peak With ACP Implemented SH 133 ACP
Timing Plan: 2032 Page 12
Movement EBL EBT EBR WBL WBT WBR NBL NBT NBR SBL SBT SBR
Lane Configurations
Volume (veh/h) 0 0 0 0 0 0 0 576 0 0 820 34
Sign Control Stop Stop Free Free
Grade 0% 0% 0% 0%
Peak Hour Factor 0.90 0.90 0.90 0.90 0.90 0.90 0.90 0.90 0.90 0.90 0.90 0.90
Hourly flow rate (vph) 0 0 0 0 0 0 0 992 0 0 1412 42
Pedestrians
Lane Width (ft)
Walking Speed (ft/s)
Percent Blockage
Right turn flare (veh)
Median type None TWLTL
Median storage veh) 2
Upstream signal (ft) 199
pX, platoon unblocked
vC, conflicting volume 1929 2425 727 1698 2446 496 1454 992
vC1, stage 1 conf vol 1433 1433 992 992
vC2, stage 2 conf vol 496 992 706 1454
vCu, unblocked vol 1929 2425 727 1698 2446 496 1454 992
tC, single (s) 7.6 6.6 7.0 7.6 6.6 7.0 4.2 4.2
tC, 2 stage (s) 6.6 5.6 6.6 5.6
tF (s) 3.5 4.0 3.3 3.5 4.0 3.3 2.2 2.2
p0 queue free % 100 100 100 100 100 100 100 100
cM capacity (veh/h) 132 162 362 217 159 514 452 681
Direction, Lane # NB 1 NB 2 SB 1 SB 2
Volume Total 661 331 941 512
Volume Left 0 0 0 0
Volume Right 0 0 0 42
cSH 1700 1700 1700 1700
Volume to Capacity 0.39 0.19 0.55 0.30
Queue Length 95th (ft) 0 0 0 0
Control Delay (s) 0.0 0.0 0.0 0.0
Lane LOS
Approach Delay (s) 0.0 0.0
Approach LOS
Intersection Summary
Average Delay 0.0
Intersection Capacity Utilization 39.7% ICU Level of Service A
Analysis Period (min) 15
HCM Signalized Intersection Capacity Analysis
17: Main Street & SH 133 11/16/2012
Weekday PM Peak With ACP Implemented SH 133 ACP
Timing Plan: 2032 Page 13
Movement EBL EBT EBR WBL WBT WBR NBL NBT NBR SBL SBT SBR
Lane Configurations
Volume (vph) 173 98 44 104 106 188 113 227 63 193 463 161
Ideal Flow (vphpl) 1900 1900 1900 1900 1900 1900 1900 1900 1900 1900 1900 1900
Total Lost time (s) 4.0 5.5 5.5 5.5 5.5 4.0 5.5 5.5 4.0 5.5 5.5
Lane Util. Factor 1.00 1.00 1.00 1.00 1.00 1.00 1.00 1.00 1.00 1.00 1.00
Frt 1.00 0.95 1.00 1.00 0.85 1.00 1.00 0.85 1.00 1.00 0.85
Flt Protected 0.95 1.00 0.95 1.00 1.00 0.95 1.00 1.00 0.95 1.00 1.00
Satd. Flow (prot) 1736 1742 1736 1827 1553 1736 1827 1553 1736 1827 1553
Flt Permitted 0.45 1.00 0.61 1.00 1.00 0.11 1.00 1.00 0.37 1.00 1.00
Satd. Flow (perm) 818 1742 1109 1827 1553 198 1827 1553 674 1827 1553
Peak-hour factor, PHF 0.90 0.90 0.90 0.90 0.90 0.90 0.90 0.90 0.90 0.90 0.90 0.90
Growth Factor (vph) 155% 155% 155% 155% 155% 155% 155% 155% 155% 155% 155% 155%
Adj. Flow (vph) 298 169 76 179 183 324 195 391 108 332 797 277
RTOR Reduction (vph) 0 19 0 0 0 259 0 0 64 0 0 153
Lane Group Flow (vph) 298 226 0 179 183 65 195 391 44 332 797 124
Turn Type pm+pt Perm Perm pm+pt Perm pm+pt Perm
Protected Phases 7 4 8 5 2 1 6
Permitted Phases 4 8 8 2 2 6 6
Actuated Green, G (s) 27.0 27.0 18.0 18.0 18.0 45.0 37.0 37.0 51.0 40.0 40.0
Effective Green, g (s) 27.0 27.0 18.0 18.0 18.0 45.0 37.0 37.0 51.0 40.0 40.0
Actuated g/C Ratio 0.30 0.30 0.20 0.20 0.20 0.50 0.41 0.41 0.57 0.44 0.44
Clearance Time (s) 4.0 5.5 5.5 5.5 5.5 4.0 5.5 5.5 4.0 5.5 5.5
Vehicle Extension (s) 3.0 2.0 2.0 2.0 2.0 3.0 0.2 0.2 3.0 0.2 0.2
Lane Grp Cap (vph) 296 523 222 365 311 236 751 638 512 812 690
v/s Ratio Prot c0.06 0.13 0.10 c0.07 0.21 c0.08 c0.44
v/s Ratio Perm c0.25 0.16 0.04 0.34 0.03 0.29 0.08
v/c Ratio 1.01 0.43 0.81 0.50 0.21 0.83 0.52 0.07 0.65 0.98 0.18
Uniform Delay, d1 31.8 25.3 34.3 32.0 30.1 19.1 19.9 16.1 11.7 24.6 15.1
Progression Factor 1.00 1.00 1.00 1.00 1.00 1.00 1.00 1.00 1.00 1.00 1.00
Incremental Delay, d2 54.0 0.2 17.9 0.4 0.1 20.5 2.6 0.2 2.8 27.4 0.6
Delay (s) 85.9 25.5 52.3 32.4 30.2 39.5 22.4 16.3 14.5 52.0 15.7
Level of Service F C D C C D C B B D B
Approach Delay (s) 58.6 36.5 26.3 36.0
Approach LOS E D C D
Intersection Summary
HCM Average Control Delay 37.8 HCM Level of Service D
HCM Volume to Capacity ratio 0.93
Actuated Cycle Length (s) 90.0 Sum of lost time (s) 12.0
Intersection Capacity Utilization 88.2% ICU Level of Service E
Analysis Period (min) 15
c Critical Lane Group
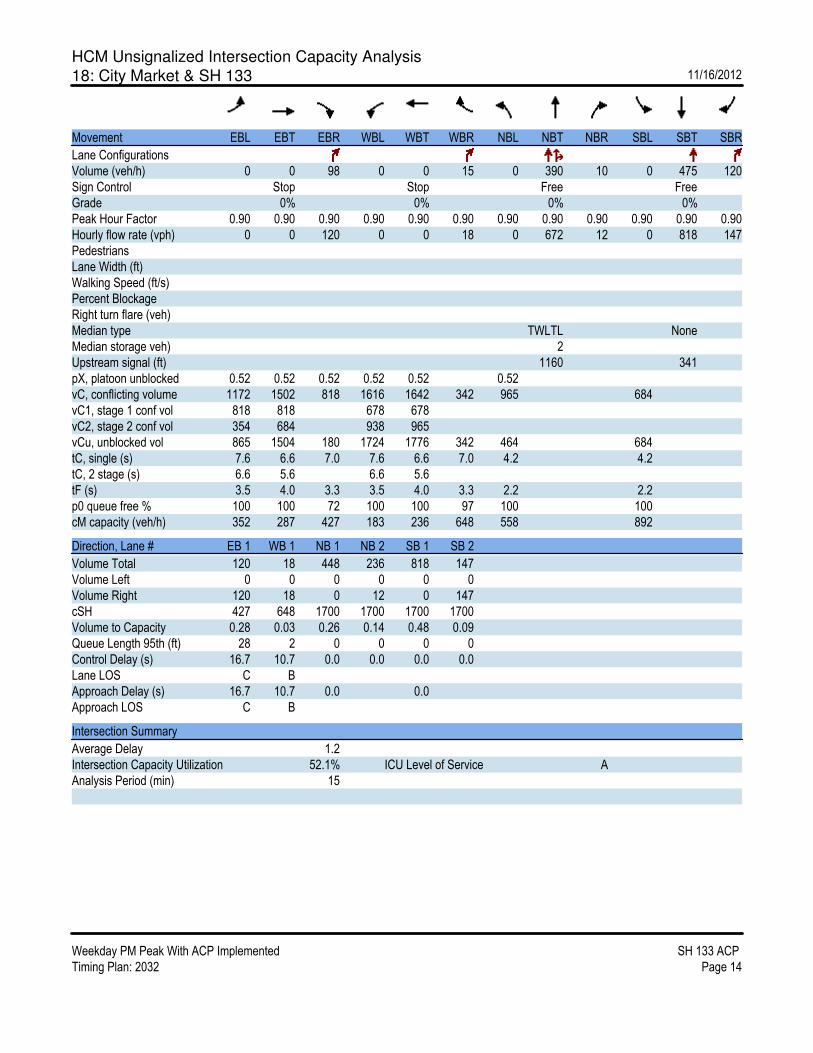
HCM Unsignalized Intersection Capacity Analysis
18: City Market & SH 133 11/16/2012
Weekday PM Peak With ACP Implemented SH 133 ACP
Timing Plan: 2032 Page 14
Movement EBL EBT EBR WBL WBT WBR NBL NBT NBR SBL SBT SBR
Lane Configurations
Volume (veh/h) 0 0 98 0 0 15 0 390 10 0 475 120
Sign Control Stop Stop Free Free
Grade 0% 0% 0% 0%
Peak Hour Factor 0.90 0.90 0.90 0.90 0.90 0.90 0.90 0.90 0.90 0.90 0.90 0.90
Hourly flow rate (vph) 0 0 120 0 0 18 0 672 12 0 818 147
Pedestrians
Lane Width (ft)
Walking Speed (ft/s)
Percent Blockage
Right turn flare (veh)
Median type TWLTL None
Median storage veh) 2
Upstream signal (ft) 1160 341
pX, platoon unblocked 0.52 0.52 0.52 0.52 0.52 0.52
vC, conflicting volume 1172 1502 818 1616 1642 342 965 684
vC1, stage 1 conf vol 818 818 678 678
vC2, stage 2 conf vol 354 684 938 965
vCu, unblocked vol 865 1504 180 1724 1776 342 464 684
tC, single (s) 7.6 6.6 7.0 7.6 6.6 7.0 4.2 4.2
tC, 2 stage (s) 6.6 5.6 6.6 5.6
tF (s) 3.5 4.0 3.3 3.5 4.0 3.3 2.2 2.2
p0 queue free % 100 100 72 100 100 97 100 100
cM capacity (veh/h) 352 287 427 183 236 648 558 892
Direction, Lane # EB 1 WB 1 NB 1 NB 2 SB 1 SB 2
Volume Total 120 18 448 236 818 147
Volume Left 0 0 0 0 0 0
Volume Right 120 18 0 12 0 147
cSH 427 648 1700 1700 1700 1700
Volume to Capacity 0.28 0.03 0.26 0.14 0.48 0.09
Queue Length 95th (ft) 28 2 0 0 0 0
Control Delay (s) 16.7 10.7 0.0 0.0 0.0 0.0
Lane LOS C B
Approach Delay (s) 16.7 10.7 0.0 0.0
Approach LOS C B
Intersection Summary
Average Delay 1.2
Intersection Capacity Utilization 52.1% ICU Level of Service A
Analysis Period (min) 15
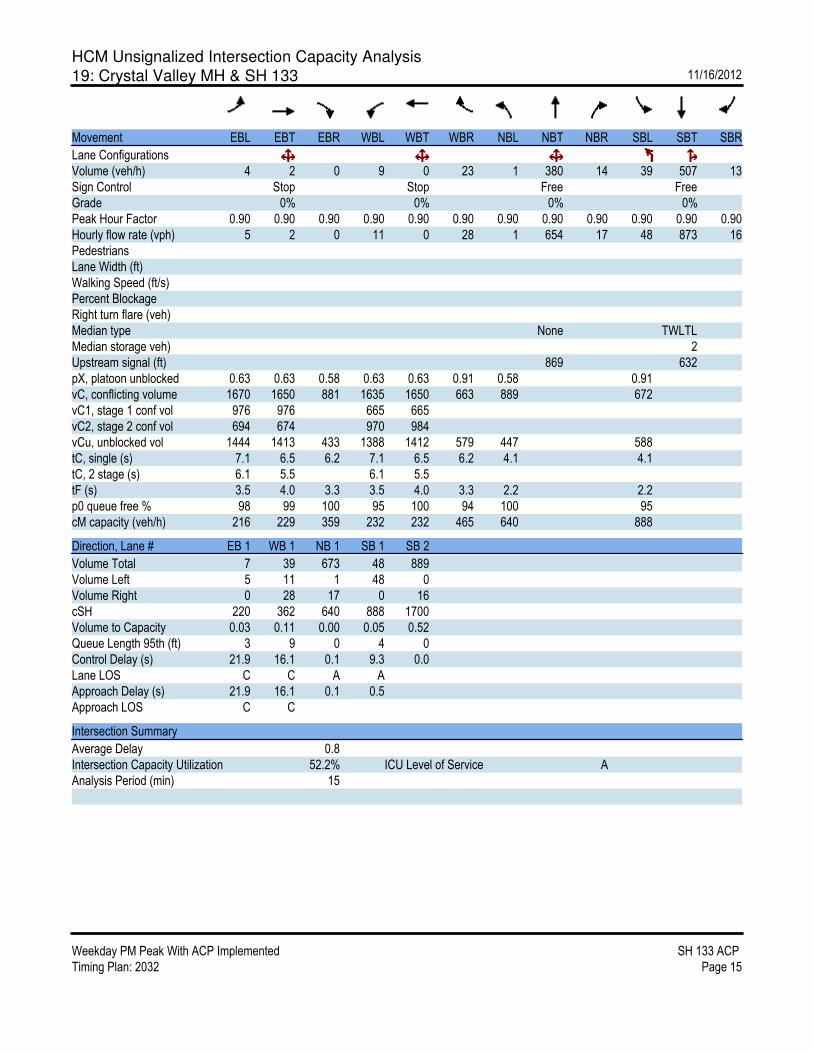
HCM Unsignalized Intersection Capacity Analysis
19: Crystal Valley MH & SH 133 11/16/2012
Weekday PM Peak With ACP Implemented SH 133 ACP
Timing Plan: 2032 Page 15
Movement EBL EBT EBR WBL WBT WBR NBL NBT NBR SBL SBT SBR
Lane Configurations
Volume (veh/h) 4 2 0 9 0 23 1 380 14 39 507 13
Sign Control Stop Stop Free Free
Grade 0% 0% 0% 0%
Peak Hour Factor 0.90 0.90 0.90 0.90 0.90 0.90 0.90 0.90 0.90 0.90 0.90 0.90
Hourly flow rate (vph) 5 2 0 11 0 28 1 654 17 48 873 16
Pedestrians
Lane Width (ft)
Walking Speed (ft/s)
Percent Blockage
Right turn flare (veh)
Median type None TWLTL
Median storage veh) 2
Upstream signal (ft) 869 632
pX, platoon unblocked 0.63 0.63 0.58 0.63 0.63 0.91 0.58 0.91
vC, conflicting volume 1670 1650 881 1635 1650 663 889 672
vC1, stage 1 conf vol 976 976 665 665
vC2, stage 2 conf vol 694 674 970 984
vCu, unblocked vol 1444 1413 433 1388 1412 579 447 588
tC, single (s) 7.1 6.5 6.2 7.1 6.5 6.2 4.1 4.1
tC, 2 stage (s) 6.1 5.5 6.1 5.5
tF (s) 3.5 4.0 3.3 3.5 4.0 3.3 2.2 2.2
p0 queue free % 98 99 100 95 100 94 100 95
cM capacity (veh/h) 216 229 359 232 232 465 640 888
Direction, Lane # EB 1 WB 1 NB 1 SB 1 SB 2
Volume Total 7 39 673 48 889
Volume Left 5 11 1 48 0
Volume Right 0 28 17 0 16
cSH 220 362 640 888 1700
Volume to Capacity 0.03 0.11 0.00 0.05 0.52
Queue Length 95th (ft) 3 9 0 4 0
Control Delay (s) 21.9 16.1 0.1 9.3 0.0
Lane LOS C C A A
Approach Delay (s) 21.9 16.1 0.1 0.5
Approach LOS C C
Intersection Summary
Average Delay 0.8
Intersection Capacity Utilization 52.2% ICU Level of Service A
Analysis Period (min) 15

HCM Unsignalized Intersection Capacity Analysis
20: Alley & SH 133 11/16/2012
Weekday PM Peak With ACP Implemented SH 133 ACP
Timing Plan: 2032 Page 16
Movement WBL WBR NBT NBR SBL SBT
Lane Configurations
Volume (veh/h) 0 7 388 0 0 511
Sign Control Stop Free Free
Grade 0% 0% 0%
Peak Hour Factor 0.90 0.90 0.90 0.90 0.90 0.90
Hourly flow rate (vph) 0 9 668 0 0 880
Pedestrians
Lane Width (ft)
Walking Speed (ft/s)
Percent Blockage
Right turn flare (veh)
Median type None None
Median storage veh)
Upstream signal (ft) 704 797
pX, platoon unblocked 0.69 0.91 0.91
vC, conflicting volume 1548 668 668
vC1, stage 1 conf vol
vC2, stage 2 conf vol
vCu, unblocked vol 1267 583 583
tC, single (s) 6.4 6.2 4.1
tC, 2 stage (s)
tF (s) 3.5 3.3 2.2
p0 queue free % 100 98 100
cM capacity (veh/h) 127 461 890
Direction, Lane # WB 1 NB 1 SB 1
Volume Total 9 668 880
Volume Left 0 0 0
Volume Right 9 0 0
cSH 461 1700 1700
Volume to Capacity 0.02 0.39 0.52
Queue Length 95th (ft) 1 0 0
Control Delay (s) 13.0 0.0 0.0
Lane LOS B
Approach Delay (s) 13.0 0.0 0.0
Approach LOS B
Intersection Summary
Average Delay 0.1
Intersection Capacity Utilization 45.0% ICU Level of Service A
Analysis Period (min) 15

HCM Unsignalized Intersection Capacity Analysis
21: Euclid Ave & SH 133 11/16/2012
Weekday PM Peak With ACP Implemented SH 133 ACP
Timing Plan: 2032 Page 17
Movement WBL WBR NBT NBR SBL SBT
Lane Configurations
Volume (veh/h) 7 13 375 4 18 499
Sign Control Stop Free Free
Grade 0% 0% 0%
Peak Hour Factor 0.90 0.90 0.90 0.90 0.90 0.90
Hourly flow rate (vph) 9 16 646 5 22 859
Pedestrians
Lane Width (ft)
Walking Speed (ft/s)
Percent Blockage
Right turn flare (veh)
Median type None None
Median storage veh)
Upstream signal (ft) 548 953
pX, platoon unblocked 0.72 0.89 0.89
vC, conflicting volume 1552 648 651
vC1, stage 1 conf vol
vC2, stage 2 conf vol
vCu, unblocked vol 1234 546 548
tC, single (s) 6.4 6.2 4.1
tC, 2 stage (s)
tF (s) 3.5 3.3 2.2
p0 queue free % 94 97 98
cM capacity (veh/h) 135 477 902
Direction, Lane # WB 1 NB 1 SB 1 SB 2
Volume Total 24 651 22 859
Volume Left 9 0 22 0
Volume Right 16 5 0 0
cSH 253 1700 902 1700
Volume to Capacity 0.10 0.38 0.02 0.51
Queue Length 95th (ft) 8 0 2 0
Control Delay (s) 20.8 0.0 9.1 0.0
Lane LOS C A
Approach Delay (s) 20.8 0.0 0.2
Approach LOS C
Intersection Summary
Average Delay 0.5
Intersection Capacity Utilization 50.7% ICU Level of Service A
Analysis Period (min) 15

HCM Unsignalized Intersection Capacity Analysis
23: Wells Fargo & SH 133 11/16/2012
Weekday PM Peak With ACP Implemented SH 133 ACP
Timing Plan: 2032 Page 18
Movement EBL EBR SET SER NWL NWT
Lane Configurations
Volume (veh/h) 0 22 484 20 0 375
Sign Control Stop Free Free
Grade 0% 0% 0%
Peak Hour Factor 0.90 0.90 0.90 0.90 0.90 0.90
Hourly flow rate (vph) 0 27 834 24 0 646
Pedestrians
Lane Width (ft)
Walking Speed (ft/s)
Percent Blockage
Right turn flare (veh)
Median type None None
Median storage veh)
Upstream signal (ft) 1226 275
pX, platoon unblocked 0.77 0.71 0.71
vC, conflicting volume 1479 834 858
vC1, stage 1 conf vol
vC2, stage 2 conf vol
vCu, unblocked vol 1118 561 595
tC, single (s) 6.4 6.2 4.1
tC, 2 stage (s)
tF (s) 3.5 3.3 2.2
p0 queue free % 100 93 100
cM capacity (veh/h) 175 371 689
Direction, Lane # EB 1 SE 1 SE 2 NW 1
Volume Total 27 834 24 646
Volume Left 0 0 0 0
Volume Right 27 0 24 0
cSH 371 1700 1700 1700
Volume to Capacity 0.07 0.49 0.01 0.38
Queue Length 95th (ft) 6 0 0 0
Control Delay (s) 15.4 0.0 0.0 0.0
Lane LOS C
Approach Delay (s) 15.4 0.0 0.0
Approach LOS C
Intersection Summary
Average Delay 0.3
Intersection Capacity Utilization 49.5% ICU Level of Service A
Analysis Period (min) 15

HCM Signalized Intersection Capacity Analysis
25: SH 133 & Crystal River Shopping Center 11/16/2012
Weekday PM Peak With ACP Implemented SH 133 ACP
Timing Plan: 2032 Page 19
Movement SEL SET SER NWL NWT NWR NEL NET NER SWL SWT SWR
Lane Configurations
Volume (vph) 66 360 105 38 279 14 94 3 33 31 2 56
Ideal Flow (vphpl) 1900 1900 1900 1900 1900 1900 1900 1900 1900 1900 1900 1900
Total Lost time (s) 5.5 5.5 5.5 5.5 5.5 5.5 5.5
Lane Util. Factor 1.00 1.00 1.00 1.00 1.00 1.00 1.00
Frt 1.00 1.00 0.85 1.00 0.99 0.97 0.91
Flt Protected 0.95 1.00 1.00 0.95 1.00 0.97 0.98
Satd. Flow (prot) 1736 1827 1553 1736 1814 1703 1643
Flt Permitted 0.44 1.00 1.00 0.36 1.00 0.69 0.85
Satd. Flow (perm) 800 1827 1553 664 1814 1220 1417
Peak-hour factor, PHF 0.90 0.90 0.90 0.90 0.90 0.90 0.90 0.90 0.90 0.90 0.90 0.90
Growth Factor (vph) 110% 155% 110% 110% 155% 155% 110% 110% 110% 155% 155% 155%
Adj. Flow (vph) 81 620 128 46 480 24 115 4 40 53 3 96
RTOR Reduction (vph) 0 0 43 0 1 0 0 17 0 0 78 0
Lane Group Flow (vph) 81 620 85 46 503 0 0 142 0 0 74 0
Turn Type Perm Perm Perm Perm Perm
Protected Phases 2 2 4 4
Permitted Phases 2 2 2 4 4
Actuated Green, G (s) 48.6 48.6 48.6 48.6 48.6 13.7 13.7
Effective Green, g (s) 48.6 48.6 48.6 48.6 48.6 13.7 13.7
Actuated g/C Ratio 0.66 0.66 0.66 0.66 0.66 0.19 0.19
Clearance Time (s) 5.5 5.5 5.5 5.5 5.5 5.5 5.5
Vehicle Extension (s) 3.0 3.0 3.0 3.0 3.0 3.0 3.0
Lane Grp Cap (vph) 530 1211 1030 440 1203 228 265
v/s Ratio Prot c0.34 0.28
v/s Ratio Perm 0.10 0.05 0.07 c0.12 0.05
v/c Ratio 0.15 0.51 0.08 0.10 0.42 0.62 0.28
Uniform Delay, d1 4.6 6.3 4.4 4.5 5.8 27.4 25.6
Progression Factor 1.00 1.00 1.00 1.00 1.00 1.00 1.00
Incremental Delay, d2 0.6 1.5 0.2 0.5 1.1 5.2 0.6
Delay (s) 5.2 7.8 4.6 4.9 6.8 32.6 26.1
Level of Service A A A A A C C
Approach Delay (s) 7.1 6.7 32.6 26.1
Approach LOS A A C C
Intersection Summary
HCM Average Control Delay 11.1 HCM Level of Service B
HCM Volume to Capacity ratio 0.54
Actuated Cycle Length (s) 73.3 Sum of lost time (s) 11.0
Intersection Capacity Utilization 61.2% ICU Level of Service B
Analysis Period (min) 15
c Critical Lane Group
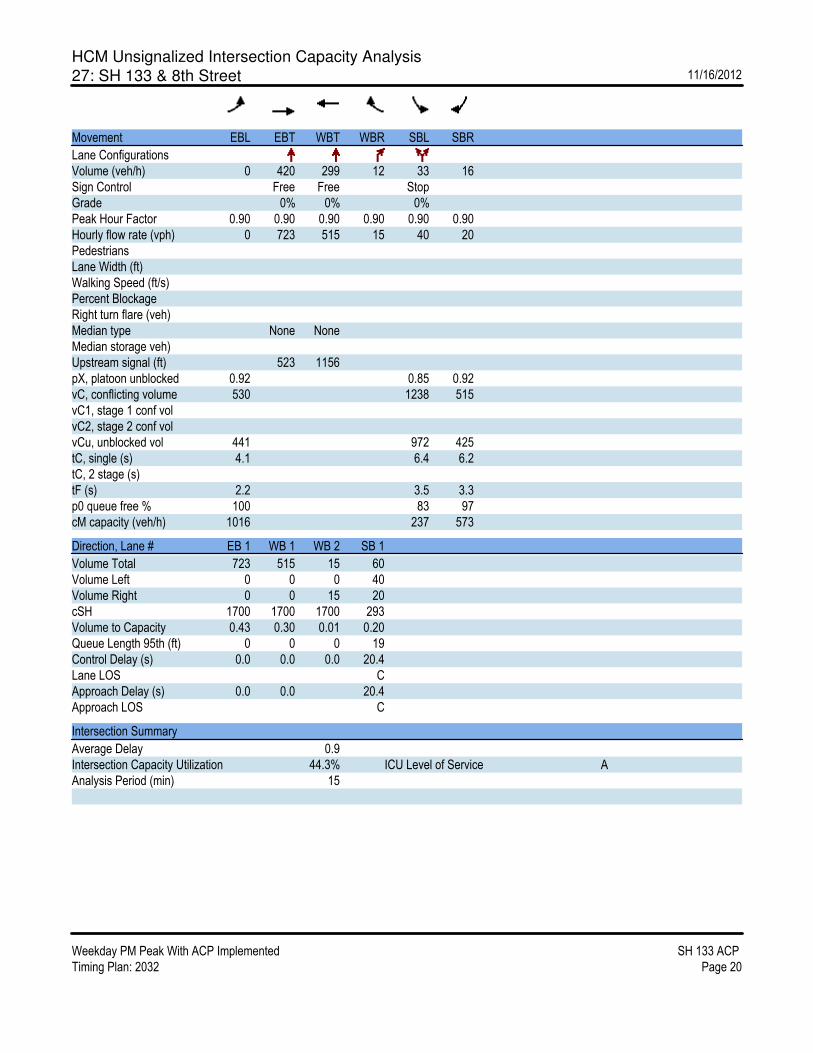
HCM Unsignalized Intersection Capacity Analysis
27: SH 133 & 8th Street 11/16/2012
Weekday PM Peak With ACP Implemented SH 133 ACP
Timing Plan: 2032 Page 20
Movement EBL EBT WBT WBR SBL SBR
Lane Configurations
Volume (veh/h) 0 420 299 12 33 16
Sign Control Free Free Stop
Grade 0% 0% 0%
Peak Hour Factor 0.90 0.90 0.90 0.90 0.90 0.90
Hourly flow rate (vph) 0 723 515 15 40 20
Pedestrians
Lane Width (ft)
Walking Speed (ft/s)
Percent Blockage
Right turn flare (veh)
Median type None None
Median storage veh)
Upstream signal (ft) 523 1156
pX, platoon unblocked 0.92 0.85 0.92
vC, conflicting volume 530 1238 515
vC1, stage 1 conf vol
vC2, stage 2 conf vol
vCu, unblocked vol 441 972 425
tC, single (s) 4.1 6.4 6.2
tC, 2 stage (s)
tF (s) 2.2 3.5 3.3
p0 queue free % 100 83 97
cM capacity (veh/h) 1016 237 573
Direction, Lane # EB 1 WB 1 WB 2 SB 1
Volume Total 723 515 15 60
Volume Left 0 0 0 40
Volume Right 0 0 15 20
cSH 1700 1700 1700 293
Volume to Capacity 0.43 0.30 0.01 0.20
Queue Length 95th (ft) 0 0 0 19
Control Delay (s) 0.0 0.0 0.0 20.4
Lane LOS C
Approach Delay (s) 0.0 0.0 20.4
Approach LOS C
Intersection Summary
Average Delay 0.9
Intersection Capacity Utilization 44.3% ICU Level of Service A
Analysis Period (min) 15
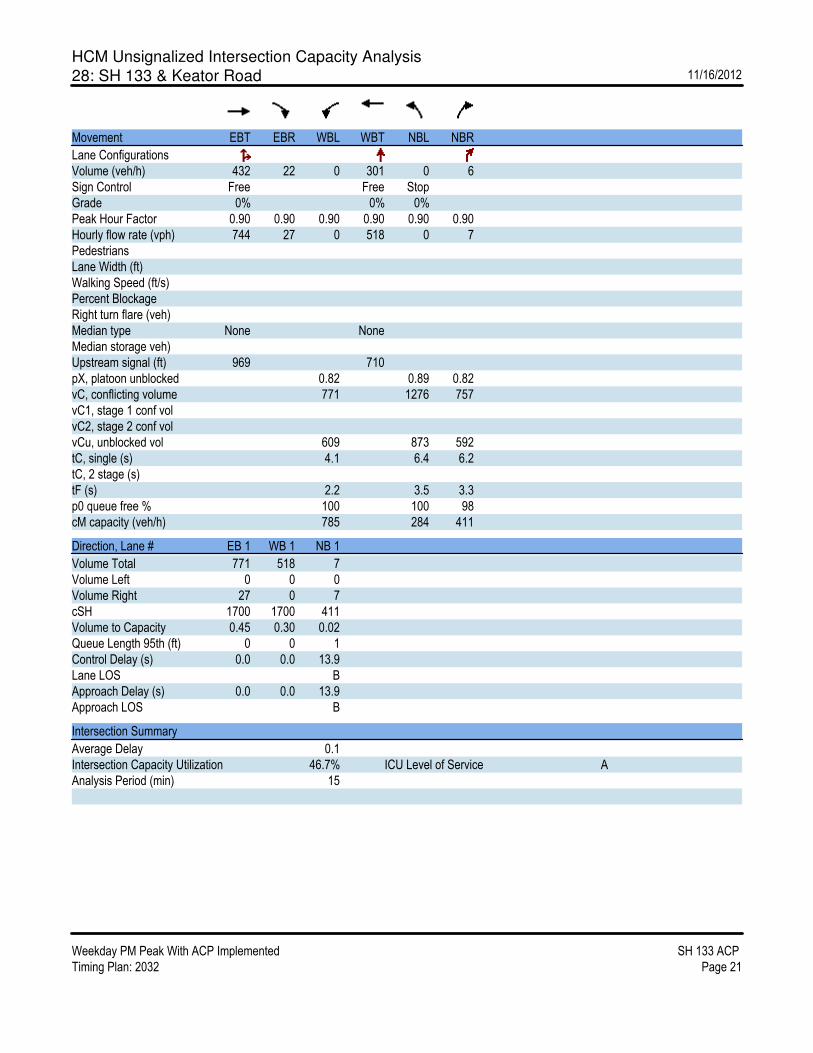
HCM Unsignalized Intersection Capacity Analysis
28: SH 133 & Keator Road 11/16/2012
Weekday PM Peak With ACP Implemented SH 133 ACP
Timing Plan: 2032 Page 21
Movement EBT EBR WBL WBT NBL NBR
Lane Configurations
Volume (veh/h) 432 22 0 301 0 6
Sign Control Free Free Stop
Grade 0% 0% 0%
Peak Hour Factor 0.90 0.90 0.90 0.90 0.90 0.90
Hourly flow rate (vph) 744 27 0 518 0 7
Pedestrians
Lane Width (ft)
Walking Speed (ft/s)
Percent Blockage
Right turn flare (veh)
Median type None None
Median storage veh)
Upstream signal (ft) 969 710
pX, platoon unblocked 0.82 0.89 0.82
vC, conflicting volume 771 1276 757
vC1, stage 1 conf vol
vC2, stage 2 conf vol
vCu, unblocked vol 609 873 592
tC, single (s) 4.1 6.4 6.2
tC, 2 stage (s)
tF (s) 2.2 3.5 3.3
p0 queue free % 100 100 98
cM capacity (veh/h) 785 284 411
Direction, Lane # EB 1 WB 1 NB 1
Volume Total 771 518 7
Volume Left 0 0 0
Volume Right 27 0 7
cSH 1700 1700 411
Volume to Capacity 0.45 0.30 0.02
Queue Length 95th (ft) 0 0 1
Control Delay (s) 0.0 0.0 13.9
Lane LOS B
Approach Delay (s) 0.0 0.0 13.9
Approach LOS B
Intersection Summary
Average Delay 0.1
Intersection Capacity Utilization 46.7% ICU Level of Service A
Analysis Period (min) 15

HCM Signalized Intersection Capacity Analysis
29: Thompson Park Access & SH 133 11/16/2012
Weekday PM Peak With ACP Implemented SH 133 ACP
Timing Plan: 2032 Page 22
Movement NBL NBT NBR SBL SBT SBR SEL SET SER NWL NWT NWR
Lane Configurations
Volume (vph) 10 4 3 53 8 6 10 420 21 15 301 59
Ideal Flow (vphpl) 1900 1900 1900 1900 1900 1900 1900 1900 1900 1900 1900 1900
Total Lost time (s) 4.0 4.0 4.0 4.0 4.0 4.0 4.0 4.0
Lane Util. Factor 1.00 1.00 1.00 1.00 1.00 1.00 1.00 1.00
Frt 1.00 0.94 0.99 1.00 1.00 0.85 1.00 0.85
Flt Protected 0.95 1.00 0.96 0.95 1.00 1.00 1.00 1.00
Satd. Flow (prot) 1787 1709 1733 1736 1827 1553 1824 1553
Flt Permitted 0.73 1.00 0.78 0.39 1.00 1.00 0.98 1.00
Satd. Flow (perm) 1367 1709 1402 704 1827 1553 1783 1553
Peak-hour factor, PHF 0.90 0.90 0.90 0.90 0.90 0.90 0.90 0.90 0.90 0.90 0.90 0.90
Growth Factor (vph) 100% 100% 100% 155% 100% 155% 155% 155% 100% 100% 155% 155%
Adj. Flow (vph) 11 4 3 91 9 10 17 723 23 17 518 102
RTOR Reduction (vph) 0 2 0 0 6 0 0 0 9 0 0 41
Lane Group Flow (vph) 11 5 0 0 104 0 17 723 14 0 535 61
Heavy Vehicles (%) 1% 4% 4% 4% 4% 4% 4% 4% 4% 4% 4% 4%
Turn Type Perm Perm Perm Perm Perm Perm
Protected Phases 4 8 2 6
Permitted Phases 4 8 2 2 6 6
Actuated Green, G (s) 16.0 16.0 16.0 36.0 36.0 36.0 36.0 36.0
Effective Green, g (s) 16.0 16.0 16.0 36.0 36.0 36.0 36.0 36.0
Actuated g/C Ratio 0.27 0.27 0.27 0.60 0.60 0.60 0.60 0.60
Clearance Time (s) 4.0 4.0 4.0 4.0 4.0 4.0 4.0 4.0
Vehicle Extension (s) 3.0 3.0 3.0 3.0 3.0 3.0 3.0 3.0
Lane Grp Cap (vph) 365 456 374 422 1096 932 1070 932
v/s Ratio Prot 0.00 c0.40
v/s Ratio Perm 0.01 c0.07 0.02 0.01 0.30 0.04
v/c Ratio 0.03 0.01 0.28 0.04 0.66 0.01 0.50 0.07
Uniform Delay, d1 16.3 16.2 17.4 4.9 7.9 4.8 6.9 5.0
Progression Factor 1.00 1.00 1.00 1.00 1.00 1.00 1.00 1.00
Incremental Delay, d2 0.2 0.0 1.8 0.2 3.1 0.0 1.7 0.1
Delay (s) 16.4 16.2 19.3 5.1 11.1 4.9 8.5 5.1
Level of Service B B B A B A A A
Approach Delay (s) 16.3 19.3 10.7 8.0
Approach LOS B B B A
Intersection Summary
HCM Average Control Delay 10.3 HCM Level of Service B
HCM Volume to Capacity ratio 0.54
Actuated Cycle Length (s) 60.0 Sum of lost time (s) 8.0
Intersection Capacity Utilization 55.5% ICU Level of Service B
Analysis Period (min) 15
c Critical Lane Group

HCM Signalized Intersection Capacity Analysis
30: River Valley Ranch Rd & SH 133 11/16/2012
Weekday PM Peak With ACP Implemented SH 133 ACP
Timing Plan: 2032 Page 23
Movement EBL EBT EBR WBL WBT WBR NBL NBT NBR SBL SBT SBR
Lane Configurations
Volume (vph) 17 5 1 57 26 57 1 279 29 50 406 26
Ideal Flow (vphpl) 1900 1900 1900 1900 1900 1900 1900 1900 1900 1900 1900 1900
Total Lost time (s) 4.0 4.0 4.0 4.0 4.0 4.0 4.0 4.0
Lane Util. Factor 1.00 1.00 1.00 1.00 1.00 1.00 1.00 1.00
Frt 1.00 0.98 0.95 1.00 0.85 1.00 1.00 0.85
Flt Protected 0.95 1.00 0.98 1.00 1.00 0.95 1.00 1.00
Satd. Flow (prot) 1736 1788 1692 1827 1553 1736 1827 1553
Flt Permitted 0.47 1.00 0.86 1.00 1.00 0.33 1.00 1.00
Satd. Flow (perm) 859 1788 1493 1826 1553 601 1827 1553
Peak-hour factor, PHF 0.90 0.90 0.90 0.90 0.90 0.90 0.90 0.90 0.90 0.90 0.90 0.90
Growth Factor (vph) 110% 110% 110% 155% 155% 155% 110% 155% 155% 155% 155% 110%
Adj. Flow (vph) 21 6 1 98 45 98 1 480 50 86 699 32
RTOR Reduction (vph) 0 1 0 0 37 0 0 0 25 0 0 12
Lane Group Flow (vph) 21 6 0 0 204 0 0 481 25 86 699 20
Turn Type pm+pt Perm Perm Perm pm+pt Perm
Protected Phases 7 4 8 2 1 6
Permitted Phases 4 8 2 2 6 6
Actuated Green, G (s) 18.9 18.9 13.3 35.0 35.0 43.1 43.1 43.1
Effective Green, g (s) 18.9 18.9 13.3 35.0 35.0 43.1 43.1 43.1
Actuated g/C Ratio 0.27 0.27 0.19 0.50 0.50 0.62 0.62 0.62
Clearance Time (s) 4.0 4.0 4.0 4.0 4.0 4.0 4.0 4.0
Vehicle Extension (s) 3.0 3.0 3.0 3.0 3.0 3.0 3.0 3.0
Lane Grp Cap (vph) 252 483 284 913 777 437 1125 956
v/s Ratio Prot c0.00 0.00 0.01 c0.38
v/s Ratio Perm 0.02 c0.14 0.26 0.02 0.11 0.01
v/c Ratio 0.08 0.01 0.72 0.53 0.03 0.20 0.62 0.02
Uniform Delay, d1 20.1 18.7 26.6 11.9 8.9 6.7 8.4 5.2
Progression Factor 1.00 1.00 1.00 1.00 1.00 1.00 1.00 1.00
Incremental Delay, d2 0.1 0.0 8.4 2.2 0.1 0.2 2.6 0.0
Delay (s) 20.2 18.7 35.0 14.1 9.0 6.9 11.0 5.3
Level of Service C B C B A A B A
Approach Delay (s) 19.8 35.0 13.6 10.3
Approach LOS B C B B
Intersection Summary
HCM Average Control Delay 15.2 HCM Level of Service B
HCM Volume to Capacity ratio 0.63
Actuated Cycle Length (s) 70.0 Sum of lost time (s) 12.0
Intersection Capacity Utilization 85.0% ICU Level of Service E
Analysis Period (min) 15
c Critical Lane Group

HCM Unsignalized Intersection Capacity Analysis
31: gated school entrance & SH 133 11/16/2012
Weekday PM Peak With ACP Implemented SH 133 ACP
Timing Plan: 2032 Page 24
Movement WBL WBR NBT NBR SBL SBT
Lane Configurations
Volume (veh/h) 4 28 272 5 38 434
Sign Control Stop Free Free
Grade 0% 0% 0%
Peak Hour Factor 0.90 0.90 0.90 0.90 0.90 0.90
Hourly flow rate (vph) 5 34 468 6 46 747
Pedestrians
Lane Width (ft)
Walking Speed (ft/s)
Percent Blockage
Right turn flare (veh)
Median type None None
Median storage veh)
Upstream signal (ft) 639 876
pX, platoon unblocked 0.93 0.93 0.93
vC, conflicting volume 938 472 475
vC1, stage 1 conf vol
vC2, stage 2 conf vol
vCu, unblocked vol 894 390 393
tC, single (s) 6.9 7.0 4.2
tC, 2 stage (s)
tF (s) 3.5 3.3 2.2
p0 queue free % 98 94 96
cM capacity (veh/h) 245 559 1063
Direction, Lane # WB 1 NB 1 SB 1 SB 2 SB 3
Volume Total 39 475 46 374 374
Volume Left 5 0 46 0 0
Volume Right 34 6 0 0 0
cSH 482 1700 1063 1700 1700
Volume to Capacity 0.08 0.28 0.04 0.22 0.22
Queue Length 95th (ft) 7 0 3 0 0
Control Delay (s) 13.1 0.0 8.5 0.0 0.0
Lane LOS B A
Approach Delay (s) 13.1 0.0 0.5
Approach LOS B
Intersection Summary
Average Delay 0.7
Intersection Capacity Utilization 39.2% ICU Level of Service A
Analysis Period (min) 15
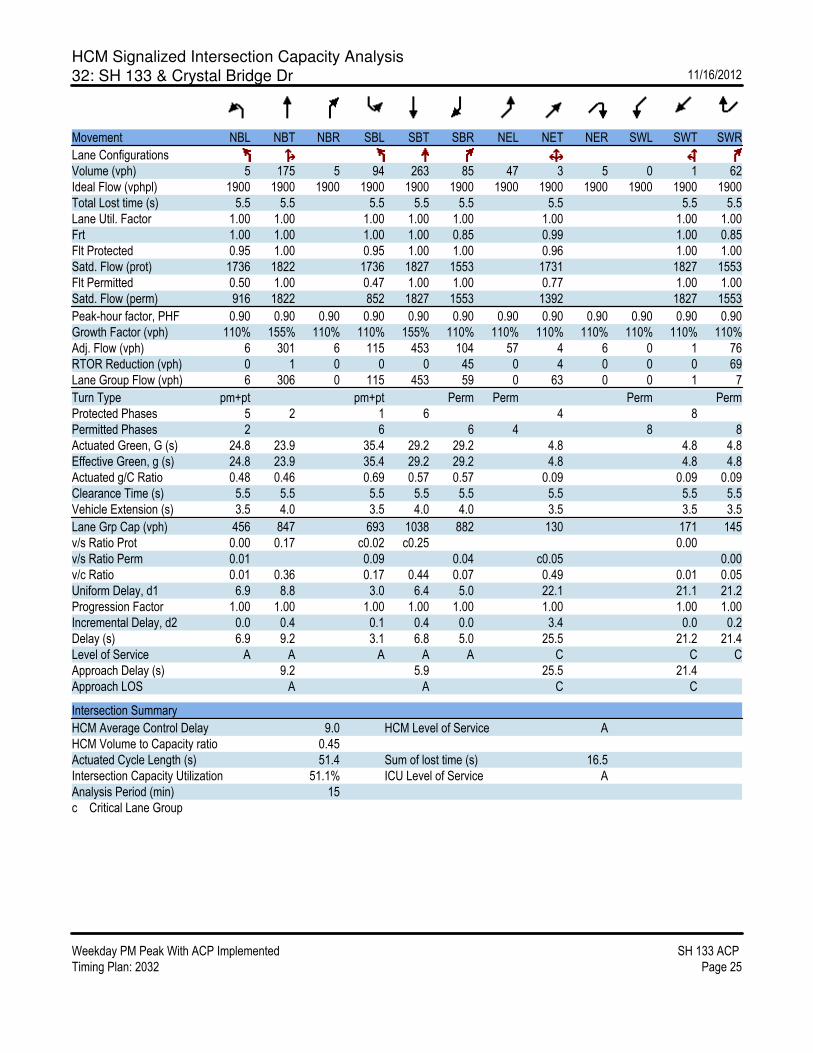
HCM Signalized Intersection Capacity Analysis
32: SH 133 & Crystal Bridge Dr 11/16/2012
Weekday PM Peak With ACP Implemented SH 133 ACP
Timing Plan: 2032 Page 25
Movement NBL NBT NBR SBL SBT SBR NEL NET NER SWL SWT SWR
Lane Configurations
Volume (vph) 5 175 5 94 263 85 47 3 5 0 1 62
Ideal Flow (vphpl) 1900 1900 1900 1900 1900 1900 1900 1900 1900 1900 1900 1900
Total Lost time (s) 5.5 5.5 5.5 5.5 5.5 5.5 5.5 5.5
Lane Util. Factor 1.00 1.00 1.00 1.00 1.00 1.00 1.00 1.00
Frt 1.00 1.00 1.00 1.00 0.85 0.99 1.00 0.85
Flt Protected 0.95 1.00 0.95 1.00 1.00 0.96 1.00 1.00
Satd. Flow (prot) 1736 1822 1736 1827 1553 1731 1827 1553
Flt Permitted 0.50 1.00 0.47 1.00 1.00 0.77 1.00 1.00
Satd. Flow (perm) 916 1822 852 1827 1553 1392 1827 1553
Peak-hour factor, PHF 0.90 0.90 0.90 0.90 0.90 0.90 0.90 0.90 0.90 0.90 0.90 0.90
Growth Factor (vph) 110% 155% 110% 110% 155% 110% 110% 110% 110% 110% 110% 110%
Adj. Flow (vph) 6 301 6 115 453 104 57 4 6 0 1 76
RTOR Reduction (vph) 0 1 0 0 0 45 0 4 0 0 0 69
Lane Group Flow (vph) 6 306 0 115 453 59 0 63 0 0 1 7
Turn Type pm+pt pm+pt Perm Perm Perm Perm
Protected Phases 5 2 1 6 4 8
Permitted Phases 2 6 6 4 8 8
Actuated Green, G (s) 24.8 23.9 35.4 29.2 29.2 4.8 4.8 4.8
Effective Green, g (s) 24.8 23.9 35.4 29.2 29.2 4.8 4.8 4.8
Actuated g/C Ratio 0.48 0.46 0.69 0.57 0.57 0.09 0.09 0.09
Clearance Time (s) 5.5 5.5 5.5 5.5 5.5 5.5 5.5 5.5
Vehicle Extension (s) 3.5 4.0 3.5 4.0 4.0 3.5 3.5 3.5
Lane Grp Cap (vph) 456 847 693 1038 882 130 171 145
v/s Ratio Prot 0.00 0.17 c0.02 c0.25 0.00
v/s Ratio Perm 0.01 0.09 0.04 c0.05 0.00
v/c Ratio 0.01 0.36 0.17 0.44 0.07 0.49 0.01 0.05
Uniform Delay, d1 6.9 8.8 3.0 6.4 5.0 22.1 21.1 21.2
Progression Factor 1.00 1.00 1.00 1.00 1.00 1.00 1.00 1.00
Incremental Delay, d2 0.0 0.4 0.1 0.4 0.0 3.4 0.0 0.2
Delay (s) 6.9 9.2 3.1 6.8 5.0 25.5 21.2 21.4
Level of Service A A A A A C C C
Approach Delay (s) 9.2 5.9 25.5 21.4
Approach LOS A A C C
Intersection Summary
HCM Average Control Delay 9.0 HCM Level of Service A
HCM Volume to Capacity ratio 0.45
Actuated Cycle Length (s) 51.4 Sum of lost time (s) 16.5
Intersection Capacity Utilization 51.1% ICU Level of Service A
Analysis Period (min) 15
c Critical Lane Group
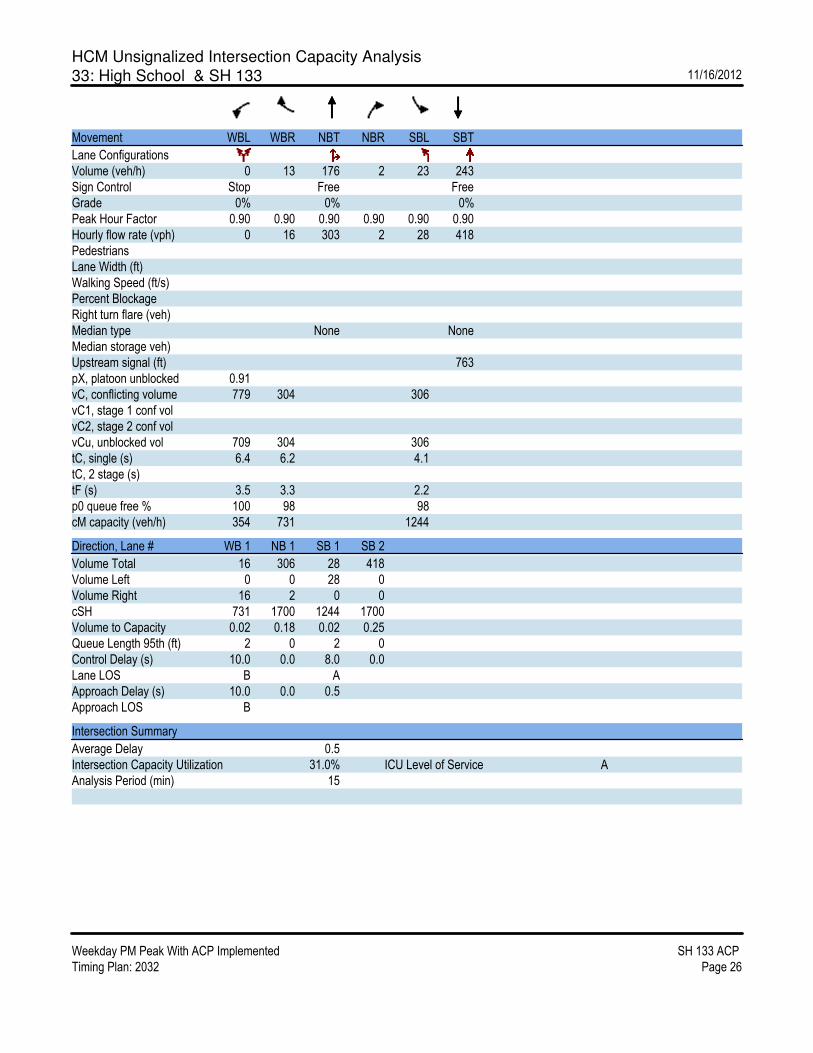
HCM Unsignalized Intersection Capacity Analysis
33: High School & SH 133 11/16/2012
Weekday PM Peak With ACP Implemented SH 133 ACP
Timing Plan: 2032 Page 26
Movement WBL WBR NBT NBR SBL SBT
Lane Configurations
Volume (veh/h) 0 13 176 2 23 243
Sign Control Stop Free Free
Grade 0% 0% 0%
Peak Hour Factor 0.90 0.90 0.90 0.90 0.90 0.90
Hourly flow rate (vph) 0 16 303 2 28 418
Pedestrians
Lane Width (ft)
Walking Speed (ft/s)
Percent Blockage
Right turn flare (veh)
Median type None None
Median storage veh)
Upstream signal (ft) 763
pX, platoon unblocked 0.91
vC, conflicting volume 779 304 306
vC1, stage 1 conf vol
vC2, stage 2 conf vol
vCu, unblocked vol 709 304 306
tC, single (s) 6.4 6.2 4.1
tC, 2 stage (s)
tF (s) 3.5 3.3 2.2
p0 queue free % 100 98 98
cM capacity (veh/h) 354 731 1244
Direction, Lane # WB 1 NB 1 SB 1 SB 2
Volume Total 16 306 28 418
Volume Left 0 0 28 0
Volume Right 16 2 0 0
cSH 731 1700 1244 1700
Volume to Capacity 0.02 0.18 0.02 0.25
Queue Length 95th (ft) 2 0 2 0
Control Delay (s) 10.0 0.0 8.0 0.0
Lane LOS B A
Approach Delay (s) 10.0 0.0 0.5
Approach LOS B
Intersection Summary
Average Delay 0.5
Intersection Capacity Utilization 31.0% ICU Level of Service A
Analysis Period (min) 15
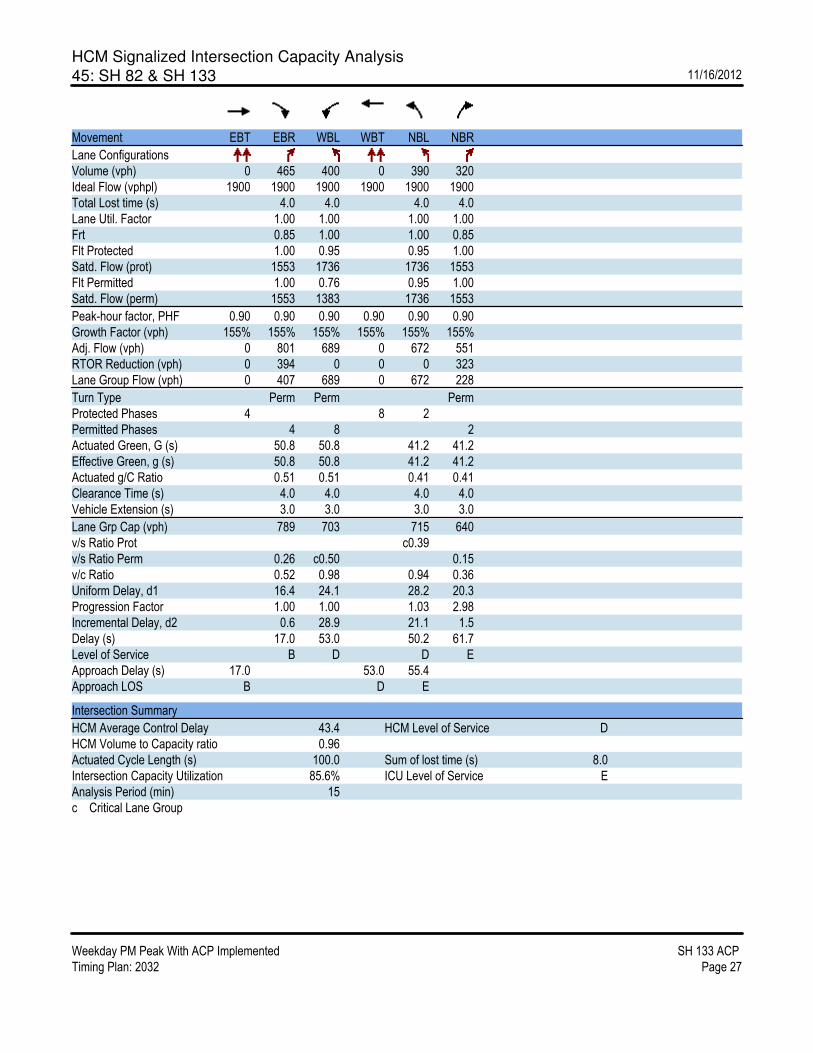
HCM Signalized Intersection Capacity Analysis
45: SH 82 & SH 133 11/16/2012
Weekday PM Peak With ACP Implemented SH 133 ACP
Timing Plan: 2032 Page 27
Movement EBT EBR WBL WBT NBL NBR
Lane Configurations
Volume (vph) 0 465 400 0 390 320
Ideal Flow (vphpl) 1900 1900 1900 1900 1900 1900
Total Lost time (s) 4.0 4.0 4.0 4.0
Lane Util. Factor 1.00 1.00 1.00 1.00
Frt 0.85 1.00 1.00 0.85
Flt Protected 1.00 0.95 0.95 1.00
Satd. Flow (prot) 1553 1736 1736 1553
Flt Permitted 1.00 0.76 0.95 1.00
Satd. Flow (perm) 1553 1383 1736 1553
Peak-hour factor, PHF 0.90 0.90 0.90 0.90 0.90 0.90
Growth Factor (vph) 155% 155% 155% 155% 155% 155%
Adj. Flow (vph) 0 801 689 0 672 551
RTOR Reduction (vph) 0 394 0 0 0 323
Lane Group Flow (vph) 0 407 689 0 672 228
Turn Type Perm Perm Perm
Protected Phases 4 8 2
Permitted Phases 4 8 2
Actuated Green, G (s) 50.8 50.8 41.2 41.2
Effective Green, g (s) 50.8 50.8 41.2 41.2
Actuated g/C Ratio 0.51 0.51 0.41 0.41
Clearance Time (s) 4.0 4.0 4.0 4.0
Vehicle Extension (s) 3.0 3.0 3.0 3.0
Lane Grp Cap (vph) 789 703 715 640
v/s Ratio Prot c0.39
v/s Ratio Perm 0.26 c0.50 0.15
v/c Ratio 0.52 0.98 0.94 0.36
Uniform Delay, d1 16.4 24.1 28.2 20.3
Progression Factor 1.00 1.00 1.03 2.98
Incremental Delay, d2 0.6 28.9 21.1 1.5
Delay (s) 17.0 53.0 50.2 61.7
Level of Service B D D E
Approach Delay (s) 17.0 53.0 55.4
Approach LOS B D E
Intersection Summary
HCM Average Control Delay 43.4 HCM Level of Service D
HCM Volume to Capacity ratio 0.96
Actuated Cycle Length (s) 100.0 Sum of lost time (s) 8.0
Intersection Capacity Utilization 85.6% ICU Level of Service E
Analysis Period (min) 15
c Critical Lane Group
