crash mitigation at rural unsignalized intersections providing intersection decision support (ids)...
TRANSCRIPT

Crash MitigationAt Rural Unsignalized Intersections
Providing Intersection Decision Support (IDS) for the Driver
Inter-Regional Corridors:Hi-speed, hi-density roads
crossing
Low-speed, low-density roads
AgendaAttendees: Please send name, affiliation, phone and email address to: Rick Odgers: [email protected]
1. Introductions (30 minutes) 2. Background (20 minutes) 3. MN Intersection Crash Data Analysis (30 minutes) 4. Minnesota IDS Project status (20 minutes) 5. Human Factors (20 minutes) 6. Plan for the state pooled funded project (20 minutes) 7. Feedback on plan and participation in deploying
IDS in respective state (20 minutes) 8. Sign-up for DII review panel (5 minutes) 9. Plans for next meeting (10 minutes), week of April 20 10. Wrap-up (5 minutes)
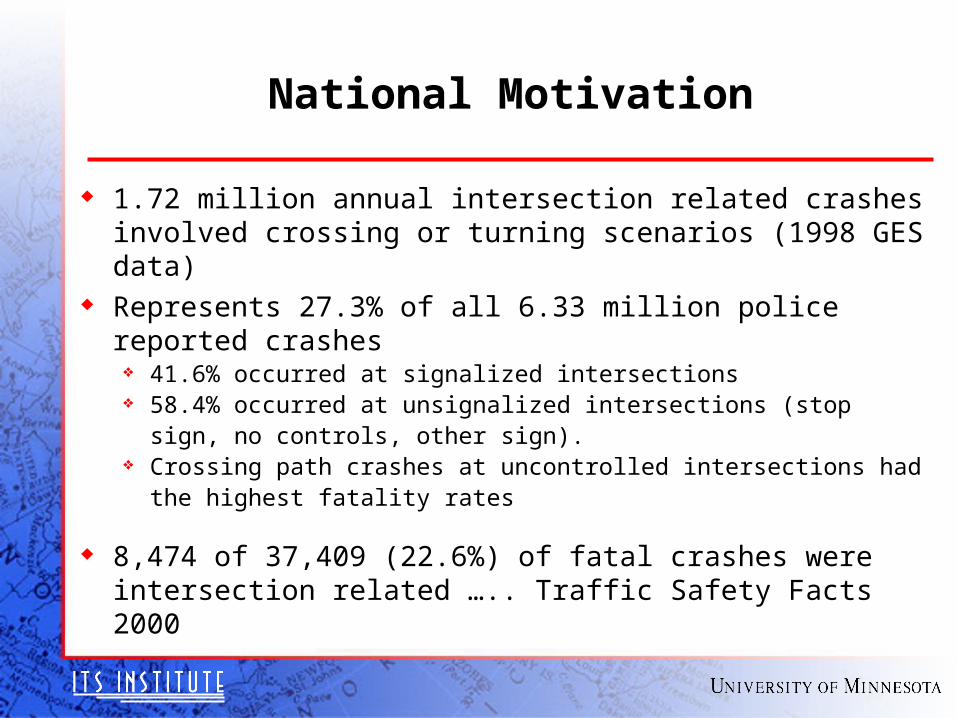
National Motivation
1.72 million annual intersection related crashes involved crossing or turning scenarios (1998 GES data)
Represents 27.3% of all 6.33 million police reported crashes 41.6% occurred at signalized intersections 58.4% occurred at unsignalized intersections (stop sign, no
controls, other sign). Crossing path crashes at uncontrolled intersections had the
highest fatality rates
8,474 of 37,409 (22.6%) of fatal crashes were intersection related ….. Traffic Safety Facts 2000
Intersection crashes
NHTSA [Carter, 1999] has indicated that 85% of intersection crashes were due to driver error, with the following breakdown: 27% due to driver inattention 44% due to faulty perception, and 14% due to impaired vision.

Intersection Decision Support (IDS)
Emphasis on: Cooperative Systems (infrastructure + in-vehicle) Driver Decision Aids (gap, velocity) Crossing-Path Collisions (Signalized and Unsignalized)
• 78.1% of Intersection Crashes (1998 GES)
Focus on driver error causal factors For example: Provide the driver with information that will
improve judgment of gap clearance and timing
Cooperative systems: NHTSA sponsored work focus on in-vehicle systems Infrastructure Consortium formed to focus on infrastructure
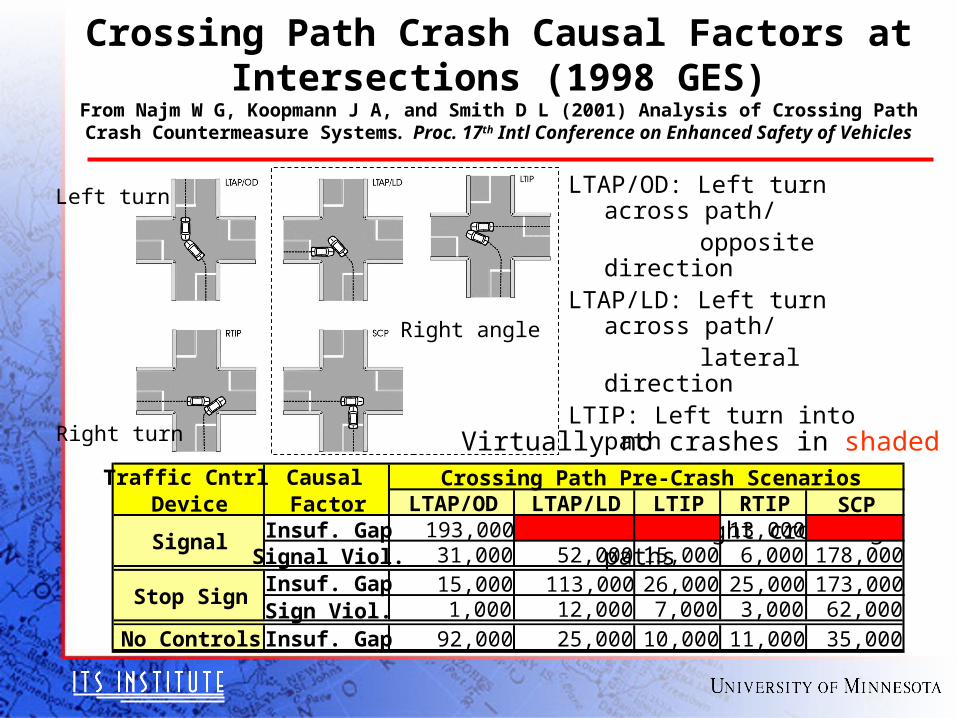
Crossing Path Crash Causal Factors at Intersections (1998 GES)
From Najm W G, Koopmann J A, and Smith D L (2001) Analysis of Crossing Path Crash Countermeasure Systems. Proc. 17th Intl Conference on Enhanced Safety of Vehicles
LTAP/OD: Left turn across path/opposite direction
LTAP/LD: Left turn across path/lateral direction
LTIP: Left turn into pathRTIP: Right turn into pathSCP: Straight crossing paths
LTAP/OD LTAP/LD LTIP RTIP SCPInsuf. Gap 193,000 13,000 Signal Viol. 31,000 52,000 15,000 6,000 178,000 Insuf. Gap 15,000 113,000 26,000 25,000 173,000 Sign Viol. 1,000 12,000 7,000 3,000 62,000
No Controls Insuf. Gap 92,000 25,000 10,000 11,000 35,000
Signal
Stop Sign
Traffic Cntrl Device
Causal Factor
Crossing Path Pre-Crash Scenarios
Right angle
Virtually no crashes in shaded cells.
Left turn
Right turn
The IDS Team:IVI Infrastructure Consortium
IVI Infrastructure Consortium Principals California DOT (Caltrans) Minnesota DOT Virginia DOT USDOT (FHWA)
Universities conducting the IDS research U.C. Berkeley (California PATH, other units) University of Minnesota (ITS Institute, other units) Virginia Tech (VTTI)
Special Concentrations by State
Virginia team Straight-crossing-path (SCP) crashes Tests on ‘Smart Road’ intersection Intentional and unintentional signal/stop violation Focus: Warn violator (DVI and DII)
California team Left Turn Across Path/ Opposite Direction
(LTAP/OD) Urban intersections Tests on ‘Richfield Field Station’ intersection Wireless communications for cooperative systems
Why Rural Intersections?
Crashes in rural areas are more severe than in urban areas While 70% of all crashes in Minnesota occur in urban areas,
70% of fatal crashes occur in rural areas.
Along Minnesota’s Trunk Highway System, there are more rural through/stop intersections (3,920) than all categories of urban intersections (3,714) combined
During a three-year period (1998-2000), 62% of all intersection-related fatal crashes in Minnesota occurred at rural through/stop intersections
Minnesota Focus
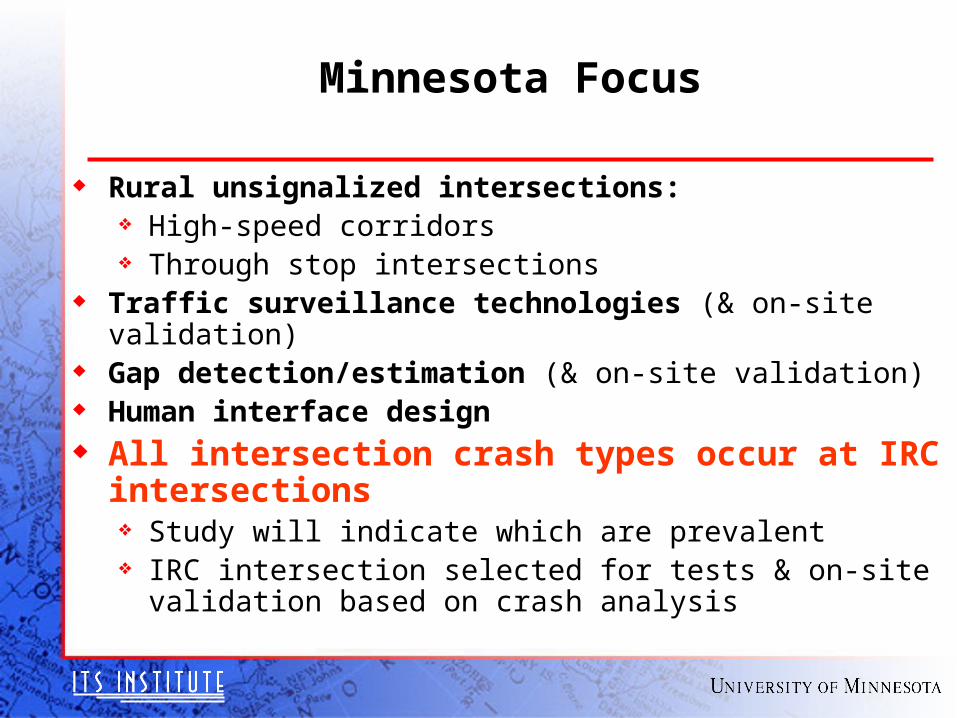
Rural unsignalized intersections: High-speed corridors Through stop intersections
Traffic surveillance technologies (& on-site validation) Gap detection/estimation (& on-site validation) Human interface design All intersection crash types occur at IRC
intersections Study will indicate which are prevalent IRC intersection selected for tests & on-site validation
based on crash analysis
Guiding Principles
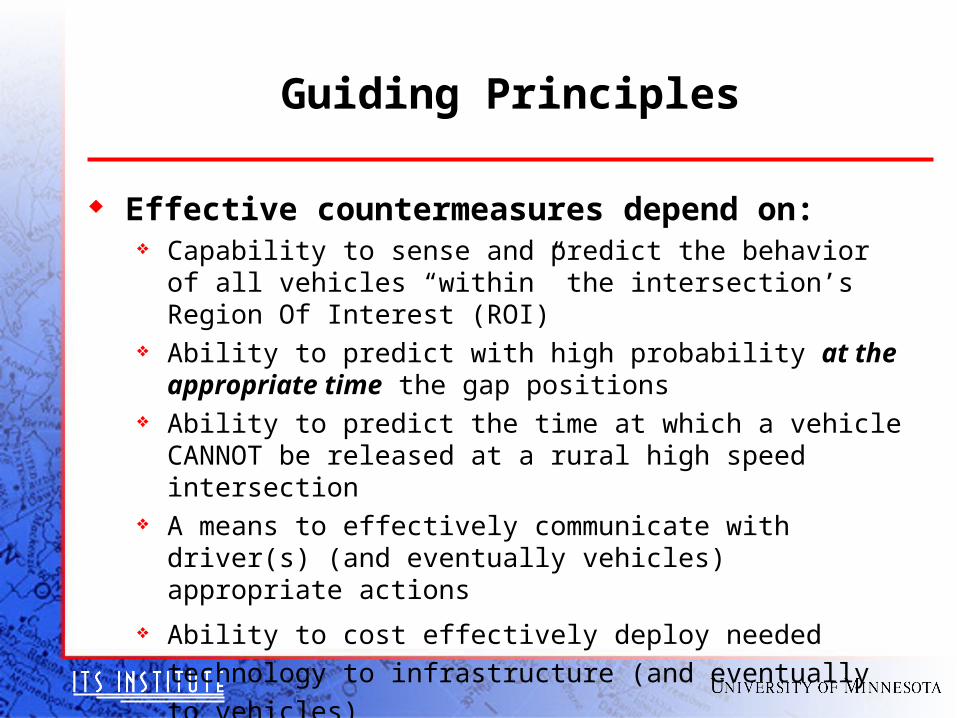
Effective countermeasures depend on: Capability to sense and predict the behavior of all vehicles
“within” the intersection’s Region Of Interest (ROI) Ability to predict with high probability at the appropriate time
the gap positions Ability to predict the time at which a vehicle CANNOT be
released at a rural high speed intersection A means to effectively communicate with driver(s) (and
eventually vehicles) appropriate actions
Ability to cost effectively deploy needed technology to
infrastructure (and eventually to vehicles)

Addressing Rural Intersection Safety Issues:
The primary problem at rural intersections involves a driver on the minor road selecting an unsafe gap in the major road traffic stream.
Consider study of 1604 rural intersections (2-lane roadways, Thru/STOP intersection control only, no medians) over 2+ year period.
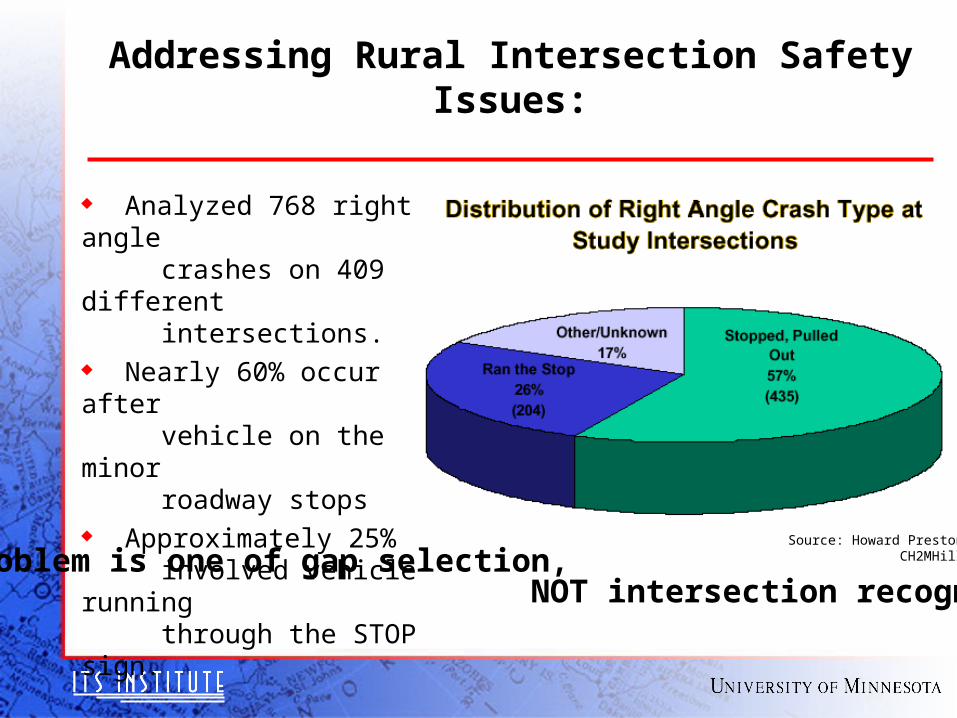
Addressing Rural Intersection Safety Issues:
Analyzed 768 right angle crashes on 409 different intersections. Nearly 60% occur after vehicle on the minor roadway stops Approximately 25% involved vehicle running through the STOP sign.
Source: Howard Preston CH2MHill… i.e. problem is one of gap selection,
NOT intersection recognition
Guidelines for Implementation of AASHTO Strategic Highway Safety Plan
NCHRP Report 500:Vol. 5 Unsignalized Intersections
Identifies objectives and strategies for dealing with unsignalized intersections
Objective 17.1.4 Assist drivers in judging gap sizes at Unsignalized Intersections
High speed at grade intersections
MN Pooled Fund Project:Towards a Multi-State Consensus
Minnesota is leading a state pooled fund project for rural intersection IDS
Multiple goals of state pooled fund: Assistance/buy-in of DII design
Goal: nationally acceptable designs• Performance• Maintenance• Acceptability
Increased data collection capability Test intersections in participating states Regional vs. national driver behavior
MN Pooled Fund Project: Towards a Multi-State Consensus
Premise behind pooled fund project States provide their perspective to rural intersection project Nationally inter-operable systems will result
Work distribution Minnesota provides intersection instrumentation design
guidance/assistance to states States provide $ and resources to instrument test intersection in
their state States provide intersection instrumentation data to Minnesota for
analysis• Insures sufficient data for statistically valid results and conclusions• Regional driver variability/coherence can be quantified
Minnesota analyzes states’ data, and provides results and feedback to participating states
Successful Demonstration, June 2003
Turner Fairbanks Highway Research Center, McLean, VA
View simulation
IDS Program
Tasks Crash Analysis Enabling Research Benefit:Cost Analysis System Design
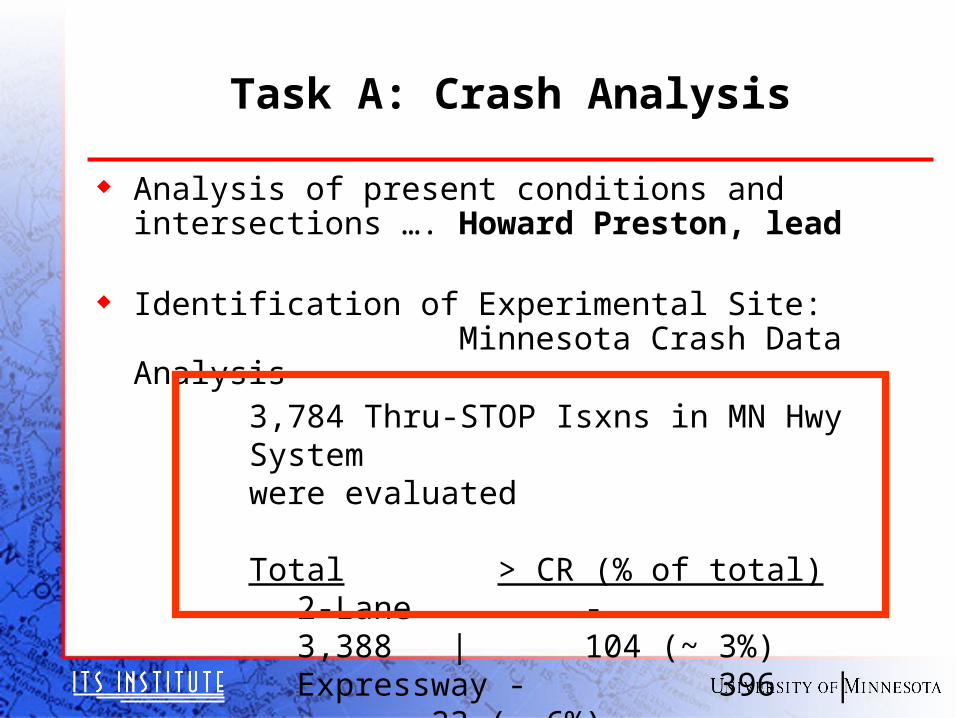
Task A: Crash Analysis
Analysis of present conditions and intersections …. Howard Preston, lead
Identification of Experimental Site: Minnesota Crash Data Analysis
3,784 Thru-STOP Isxns in MN Hwy Systemwere evaluated Total > CR (% of total)
2-Lane - 3,388 | 104 (~ 3%)Expressway - 396 | 23 (~ 6%)
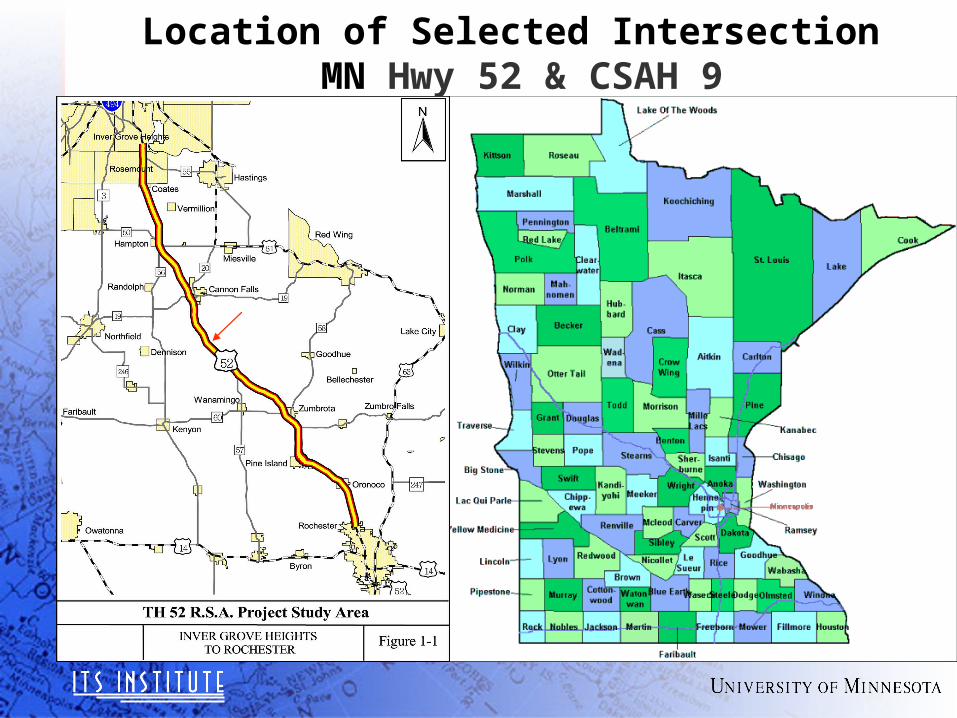
Location of Selected Intersection MN Hwy 52 & CSAH 9
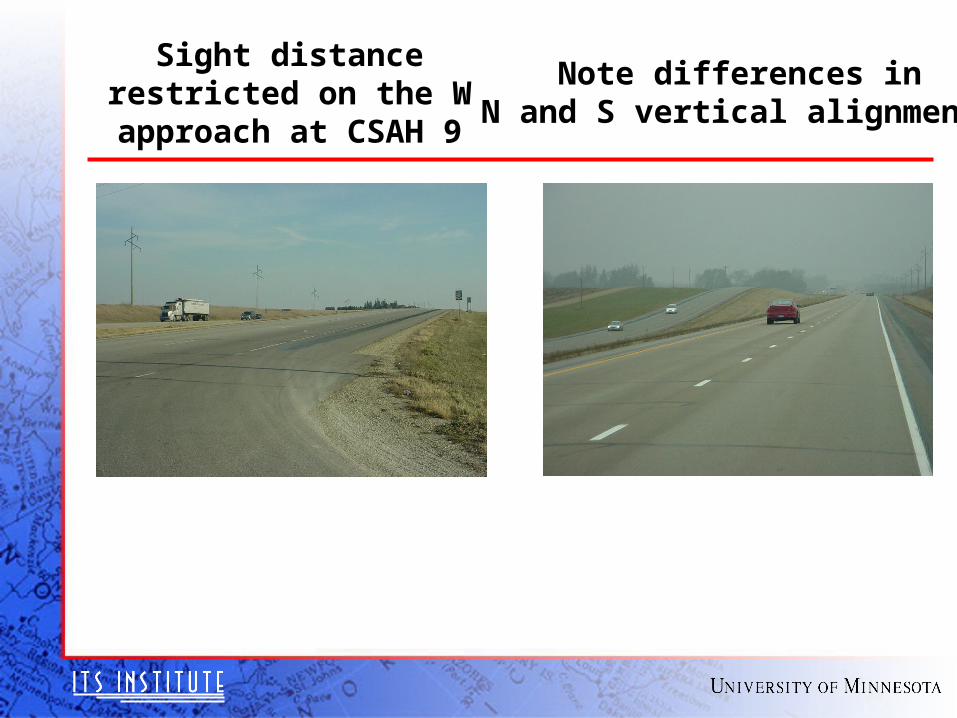
Sight distance restricted on the W approach at
CSAH 9
Note differences inN and S vertical alignments
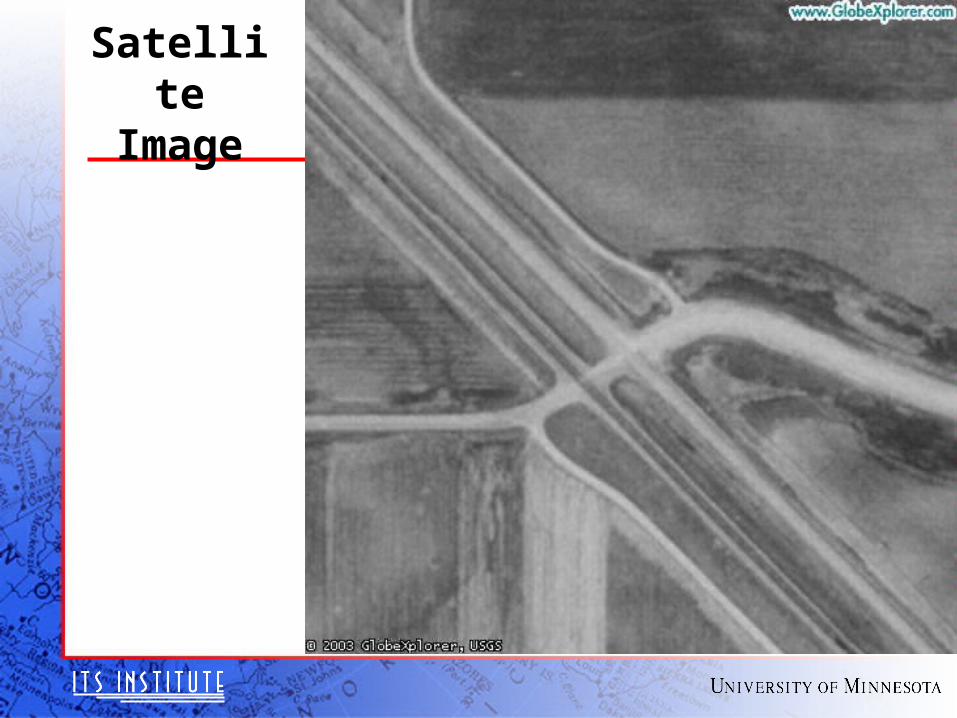
SatelliteImage
Prediction of Countermeasure Effects
Modeling of relationships between intersection characteristics and crash propensity … Gary Davis, Principal Investigator
Identify both atypically safe and unsafe intersections Associate characteristics with both Use info for deployment and benefit:cost analyses Predict accident reduction based on potential
deployment scenarios
STATISTICAL MODELINGGary Davis, Nebiyou Tilahun, Paula Mesa
Objectives Predict Accident Reduction Effect of IDS
Deployment on (All, Some) Stop-Controlled Rural Expressway Intersections in Minnesota
Determine if Older Drivers are Over-Represented at Stop-Controlled Rural Expressway Intersections in Minnesota
Assess Sensitivity of Accident Reduction Effect on Predicted Changes in Distribution of Driver Ages
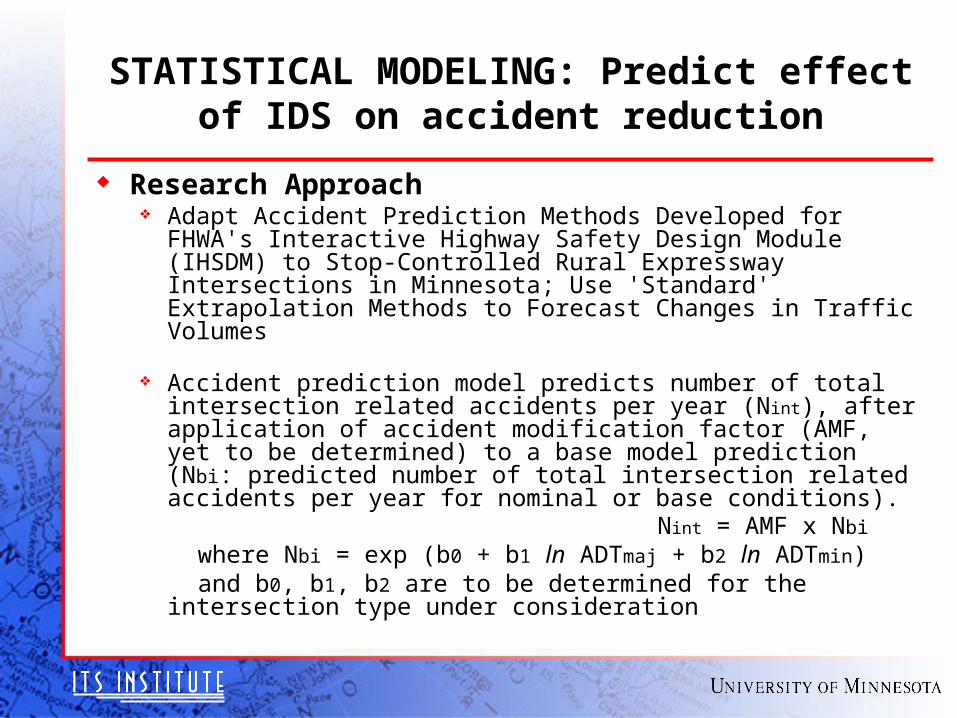
STATISTICAL MODELING: Predict effect of IDS on accident reduction
Research Approach Adapt Accident Prediction Methods Developed for FHWA's
Interactive Highway Safety Design Module (IHSDM) to Stop-Controlled Rural Expressway Intersections in Minnesota; Use 'Standard' Extrapolation Methods to Forecast Changes in Traffic Volumes
Accident prediction model predicts number of total intersection related accidents per year (Nint), after application of accident modification factor (AMF, yet to be determined) to a base model prediction (Nbi: predicted number of total intersection related accidents per year for nominal or base conditions).
Nint = AMF x Nbi
where Nbi = exp (b0 + b1 ln ADTmaj + b2 ln ADTmin) and b0, b1, b2 are to be determined for the intersection type
under consideration
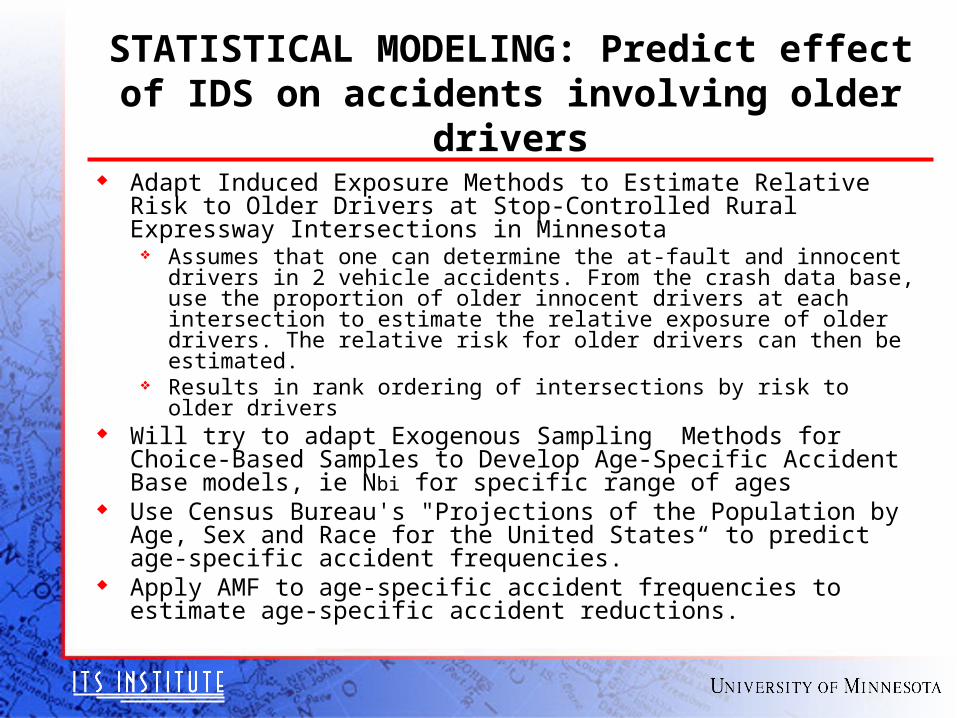
STATISTICAL MODELING: Predict effect of IDS on accidents involving older drivers
Adapt Induced Exposure Methods to Estimate Relative Risk to Older Drivers at Stop-Controlled Rural Expressway Intersections in Minnesota Assumes that one can determine the at-fault and innocent drivers in 2
vehicle accidents. From the crash data base, use the proportion of older innocent drivers at each intersection to estimate the relative exposure of older drivers. The relative risk for older drivers can then be estimated.
Results in rank ordering of intersections by risk to older drivers Will try to adapt Exogenous Sampling Methods for Choice-Based
Samples to Develop Age-Specific Accident Base models, ie Nbi for specific range of ages
Use Census Bureau's "Projections of the Population by Age, Sex and Race for the United States“ to predict age-specific accident frequencies.
Apply AMF to age-specific accident frequencies to estimate age-specific accident reductions.
References:
Vogt, A, and Bared, J., (1998) Accident Models for Two-Lane Rural Roads: Segments and Intersections, Report FHWA-RD-98-133, Federal Highway Administration, Washington, DC.
Harwood, D., Council, F., Hauer, E., Hughes, W., and Vogt, A. (2000) Prediction of the Expected Safety Performance of Rural Two-Lane Highways, Report FHWA-RD-99-207, Federal Highway Administration, Washington, DC.
Davis, G. and Yang, S. (2001) Bayesian identification of high-risk intersections for older drivers via Gibbs sampling, Transportation Research Record, 1746, 84-89.
Task B: Enabling Research
Surveillance, Alec Gorjestani, Principal Investigator
Sensors – • Determine location and speed of high speed road vehicles• Determine type of vehicle on low speed road (signal timing)• Sensor placement, intersection design, etc.
Communications• Transmit data from sensors to IDS main processor• Wire / Fiber Optic / Wireless options
Computational systems• Determine location, speed, and size of traffic gaps
Performance issues: • Redundancy, reliability, range, power, cost, estimation vs.
sensor coverage, etc.
Enabling Research
Test Intersection Once Candidate Intersection selected, design test
infrastructure• IDS System sensors, power, processors, and
associated cabinets within Mn/DOT R-O-W alongside road, in advance of cross roads
• Test and validation system consisting of cameras, and supporting structures (masts, power cabinets, etc.).
Sensors
Must provide at least 10 second warning at intersection with vehicles traveling at 60 mph, need information from at least 880 feet out (10 x 88 ft) at the Driver Infrastructure Interface (DII) controller
As vehicle speeds vary, gap sizes may change.
Must track all gaps (‘safe’ and ‘unsafe’) as they approach the Isxn.
Need to determine location of sensors to provide adequate advance preview.
Surveillance System - Overview
System designed to record the location and velocity of every vehicle at or approaching the intersection
Surveillance system consists of an array of sensors Radar, Lidar (LIght Detection And Ranging) Vision – visible and infrared, image processing
Sensor data transmitted to central processor Sensor data filtered and fused Intersection vehicle state matrix Gaps in traffic calculated Warnings can be generated for Driver Infrastructure Interface
(DII)
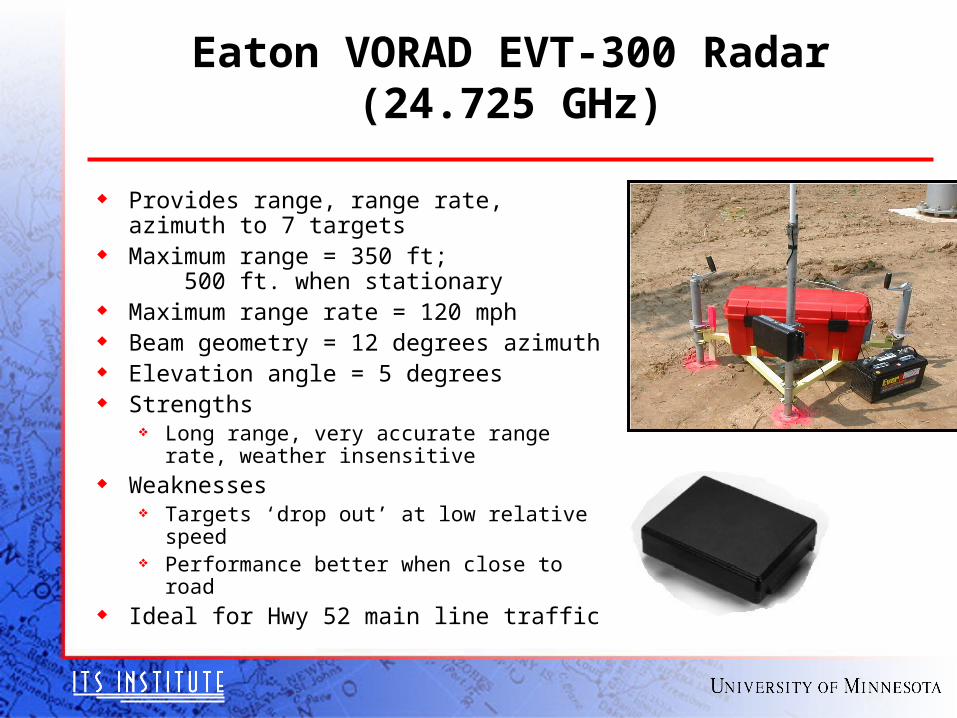
Eaton VORAD EVT-300 Radar(24.725 GHz)
Provides range, range rate, azimuth to 7 targets
Maximum range = 350 ft; 500 ft. when stationary
Maximum range rate = 120 mph Beam geometry = 12 degrees azimuth Elevation angle = 5 degrees Strengths
Long range, very accurate range rate, weather insensitive
Weaknesses Targets ‘drop out’ at low relative speed Performance better when close to road
Ideal for Hwy 52 main line traffic
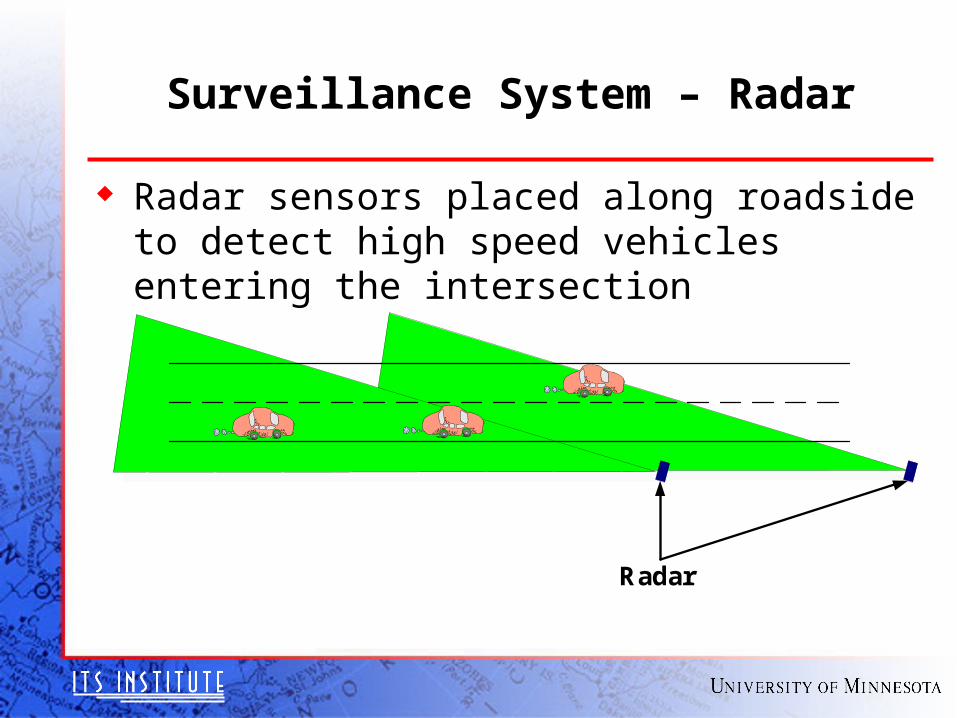
Surveillance System – Radar
Radar
Radar sensors placed along roadside to detect high speed vehicles entering the intersection
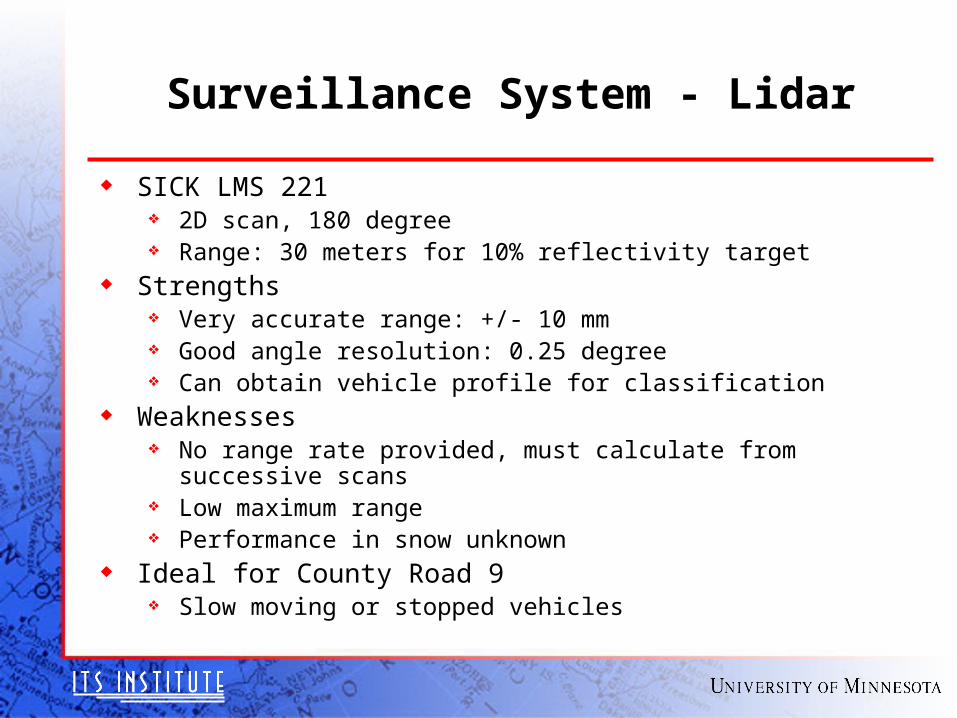
Surveillance System - Lidar
SICK LMS 221 2D scan, 180 degree Range: 30 meters for 10% reflectivity target
Strengths Very accurate range: +/- 10 mm Good angle resolution: 0.25 degree Can obtain vehicle profile for classification
Weaknesses No range rate provided, must calculate from successive scans Low maximum range Performance in snow unknown
Ideal for County Road 9 Slow moving or stopped vehicles

Surveillance System - Lidar
Horizontal Alignment Vertical Alignment
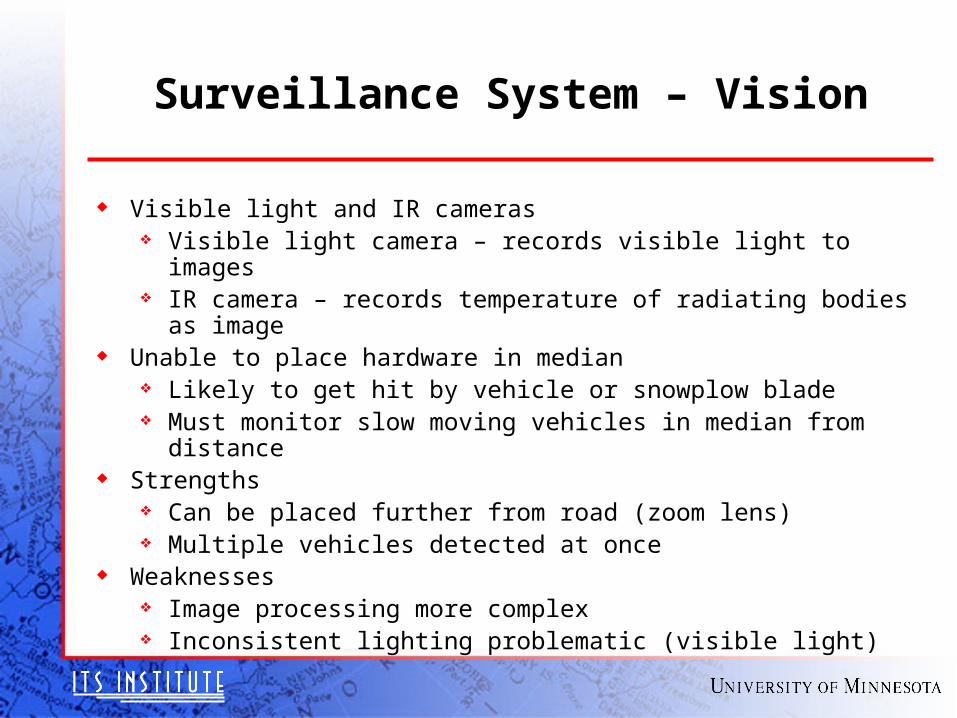
Surveillance System – Vision
Visible light and IR cameras Visible light camera – records visible light to images IR camera – records temperature of radiating bodies as image
Unable to place hardware in median Likely to get hit by vehicle or snowplow blade Must monitor slow moving vehicles in median from distance
Strengths Can be placed further from road (zoom lens) Multiple vehicles detected at once
Weaknesses Image processing more complex Inconsistent lighting problematic (visible light)
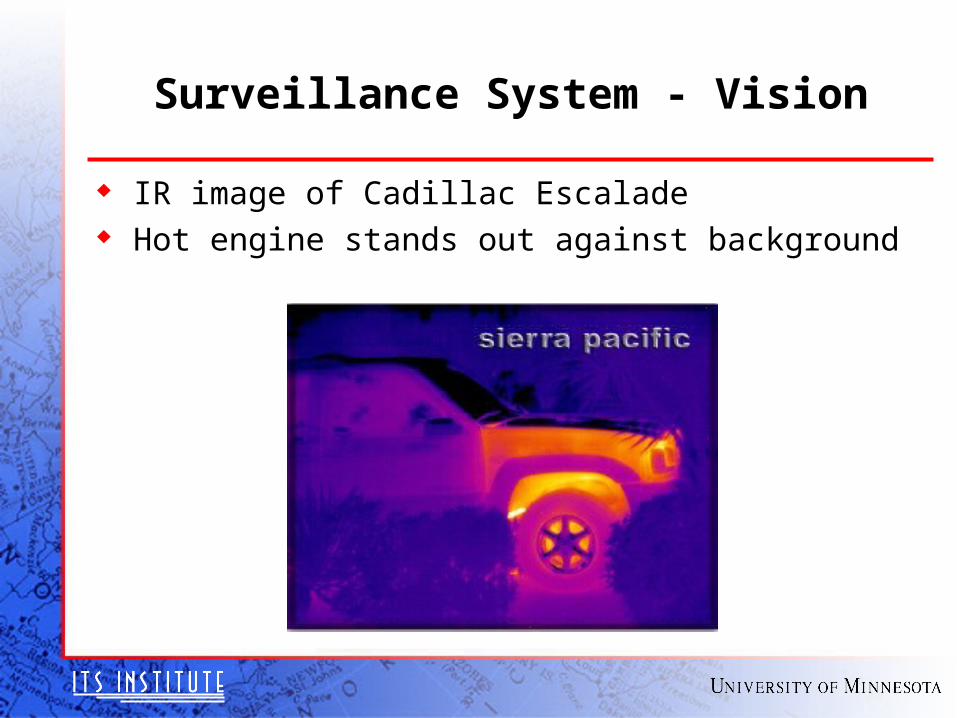
Surveillance System - Vision
IR image of Cadillac Escalade Hot engine stands out against background
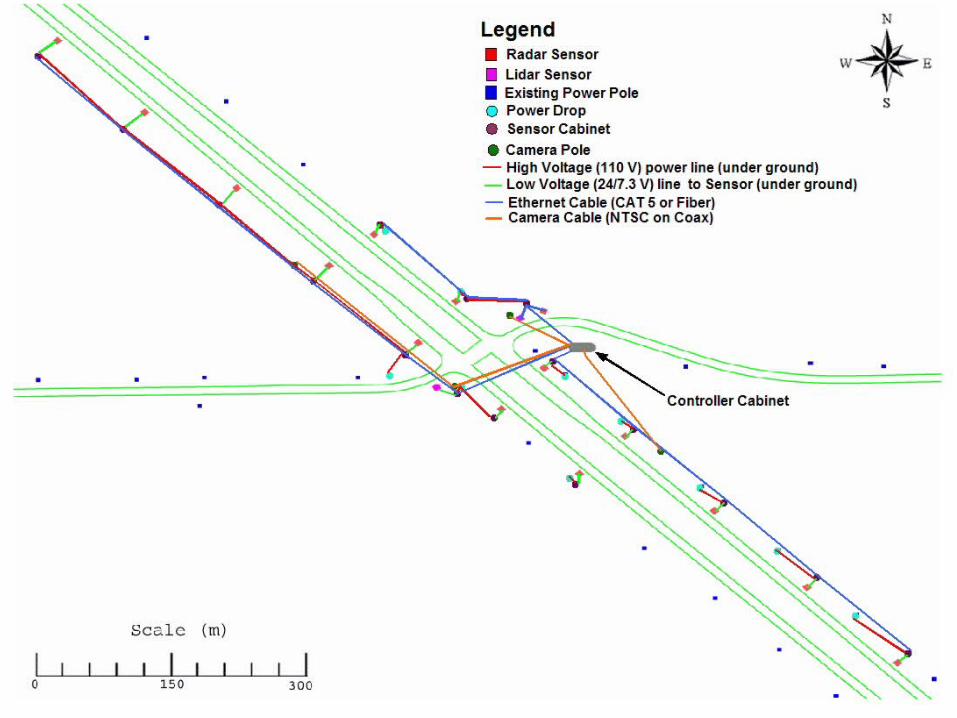
Surveillance System – Communication Sensor data to central processing unit
Use wired communication to test wireless’ suitability for surveillance system Needed to trench for power anyway, therefore will
install wired network; enable us to compare various wireless schemes against a wired network; cost vs. performance tradeoffs
Wired Ethernet network Fast – 100 Mbit/sec; Reliable Disadvantage: Must run cables long distances, need repeaters
Wireless Slower – 11 Mbit/sec for 802.11b Not as reliable, interference, retransmission Advantage: No need to run cables
Surveillance System – Evaluation
System must be evaluated Collected data must be accurate System must be reliable
Individual sensor accuracy tested using DGPS equipped probe vehicles
Surveillance system accuracy also tested with probe vehicles
Cameras will later be used to validate radar system’s reliability Cameras placed on major legs Images compared with radar data, will count misses
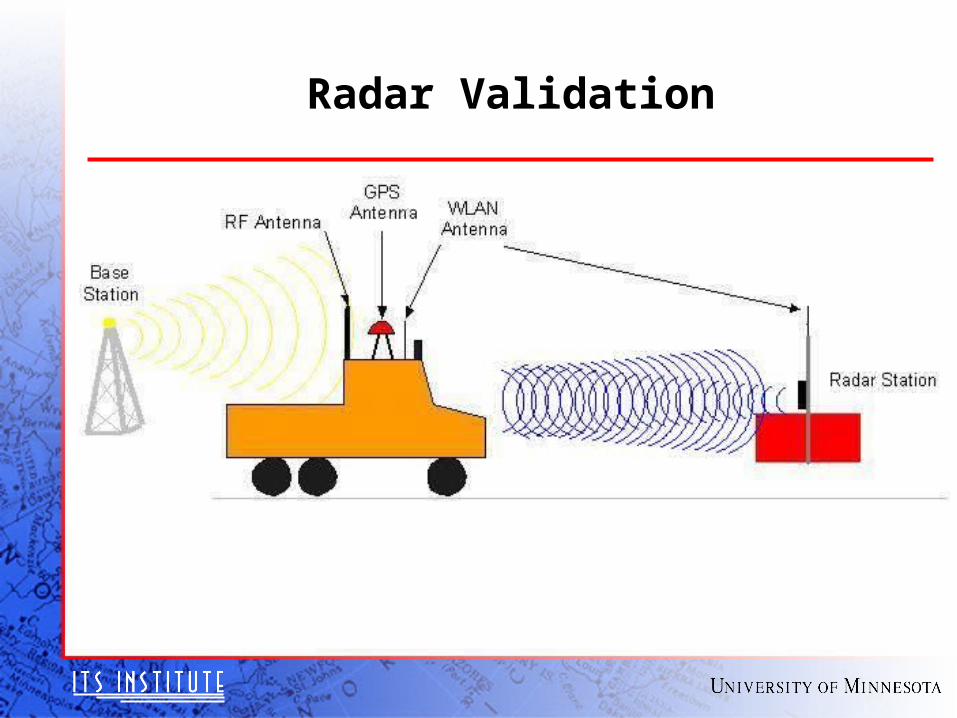
Radar Validation
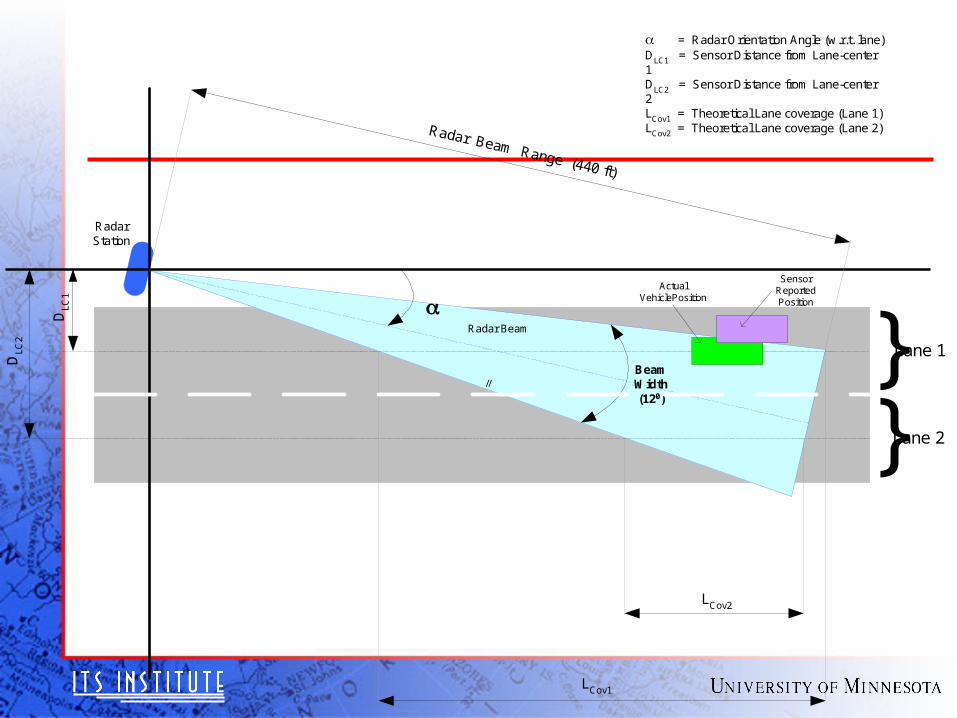
//
Radar Beam
Lane 1
Lane 2
DLC
2
DLC
1
LCov1
LCov2
Radar Beam Range (440 ft)
= Radar Orientation Angle (w.r.t. lane)DLC1 = Sensor Distance from Lane-center1DLC2 = Sensor Distance from Lane-center2LCov1 = Theoretical Lane coverage (Lane 1)LCov2 = Theoretical Lane coverage (Lane 2)
BeamWidth(120)
ActualVehiclePosition
SensorReportedPosition
RadarStation
}}
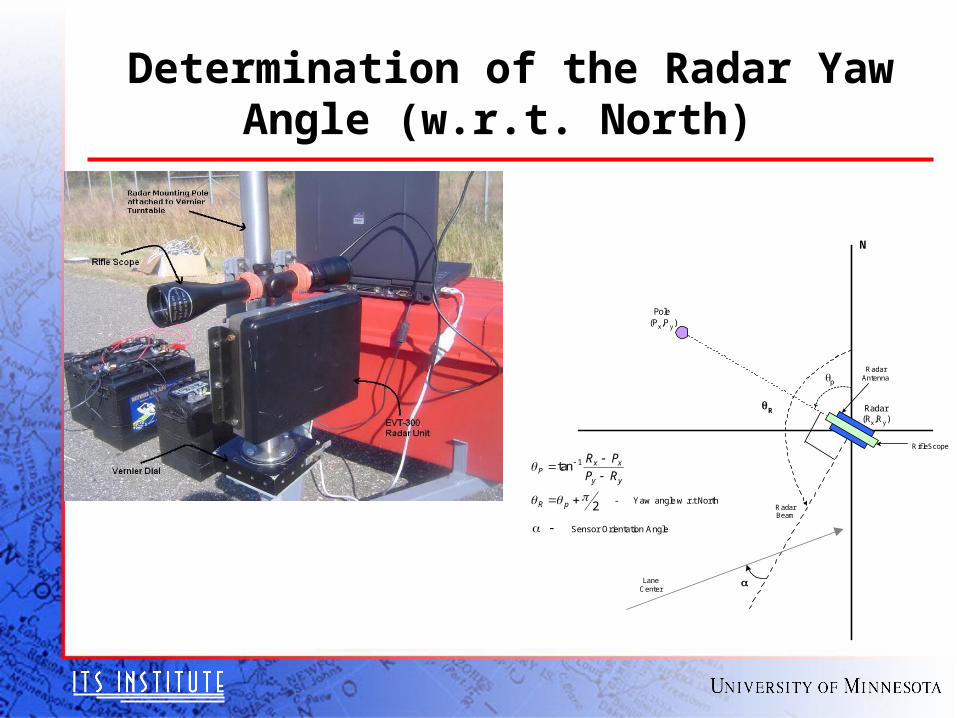
Determination of the Radar Yaw Angle (w.r.t. North)
N
Pole(Px,Py)
Radar(Rx,Ry)
RadarBeam
Rif le Scope
RadarAntennap
R
2
tan 1
pR
yy
xxP RP
PR
- Yaw angle w .r.t North
LaneCenter
Sensor Orientation Angle
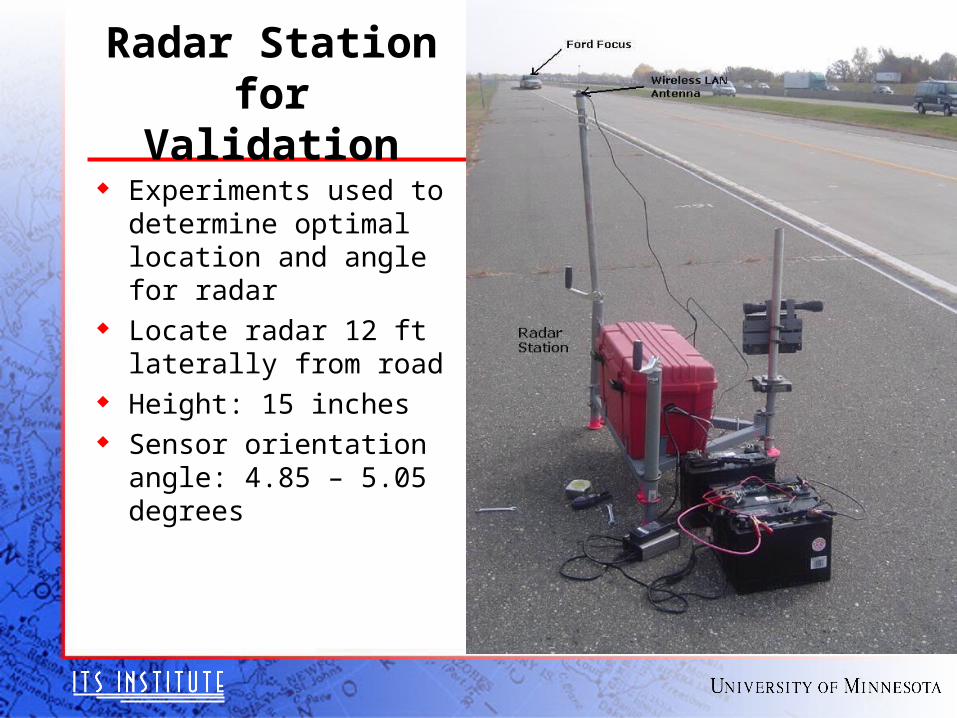
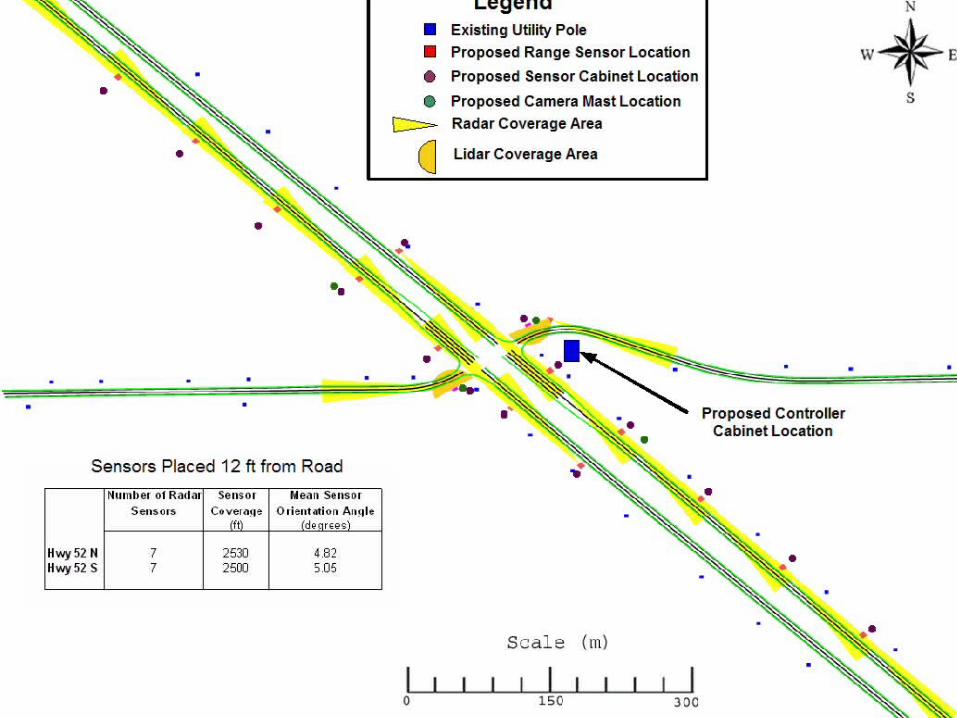
Experiments used to determine optimal location and angle for radar
Locate radar 12 ftlaterally from road
Height: 15 inches Sensor orientation
angle: 4.85 – 5.05 degrees
Radar Stationfor Validation
Surveillance System – Data Collection
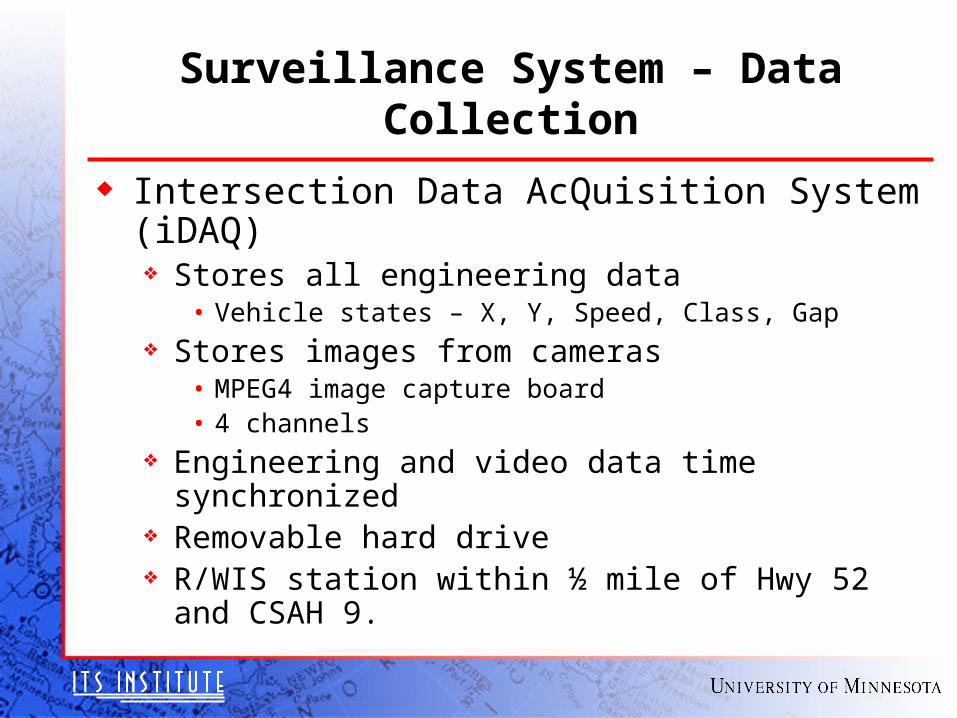
Intersection Data AcQuisition System (iDAQ) Stores all engineering data
• Vehicle states – X, Y, Speed, Class, Gap Stores images from cameras
• MPEG4 image capture board• 4 channels
Engineering and video data time synchronized Removable hard drive R/WIS station within ½ mile of Hwy 52 and CSAH 9.

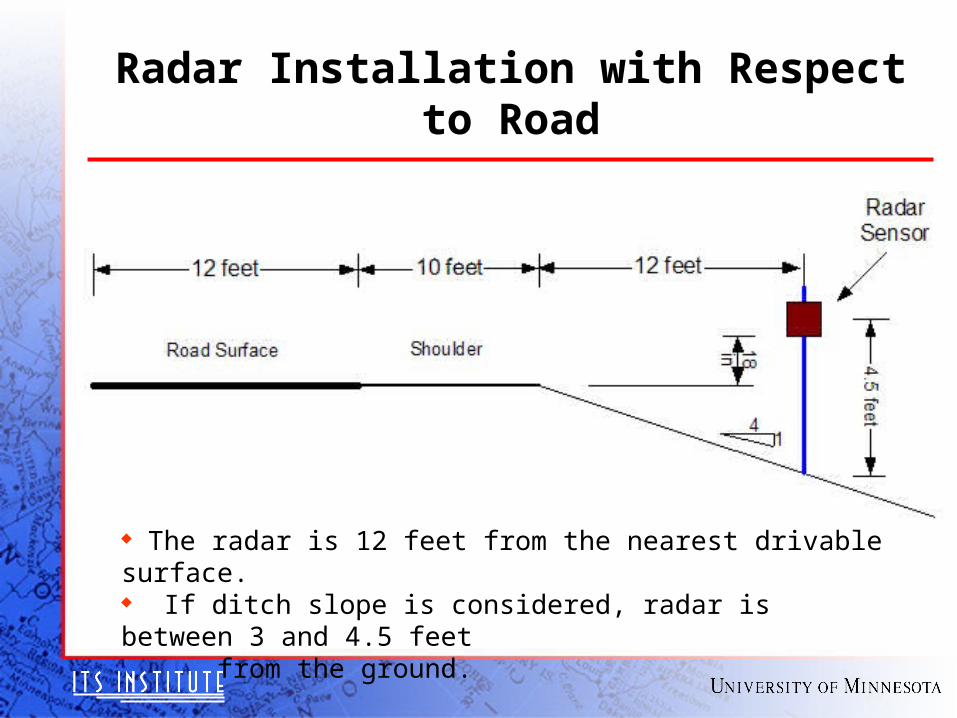
Radar Installation with Respect to Road
The radar is 12 feet from the nearest drivable surface. If ditch slope is considered, radar is between 3 and 4.5 feet from the ground.

Contract Issues
U of MN will be bidding job Request for bids ready very soon Feb: Bidding process March: Select Contractor April: Work out contract May: Complete the job; bring intersection on-
line.
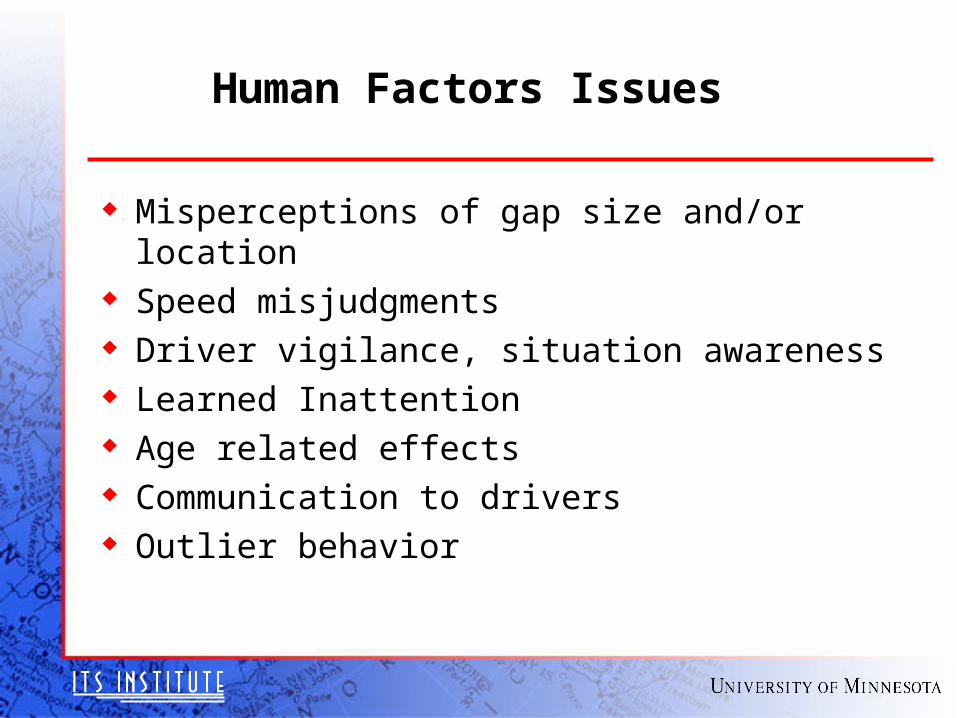
Misperceptions of gap size and/or location Speed misjudgments Driver vigilance, situation awareness Learned Inattention Age related effects Communication to drivers Outlier behavior
Human Factors Issues
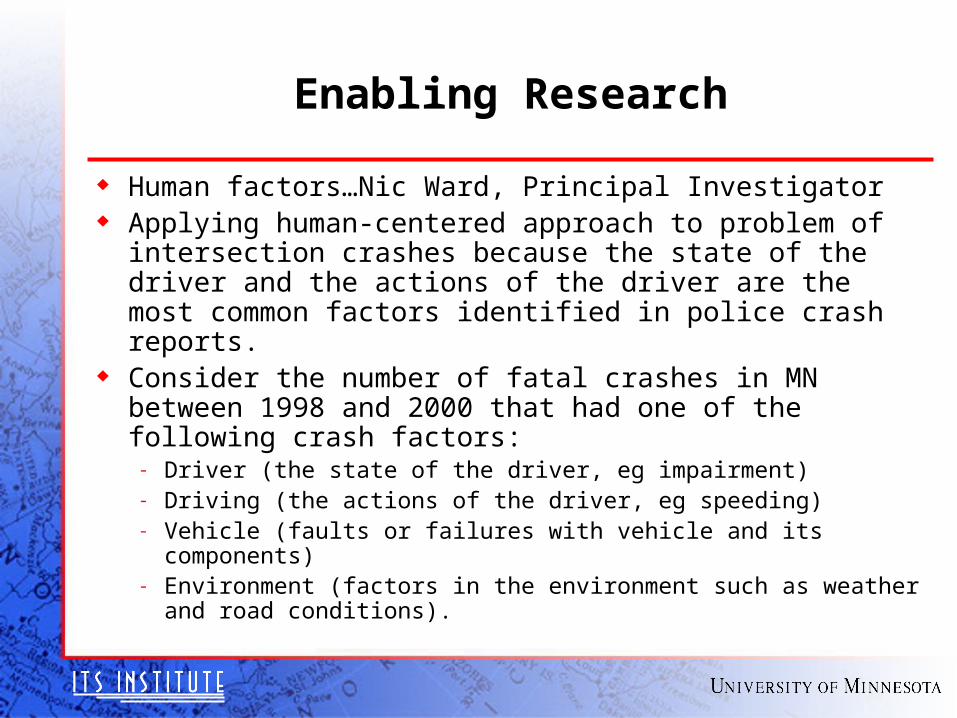
Enabling Research
Human factors…Nic Ward, Principal Investigator Applying human-centered approach to problem of
intersection crashes because the state of the driver and the actions of the driver are the most common factors identified in police crash reports.
Consider the number of fatal crashes in MN between 1998 and 2000 that had one of the following crash factors:
- Driver (the state of the driver, eg impairment)- Driving (the actions of the driver, eg speeding)- Vehicle (faults or failures with vehicle and its components)- Environment (factors in the environment such as weather and
road conditions).
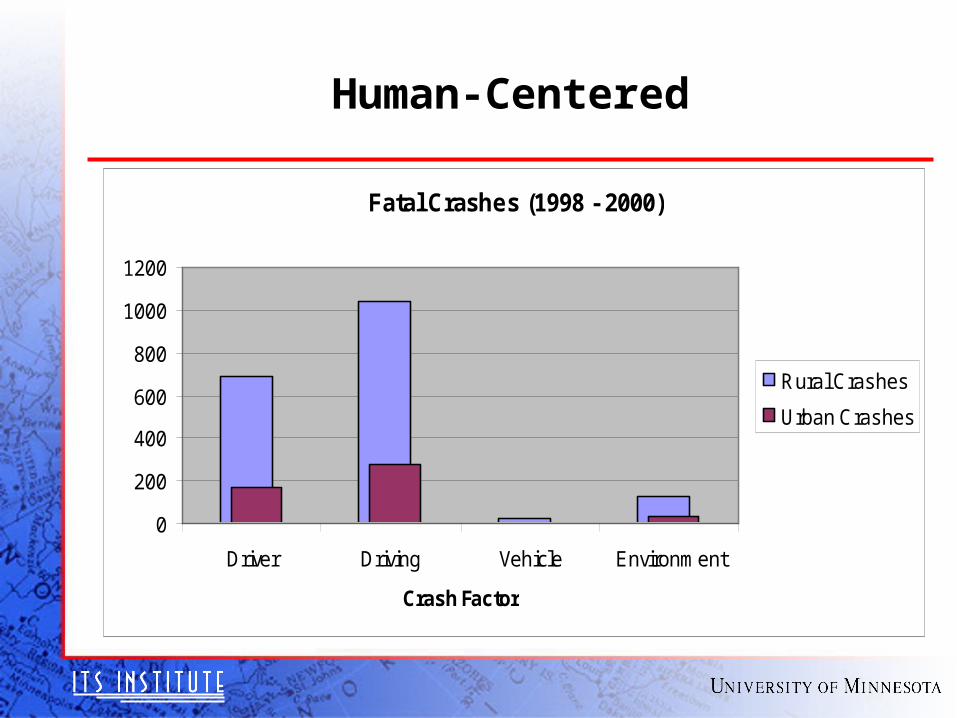
Human-Centered
Fatal Crashes (1998 - 2000)
0
200
400
600
800
1000
1200
Driver Driving Vehicle Environment
Crash Factor
Rural Crashes
Urban Crashes
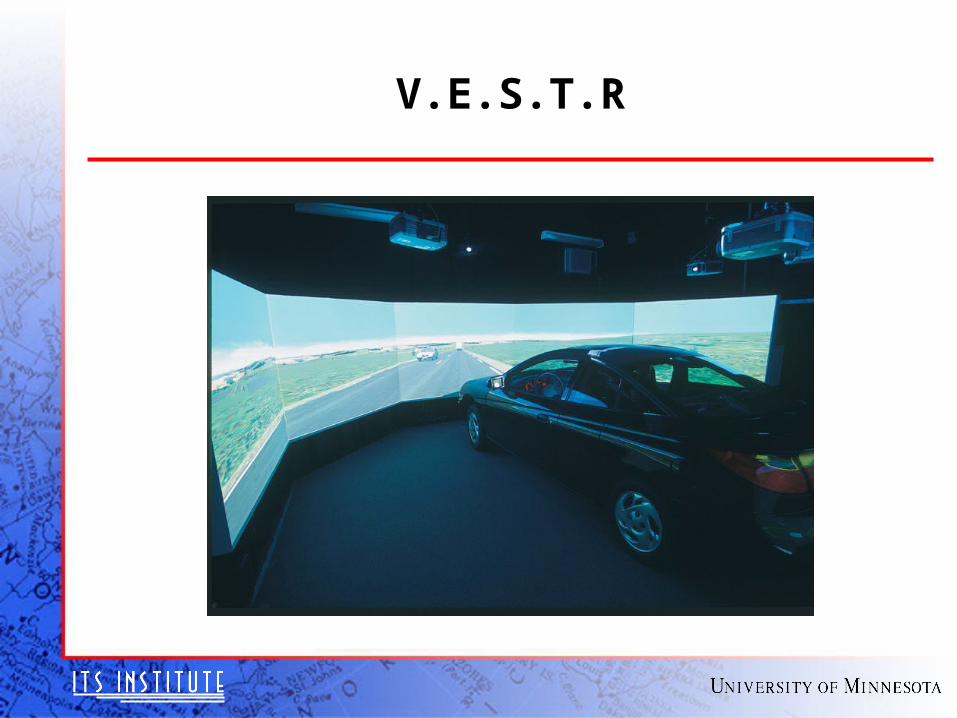
V.E.S.T.R
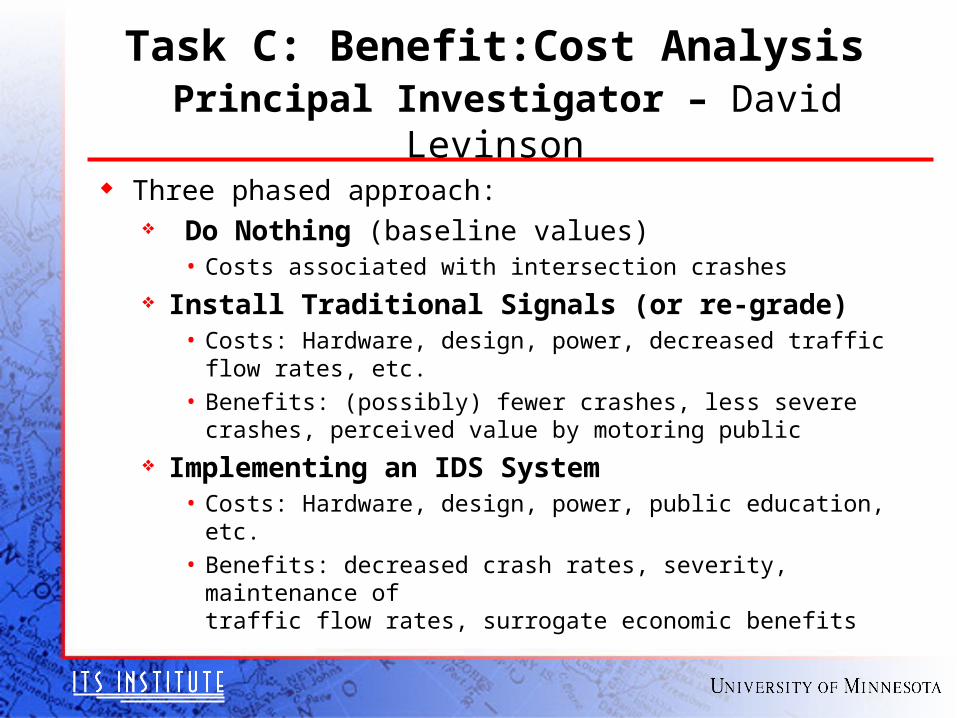
Task C: Benefit:Cost Analysis Principal Investigator – David Levinson
Three phased approach: Do Nothing (baseline values)
• Costs associated with intersection crashes
Install Traditional Signals (or re-grade)• Costs: Hardware, design, power, decreased traffic flow rates,
etc. • Benefits: (possibly) fewer crashes, less severe crashes,
perceived value by motoring public
Implementing an IDS System• Costs: Hardware, design, power, public education, etc.• Benefits: decreased crash rates, severity, maintenance of
traffic flow rates, surrogate economic benefits
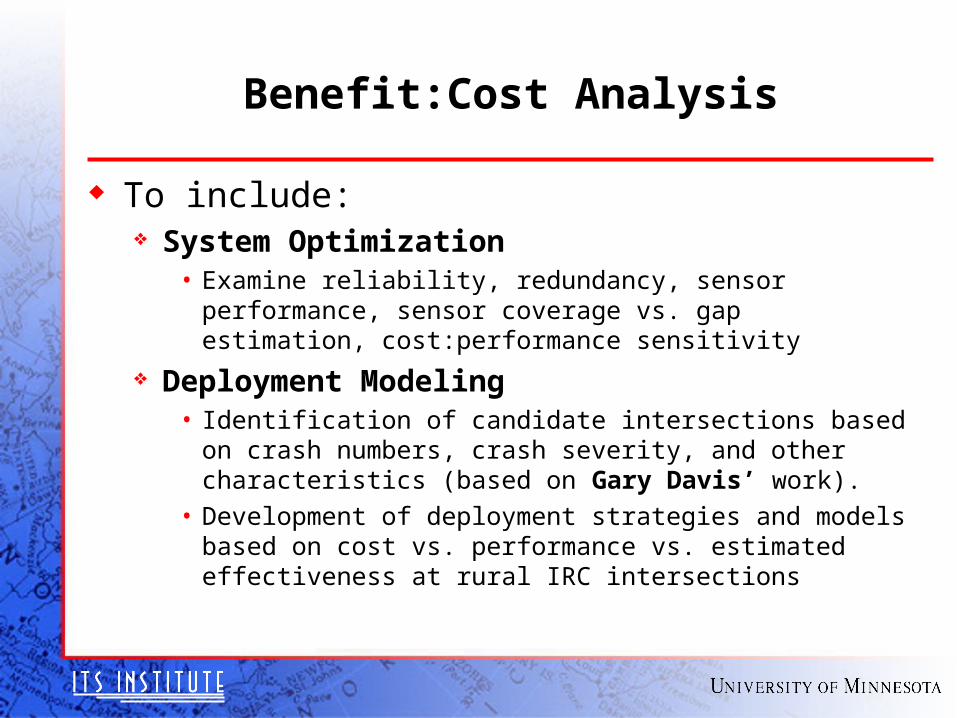
Benefit:Cost Analysis
To include: System Optimization
• Examine reliability, redundancy, sensor performance, sensor coverage vs. gap estimation, cost:performance sensitivity
Deployment Modeling• Identification of candidate intersections based on crash
numbers, crash severity, and other characteristics (based on Gary Davis’ work).
• Development of deployment strategies and models based on cost vs. performance vs. estimated effectiveness at rural IRC intersections
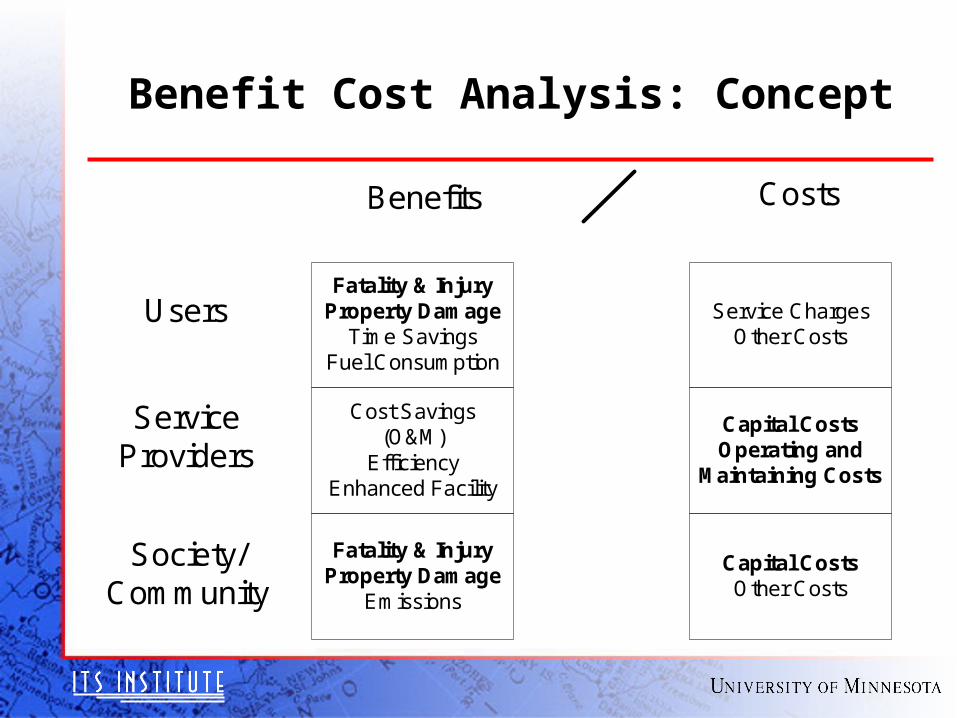
Benefit Cost Analysis: Concept
Service ChargesOther Costs
Fatality & InjuryProperty Damage
Time SavingsFuel Consumption
Benefits Costs
Users
ServiceProviders
Society/Community
Capital CostsOperating and
Maintaining Costs
Capital CostsOther Costs
Cost Savings(O&M)
EfficiencyEnhanced Facility
Fatality & InjuryProperty Damage
Emissions
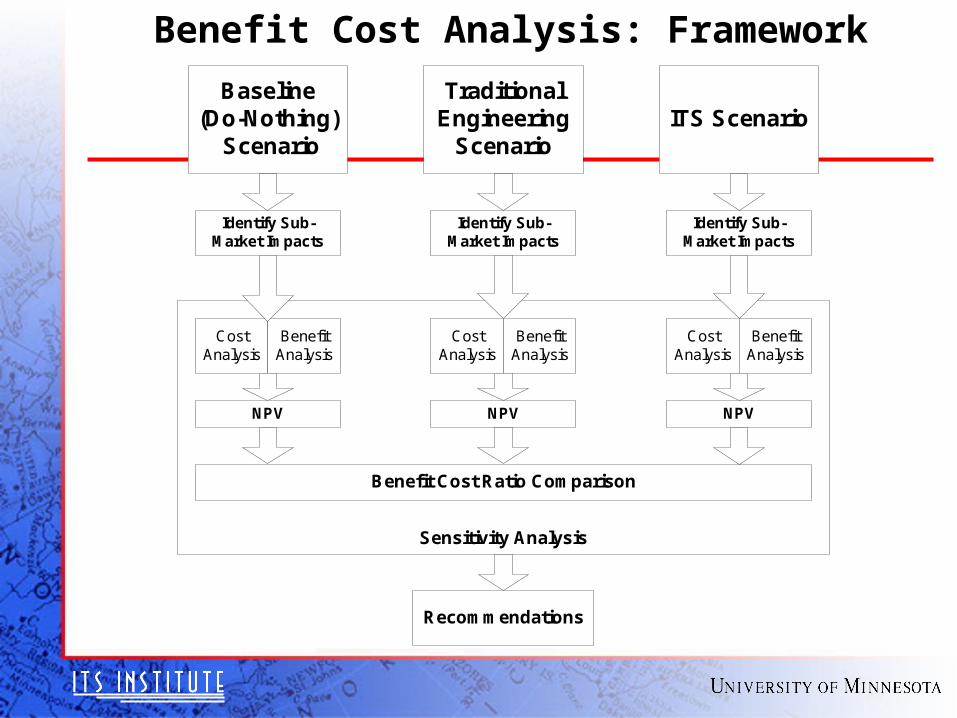
Benefit Cost Analysis: Framework
Sensitivity Analysis
TraditionalEngineering
ScenarioITS Scenario
Baseline(Do-Nothing)
Scenario
CostAnalysis
BenefitAnalysis
CostAnalysis
BenefitAnalysis
CostAnalysis
BenefitAnalysis
Benefit Cost Ratio Comparison
Recommendations
Identify Sub-Market Impacts
NPV NPV
Identify Sub-Market Impacts
Identify Sub-Market Impacts
NPV
Task D: System Requirements & Specification Definition
Functional Requirements System Requirements System Specifications Experimental MUTCD Approval
Driver interface likely to fall outside the normal devices found within the MUTCD. Will need to work to gain MUTCD approval as soon as candidate interface is determined