analysis of unsignalized intersection...
TRANSCRIPT
21
Analysis of Unsignalized Intersection Capacity
ADEBAYO B. BAKARE and PAUL P. JOVANIS
ABSTRACT
The conceptual bases of unsignalized intersection capacity procedures from the Swedish Capacity Manual and from the Interim U.S. Capacity Manual are compared, and the procedures are evaluated with field data from four intersections in the Chicago, Illinois, region. The Swedish method, based on principles of queueing theory and using parameters reflecting Swedish conditions, grossly overestimated capacity and underestimated delay. The empirically based U. s. method subs tant ially underestimated capacity, resulting in level of service values that were approximately one level of service too low. Causes of the poor estimation included critical gaps that were too small in the Swedish method and too large in the U.S. method and inappropriate definitions of dominant volumes. Based on the conceptual and empirical comparisons, er itical gaps were revised and dominant volumes were redefined in both methods. Evaluations of these revised procedures revealed much closer correspondence to field-measured values for capacity and delay. With revised critical gaps, the interim U.S. method appears to correspond fairly well with field data. The Swedish method, however, contained errors in capacity and delay estimates that were traced to probable differences in driver performance and traffic conditions in Sweden and in the United States. Preliminary tests of the Swedish delay model indicate that it can provide very accurate delay estimates if it is revised to reflect U.S. drivers and driving conditions.
Intersections of streets at grade in urban regions are critical portions of highways because they are primary sites of traffic accidents and points of considerable congestion and delay. The efficiency and capacity of the entire street system is generally dependent on the character ist ics of the intersections in the system. Although there has been considerable research conducted on the operation of signalized intersections, comparatively few studies have examined the operation of unsignalized intersections (l_) •
The Highway Capacity Manual <l> published in 1965 treated unsignalized intersections summarily. It recommended that where the volumes on the two minor streets at a two-way stop-signed intersection are low and most vehicles arriving at the STOP sign can enter or cross without substantial delay, an approximate method can be used to determine service volumes. "[A) signalized condition in which the signal split is prorated directly on the basis of the relative volumes on the intersecting streets, and inversely on the basis of their relative widths ••• " is assumed (2,p.156).
Since 1965 research studies in Germany (3), Swede.n (4), and Australia (5) have devel oped calculation -procedures for capacities at unsignalized
intersections. The German procedure was translated into English as Capacity of At-Grade Intersections (6) and after some modifications was adopted and p~blished in Transportation Research Circular 212 (7,pp.37-72). - The TRB Subcommittee on Unsignalized Intersec
tions submitted a memorandum report on the Circular 212 procedure at the TRB Annual Meeting in Washington, D.C., in January 1982. The report compared the Circular 212 procedure with the Swedish and Australian capacity manuals and applied it to some field data. Comments from other users of the procedure were received. The subcommittee concluded that the Circular 212 procedure used critical gap times that were too long, resulting in unusually low calculated capacities and level of service, especially for left turns and through movements from the minor road. Based on sight distance considerations, the subcommittee recommended the use of a maximum critical gap of 8.5 sec. Critical gap values given in the procedure were adjusted downward by 0.5 to 1.0 sec to allow for differences between German and U.S. driving conditions and drivers.
'!'he subcommittee acknowledged that the procedure in Circular 212 represented a major improvement in the evaluation of performance of nonsignalized intersections. Furthermore, it called for carefully structured research to study driver behavior and the various effects of geometric features. The group recommended that carefully constructed problems be worked out using this procedure as well as the Swedish and Australian methods.
RESEARCH OBJECTIVES AND METHODOLOGY
The overall objective of this research was an empirical comparison of procedures to estimate unsignalized intersection capacity and level of service. Before the empirical analysis was conducted, each major capacity analysis method was reviewed in terms of theoretical structure, applicability to a broad range of traffic conditions, and computational procedure. Procedures from Australia (5), Great Britain (.!!,), Sweden !!l , and the United - States <ll were reviewed and compared as part of a recently completed master's thesis at Northwestern University (_!). Based on this comparison and the recommendations of the TRB subcommittee report, the Swedish method and the method described in Circular 212 were selected for further testing.
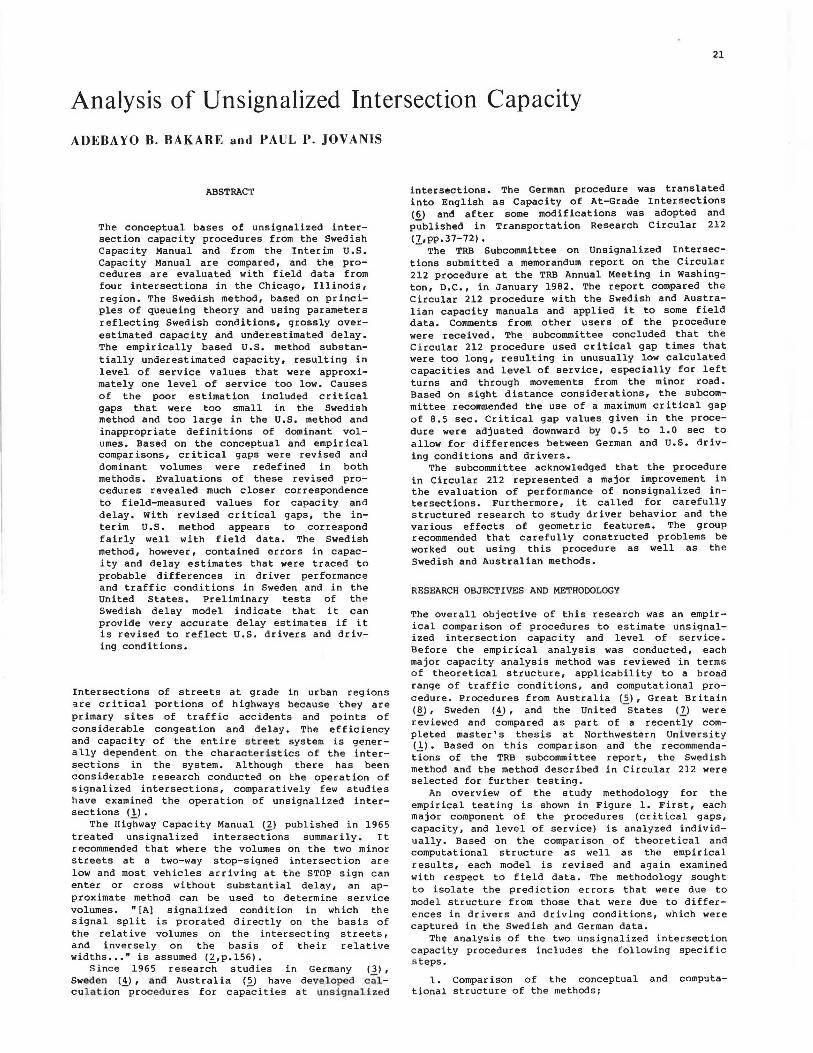
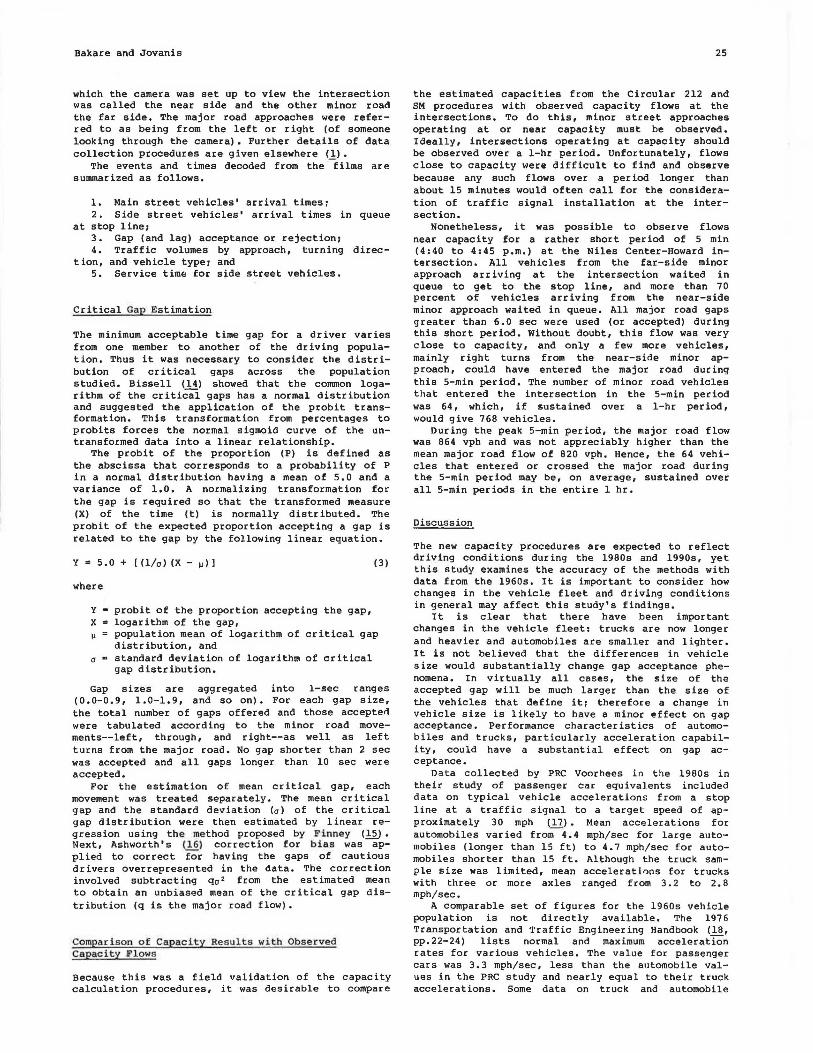
An overview of the study methodology for the empirical testing is shown in Figure 1. First, each major component of the procedures (critical gaps, capacity, and level of service) is analyzed individually. Based on the comparison of theoretical and computational structure as well as the empirical results, each model is revised and again examined with respect to field data. The methodology sought to isolate the prediction errors that were due to model structure from those that were due to differences in drivers and driving conditions, which were captured in the Swedish and German data.
The analysis of the two unsignalized intersection capacity procedures includes the following specific steps.
1. Comparison of the conceptual and computational structure of the methods;
22 Transportation Research Record 971
CRITICAL GAPS USED IN ANALYSIS
CAPACITY PROCEDURES COMPARED IN ANALYSIS
DELAY ESTIMATES COMPARED
ESTIMATED FROM MEASURED GAPS
OBSERVED MAXIMUM fLOW ~ CAPACITY
OBSERVED STOPPED DELAY
CIRCULAR 212 CRITICllL CllPS
CAPACITY ESTIMATED USING CIRCULllR 212
STOPPED DELAY ESTIMATED USING SWEDISH MANUAL
SUBCOMMITTEE CRITICAL GAPS
CAPACITY ESTIMATED USING SWEDISH MANUAL
SWEDISH MANUAL CRITICAL GAP~
CAPACITY ESTIMATED USING REVISED
CIRCULAR 212 PROC.
CAPACITY ES'rIMATEO USING REVISED
SWEDISH MANUAL PROC .
CONCLUSIONS
FIGURE 1 Flow chart of study methodology.
2. Collection of data on gaps at four two-way stop-sign controlled intersections and analysis of these data to estimate the mean critical gaps for the minor road movementsi
3. Comparison of the critical gaps obtained from field data with those in Circular 212, the subcommittee report, and the Swedish manuali
4. Determination of the capacities of minor road approaches and the level of service to minor road vehicles at the studied intersections using two capacity methods followed by comparison of these results with observed capacities and delays; and
5. Recommendation of revisions to the Circular 212 and Swedish procedures that would make the procedures more closely reflect U.S. drivers and driving conditions.
CAPACITY CALCULATION PROCEDURES
Transportation Research Circul ar 212
The procedure in Circular 212 ( 1) is a method for computing the capacity and level-of service of priority-type nonsignalized intersections (i.e., those intersections controlled by two-way STOP or YIELD signs). The computational steps involve identifying the nonpr ior i ty movements (all movements from the minor approaches and left tu r ns from the major road) / determining the traffic streams conflicting with each of the nonpriority movements, and then applying the appropriate critical gaps. The maximum (or potential) capacity for each movement is read from the graph of maximum capacity versus conflicting traffic stream. These capacities are then adjusted to account for intersection congestion caused by the servicing of conflicting movements.
When a lane is shared by traffic making more than one movement, the capacity of such lanes is determined using a proportioning equation of the form:
M134 = [CR+~+ CL]/[(CR/M1)
+ (~/M3) + (CL/M4)]
where
(1)
capacity of all streams using the shared lanei demand of the right, through, and left movements, respectivelyi and capacity of the right, through, and left individual streams, respec-tively, in passenger car equivalents per hour (pch) •
The existing (or projected) traffic demand for the movement is converted to passenger car equivalents per hour (pch) to account for approach grade and traffic mix. This demand is deducted from the calculated capacity to give what is called the reserve capacity . Reserve capacity determines what level of service (A through F) is assigned to the movement and describes the traffic delay that will be expected. If minor street delays are a function of er itical gap and major street volume, reserve capacity should correlate fairly well with delay. This capacity model assumes that
1. Vehicles on the major road arrive at random; 2. Minor road vehicles do not force their way
into the intersectioni and 3. Priority is given to traffic movements in the
following sequence: main street through and rightturn vehicles, minor street right turns, major street left turns, minor street vehicles crossing the major street, and minor street left turns.
It is important to recognize that the model structure implies specific rules about right-of-way allocation. For example, assumptions 2 and 3 imply that no minor road crossing or left-turning vehicle will move halfway across the major street, stop (blocking major street left turns), and then proceed. The assumptions also imply that minor road crossing traffic is not impeded by minor road left turns.
Swedish Manual
The Swedish manual (SM) based on a theoretical
(4) estimation procedure is queueing model that con-
Bakare and Jovanis
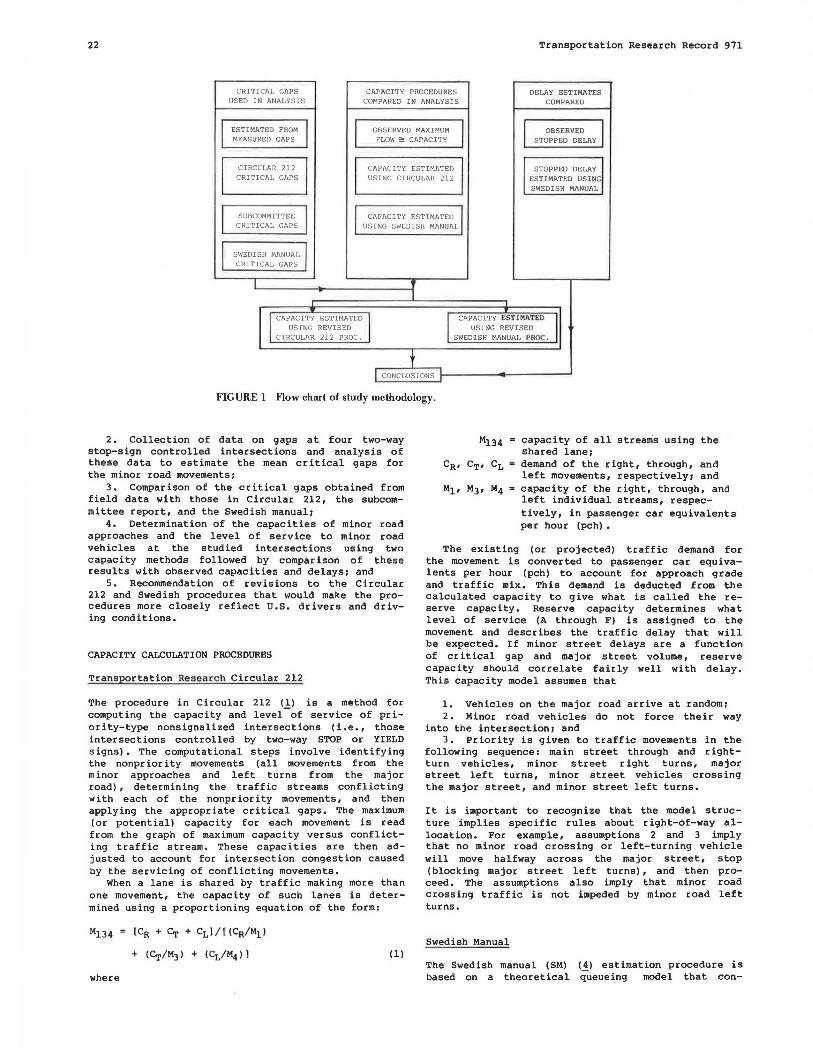
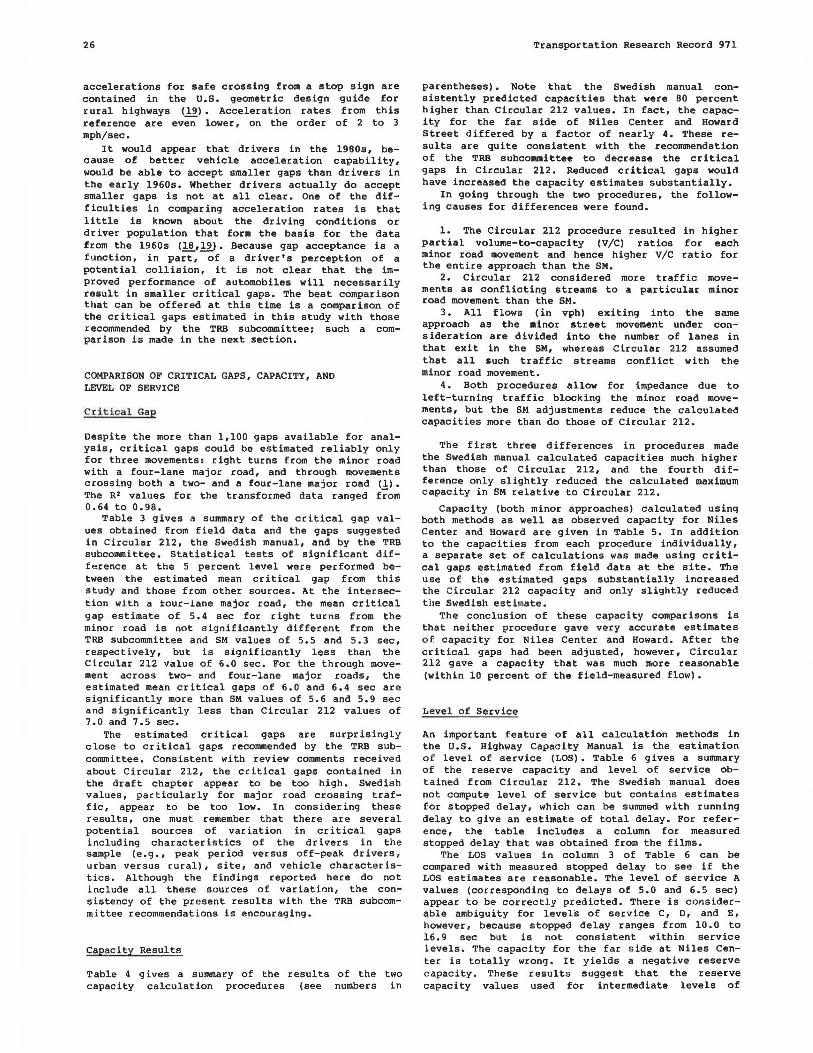
s iders each lane in the approach controlled by a STOP or YIELD sign as a service position. Service time is the time it takes a vehicle from the minor approach to move from the second position in queue, arrive at the stop line, and start to enter the intersection. This time and the rest of the total delay experienced by minor road vehicles are shown in Figure 2.
,:;-"' "' '" STOPLINE
"' u z
" E-<
~ "
VEHICLE 1
M = MOVE UP TIME
S = SERVI CE TIME
R = R1
+ R2
= RUNNING DELAY
W = WAITING TIME
D = R+W = TOTAL DELAY
FIGURE 2 Illustration of delay-service time relationship.
Service time for the movement was determined as a function of primary flow rates and er itical gap by using the relation
Service time= I / { q1 i~I [a+ (i -I)am J(a+i)•mfi(hi)dh;]} (2)
where
ql dominant volume in vehicles per second, a = critical gap in seconds,
am = 0.6a or move-up time in seconds, and fi(hi) headway distribution of the major
road flow (three headway distributions were assumed).
The Swedish researchers used Equation 2 to develop a series of curves relating critical gap, conflicting volume, and service time that are very similar to those in Circular 212. By assuming values for major road headway distribution that are other than exponential, the Swedish were able to develop two specific tables for nonrandom major street arrivals. Capacity is estimated by taking the inverse of service time. After the estimation of service time, a series of calculations is performed for level of service factors such as queue lengths, delay, and proportion of stopped vehicles.
The implications of this procedure can best be understood by examining Figure 2, which shows the trajectory of a minor road vehicle as it approaches a stop line, waits in a queue, and then proceeds through the intersection. When major road flows are very light, there is likely to be no queue when vehicles approach the intersection. Thus service time (with a constant move-up time) will underestimate capacity in these conditions.
The authors of the Swedish manual recognized some of these problems in their discussion of the manual
23
during the 1981 Transportation Research Board Annual Meeting. Peterson and Hannson (9) comment that U.S. traffic densities are much higher than the Swedish data base, raising concerns that U.S. conditions are beyond the range of data used to calibrate the model. Differences in driver characteristics also may affect values of move-up time (Ml and gap acceptance. The empirical analyses discussed later specifically compare the Swedish and U.S. values for these variables.
Discussion
The basic steps in the two procedures are similar. The input into either calculation model is critical gaps required by the nonpriority movement and the conflicting (or, more appropriately, dominant) traffic volume to the movement. The output from either model is maximum capacity, which is adjusted rnr congestion impedance and shared lane to give practical capacity.
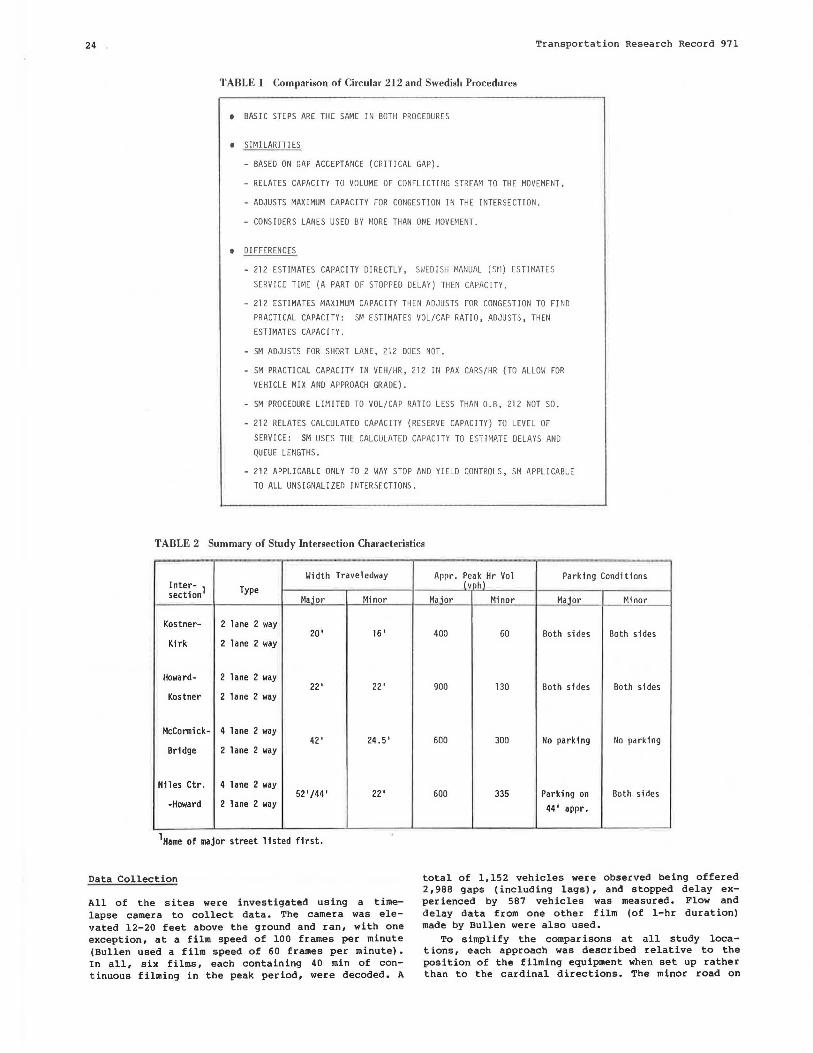
In addition to the different models used in the two procedures, Circular 212 defines conflicting streams to a nonpriority movement differently than does the SM. Furthermore, critical gaps listed in the SM are lower than those in Circular 212. A summary of other similarities and differences in the procedures is given in Table 1.
The Swedish manual procedure is very detailed, with many graphs and tables for use in corrections for variables like er itical gaps, number of lanes, and major road speeds. The computational steps are difficult to follow and understand, due in part to the unedited translation into English.
FIELD DATA COLLECTION AND PREPARATION
Site Locations
The films used in this study were originally collected by Carl N. Swerdloff (April 1962), Claude Yvon Gagnon (June and July 1962) , and researchers with the firm of De Leuw Cather and Company (1963). Data from a study by A. Graham Bullen (1964) are also used. Swerdloff (10) collected his information at two two-way STOP -Controlled intersections in Skokie, Illinois: Niles Center Road and Howard Street, and Howard Street and Kostner Avenue. Gagnon (11) also observed the intersection of Niles Center Road and Howard Street. De Leuw Cather (~) studied the intersection of Kastner Avenue and Kirk Street. Bullen (13) obtained data at the McCormick Boulevard-Bridge Street-Grey Street junction in Evanston, Illinois.
All approaches had good sight distance and speed limits of 30 mph. In addition, the sites were all located approximately 0.5 mile from the nearest traffic signal along any of the approach legs. Howard-Kostner and Kostner-Kirk intersections had two lanes on the major road, and Niles Center-Howard and McCormick-Bridge-Grey had four lanes. All the intersections were similar with respect to their crossing angle and had equal sight distance conditions from all approaches as given in Table 2.
The capacity model used in Circular 212 assumed a random or Poisson arrival of major road vehicles. This arrival pattern would result in an exponential distribution of headways (or gaps) in the major road traffic. A chi-square goodness-of-fit test was conducted comparing the actual gap distribution at the four- and two-lane, two-directional major roads with an exponential distribution. The test could not reject the null hypothesis that the gaps were exponentially distributed (a= .OS).
24 Transportation Research Record 971
TABLE 1 Comparison of Circular 212 and Swedish Procedures
I BASIC STE PS ARE THE SAME IN BOTH PROCEDURES
1 SIMILARITIES
- BASED ON GAP ACCEPTANCE (CRITICAL GAP).
- RELATES CAPACITY TO VOLUME OF CONFLICT! NG STREAM TO THE MOVEMENT.
- ADJUSTS MAXIMUM CAPACITY FOR CONGESTION IN THE INTERSECTION .
- CONSIDERS LANES USED BY MORE THAN ONE MOVEMENT.
t DIFFERENCES
- 212 ESTIMATES CAPACITY DIRECTLY, SflEOISH MMIU/\L (Sri) ESTIMATES
SERVICE TIME (A PART OF STOPPED DELAY) THEN CAPACITY.
- 212 ESTIMATES MAXIMUM CAPACITY THEN ADJUSTS FOR CONGESTION TO FIND
PRACTICAL CAPACITY: SM ESTIMATES VOL/CAP RATIO, ADJUSTS, THEN
ESTIMATES CAPAC !TY.
- SM ADJUSTS FOR SHORT LANE, 212 DOE S NOT.
- SM PRACTICAL CAPACITY IN VEH/HR, 212 rn PAX CARS/HR (TO ALLOW FOR
VEHICLE MIX AND APPROACH GRADE).
- SM PROCEDURE LIMITED TO VOL/CAP RATIO LESS THAN 0.8, 212 NOT SO.
- 212 RELATES CALCULATED CAPACITY (RESERVE CAPACITY) TO LEVEL OF
SERVICE: SM USES THE CALCULATED CAPACITY TO ES.II MATE DELAYS AND
QUEUE LHIGTHS.
- 212 APPLICABLE ONLY TO 2 WAY STOP AND YIELD CONTROLS, SM APPLICABLE
TO ALL UNSIGNALIZED INTERSECTIONS.
TABLE 2 Summary of Study Intersection Characteristics
Width Traveledway Appr. Peak Hr Vol Parking Conditions Inter- Type (voh) section1
Mai or Minor Maior Minor Ma1or Minor
Kastner- 2 lane 2 way 20' 16' 400 60 Both sides Both sides
Kirk 2 lane 2 way
Howard- 2 lane 2 way 22' 22' 900 130 Both sides Both sides
Kastner 2 lane 2 way
McConnick- 4 lane 2 way 42' 24.5' 600 300 No parking No parking
Bridge 2 lane 2 way
N11es Ctr. 4 lane 2 way 52'/44' 22' 600 335 Parking on Both sides
-Howard 2 lane 2 way 44' appr.
1Name of major street listed first.
Data Collection total of 1,152 vehicles were observed being offered 2, 988 gaps (including lags) , and stopped delay experienced by 587 vehicles was measured. Flow and delay data from one other film (of 1-hr duration) made by Bullen were also used.
All of the sites were investigated using a timelapse camera to collect data. The camera was elevated 12-20 feet above the ground and ran, with one exception, at a film speed of 100 frames per minute (Bullen used a film speed of 60 frames per minute). In all, six films, each containing 40 min of continuous filming in the peak period, were decoded. A
To simplify the comparisons at all study locations, each approach was described relative to the position of the filming equipment when set up rather than to the cardinal directions. The minor road on
Bakare and Jovanis
which the camera was set up to view the intersection was called the near side and the other minor road the far side. The major road approaches were referred to as being from the left or right (of someone looking through the camera). Further details of data collection procedures are given elsewhere (1).
The events and times decoded from the - films are summarized as follows.
1. Main street vehicles' arrival times; 2. Side street vehicles' arrival times in queue
at stop line; 3. Gap (and lag) acceptance or rejection; 4. Traffic volumes by approach, turning direc
tion, and vehicle type; and 5. Service time for side street vehicles.
Critical Gap Estimation
The minimum acceptable time gap for a driver varies from one member to another of the driving population. Thus it was necessary to consider the distribution of critical gaps across the population studied. Bissell (14) showed that the common logarithm of the critical gaps has a normal distribution and suggested the application of the probit transformation. This transformation from percentages to probits forces the normal sigmoid curve of the untransformed data into a linear relationship.
The probit of the proportion (P) is defined as the abscissa that corresponds to a probability of P in a normal distribution having a mean of 5.0 and a variance of 1. O. A normalizing transformation for the gap is required so that the transformed measure (X) of the time (t) is normally distributed. The probit of the expected proportion accepting a gap is related to the gap by the following linear equation.
Y = 5.0 + [(l/o) (X - 1J)]
where
Y probit of the proportion accepting the gap, X logarithm of the gap,
(3)
IJ population mean of logarithm of critical gap distribution, and
a standard deviation of logarithm of critical gap distribution.
Gap sizes are aggregated into 1-sec ranges (0.0-0.9, 1.0-1.9, and so on). For each gap size, the total number of gaps offered and those accepte<'I were tabulated according to the minor road movements--left, through, and right--as well as left turns from the major road. No gap shorter than 2 sec was accepted and all gaps longer than 10 sec were a ccepted.
For the estimation of mean crit i cal gap, each movement was treated separately. The mean critical gap and the standard deviation (0 ) of the critical gap distribution were then estimated by linear regression using the method proposed by Finney (!i). Next, Ashworth's ill> correction for b i as was applied to correct for having the gaps of cautious drivers overrepresented in the data. The correction involved subtracting q 0 2 from the estimated mean to obtain an unbiased mean of the critical gap distribution (q is the major road flow).
Comparison of Capacity Results with Observed Capacity Flows
Because this was a field validation of the capacity calculation procedures, it was desirable to compare
25
the estimated capacities from the Circular 212 and SM procedures with observed capacity flows at the intersections. To do this, minor street approaches operating at or near capacity must be observed. Ideally, intersections operating at capacity should be observed over a 1-hr period. Unfortunately, flows close to capacity were difficult to find and observe because any such flows over a period longer than about 15 minutes would often call for the consideration of traffic signal installation at the intersection.
Nonetheless, it was possible to observe flows near capacity for a rather short period of 5 min (4:40 to 4:45 p.m.) at the Niles Center-Howard intersection. All vehicles from the far-side minor approach arriving at the intersection waited in queue to get to the stop line, and more than 70 percent of vehicles arriving from the near-side minor approach waited in queue. All major road gaps greater than 6.0 sec were used (or accepted) during this short period. Without doubt, this flow was very close to capacity, and only a few more vehicles, mainly right turns from the near-side minor approach, could have entered the major road during this 5-min period. The number of minor road vehicles that entered the intersection in the 5-min period was 64, which, if sustained over a 1-hr period, would give 768 vehicles.
During the peak 5-min period, the major road flow was 864 vph and was not appreciably higher than the mean major road flow of 820 vph. Hence, the 64 vehicles that entered or crossed the major road during the 5-min period may be, on average, sustained over all 5-min periods in the entire 1 hr.
Discussion
The new capacity procedures are expected to reflect driving conditions during the 1980s and 1990s, yet this study examines the accuracy of the methods with data from the 1960s. It is important to consider how changes in the vehicle fleet and driving conditions in general may affect this study's findings.
It is clear that there have been important changes in the vehicle fleet: trucks are now longer and heavier and automobiles are smaller and lighter. It is not believed that the differences in vehicle size would substantially change gap acceptance phenomena. In virtually all cases, the size of the accepted gap will be much larger than the size of the vehicles that define it; therefore a change in vehicle size is likely to have a minor effect on gap acceptance. Performance characteristics of automobiles and trucks, particularly acceleration capability, could have a substantial effect on gap acceptance.
Data collected by PRC Voorhees in the 1980s in their study of passenger car equivalents included data on typical vehicle accelerations from a stop line at a traffic signal to a target speed of approximately 30 mph l.!ll . Mean accelerations for automobiles varied from 4. 4 mph/sec for large automobiles (longer than 15 ft) to 4.7 mph/sec for automobile s shorter than 15 ft. Although the truck sample size was limited, mean accelerations for trucks with three or more axles ranged from 3.2 to 2.8 mph/sec.
A comparable set of figures for the 1960s vehicle population is not directly available. The 1976 Transportation and Traffic Engineering Handbook (lB, pp.22-24) lists normal and maximum acceleration rates for various vehicles. The value for passenger cars was 3.3 mph/sec, less than the automobile values in the PRC study and nearly equal to their truck accelerations. Some data on truck and automobile
26
accelerations for safe crossing from a stop sign are contained in the u.s. geometric design guide for rural highways (19). Acceleration rates from this reference are even lower, on the order of 2 to 3 mph/sec.
It would appear that drivers in the 1980s, because of better vehicle acceleration capability, would be able to accept smaller gaps than drivers in the early 1960s. Whether drivers actually do accept smaller gaps is not at all clear. One of the difficulties in comparing acceleration rates is that little is known about the driving conditions or driver population that form the basis for the data from the 1960s (18,19). Because gap acceptance is a function, in part, of a driver's perception of a potential collision, it is not clear that the improved performance of automobiles will necessarily result in smaller critical gaps. The best comparison that can be offered at this time is a comparison of the critical gaps estimated in this study with those recommended by the TRB subcommitteei such a comparison is made in the next section.
COMPARISON OF CRITICAL GAPS, CAPACITY, AND LEVEL OF SERVICE
~ritical Gap
Despite the more than 1,100 gaps available for analysis, critical gaps could be estimated reliably only for three movements: right turns from the minor road with a four-lane major road, and through movements crossing both a two- and a four-lane major road (1). The R2 values for the transformed data ranged f;-om 0.64 to 0.98.
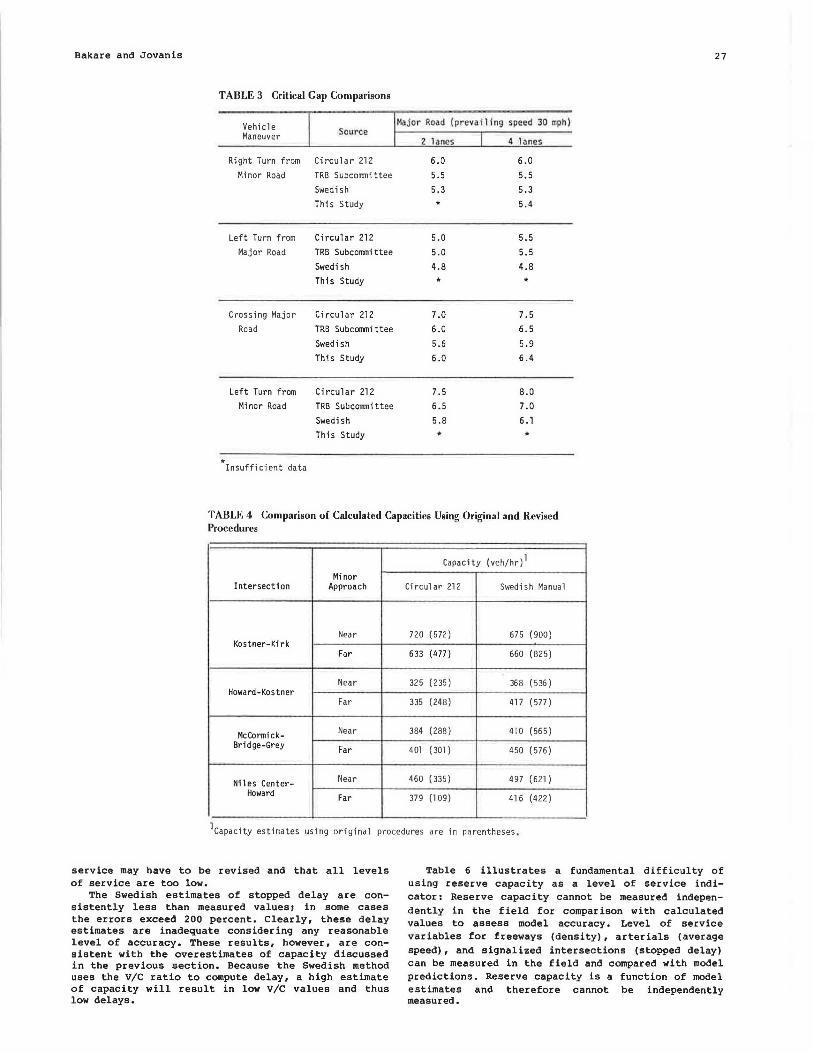
Table 3 gives a summary of the critical gap values obtained from field data and the gaps suggested in Circular 212, the Swedish manual, and by the TRB subcommittee. Statistical tests of significant difference at the 5 percent level were performed between the estimated mean critical gap from this study and those from other sources. At the intersection with a tour-lane major road, the mean critical gap estimate of 5. 4 sec for right turns from the minor road is not significantly different from the TRB subcommittee and SM values of 5.5 and 5.3 sec, respectively, but is significantly less than the Circular 212 value of 6.0 sec. For the through movement across two- and four-lane major roads, the estimated mean critical gaps of 6.0 and 6.4 sec are significantly more than SM values of 5.6 and 5.9 sec and significantly less than Circular 212 values of 7.0 and 7.5 sec.
The estimated critical gaps are surprisingly close to er itical gaps recommended by the TRB subcommittee. Consistent with review comments received about Circular 212, the er itical gaps contained in the draft chapter appear to be too high. Swedish values, particularly for major road crossing traffic, appear to be too low. In considering these results, one must remember that there are several potential sources of variation in critical gaps including characteristics of the drivers in the sample (e.g., peak period versus off-peak drivers, urban versus rural), site, and vehicle characteristics. Although the findings reported here do not include all these sources of variation, the consistency of the present results with the TRB subcommittee recommendations is encouraging.
Capacity Results
Table 4 gives a summary of the results of the two capacity calculation procedures (see numbers in
Transportation Research Record 971
parentheses). Note that the Swedish manual consistently predicted capacities that were 80 percent higher than Circular 212 values. In fact, the capacity for the far side of Niles Center and Howard Street differed by a factor of nearly 4. These results are quite consistent with the recommendation of the TRB subcommittee to decrease the er itical gaps in Circular 212. Reduced critical gaps would have increased the capacity estimates substantially.
In going through the two procedures, the following causes for differences were found.
1. The Circular 212 procedure resulted partial volume-to-capacity (V/C) ratios minor road movement and hence higher V/C the entire approach than the SM.
in higher for each ratio for
2. Circular 212 considered more traffic move-mente as conflicting streams to a particular minor road movement than the SM.
3. All flows (in vph) exiting into the same approach as the minor street movement under consideration are divided into the number of lanes in that exit in the SM, whereas Circular 212 assumed that all such traffic streams conflict with the minor road movement.
4. Both procedures allow for impedance due to left-turning traffic blocking the minor road movements, but the SM adjustments reduce the calculated capacities more than do those of Circular 212.
The first three differences in procedures made the Swedish manual calculated capacities much higher than those of Circular 212, and the fourth difference only slightly reduced the calculated maximum capacity in SM relative to Circular 212.
Capacity (both minor approaches) calculated using both methods as well as observed capacity for Niles Center and Howard are given in Table 5. In addition to the capacities from each procedure individually, a separate set of calculations was made using critical gaps estimated from field data at the site. The use of the estimated gaps substantially increased the Circular 212 capacity and only slightly reduced the Swedish estimate.
The conclusion of these capacity comparisons is that neither procedure gave very accurate estimates of capacity for Niles Center and Howard. After the er itical gaps had been adjusted, however, Circular 212 gave a capacity that was much more reasonable (within 10 percent of the field-measured flow).
Level of Service
An important feature of all calculation methods in the U.S. Highway Capacity Manual is the estimation of level of service (LOS). Table 6 gives a summary of the reserve capacity and level of service obtained from Circular 212. The Swedish manual does not compute level of service but contains estimates for stopped delay, which can be summed with running delay to give an estimate of total delay. For reference, the table includes a column for measured stopped delay that was obtained from the films.
The LOS values in column 3 of Table 6 can be compared with measured stopped delay to see if the LOS estimates are reasonable. The level of service A values (corresponding to delays of 5.0 and 6.5 sec) appear to be correctly predicted. There is considerable ambiguity for levels of service c, D, and E, however, because stopped delay ranges from 10. O to 16.9 sec but is not consistent within service levels. The capacity for the far side at Niles Center is totally wrong. It yields a negative reserve capacity. These results suggest that the reserve capacity values used for intermediate levels of
Bakare and Jovanis 27
TABLE 3 Critical Gap Comparisons
Vehicle Major Road (p revaili ng speed 30 mph) Maneuver Source
2 lanes 4 lanes
Right Turn from Circular 212 6.0 6.0 Minor Road TRB Subcommittee 5.5 5.5
Swedish 5.3 5.3 This Study * 5.4
Left Turn from Circular 212 5.0 5.5 Major Road TRB Subcommittee 5.0 5.5
Swedish 4.8 4.8 This Study * *
Crossing Major Circular 212 7.0 7.5 Road TRB Subcommittee 6.0 6.5
Swedish 5 .6 5.9 This Study 6.0 6.4
Left Turn from Circular 212 7.5 8.0 Minor Road TRB Subcommittee 6.5 7.0
Swedish 5.B 6.1 This Study * *
* Insufficient data
TABLE 4 Comparison of Calculated Capacities Using Original and Revised Procedures
Capacity (veh/hr) 1
Minor Intersection Approa ch Circular 212 Swedish Manual
Near 720 (572) 675 (900) Kastner-Kirk
Far 633 (477) 660 (825)
Near 325 ( 235) 368 (536) Howard-Kastner
Far 335 (248) 417 (577)
McCormick- Near 384 (288) 410 {565) Ori d ge-Grey Far 401 (301) 450 ( 576)
Nil es Center- Near 460 ( 335) 497 (621) Howard Far 379 (109) 416 (422)
1capacity estimates using original procedures are in parentheses.
service may have to be revised and that all levels of service are too low.
The Swedish estimates of stopped delay are consistently less than measured values: in some cases the errors exceed 200 percent. Clearly, these delay estimates are inadequate considering any reasonable level of accuracy. These results, however, are consistent with the overestimates of capacity discussed in the previous section. Because the Swedish method uses the V/C ratio to compute delay, a high estimate of capacity will result in low V/C values and thus low delays.
Table 6 illustrates a fundamental difficulty of using reserve capacity as a level of service indicator: Reserve capacity cannot be measured independently in the field for comparison with calculated values to assess model accuracy. Level of service variables for freeways (density), arterials (average speed), and signalized intersections (stopped delay) can be measured in the field and compared with model predictions. Reserve capacity is a function of model estimates and therefore cannot be independently measured.
28 Transportation Research Record 971
TABLE 5 Comparison of Estimates of Minor Approach Capacity with Observed Capacity
Intersection: Nil es Center-Howard
Capacity of Both Minor Practical Capacity Methods ApproacheS\vph)
*
* 1. Circular 212
using 212 tabular critical gaps
using estimated critical gaps
2. Swedish Manua 1 Procedure
using Swedish manual critical gaps
using estimated critical gaps
Field-Measured Flow
443
835
1043
1006
Based on 5 minute near-capacity flow (v/c > 0.9) 768
Major road flow in peak/hr = 820 vph
Equivalent major road flow during 5 minute near capacity (minor road)
fl ow = 864 vph
Actually pass. cars per hr., slightly less if vph.
TABLE 6 Comparison of Calculated and Field-Measured Level of Service
Circular 212 Average Stopped Delay (sec/veh)
Intersection Reserve Capacity (pch) LOS Swedish Manual Measured
Kastner- N 545 A 4 .0 5.0
Kirk F 444 A 3. 3 6.5
Mcward- H 176 D 4.9 1o.9
Kastner F 173 D 4.8 16 .1
Mc Carmi ck- N 79 E 7 .2 11 .o Bridge-Grey F 220 c 6 .2 10.0
Nil es Center- N 186 D 4 .8 11 .1
Howard F -204 - 26.5 38 .2
EVALUATION AND TESTING OF REVISED PROCEDURES generally too high and Swedish gaps too low, the revised procedure uses er itical gaps recommended by the TRB subcommittee. To allow consistent comparison with both the Circular 212 and Swedish methods, the same set of critical gaps was adopted for both procedures.
Model Revisions
The comparison of model structure as well as the empirical results indicate that substantial revisions are needed in both the Circular 212 and Swedish procedures. Changes were made in critical gaps as well as dominant traffic streams in an attempt to make the procedures more reflective of U.S. drivers and driving conditions.
Because Circular 212 critical gaps appeared to be
Several of the definitions of dominant flows used in the existing procedures were modified (see Figure 3). Contrary to the Swedish definition (9,p.6), right turns from the major road do affect th; minor road movements (by not signaling their intention to turn, or doing so when it is already too late for
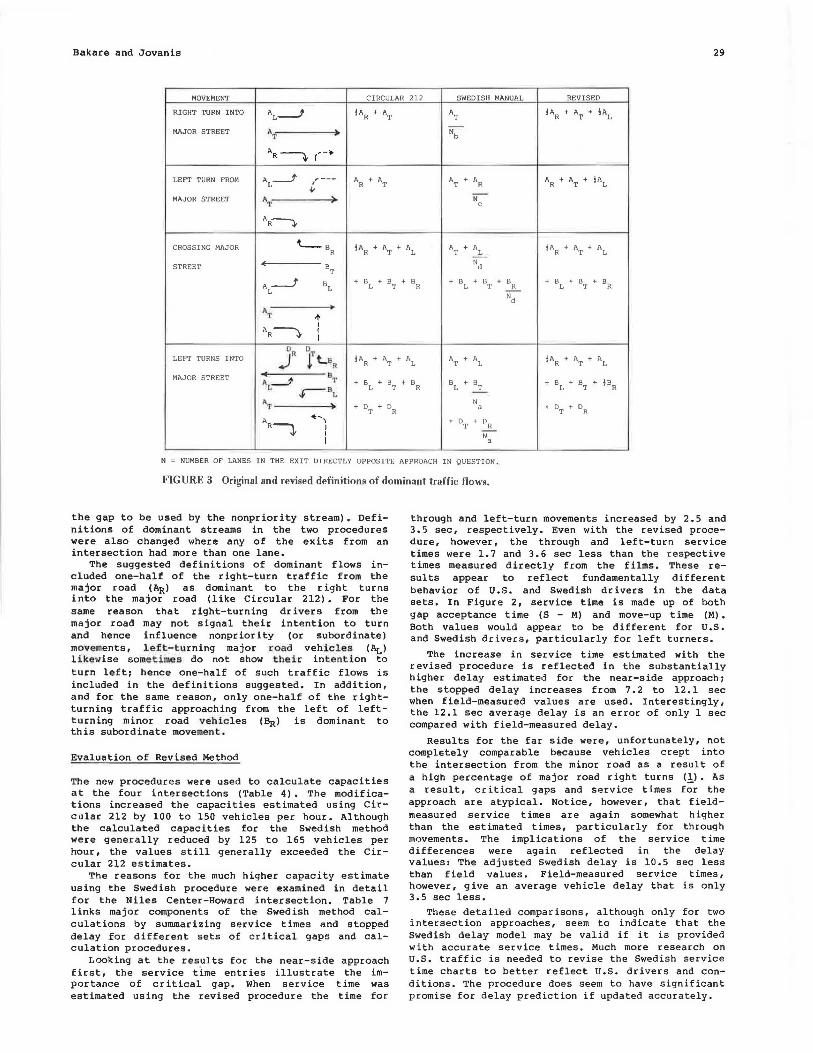
Bakare and Jovanis 29
MOVEMENT CIRCULAR 212 SWEDISH MANUAL REVISED
RIGHT TURN INTO AL._.} !A + A R T AT lAR + AT + !AL
-MAJOR STREET AT Nb
AR~ , ... -.. I
LEFT TURN FROM AL_J ' ,--- A + A A + A A + A + !AL
~ R T T R R T
MAJOR STREET AT ' -N-c
AR~
CROSSING MAJOR 't._ 9 !A + A + AL A + A !A + A + A R R T T L R T L
STREET - B ~ T
A ___J B + B + B + BR + BL + B + B + B + B + B L L T T ...!.... L T R
L Nd
AT ,,. I
AR~ I I
o. OR LEFT TURNS INTO J r t_eR !AR + AT + AL AT + A
L !A + A + A
R T L
-MAJOR STREET A __}> BT + B + B + B B + B + BL + BT + ~BR
L ,r--BL L T R L T
l\T + D + D N
D - a + D + T R T R
AR--i
~,, + D + D
I T R I N I a
N = NUMBER OF LANES IN THE EXIT DIRECTLY OPPOSITE APPROACH IN QUESTION.
FIGURE 3 Original and revised definitions of dominant traffic flows.
the gap to be used by the nonpriority stream). Definitions of dominant streams in the two procedures were also changed where any of the exits from an intersection had more than one lane.
The suggested definitions of dominant flows included one-half of the right-turn traffic from the major road (AR) as dominant to the right turns into the major road (like Circular 212). For the same reason that right-turning drivers from the major road may not signal their intention to turn and hence influence nonpriority (or subordinate) movements, left-turning major road vehicles (Ar,) likewise sometimes do not show thei r intention to turn lefti hence one-half of such traffic flows is included in the definitions suggested. In addition, and for the same reason, only one-half of the rightturning traffic approaching from the left of leftturning minor road vehicles (8R) is dominant to this subordinate movement.
Evaluation of Revised Method
The new procedures were used to calculate capacities at the four intersections (Table 4). The modifications increased the capacities estimated using Circular 212 by 100 to 150 vehicles per hour. Although the calculated capacities for the Swedish method were generally reduced by 125 to 165 vehicles per hour, the values still generally exceeded the Circular 212 estimates.
The reasons for the much higher capacity estimate using the Swedish procedure were examined in detail for the Niles Center-Howard intersection. Table 7 links major components of the Swedish method calculations by summarizing service times and stopped delay for different sets of critical gaps and calculation procedures.
r.ooking at the results for the near-side approach first, the service time entries illustrate the importance of critical gap. When service time was estimated using the revised procedure the time for
through and left-turn movements increased by 2.5 and 3.5 sec, respectively. Even with the revised procedure, however, the through and left-turn service times were 1.7 and 3.6 sec less than the respective times measured directly from the films. These results appear to reflect fundamentally different behavior of U.S. and Swedish drivers in the data sets. In Figure 2, service time is made up of both gap acceptance time (S - M) and move-up time (M). Both values would appear to be different for U.S. and Swedish drivers, particularly for left turners.
The increase in service time estimated with the revised procedure is reflected in the substantially higher delay estimated for the near-side approach; the stopped delay increases from 7. 2 to 12 .1 sec when field-measured values are used. Interestingly, the 12.1 sec average delay is an error of only l sec compared with field-measured delay.
Results for the far side were, unfortunately, not completely comparable because vehicles crept into the intersection from the minor road as a result of a high percentage of major road right turns <l>· As a result, critical gaps and service times for the approach are atypical. Notice, however, that fieldmeasured service times are again somewhat higher than the estimated times, particularly for through movements. The implications of the service time differences were again reflected in the delay values: The adjusted Swedish delay is 10.5 sec less than field values. Field-measured service times, however, give an average vehicle delay that is only 3.5 sec less.
These detailed comparisons, although only for two intersection approaches, seem to indicate that the Swedish delay model may be valid if it is provided with accurate service times. Much more research on U.S. traffic is needed to revise the Swedish service time charts to better reflect U.S. drivers and conditions. The procedure does seem to have significant promise for delay prediction if updated accurately.
30
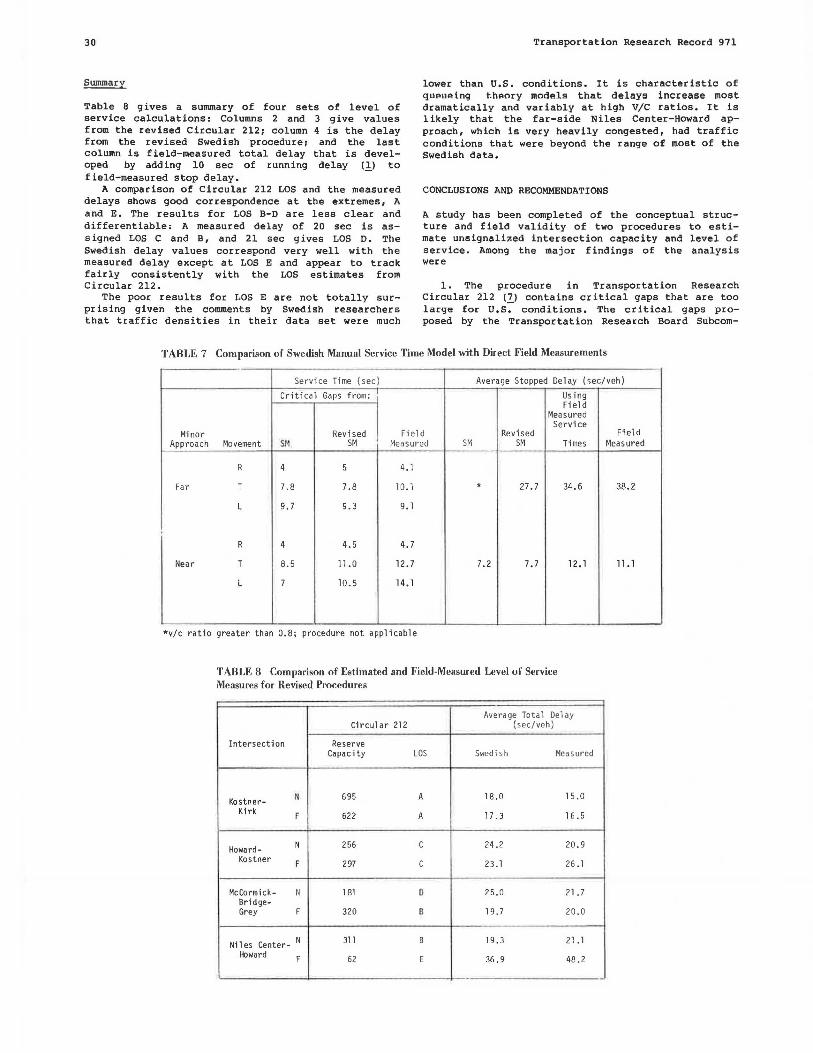
Summary
Table 8 gives a summary of four sets of level of service calculations: Columns 2 and 3 give values from the revised Circular 212; column 4 is the delay from the revised Swedish procedure; and the last column is field-measured total delay that is developed by adding 10 sec of running delay (.!_) to field-measured stop delay.
A comparison of Circular 212 LOS and the measured delays shows good correspondence at the extremes, A and E. The results for LOS B-D are less clear and differentiable: A measured delay of 20 sec is assigned LOS C and B, and 21 sec gives LOS D. The Swedish delay values correspond very well with the measured delay except at LOS E and appear to track fairly consistently with the LOS estimates from Circular 212.
The poor results for LOS E are not totally surprising given the comments by Swedish researchers that traffic densities in their data set were much
Transportation Research Record 971
lower than u.s. conditions. It is characteristic of queueing theory models that delays increase most dramatically and variably at high V/C ratios. It is likely that the far-side Niles Center-Howard approach, which is very heavily congested, had traffic conditions that were beyond the range of most of the Swedish data.
CONCLUSIONS AND RECOMMENDATIONS
A study has been completed of the conceptual structure and field validity of two procedures to estimate unsignalized intersection capacity and level of service. Among the major findings of the analysis were
1. The procedure in Transportation Research Circular 212 !ll contains critical gaps that are too large for U.S. conditions. The critical gaps proposed by the Transportation Research Board Subcom-
TABLE 7 Comparison of Swedish Manual Service Time Model with Direct Field Measurements
Service Time (sec) Average Stopped Delay (sec/veh)
Critical Gaps from: Using Field
Measured Service
Minor Revised Field Revised Approach Movement SM SM Measured SM SM Times
R 4 5 4.1
Far T 7.8 7.8 10.1 * 27. 7 34.6
L 9.7 9.3 9.1
R 4 4.5 4.7
Near T 8. 5 11.0 12.7 7.2 7.7 12.1
L 7 10.5 14.1
*v/c ratio greater than 0.8; procedure not applicable
TABLE 8 Comparison of Estimated and Fieh1-MeasW'etl Level ur Service Measures for Revised Procedures
Average Total Delay Circular 212 (sec/veh)
Intersection Reserve Capacity LOS Swedish Measured
Kastner- ti 695 A 18.0 15 .0
Kirk F 622 A 17. 3 16 . 5
Howard- N 256 c 24 .2 20.9
Kastner F 297 c 23. l 26. l
McCormick- N 181 0 25.0 21 .7 Bridge-Grey F 320 R 19. 7 20.0
Nil es Center- N 311 B 19.3 21 . 1
Howard F 62 E 36. 9 48 .2
Field Measured
38.2
11.1
Bakare and Jovanis
mittee on Unsignalized Intersections appeared to be more rational and better reflect the data in this study.
2. When critical gaps were revised and some modification was made to the definitions of dominant volumes, the Circular 212 procedure gave satisfactory estimates for LOS A and E but could not clearly differentiate levels B-D.
3. The procedure in the Swedish Capacity Manual <!l consistently overestimated capacities and underestimated delays. The critical gaps proposed in the method were generally too small for u.s. drivers.
4. When er itical gaps and dominant flows were redefined, the Swedish procedure still gave higher capacities than Circular 212. Delays from the revised procedure corresponded fairly well with fieldmeasured values.
5. Detailed comparison of field data with values in the Swedish manual indicated that fundamentally different driver behavior in the United States and in Sweden contributes to some of the method's inaccuracy. When the Swedish delay model was used with capacity (service time) data obtained directly from the field, very accurate estimates of delay were obtained. The results imply that the delay model is conceptually sound but needs to be used with data that more accurately reflect U.S. drivers and conditions.
rt is recommended that further field testing be conducted using the Circular 212 procedure. Although the number of intersections in this study was limited, it is clear that critical gaps should be changed and that dominant volumes may need revision. Further field tests are needed to generalize these research results.
It is strongly recommended that a research study be conducted to determine the applicability of the Swedish method to u.s. conditions. A major potential advantage of the Swedish method is its use at fourway stop signs and at two-way stops with platooned major street volumes. The Circular 212 procedure is valid only for two-way stop or yield control with random major street arrivals, a condition that does not exist in many urban areas where controls are located near signalized crossings.
The other major advantage of the Swedish method is the output of estimated delay per vehicle. If the method can be adapted to U.S. conditions, a procedure would be available to estimate minor street delays for traffic signal warrants. Obviously a major field data collection and analysis effort will be required to revise the Swedish manual. In the long term, this is probably a worthwhile investment. The Circular 212 procedure, with revised critical gaps and possibly revised dominant flows, would seem to perform adequately in the meantime.
REFERENCES
1. A.B. Bakare. Field Tests of Procedures for Calculating Capacity at Unsignalized Intersections. M.S. thesis. Northwestern University, Evanston, Ill., 1983.
2. Highway Capacity Manual 1965. Special Report 87. HRB, National Research Council, Washington, D.C., 1965, 397 pp.
31
3. Merblatt for Lichtsignalanlogen an Landstrassen, Ausgabe 1972. Forschungshesellschaft fur das Strassenwessen, Koln, Federal Republic of Germany, 1972.
4. Berakning av kapacitet, kolangd, fordronjnnig i vagtarfikanlaggningar. TV 131. Statens Vagverk, Stockholm, Sweden, (unpublished English translation, 1982).
5. Road Design Manual for Rural and Urban Roads other than Freeways. County Roads Board, Victoria, Australia, Jan. 1974.
6. Capacity of At-Grade Junctions. Organization for Economic Co-operation and Development, Paris, France, 1974.
7. Unsignalized Intersections. In Interim Materials on Highway Capacity, Transportation Research Circular 212. TRB, National Research Council, Washington, D.C., Jan. 1980, pp. 37-72.
8. R.M. Kimber and R.D. Coombe. The Traffic Capacity of Major/Minor Priority Junctions. Supplemental Report 582. Transport and Road Research Laboratory, Crowthorne, Berkshire, England, 1980.
9. B.E. Peterson and A. Hannson. Swedish Capacity Manual. In Transportation Research Record 667, TRB, National Research Council, Washington, D.C., 1978, pp. 1-10, 21-28.
10. c. Swerdloff. A Study of Gap Acceptance at a Stop Sign Location. M.S. thesis. Northwestern University, Evanston, Ill., 1962.
11. C.Y. Gagnon. Effect of Size of Gaps in Line on Acceptance of the Lag at a Stop Sign. M.S. thesis. Northwestern university, Evanston, Ill., 1962.
12. De Leuw, Cather and Company. Effect of Control Devices on Traffic Operations. NCHRP Report 41. HRB, National Research Council, Washington, D.C., 1967, 84 pp.
13. G.R. Bullen. Field Test of an Intersection Simulation Model. M.S. thesis. Northwestern University, Evanston, Ill., 1964.
14. H.H. Bissell. Traffic Gap Acceptance from a Stop Sign. Graduate research report. University of California Institute of Transportation and Traffic Engineering, Berkeley, 1960.
15. D.J. Finney. Probit Analysis, A Statistical Treatment of the Sigmoid Response Curve. Cambridge University Press, Cambridge, England, 1974.
16. R. Ashworth. A Note on the Selection of Gap Acceptance Criteria for Traffic Simulation Studies. In Transportation Research 2, Pergamon Press, London, England, 1968, pp. 171-175.
17. R. Sumner, D. Hill, and s. Shapiro. Passenger Car Equivalence on Urban Arterial Roads. PRC Voorhees, McLean, Va., Nov. 1981.
18. Institute of Traffic Engineers. Transportation and Traffic Engineering Handbook. Prentice Hall, Englewood Cliffs, N.J., 1976.
19. A Policy on Geometric Design of Rural Highways. AASHTO, Washington, D.C., 1965.
Publication of this paper sponsored by Committee on Highway Capacity and Quality of Service.