hank courtright senior vice president environment sector...
TRANSCRIPT

Role of Renewable Energy in Future Electricity Supply
2006 NARUC Summer MeetingSan FranciscoJuly 30, 2006
Hank CourtrightSenior Vice PresidentEnvironment Sector and Member Services
2© 2006 Electric Power Research Institute, Inc. All rights reserved.
0
1000
2000
3000
4000
5000
6000
7000
1980 1985 1990 1995 2000 2005 2010 2015 2020 2025 2030
Renewable/Other Nuclear Natural Gas Petroleum Coal
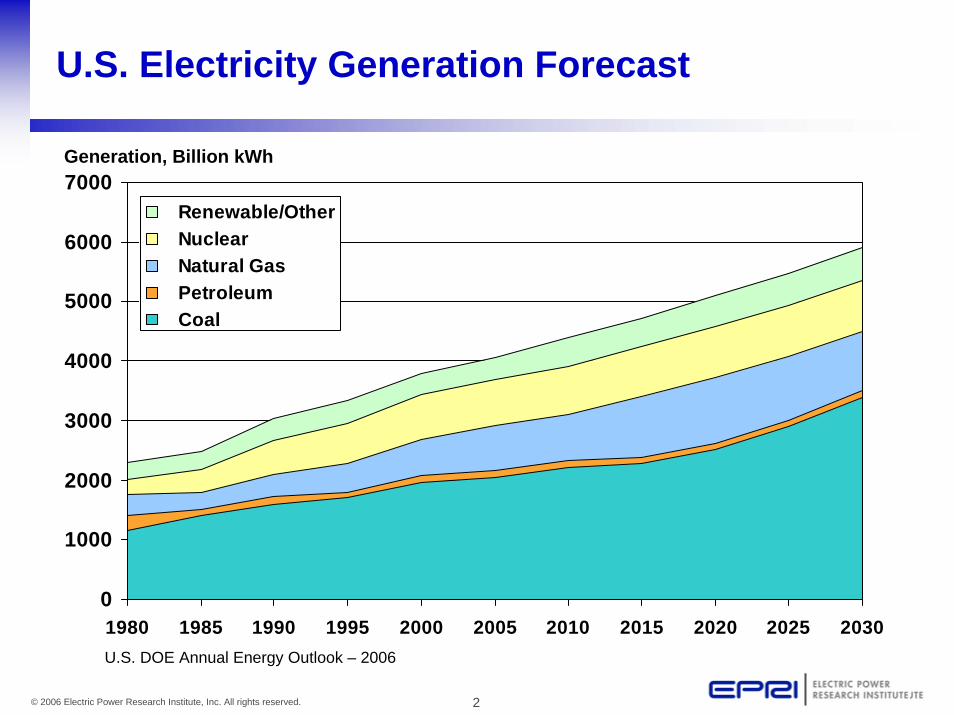
U.S. DOE Annual Energy Outlook – 2006
Generation, Billion kWh
U.S. Electricity Generation Forecast

3© 2006 Electric Power Research Institute, Inc. All rights reserved.
Renewable Energy Technology Status 2005 World
Installed MW Issues
Wind Commercial 52,100 Integration at Large Scale
Solar PV Commercial 3,900 Conversion Efficiency and Cost
Solar Thermal Demo andPre-Commercial 370 High Capital Cost
Biomass Combustion Commercial 20,000 High Fuel Cost
Biomass Gasification Pilot and Demo <20 Hot Gas Cleanup
Ocean Energy Pilot and Demo <20 Cost and Reliability
Renewable Energy Technology Overview
Source: EPRI Renewable Energy Technical Assessment Guide: TAG-RE 2005 (1010407, 12/05)

4© 2006 Electric Power Research Institute, Inc. All rights reserved.
State of the Global Renewable Energy Market160,000 MW Installed Growing at 25 GW/Year
0
20
40
60
80
100
120
140
160
World DCs EU 25 US Japan
SolarGeothermalBiomassWindpowerSmall Hydro
Plus:
720,000 MW Large Hydro
220,000 MW (th) Biomass Heating
28,000 MW (th) Geothermal Heating
77,000 MW (th) Solar Heating
1,000 MW of off-grid solar PV systems
“New Renewables”Installed Base (000 MW)
Total Renewable Energy = 1,206,000 MW Equivalent for Electricity and Heating Around the World
Source: Renewables 2005: Global Status Report

5© 2006 Electric Power Research Institute, Inc. All rights reserved.
0
500
1000
1500
2000
2500
3000
3500
1990 1995 2000 2005 2010Sources: AWEA, GE Wind, and ACORE
U.S. Wind Power Installations,MW/Year
9,700 MW installed base, 200535,000 MW estimated by 2015Key Issues: . Turbine availability . RPS extension past 2007. Siting and transmission
InstalledRPS RequiredNew
Wind Power

6© 2006 Electric Power Research Institute, Inc. All rights reserved.
Per capita income in 1999
45,000
25,000
5,000
StatusCompleted
Proposed
Speculative
Under development
Wind Installations in U.S.
Source: GE

7© 2006 Electric Power Research Institute, Inc. All rights reserved.
Sources: PV News and ACORE
U.S. Solar PV Installations,MW/Year
E
Approximate 5,000 MW in place Adding 1,500 MW/year globally
Key Issues:• Global competition • Distribution system impact
0
50
100
150
200
250
2000 2001 2002 2003 2004 2005 2006
GridOff-Grid
Solar PV$7 Billion/Year Global Industry
8© 2006 Electric Power Research Institute, Inc. All rights reserved.
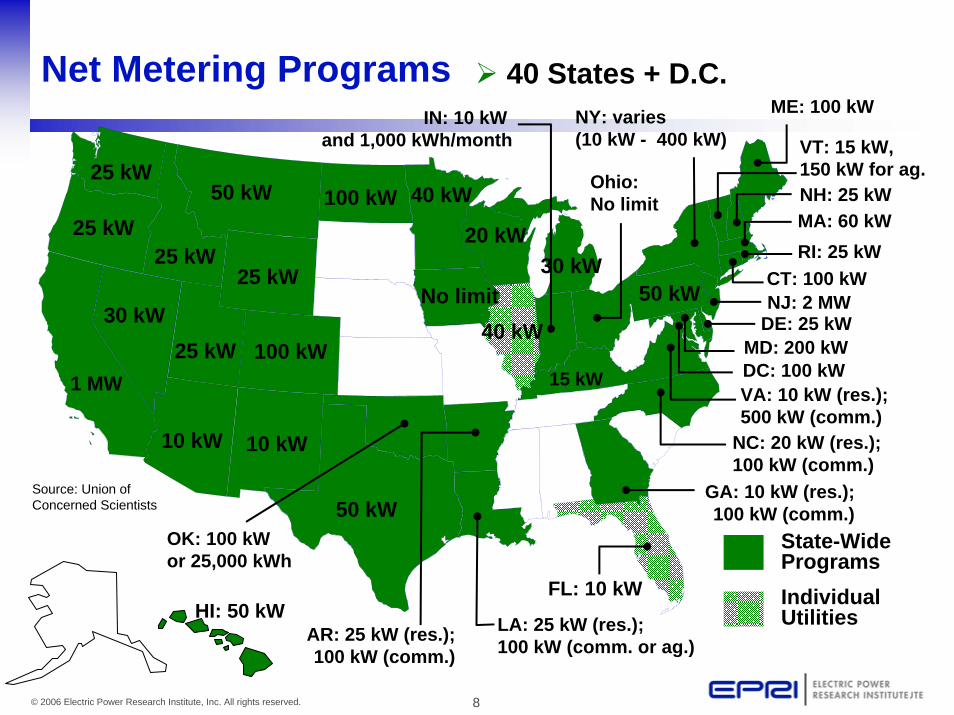
Net Metering Programs
MA: 60 kW
CT: 100 kWRI: 25 kW
VA: 10 kW (res.);500 kW (comm.)
NJ: 2 MWDE: 25 kW
1 MW
NY: varies (10 kW - 400 kW)
Ohio:No limit
100 kW
10 kW10 kW
30 kW
25 kW
25 kW
25 kW
50 kW
25 kW
25 kW
No limit
50 kW
100 kW 40 kW
20 kW
HI: 50 kW
50 kW
OK: 100 kW or 25,000 kWh
AR: 25 kW (res.);100 kW (comm.)
LA: 25 kW (res.); 100 kW (comm. or ag.)
40 kW
15 kW
IN: 10 kW and 1,000 kWh/month
GA: 10 kW (res.);100 kW (comm.)
State-Wide ProgramsIndividual Utilities
ME: 100 kW
MD: 200 kW
NH: 25 kW
40 States + D.C.
VT: 15 kW, 150 kW for ag.
FL: 10 kW
30 kW
DC: 100 kW
NC: 20 kW (res.);100 kW (comm.)
Source: Union ofConcerned Scientists

9© 2006 Electric Power Research Institute, Inc. All rights reserved.
500 MW Contracts
Incremental Hydro
Solar Dish-Sterling:350 MW Contracts
Solar Trough:50 MWUnderConstruction
Geothermal, Hydropower and Solar Thermal-Electric

10© 2006 Electric Power Research Institute, Inc. All rights reserved.
0
1000
2000
3000
4000
5000
6000
1985 1995 2005
Million Gallons/Year
Biofuel options:• Corn-based ethanol fuel• Cellulosic ethanol fuel• Bio-diesel – U.S. and EuropeEst
Corn-Based Ethanol
Source: Renewable Fuels Association and ACORE
Renewable FuelsU.S. Ethanol and BiodieselOver $2 Billion Invested in 2005

11© 2006 Electric Power Research Institute, Inc. All rights reserved.
*From Columbia Univ. Earth Engineering Center, 2003
Municipal Solid Waste (MSW) or Waste to Energy (W-T-E) Generation
• W-T-E Generation is driven by increasing land fill costs, $50–75/ton in some areas…it’s not the cheapest source of electric energy.
• Up to 34% of Municipal Solid Waste in New England goes to energy, 27% recycled, 39% to land fill.*
• For the U.S. 50 States average is 7% combusted, 32% recycled, and 61% to land fill.*

12© 2006 Electric Power Research Institute, Inc. All rights reserved.
Goal
*PA: 18%¹ by 2020*NJ : 6.5% by 2008
CT: 10% by 2010
MA: 4% by 2009 + 1% annual increase
WI: 2.2% by 2011
IA: 105 MW
MN: 1,125 MW wind by 2010
TX: 5,880 MW by 2015
*NM: 10% by 2011*AZ: 1.1% by 2007
CA: 20% by 2010
*NV: 20% by 2015
ME: 30% by 2000
State RPS
*MD: 7.5% by 2019
*Minimum requirement and/or increased credit for solar¹ PA: 8% Tier I, 10% Tier II (includes non-renewable sources)
HI: 20% by 2020
RI: 15% by 2020
*CO: 10% by 2015
*DC: 11% by 2022
January 2006
NY: 25% by 2013MT: 15% by 2015
*DE: 10% by 2019
Renewable Portfolio Standards
Source: Interstate Renewable Energy Council

13© 2006 Electric Power Research Institute, Inc. All rights reserved.
0
6,000
12,000
18,000
24,000
30,000
36,000
42,000
2000
2001
2002
2003
2004
2005
2006
2007
2008
2009
2010
2011
2012
2013
2014
2015
2016
2017
Meg
awat
ts
Pennsylvania
*Assumes regulatory enforcement of voluntary RES.
Hawaii
California
Nevada
IA & WI
New Jersey
CT & RIMAMaine
Minnesota
AZ & NM
New York
Texas
New renewable energy supported:32,000 MW by 2017
Maryland
CO & MT
Illinois*
DC & DE
Source: Union of Concerned Scientists
The Supply Effect of RPS

14© 2006 Electric Power Research Institute, Inc. All rights reserved.
0
2000
4000
6000
8000
10000
2001 2002 2003 2004 2005
EstimateProjectsTechnology and Service CosDevelopers
Renewable Energy Global M&A Activity, $ Millions
ACORE’s RE Finance Forum 2005
Major IPOs in 2005:• Q-Cells Germany• SunPower USA• Suntech Taiwan• Suzlon India
Source: New Energy Finance
Renewable Energy Financing is Entering the Mainstream

15© 2006 Electric Power Research Institute, Inc. All rights reserved.
Fossil Fueled Generation Technologies in 2010
0 10 20 30 40 50Cost of CO2, $/Metric Ton
Pulverized Coal*(PC)
Natural Gas Combined Cycle**(NGCC)
Integrated GasificationCombined Cycle*(IGCC)
*Coal @ $1.50/mmBtu
**Nat’l Gas @ $6/mmBtu
No CO2 Capture
3
4
5
6
7
8
9
10Levelized Cost of Electricity, Cents/kWh

16© 2006 Electric Power Research Institute, Inc. All rights reserved.
0 10 20 30 40 50Cost of CO2, $/Metric Ton
Wind*
Nuclear**
Biomass
Non-CO2 Emitting Generation Technologies in 2010
* 29% Capacity Factor
** $1700/kw Capital Cost
3
4
5
6
7
8
9
10Levelized Cost of Electricity, Cents/kWh

17© 2006 Electric Power Research Institute, Inc. All rights reserved.
0 10 20 30 40 50Cost of CO2, $/Metric Ton
Wind***
Nuclear****
PC*
IGCC*
BiomassNGCC**
*Coal @ $1.50/mmBtu **Nat’l Gas @ $6/mmBtu
***29% Capacity Factor ****$1700/kw Capital Cost
3
4
5
6
7
8
9
10Levelized Cost of Electricity, Cents/kWh
Comparative Costs of 2010 Generating Options

18© 2006 Electric Power Research Institute, Inc. All rights reserved.
Comparative Costs of 2020 Generating Options
0 10 20 30 40 50Cost of CO2, $/Metric Ton
Nuclear****Wind*** Biomass
NGCC**PC*
IGCC*
3
4
5
6
7
8
9
10Levelized Cost of Electricity, Cents/kWh
*Coal @ $1.50/mmBtu **Nat’l Gas @ $6/mmBtu
***29% Capacity Factor ****$1700/kw Capital Cost

19© 2006 Electric Power Research Institute, Inc. All rights reserved.
Historical and Projected Installed Wind Capacity 1981 - 2009
0
10,000
20,000
30,000
40,000
50,000
60,000
70,000
80,000
90,000
100,000
110,000
120,000
1981 1983 1985 1987 1989 1991 1993 1995 1997 1999 2001 2003 2005 2007 2009
Year
Inst
alle
d C
apac
ity (M
W)
Europe U.S. Rest of World
Wind and Biomass Status and EPRI Program Direction
Wind:• Maturing technology and significant
resources, ~50 GW worldwide. Wind will play important role as non-emitting generation of choice.
• Future focus on integration issues on/ off shore, forecasting, condition monitoring, emerging operation and maintenance issues as utility own wind.
Biomass:• Fits utility’s traditional model, central dispatchable,
interest has been with co-firing, testing, corrosion assessment, etc.
• Direction is to track European experience broaden look to biofuels, gasification, more co-firing tests, develop biomass deposition.
Source: BTM Consult, World Market Update, 2005

20© 2006 Electric Power Research Institute, Inc. All rights reserved.
Subsurface temperatures at 6-km depth (deg C)
Technology Status and EPRI Program Direction with Solar, Geothermal and Ocean Energy
Solar Energy:• Rooftop/building PV will emerge
with cost/efficiency improvement.• Solar thermal is better utility fit
but unproven and less upside.• EPRI monitoring for PV breakthrough, evaluating
solar thermal technology demonstrations.Geothermal Energy:• 2500 MW in the U.S., mostly in California and
Hawaii. Issues include high cost of geothermal wells, decrease output over time.
• Utility interest has waned, we will monitor.Ocean Energy:• A few hundred kW worldwide, ocean tidal and wave
energy offers significant potential, 10–20 years out.• EPRI opportunity is in early demonstrations and leadership
in the national program, including related wind-wave and hydro-kinetic turbines.
Source: NREL