janelle r. courtright john c. williams july 17, 2007
DESCRIPTION
ENERGY SECTOR. Janelle R. Courtright John C. Williams July 17, 2007. AGENDA. Size and Composition of Sector Business Analysis of Sector Economic Analysis Financial Analysis Valuation Analysis Recommendation. S&P SECTOR SIZES. SIM SECTOR SIZE. Industries in Energy Sector. - PowerPoint PPT PresentationTRANSCRIPT
Janelle R. Courtright
John C. Williams
July 17, 2007

AGENDA
• Size and Composition of Sector
• Business Analysis of Sector
• Economic Analysis
• Financial Analysis
• Valuation Analysis
• Recommendation

S&P SECTOR SIZES
S&P 500 SECTOR PERCENTAGES
Energy11%
Financials21%
Industrials11%
Cons Disc10%
Info Tech15%
Cons Staples9%
Telecom Svc4%
Utilities4%
Health Care12%
Materials3%

SIM SECTOR SIZECURRENT SIM SECTOR PERCENTAGES
Cons Discr9%
Con Staples8%
Energy8%
Utilities2%
Info Tech14%
Telecom5%
Industrials9%
Materials5%
Financials23%
Health Care17%
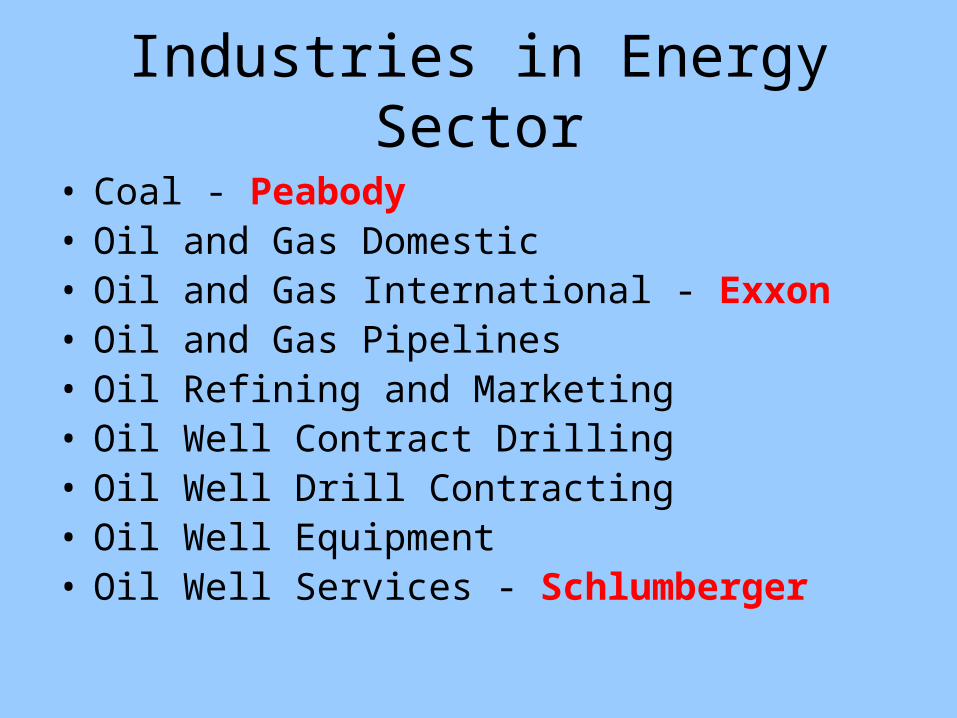
Industries in Energy Sector
• Coal - Peabody• Oil and Gas Domestic• Oil and Gas International - Exxon• Oil and Gas Pipelines• Oil Refining and Marketing• Oil Well Contract Drilling• Oil Well Drill Contracting• Oil Well Equipment• Oil Well Services - Schlumberger

Largest Companies in Sector
• Exxon Mobile **
• Chevron Corp. **
• ConocoPhillips
• Schlumberger Limited
** 2 of top ten largest in S&P 500

32 COMPANIES IN SECTORMRO Marathon OilMUR Murphy Oil CorpNBR Nabors IndustriesNE Noble CorpNOV National Oil Well VarcoOXY Occidental PetroleumRDC Rowan CompaniesRIG Transocean IncSE Spectra EnergySII Smith InternationalSLB Schlumberger LimitedSUN SunocoVLO Valero Energy CorpWFT Weatherford Int’lWMB Williams CompaniesXOM Exxon MobileXTO XTO Energy
APA Apache CorpAPC Anadarko PetroleumBHI Baker Hughes, IncBJS BJ ServicesBTU Peabody EnergyCHK Chesapeake Energy CorpCNX Consol Energy IncCOP ConocoPhillipsCVX Chevron Corp DVN Devon EnergyEOG EOG ResourcesEP El Paso CorpESV Ensco InternationalHAL Halliburton CompanyHES Hess Corp
HELD IN SIM PORTFOLIO

SECTOR PERFORMANCE
Sector % Price Change Diff SP500
QTD YTD QTD YTD
Energy 7.37 25.36 4.1 15.9Consumer Discretionary 1.94 4.24 -1.33 -5.22
Consumer Staples 2.23 1.92 -1.04 -7.54
Industrials 1.53 12.27 -1.74 2.8
Materials 5.83 21.12 2.56 11.66
Info Tech 4.55 14.22 1.28 4.76
Financials -0.47 17.92 -3.74 8.46
Healthcare 2.13 6.78 -1.14 -2.69

Sector Life Cycle• Mature
– Growth Slowing
– Stabilized or shrinking margins
– Extraction, refining, and processing increasing capex increasing
• Looking for resources in more difficult areas and moving away from core business of “oil”

Sector Life Cycle

Sector Influences
• U.S. Economy– Excessive Profits Tax– Commercial Petrochemical Use– Environmental Concern
• Movement to Alternative Energy Sources
– Domestic Reserves • Natural Gas, Coal, Oil
– Consumer Driving Habits• Stable even at higher gasoline prices

Sector Influences

Sector Influences
• External Factors– Environmental Laws
• Kyoto Treaty, EU
– New Industrial Ages• China, India
– Geopolitical Climate• Venezuela, Russia, Iran

Energy Users

Capacity

ReservesWorld Proved1 Reserves of Oil and Natural Gas, Most Recent Estimates
Oil Oil Oil Natural Gas Natural Gas Natural Gas Natural Gas
(Billion Barrels) (Billion Barrels)
(Billion Barrels)
(Trillion Cubic Feet)
(Trillion Cubic Feet)
(Trillion Cubic Feet)
(Trillion Cubic Feet)
BP Statistical Review2
Oil & Gas Journal3 World Oil4
BP Statistical Review2 CEDIGAZ5
Oil & Gas Journal3 World Oil4
Year-End 2005 January 1, 2007
Year-End 2005 Year-End 2005
January 1, 2006 January 1, 2007 Year-End 2005
World Total 1,201.332 1,317.447 1,119.615 6,359.172 6,380.625 6,182.692 6,226.555

Sector Evaluation
• Growing demand with a limited supply
• Petroleum, Natural Gas, Alternatives
• Concentrated in Oil and Gas
• EXPENSIVE to enter
• Customers are weak, suppliers are strong
• Strong Competition, prices stable
• Alternatives are becoming more available

CRUDE OIL PRICE FORECAST 4th-07 1st-08 2nd-08 3rd-08 4th-08
Forecast Value 69 67.5 67.83 66.5 65.83
StockVal®S&P ENERGY SECTOR COMPOSITE ADJ (SP-10) Price 74.461997 1998 1999 2000 2001 2002 2003 2004 2005 2006 2007 2008
CRUDE OIL ($ PER BBL) 1 YR FUTURE12
16
20
24
28
36
44
52
64
80
HI 79.92 LO 13.22 ME 25.28 CU 73.94 GR 14.1%
07-11-199707-13-2007
PRICE20
24
28
32
36
40
48
56
64
76
HI 74LO 24ME 32CU 74GR 10.7%
07-11-199707-13-2007

Absolute ValuationStockVal®S&P ENERGY SECTOR COMPOSITE ADJ (SP-10) Price 74.46
1997 1998 1999 2000 2001 2002 2003 2004 2005 2006 2007 20081997 1998 1999 2000 2001 2002 2003 2004 2005 2006 2007 2008 2009
PRICE / YEAR-FORWARD EARNINGS8
16
24
32 HI 41.5 LO 8.2 ME 13.6 CU 12.0
07-11-199707-13-2007
PRICE / SALES0.6
0.9
1.2
1.5 HI 1.76 LO 0.83 ME 1.13 CU 1.39
07-11-199707-13-2007
PRICE / EBITDA4
8
12
16 HI 16.2 LO 4.2 ME 6.6 CU 5.8
07-11-199707-13-2007
PRICE / CASH FLOW ADJUSTED6
9
12
15 HI 17.5 LO 7.0 ME 9.1 CU 9.3
07-11-199707-13-2007

Relative ValuationStockVal®S&P ENERGY SECTOR COMPOSITE ADJ (SP-10) Price 74.46
1997 1998 1999 2000 2001 2002 2003 2004 2005 2006 2007 20081997 1998 1999 2000 2001 2002 2003 2004 2005 2006 2007 2008 2009
PRICE / YEAR-FORWARD EARNINGS RELATIVE TO S&P 500 COMPOSITE ADJUSTED (SP5A) M-Wtd0.4
0.8
1.2
1.6 HI 1.78 LO 0.47 ME 0.68 CU 0.75
07-11-199707-13-2007
PRICE / EBITDA RELATIVE TO S&P 500 COMPOSITE ADJUSTED (SP5A) M-Wtd0.4
0.6
0.8
1.2HI 1.65 LO 0.57 ME 0.81 CU 0.74
07-11-199707-13-2007
PRICE / SALES RELATIVE TO S&P 500 COMPOSITE ADJUSTED (SP5A) M-Wtd0.5
0.6
0.7
0.8 HI 0.88 LO 0.54 ME 0.67 CU 0.88
07-11-199707-13-2007
PRICE / CASH FLOW ADJUSTED RELATIVE TO S&P 500 COMPOSITE ADJUSTED (SP5A) M-Wtd0.4
0.6
0.8
1.0 HI 1.04 LO 0.56 ME 0.75 CU 0.76
07-11-199707-13-2007

Energy Sector Valuation
• Absolute Sector Valuation– Trading around its ten year average: inline
• Relative Sector Valuation– Selling Inline to market
• Sector earnings/stock price driven by oil– Oil near all-time high increasing earnings and
cash flow– Energy stocks likely to plateau and possibly
decline in 3 – 6 months

SHORTTERM ENERGY OUTLOOK
• Average price of gas has gone down– Refinery problems being resolved– Higher levels of product imports
• Price of gas will go up modestly– High Inventories, will decrease with strong
demand– Stabilizing crude oil prices– Strong demand

RECOMMENDATION
• Continue to underweight to S&P 500– Oil forecasted to retreat
• Recommend to hold at 217 basis points below S&P– Sell equipment suppliers, specifically, Schlumberger
Limited due to being overpriced– Increase holdings in other energy industries
• Look to underweight in the next 6 months– Short-term returns to outperform S&P 500– Long-term returns will under perform
• Drop in oil prices, cheaper alternatives becoming more available

QUESTIONS??