gulf of carpentaria inshore fin fish fishery annual … · annual status report 2011—gulf of...
TRANSCRIPT
Annual status report 2011 Gulf of Carpentaria Inshore Fin Fish Fishery

© State of Queensland, Department of Employment, Economic Development and Innovation, 2012.
The Queensland Government supports and encourages the dissemination and exchange of its information. The copyright in this publication is licensed under a Creative Commons Attribution 3.0 Australia (CC BY) licence.
Under this licence you are free, without having to seek permission from DEEDI, to use this publication in accordance with the licence terms.
You must keep intact the copyright notice and attribute the State of Queensland, Department of Employment, Economic Development and Innovation as the source of the publication.
For more information on this licence visit http://creativecommons.org/licenses/by/3.0/au/deed.en
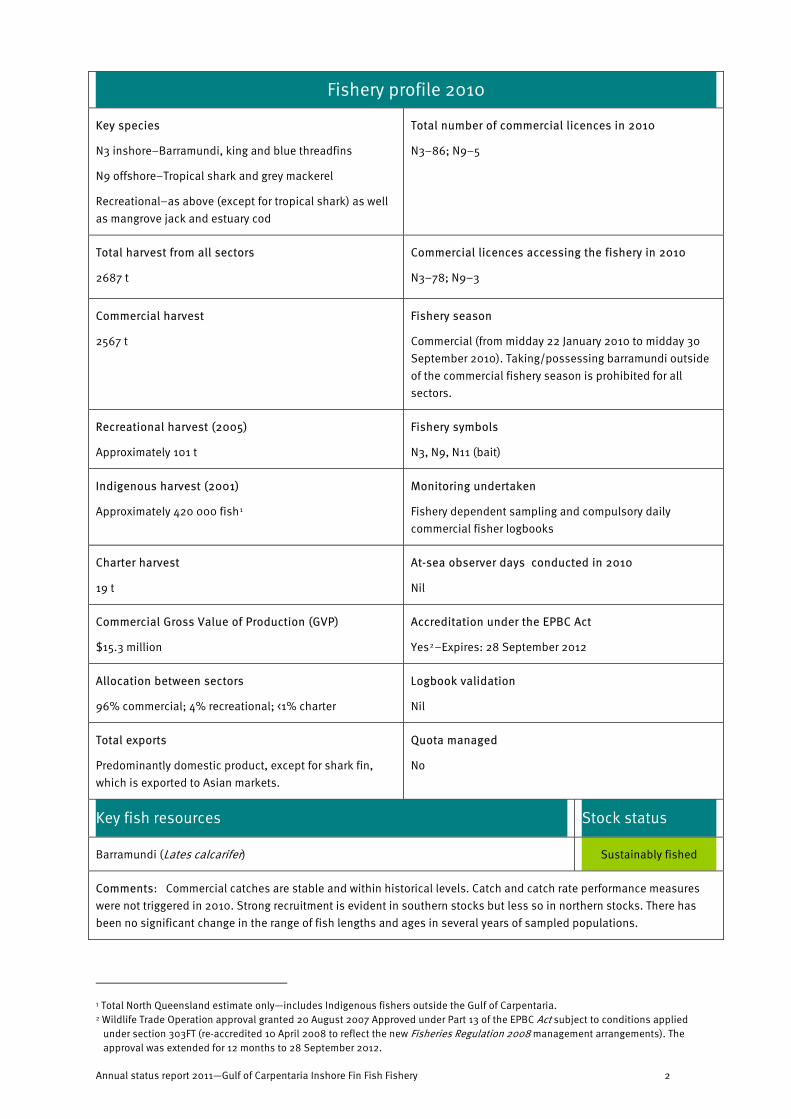
Fishery profile 2010
Key species
N3 inshore–Barramundi, king and blue threadfins
N9 offshore–Tropical shark and grey mackerel
Recreational–as above (except for tropical shark) as well as mangrove jack and estuary cod
Total number of commercial licences in 2010
N3–86; N9–5
Total harvest from all sectors
2687 t
Commercial licences accessing the fishery in 2010
N3–78; N9–3
Commercial harvest
2567 t
Fishery season
Commercial (from midday 22 January 2010 to midday 30 September 2010). Taking/possessing barramundi outside of the commercial fishery season is prohibited for all sectors.
Recreational harvest (2005)
Approximately 101 t
Fishery symbols
N3, N9, N11 (bait)
Indigenous harvest (2001)
Approximately 420 000 fish1
Monitoring undertaken
Fishery dependent sampling and compulsory daily commercial fisher logbooks
Charter harvest
19 t
At-sea observer days conducted in 2010
Nil
Commercial Gross Value of Production (GVP)
$15.3 million
Accreditation under the EPBC Act
Yes2–Expires: 28 September 2012
Allocation between sectors
96% commercial; 4% recreational; <1% charter
Logbook validation
Nil
Total exports
Predominantly domestic product, except for shark fin, which is exported to Asian markets.
Quota managed
No
Key fish resources Stock status
Barramundi (Lates calcarifer) Sustainably fished
Comments: Commercial catches are stable and within historical levels. Catch and catch rate performance measures were not triggered in 2010. Strong recruitment is evident in southern stocks but less so in northern stocks. There has been no significant change in the range of fish lengths and ages in several years of sampled populations.
1 Total North Queensland estimate only—includes Indigenous fishers outside the Gulf of Carpentaria. 2 Wildlife Trade Operation approval granted 20 August 2007 Approved under Part 13 of the EPBC Act subject to conditions applied
under section 303FT (re-accredited 10 April 2008 to reflect the new Fisheries Regulation 2008 management arrangements). The approval was extended for 12 months to 28 September 2012.
Annual status report 2011—Gulf of Carpentaria Inshore Fin Fish Fishery 2
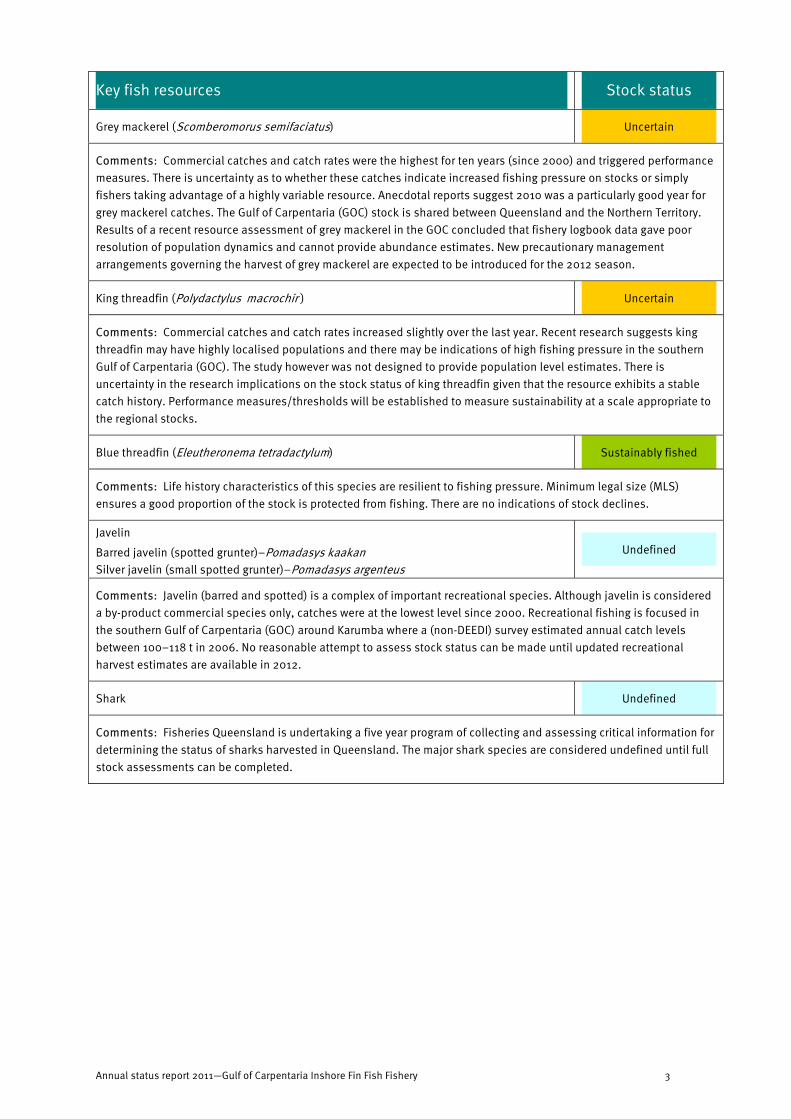
Key fish resources Stock status
Grey mackerel (Scomberomorus semifaciatus) Uncertain
Comments: Commercial catches and catch rates were the highest for ten years (since 2000) and triggered performance measures. There is uncertainty as to whether these catches indicate increased fishing pressure on stocks or simply fishers taking advantage of a highly variable resource. Anecdotal reports suggest 2010 was a particularly good year for grey mackerel catches. The Gulf of Carpentaria (GOC) stock is shared between Queensland and the Northern Territory. Results of a recent resource assessment of grey mackerel in the GOC concluded that fishery logbook data gave poor resolution of population dynamics and cannot provide abundance estimates. New precautionary management arrangements governing the harvest of grey mackerel are expected to be introduced for the 2012 season.
King threadfin (Polydactylus macrochir ) Uncertain
Comments: Commercial catches and catch rates increased slightly over the last year. Recent research suggests king threadfin may have highly localised populations and there may be indications of high fishing pressure in the southern Gulf of Carpentaria (GOC). The study however was not designed to provide population level estimates. There is uncertainty in the research implications on the stock status of king threadfin given that the resource exhibits a stable catch history. Performance measures/thresholds will be established to measure sustainability at a scale appropriate to the regional stocks.
Blue threadfin (Eleutheronema tetradactylum) Sustainably fished
Comments: Life history characteristics of this species are resilient to fishing pressure. Minimum legal size (MLS) ensures a good proportion of the stock is protected from fishing. There are no indications of stock declines.
Javelin
Barred javelin (spotted grunter)–Pomadasys kaakan Silver javelin (small spotted grunter)–Pomadasys argenteus
Undefined
Comments: Javelin (barred and spotted) is a complex of important recreational species. Although javelin is considered a by-product commercial species only, catches were at the lowest level since 2000. Recreational fishing is focused in the southern Gulf of Carpentaria (GOC) around Karumba where a (non-DEEDI) survey estimated annual catch levels between 100–118 t in 2006. No reasonable attempt to assess stock status can be made until updated recreational harvest estimates are available in 2012.
Shark Undefined
Comments: Fisheries Queensland is undertaking a five year program of collecting and assessing critical information for determining the status of sharks harvested in Queensland. The major shark species are considered undefined until full stock assessments can be completed.
Annual status report 2011—Gulf of Carpentaria Inshore Fin Fish Fishery 3
Introduction The Gulf of Carpentaria Inshore Fin Fish Fishery
(GOCIFFF) is a multi-species fishery comprising a
commercial inshore (N3) net fishery, a commercial
offshore (N9) net fishery, commercial bait netting (N11)
and recreational fishing, Indigenous fishing and
charter boat fishing of species related to the GOCIFFF
within the Queensland jurisdiction of the Gulf of
Carpentaria. This report covers fishing activity during
the 2010 calendar year.
Fishery description Fishing area and methods
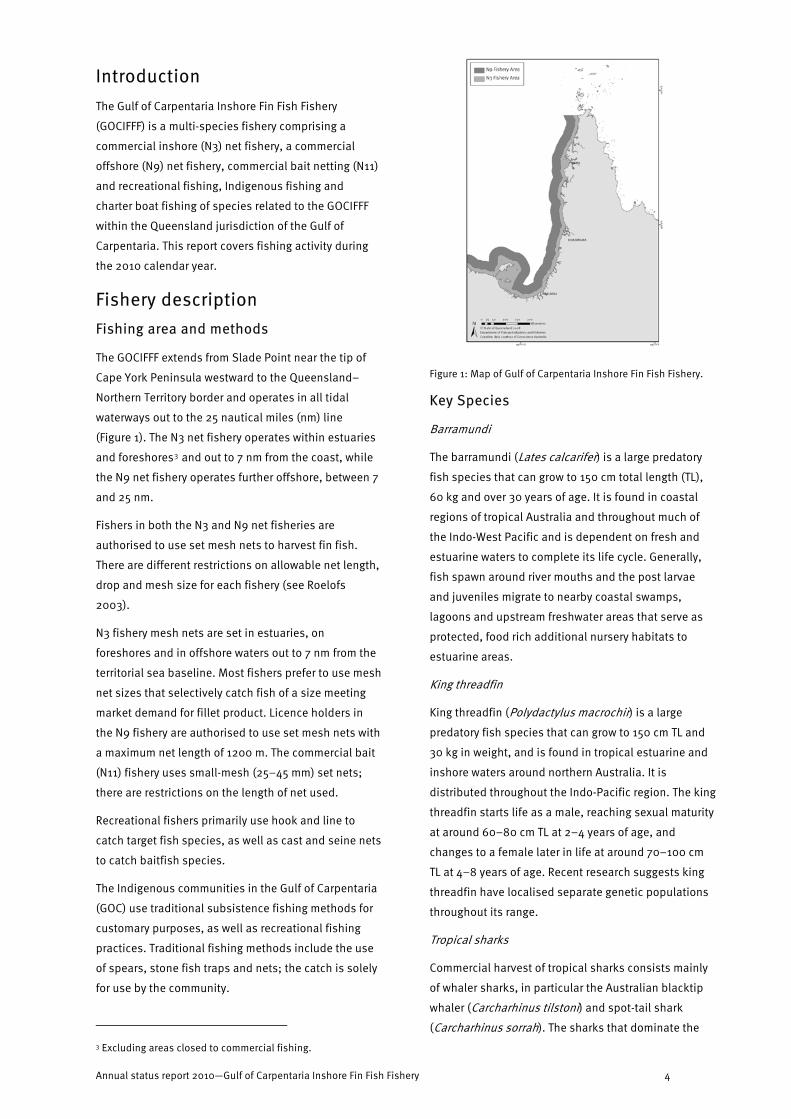
The GOCIFFF extends from Slade Point near the tip of
Cape York Peninsula westward to the Queensland–
Northern Territory border and operates in all tidal
waterways out to the 25 nautical miles (nm) line
(Figure 1). The N3 net fishery operates within estuaries
and foreshores3 and out to 7 nm from the coast, while
the N9 net fishery operates further offshore, between 7
and 25 nm.
Fishers in both the N3 and N9 net fisheries are
authorised to use set mesh nets to harvest fin fish.
There are different restrictions on allowable net length,
drop and mesh size for each fishery (see Roelofs
2003).
N3 fishery mesh nets are set in estuaries, on
foreshores and in offshore waters out to 7 nm from the
territorial sea baseline. Most fishers prefer to use mesh
net sizes that selectively catch fish of a size meeting
market demand for fillet product. Licence holders in
the N9 fishery are authorised to use set mesh nets with
a maximum net length of 1200 m. The commercial bait
(N11) fishery uses small-mesh (25–45 mm) set nets;
there are restrictions on the length of net used.
Recreational fishers primarily use hook and line to
catch target fish species, as well as cast and seine nets
to catch baitfish species.
The Indigenous communities in the Gulf of Carpentaria
(GOC) use traditional subsistence fishing methods for
customary purposes, as well as recreational fishing
practices. Traditional fishing methods include the use
of spears, stone fish traps and nets; the catch is solely
for use by the community.
Figure 1: Map of Gulf of Carpentaria Inshore Fin Fish Fishery.
Key Species
Barramundi
The barramundi (Lates calcarifer) is a large predatory
fish species that can grow to 150 cm total length (TL),
60 kg and over 30 years of age. It is found in coastal
regions of tropical Australia and throughout much of
the Indo-West Pacific and is dependent on fresh and
estuarine waters to complete its life cycle. Generally,
fish spawn around river mouths and the post larvae
and juveniles migrate to nearby coastal swamps,
lagoons and upstream freshwater areas that serve as
protected, food rich additional nursery habitats to
estuarine areas.
King threadfin
King threadfin (Polydactylus macrochir) is a large
predatory fish species that can grow to 150 cm TL and
30 kg in weight, and is found in tropical estuarine and
inshore waters around northern Australia. It is
distributed throughout the Indo-Pacific region. The king
threadfin starts life as a male, reaching sexual maturity
at around 60–80 cm TL at 2–4 years of age, and
changes to a female later in life at around 70–100 cm
TL at 4–8 years of age. Recent research suggests king
threadfin have localised separate genetic populations
throughout its range.
Tropical sharks
Commercial harvest of tropical sharks consists mainly
of whaler sharks, in particular the Australian blacktip
whaler (Carcharhinus tilstoni) and spot-tail shark
(Carcharhinus sorrah). The sharks that dominate the 3 Excluding areas closed to commercial fishing.
Annual status report 2010—Gulf of Carpentaria Inshore Fin Fish Fishery 4
GOC fisheries generally attain sexual maturity at over
1 m in total length at around 3–4 years of age. They are
viviparous, generally producing three to five pups
during summer months after a 7–12 month gestation.
Tropical shark species in the GOC generally have an
Indo-West Pacific distribution.
Grey mackerel
Grey mackerel (Scomberomorus semifasciatus) is a
pelagic species endemic to waters across northern
Australia and adjacent Papua New Guinea and larvae
and juveniles are dependent on estuarine and inshore
habitats (Cameron & Begg 2002). They are a fast
growing species with total length at first maturity for
females of 75 cm TL and males of 65 cm TL at between
one and two years of age.
Mangrove jack
The mangrove jack (Lutjanus argentimaculatus) is a
by-product species in the commercial line, net and
trawl fisheries in the GOC. They have distinct inshore
(juvenile) and offshore (adult) phases in the life
histories and prefer complex habitats (reefs, shoals
etc.) to open sand and mud areas. In Queensland,
most mature at about 450 mm and 7 years for males
and about 510 mm and 8 years for females. They can
attain a maximum length greater than 650 mm and are
long lived with some individuals estimated at 37 years
old (Russell et al. 2003).
Genetic studies by Russell et al. (2003) suggest a high
level of gene flow between Queensland east coast,
GOC and northern Australia mangrove jack
populations. It is likely that a single genetic stock
exists across these areas.
Main management methods used
Fisheries Queensland manages the commercial,
recreational and Indigenous components of the
GOCIFFF through Queensland’s Fisheries Act 1994,
Fisheries Regulation 2008 and Fisheries (Gulf of
Carpentaria Inshore Fin Fish) Management Plan 1999
(Gulf Management Plan). The harvest of grey mackerel,
sharks and rays is managed jointly between the State
and the Commonwealth through the Queensland
Fisheries Joint Authority (QFJA). Revised management
arrangements were implemented in November 2011,
which included the repealing of the Fisheries (Gulf of
Carpentaria Inshore Fin Fish) Management Plan 1999
(now regulated via the Fisheries Regulation).
The GOCIFFF is managed to optimise sustainable
fisheries production and protect spawning target
species using a variety of input controls, including:
• limited entry (commercial fishery only)
• boat and gear restrictions
• spatial and temporal closures
• possession limits
• fish size limits.
Catch statistics
Commercial
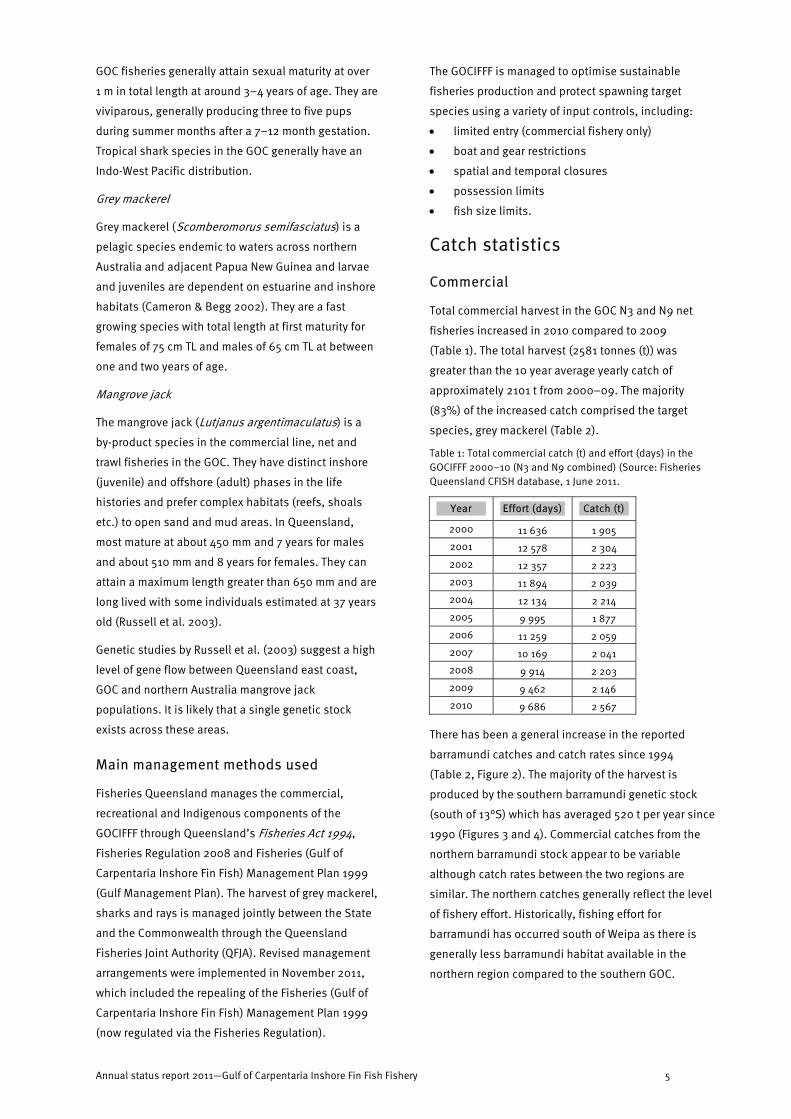
Total commercial harvest in the GOC N3 and N9 net
fisheries increased in 2010 compared to 2009
(Table 1). The total harvest (2581 tonnes (t)) was
greater than the 10 year average yearly catch of
approximately 2101 t from 2000–09. The majority
(83%) of the increased catch comprised the target
species, grey mackerel (Table 2).
Table 1: Total commercial catch (t) and effort (days) in the GOCIFFF 2000–10 (N3 and N9 combined) (Source: Fisheries Queensland CFISH database, 1 June 2011.
Year Effort (days) Catch (t)
2000 11 636 1 905 2001 12 578 2 304 2002 12 357 2 223 2003 11 894 2 039 2004 12 134 2 214 2005 9 995 1 877 2006 11 259 2 059 2007 10 169 2 041 2008 9 914 2 203 2009 9 462 2 146 2010 9 686 2 567
There has been a general increase in the reported
barramundi catches and catch rates since 1994
(Table 2, Figure 2). The majority of the harvest is
produced by the southern barramundi genetic stock
(south of 13°S) which has averaged 520 t per year since
1990 (Figures 3 and 4). Commercial catches from the
northern barramundi stock appear to be variable
although catch rates between the two regions are
similar. The northern catches generally reflect the level
of fishery effort. Historically, fishing effort for
barramundi has occurred south of Weipa as there is
generally less barramundi habitat available in the
northern region compared to the southern GOC.
Annual status report 2011—Gulf of Carpentaria Inshore Fin Fish Fishery 5
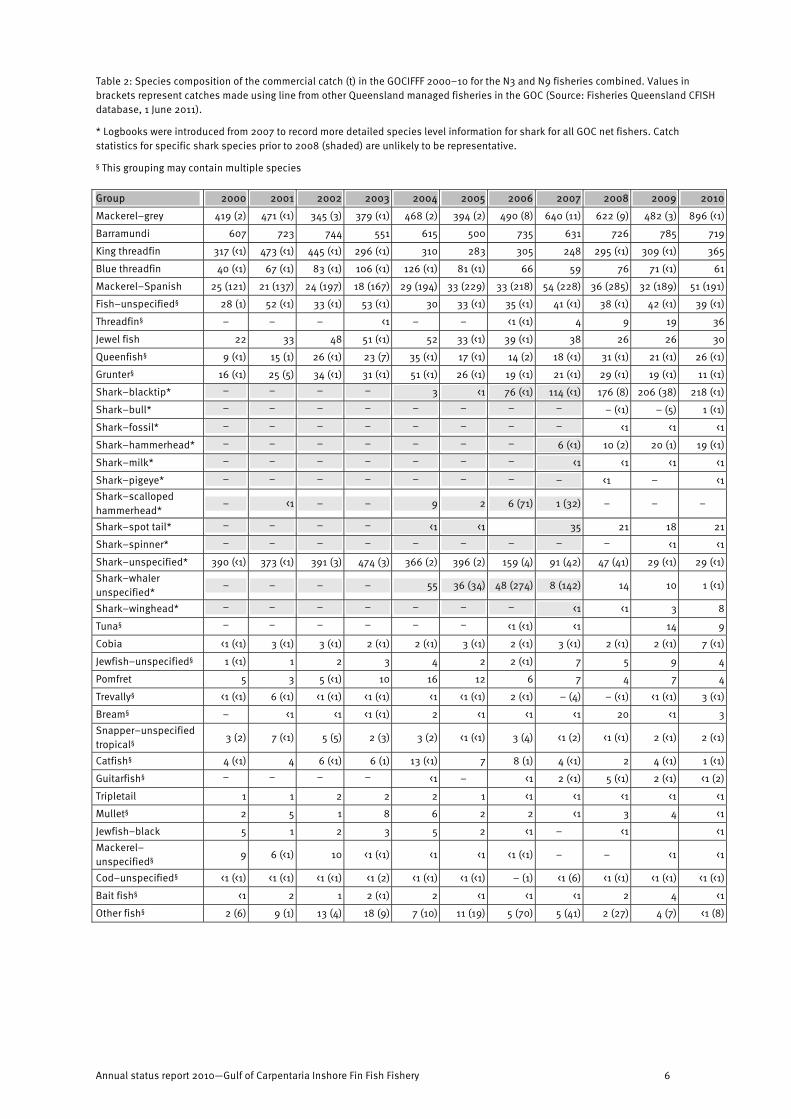
Table 2: Species composition of the commercial catch (t) in the GOCIFFF 2000–10 for the N3 and N9 fisheries combined. Values in brackets represent catches made using line from other Queensland managed fisheries in the GOC (Source: Fisheries Queensland CFISH database, 1 June 2011).
* Logbooks were introduced from 2007 to record more detailed species level information for shark for all GOC net fishers. Catch statistics for specific shark species prior to 2008 (shaded) are unlikely to be representative.
§ This grouping may contain multiple species
Group 2000 2001 2002 2003 2004 2005 2006 2007 2008 2009 2010
Mackerel–grey 419 (2) 471 (<1) 345 (3) 379 (<1) 468 (2) 394 (2) 490 (8) 640 (11) 622 (9) 482 (3) 896 (<1)
Barramundi 607 723 744 551 615 500 735 631 726 785 719
King threadfin 317 (<1) 473 (<1) 445 (<1) 296 (<1) 310 283 305 248 295 (<1) 309 (<1) 365
Blue threadfin 40 (<1) 67 (<1) 83 (<1) 106 (<1) 126 (<1) 81 (<1) 66 59 76 71 (<1) 61
Mackerel–Spanish 25 (121) 21 (137) 24 (197) 18 (167) 29 (194) 33 (229) 33 (218) 54 (228) 36 (285) 32 (189) 51 (191)
Fish–unspecified§ 28 (1) 52 (<1) 33 (<1) 53 (<1) 30 33 (<1) 35 (<1) 41 (<1) 38 (<1) 42 (<1) 39 (<1)
Threadfin§ – – – <1 – – <1 (<1) 4 9 19 36
Jewel fish 22 33 48 51 (<1) 52 33 (<1) 39 (<1) 38 26 26 30
Queenfish§ 9 (<1) 15 (1) 26 (<1) 23 (7) 35 (<1) 17 (<1) 14 (2) 18 (<1) 31 (<1) 21 (<1) 26 (<1)
Grunter§ 16 (<1) 25 (5) 34 (<1) 31 (<1) 51 (<1) 26 (<1) 19 (<1) 21 (<1) 29 (<1) 19 (<1) 11 (<1)
Shark–blacktip* – – – – 3 <1 76 (<1) 114 (<1) 176 (8) 206 (38) 218 (<1)
Shark–bull* – – – – – – – – – (<1) – (5) 1 (<1)
Shark–fossil* – – – – – – – – <1 <1 <1
Shark–hammerhead* – – – – – – – 6 (<1) 10 (2) 20 (1) 19 (<1)
Shark–milk* – – – – – – – <1 <1 <1 <1
Shark–pigeye* – – – – – – – – <1 – <1 Shark–scalloped hammerhead*
– <1 – – 9 2 6 (71) 1 (32) – – –
Shark–spot tail* – – – – <1 <1 35 21 18 21
Shark–spinner* – – – – – – – – – <1 <1
Shark–unspecified* 390 (<1) 373 (<1) 391 (3) 474 (3) 366 (2) 396 (2) 159 (4) 91 (42) 47 (41) 29 (<1) 29 (<1) Shark–whaler unspecified*
– – – – 55 36 (34) 48 (274) 8 (142) 14 10 1 (<1)
Shark–winghead* – – – – – – – <1 <1 3 8
Tuna§ – – – – – – <1 (<1) <1 14 9
Cobia <1 (<1) 3 (<1) 3 (<1) 2 (<1) 2 (<1) 3 (<1) 2 (<1) 3 (<1) 2 (<1) 2 (<1) 7 (<1)
Jewfish–unspecified§ 1 (<1) 1 2 3 4 2 2 (<1) 7 5 9 4
Pomfret 5 3 5 (<1) 10 16 12 6 7 4 7 4
Trevally§ <1 (<1) 6 (<1) <1 (<1) <1 (<1) <1 <1 (<1) 2 (<1) – (4) – (<1) <1 (<1) 3 (<1)
Bream§ – <1 <1 <1 (<1) 2 <1 <1 <1 20 <1 3 Snapper–unspecified tropical§
3 (2) 7 (<1) 5 (5) 2 (3) 3 (2) <1 (<1) 3 (4) <1 (2) <1 (<1) 2 (<1) 2 (<1)
Catfish§ 4 (<1) 4 6 (<1) 6 (1) 13 (<1) 7 8 (1) 4 (<1) 2 4 (<1) 1 (<1)
Guitarfish§ – – – – <1 – <1 2 (<1) 5 (<1) 2 (<1) <1 (2)
Tripletail 1 1 2 2 2 1 <1 <1 <1 <1 <1
Mullet§ 2 5 1 8 6 2 2 <1 3 4 <1
Jewfish–black 5 1 2 3 5 2 <1 – <1 <1 Mackerel– unspecified§
9 6 (<1) 10 <1 (<1) <1 <1 <1 (<1) – – <1 <1
Cod–unspecified§ <1 (<1) <1 (<1) <1 (<1) <1 (2) <1 (<1) <1 (<1) – (1) <1 (6) <1 (<1) <1 (<1) <1 (<1)
Bait fish§ <1 2 1 2 (<1) 2 <1 <1 <1 2 4 <1
Other fish§ 2 (6) 9 (1) 13 (4) 18 (9) 7 (10) 11 (19) 5 (70) 5 (41) 2 (27) 4 (7) <1 (8)
Annual status report 2010—Gulf of Carpentaria Inshore Fin Fish Fishery 6

200
300
400
500
600
700
0
10
20
60
600
700
fishery. The QFJA net fishery (beyond 25 nm from the 20
anecdotal reports that suggested 2010 was an Net catch (t) Line catch (t) CPUE (kg/100m net/day)
30 exceptional year for grey mackerel catches. The 900
800 majority of catches were made in the offshore N9 net 25
coast) contributed approximately 5% to the total
Catc
h (t
) Ca
tch
(t)
Catc
h (t
)
300 10
200
20
600 25
Catch (south of 13°S) CPUE (south of 13°S) 500 900 30 20
800 400 25
100
0 0
15 400
500
20 50
40 15
80 30 300 20
20070 25 10
Figure 3: Barramundi (northern stock) —reported commercial reported total harvest (365 t) was higher than the 20 net harvest (t) and catch per unit effort (CPUE) in
kg/100m/day from the GOC barramundi stock north of 13° S year average (318 t). from 1990–2010 (Source: Fisheries Queensland CFISH database, 1 June 2011). Net catch (t) Line catch (t) CPUE (kg/100m net/day)
5
30 10
0
Catch (north of 13°S) CPUE (north of 13°S)
database, 1 June 2011).
1990
1991
1992
1993
1994
1995
1996
1997
1998
1999
2000
2001
2002
2003
2004
2005
2006
2007
2008
2009
2010
1990
1991
1992
1993
1994
1995
1996
1997
1998
1999
2000
2001
2002
2003
2004
2005
2006
2007
2008
2009
2010
1990
1991
1992
1993
1994
1995
1996
1997
1998
1999
2000
2001
2002
2003
2004
2005
2006
2007
2008
2009
2010
100
0 0
5
10
15
Catc
h (t
)
200
1990
1991
1992
1993
1994
1995
1996
1997
1998
1999
2000
2001
2002
2003
2004
2005
2006
2007
2008
2009
2010
King threadfin catches and catch rates have been
increasing since 2007 (Table 2, Figure 6). The 2010
300
database, 1 June 2011). the GOCIFFF 1990–2010 (Source: Fisheries Queensland CFISH harvest (t) and catch per unit effort (CPUE) in kg/100m/day in
100
Figure 5: Grey mackerel—total reported commercial net
100
600
0
1990
1991
1992
1993
1994
1995
1996
1997
1998
1999
2000
2001
2002
2003
2004
2005
2006
2007
2008
2009
2010
Figure 2: Barramundi—total reported commercial net 800 60harvest (t) and catch per unit effort (CPUE) in kg/100m/day in 700
the GOCIFFF 1990–2010 (Source: Fisheries Queensland CFISH 50
CPU
E (k
g/10
0m n
et/d
ay)
CPU
E (k
g/10
0m n
et/d
ay)
CPU
E (k
g/10
0m n
et/d
ay)
Catc
h (t
)
Net catch (t) Line catch (t) QFJA (t) CPUE (kg/100m net/day) 1000 80
900 70
System in 2010.
indicators triggered in the Performance Measurement
was negligible. Both catch and catch rate performance
harvest while line catch of grey mackerel in the GOC
500
400
CPU
E (k
g/10
0m n
et/d
ay)
CPU
E (k
g/10
0m n
et/d
ay)
5 0
0
30
40
0
5
10
15
Annual status report 2010—Gulf of Carpentaria Inshore Fin Fish Fishery 7
Figure 6: King threadfin—total reported commercial net harvest (t) and catch per unit effort (CPUE) in kg/100m/day in the GOCIFFF 1990–2010 (Source: Fisheries Queensland CFISH database, 1 June 2011).
Figure 4: Barramundi (southern stock)—reported commercial net harvest (t) and catch per unit effort (CPUE) in kg/100m/day from the GOC barramundi stock north of 13° S from 1990–2010 (Source: Fisheries Queensland CFISH database, 1 June 2011).
Reported catches for grey mackerel reached record
levels (896 t) in 2010, almost doubling the previous
years catch (Table 2, Figure 5). The catches support
0
20
40
60
80
100
120
140
1990
1991
1992
1993
1994
1995
1996
1997
1998
1999
2000
2001
2002
2003
2004
2005
2006
2007
2008
2009
2010
Catc
h (t
)
0
2
4
6
8
10
12
14
CPU
E (k
g/10
0m n
et/d
ay)
Net catch (t) Line catch (t) CPUE (kg/100m net/day)
40
60
80
100
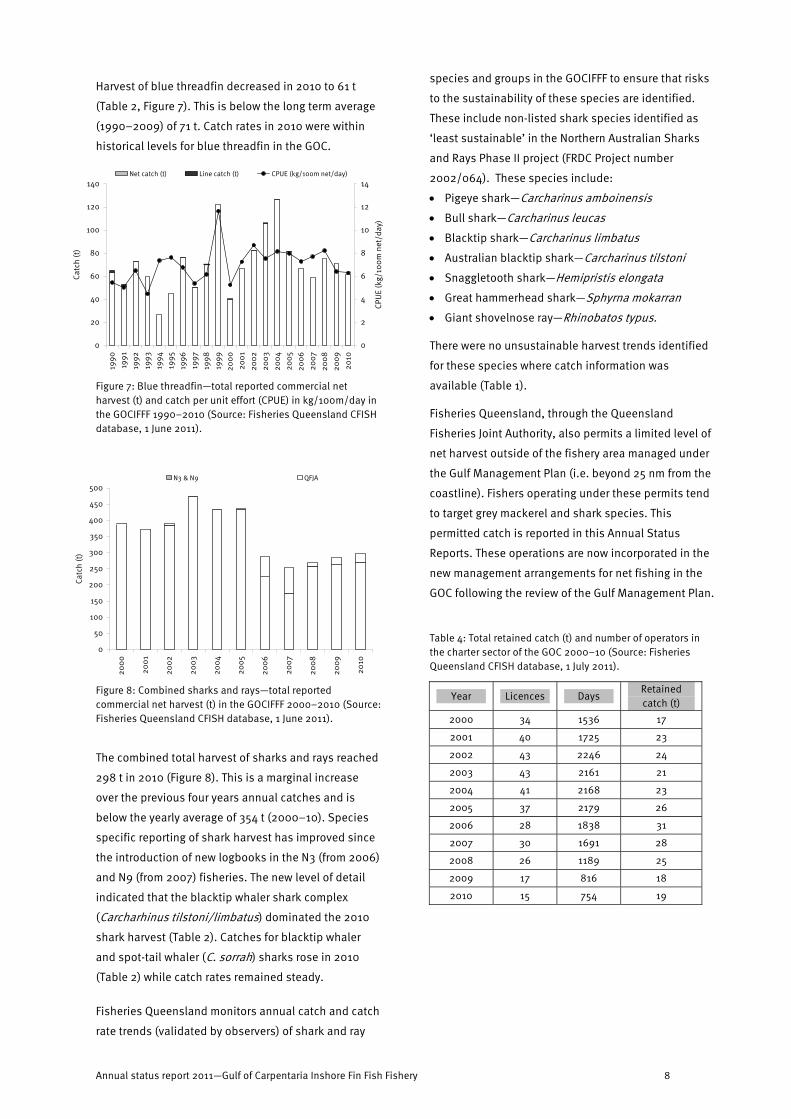
Figure 7: Blue threadfin—total reported commercial n et harvest (t) and catch per unit effort (CPUE) in kg/100 m/day in the GOCIFFF 1990–2010 (Source: Fisheries Queensland C FISH database, 1 June 2011).
N3 & N9 QFJA 500
450
400
350
300
250
200
150
100
50
0
Figure 8: Combined sharks and rays—total reported commercial net harvest (t) in the GOCIFFF 2000–2010 (Source: Fisheries Queensland CFISH database, 1 June 2011).
10
Net catch (t) Line catch (t) CPUE (kg/100m net/day) 140 14
120 12
Catc
h (t
) Ca
tch
(t)
1990
2000
2001
1991
1992
1993
1994
2002
2003
1995
1996
1997
1998
2004
2005
1999
2000
2001
2002
2006
2007
2003
2004
2005
2006
2008
2007
2009
2008
2009
2010
20
10
20 2
0 0
4
6
8
CPU
E (k
g/10
0m n
et/d
ay)
The combined total harvest of sharks and rays reached
298 t in 2010 (Figure 8). This is a marginal increase
over the previous four years annual catches and is
below the yearly average of 354 t (2000–10). Species
specific reporting of shark harvest has improved since
the introduction of new logbooks in the N3 (from 2006)
and N9 (from 2007) fisheries. The new level of detail
indicated that the blacktip whaler shark complex
(Carcharhinus tilstoni/limbatus) dominated the 2010
shark harvest (Table 2). Catches for blacktip whaler
and spot-tail whaler (C. sorrah) sharks rose in 2010
(Table 2) while catch rates remained steady.
Fisheries Queensland monitors annual catch and catch
rate trends (validated by observers) of shark and ray
Year Licences Days Retained catch (t)
2000 34 1536 17
2001 40 1725 23
2002 43 2246 24
2003 43 2161 21
2004 41 2168 23
2005 37 2179 26
2006 28 1838 31
2007 30 1691 28
2008 26 1189 25
2009 17 816 18
2010 15 754 19
• Bull shark—Carcharinus leucas
Harvest of blue threadfin decreased in 2010 to 61 t
(Table 2, Figure 7). This is below the long term average
(1990–2009) of 71 t. Catch rates in 2010 were within
historical levels for blue threadfin in the GOC.
available (Table 1).
Fisheries Queensland, through the Queensland
Fisheries Joint Authority, als o permits a limited level of
net harvest outside of the fishery area managed under
the Gulf Management Plan (i.e. beyond 25 nm from the
coastline). Fishers operating under these permits tend
to target grey mackerel and shark species. This
permitted catch is reported in this Annual Status
Reports. These operations are now incorporated in the
new management arrangements for net fishing in the
GOC following the review of the Gulf Management Plan.
Table 4: Total retained catch (t) and number of operators in the charter sector of the GOC 2000–10 (Source: Fisheries Queensland CFISH database, 1 July 2011).
for these species where catch information was
• Giant shovelnose ray—Rhinobatos typus.
There were no unsustainable harvest trends identified
• Great hammerhead shark—Sphyrna mokarran
• Snaggletooth shark—Hemipristis elon gata
• Australian blacktip shark—Carc harinus tilstoni
• Blacktip shark—Carcharinus limbatus
species and groups in the GOCIFFF to ensure that risks
to the sustainability of these species are identified.
These include non-listed shark species identified as
‘least sustainable’ in the Northern Australian Sharks
and Rays Phase II project (FRDC Project number
2002/064). These species include:
• Pigeye shark—Carcharinus amboinensis
Annual status report 2011—Gulf of Carpentaria Inshore Fin Fish Fishery 8
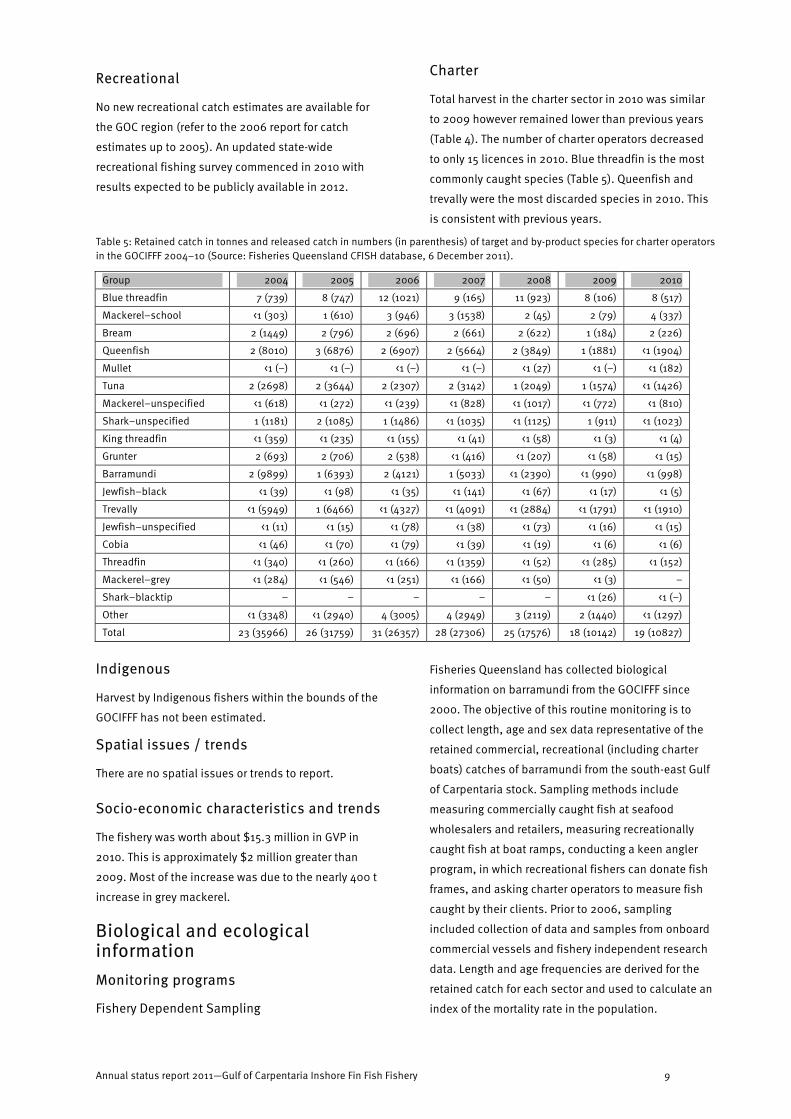
CharterRecreational Total harvest in the charter sector in 2010 was similar
No new recreational catch estimates are available for to 2009 however remained lower than previous years
the GOC region (refer to the 2006 report for catch (Table 4). The number of charter operators decreased
estimates up to 2005). An updated state-wide to only 15 licences in 2010. Blue threadfin is the most
recreational fishing survey commenced in 2010 with commonly caught species (Table 5). Queenfish and
results expected to be publicly available in 2012. trevally were the most discarded species in 2010. This
is consistent with previous years.
Table 5: Retained catch in tonnes and released catch in numbers (in parenthesis) of target and by-product species for charter operators in the GOCIFFF 2004–10 (Source: Fisheries Queensland CFISH database, 6 December 2011).
Group 2004 2005 2006 2007 2008 2009 2010
Blue threadfin 7 (739) 8 (747) 12 (1021) 9 (165) 11 (923) 8 (106) 8 (517)
Mackerel–school <1 (303) 1 (610) 3 (946) 3 (1538) 2 (45) 2 (79) 4 (337)
Bream 2 (1449) 2 (796) 2 (696) 2 (661) 2 (622) 1 (184) 2 (226)
Queenfish 2 (8010) 3 (6876) 2 (6907) 2 (5664) 2 (3849) 1 (1881) <1 (1904)
Mullet <1 (–) <1 (–) <1 (–) <1 (–) <1 (27) <1 (–) <1 (182)
Tuna 2 (2698) 2 (3644) 2 (2307) 2 (3142) 1 (2049) 1 (1574) <1 (1426)
Mackerel–unspecified <1 (618) <1 (272) <1 (239) <1 (828) <1 (1017) <1 (772) <1 (810)
Shark–unspecified 1 (1181) 2 (1085) 1 (1486) <1 (1035) <1 (1125) 1 (911) <1 (1023)
King threadfin <1 (359) <1 (235) <1 (155) <1 (41) <1 (58) <1 (3) <1 (4)
Grunter 2 (693) 2 (706) 2 (538) <1 (416) <1 (207) <1 (58) <1 (15)
Barramundi 2 (9899) 1 (6393) 2 (4121) 1 (5033) <1 (2390) <1 (990) <1 (998)
Jewfish–black <1 (39) <1 (98) <1 (35) <1 (141) <1 (67) <1 (17) <1 (5)
Trevally <1 (5949) 1 (6466) <1 (4327) <1 (4091) <1 (2884) <1 (1791) <1 (1910)
Jewfish–unspecified <1 (11) <1 (15) <1 (78) <1 (38) <1 (73) <1 (16) <1 (15)
Cobia <1 (46) <1 (70) <1 (79) <1 (39) <1 (19) <1 (6) <1 (6)
Threadfin <1 (340) <1 (260) <1 (166) <1 (1359) <1 (52) <1 (285) <1 (152)
Mackerel–grey <1 (284) <1 (546) <1 (251) <1 (166) <1 (50) <1 (3) –
Shark–blacktip – – – – – <1 (26) <1 (–)
Other <1 (3348) <1 (2940) 4 (3005) 4 (2949) 3 (2119) 2 (1440) <1 (1297)
Total 23 (35966) 26 (31759) 31 (26357) 28 (27306) 25 (17576) 18 (10142) 19 (10827)
Indigenous
Harvest by Indigenous fishers within the bounds of the
GOCIFFF has not been estimated.
Spatial issues / trends
There are no spatial issues or trends to report.
Socio-economic characteristics and trends
The fishery was worth about $15.3 million in GVP in
2010. This is approximately $2 million greater than
2009. Most of the increase was due to the nearly 400 t
increase in grey mackerel.
Biological and ecological information Monitoring programs
Fishery Dependent Sampling
Fisheries Queensland has collected biological
information on barramundi from the GOCIFFF since
2000. The objective of this routine monitoring is to
collect length, age and sex data representative of the
retained commercial, recreational (including charter
boats) catches of barramundi from the south-east Gulf
of Carpentaria stock. Sampling methods include
measuring commercially caught fish at seafood
wholesalers and retailers, measuring recreationally
caught fish at boat ramps, conducting a keen angler
program, in which recreational fishers can donate fish
frames, and asking charter operators to measure fish
caught by their clients. Prior to 2006, sampling
included collection of data and samples from onboard
commercial vessels and fishery independent research
data. Length and age frequencies are derived for the
retained catch for each sector and used to calculate an
index of the mortality rate in the population.
Annual status report 2011—Gulf of Carpentaria Inshore Fin Fish Fishery 9
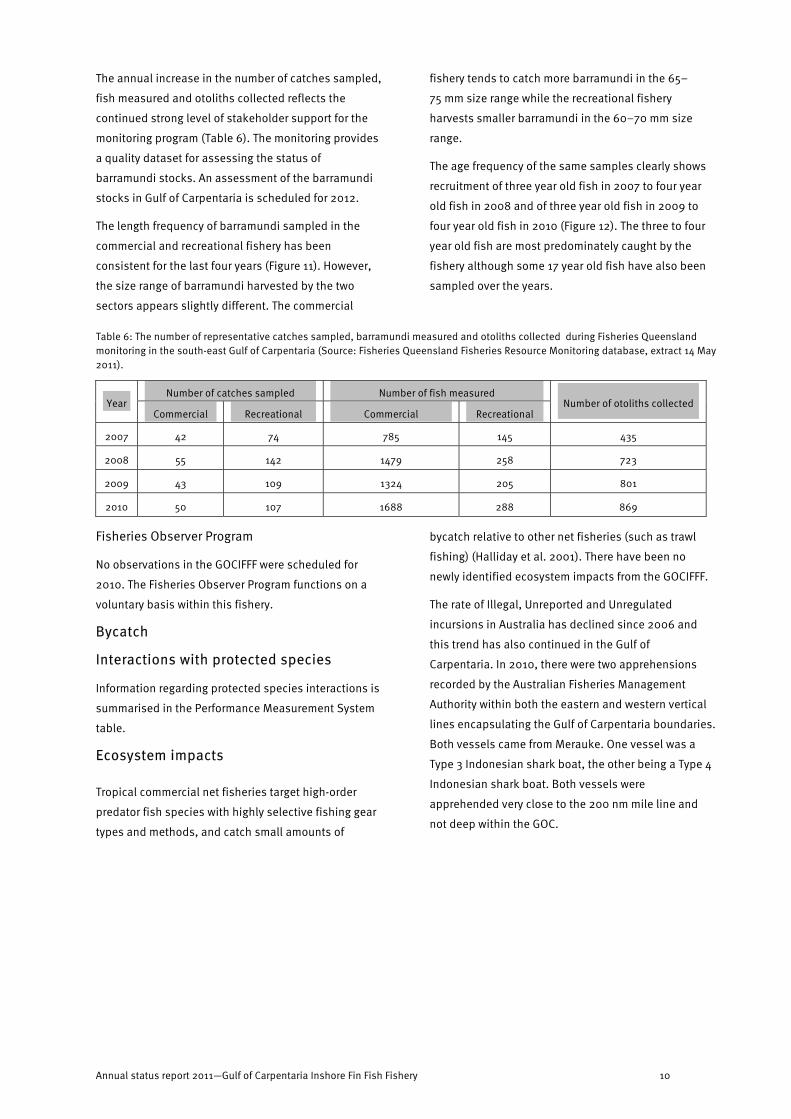
The annual increase in the number of catches sampled,
fish measured and otoliths collected reflects the
continued strong level of stakeholder support for the
monitoring program (Table 6). The monitoring provides
a quality dataset for assessing the status of
barramundi stocks. An assessment of the barramundi
stocks in Gulf of Carpentaria is scheduled for 2012.
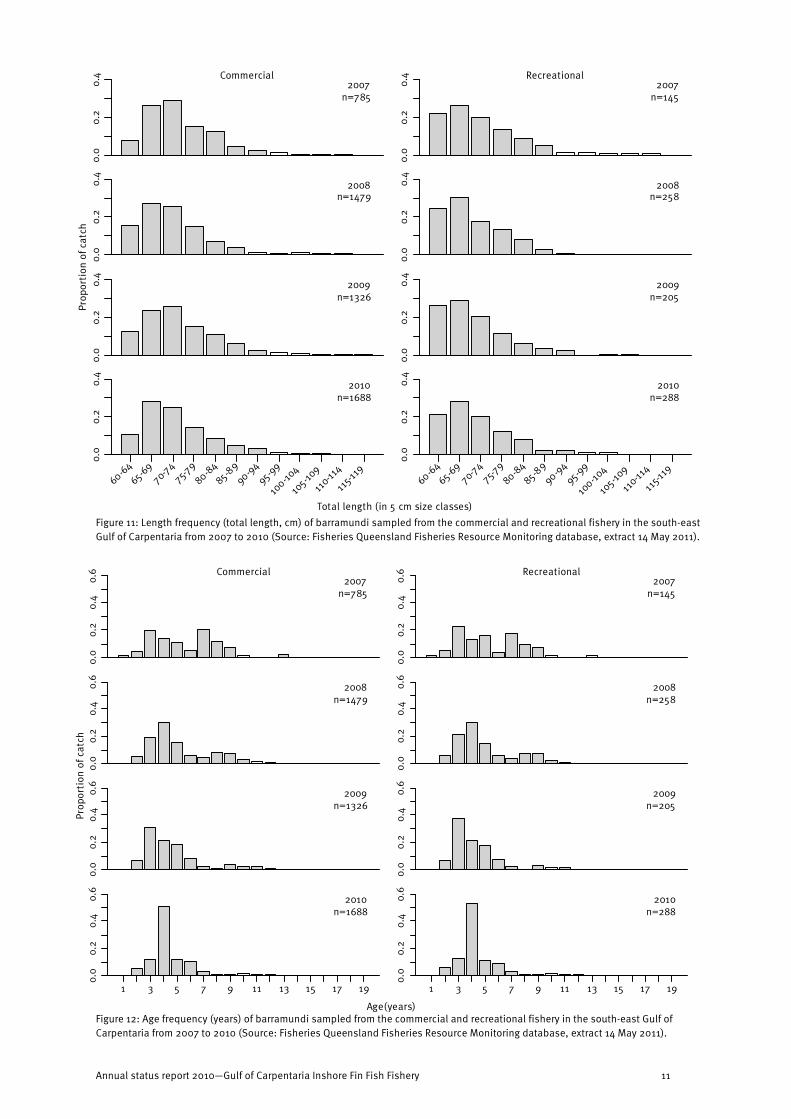
The length frequency of barramundi sampled in the
commercial and recreational fishery has been
consistent for the last four years (Figure 11). However,
the size range of barramundi harvested by the two
sectors appears slightly different. The commercial
fishery tends to catch more barramundi in the 65–
75 mm size range while the recreational fishery
harvests smaller barramundi in the 60–70 mm size
range.
The age frequency of the same samples clearly shows
recruitment of three year old fish in 2007 to four year
old fish in 2008 and of three year old fish in 2009 to
four year old fish in 2010 (Figure 12). The three to four
year old fish are most predominately caught by the
fishery although some 17 year old fish have also been
sampled over the years.
Table 6: The number of representative catches sampled, barramundi measured and otoliths collected during Fisheries Queensland monitoring in the south-east Gulf of Carpentaria (Source: Fisheries Queensland Fisheries Resource Monitoring database, extract 14 May 2011).
Year Number of catches sampled Number of fish measured
Number of otoliths collected Commercial Recreational Commercial Recreational
2007 42 74 785 145 435
2008 55 142 1479 258 723
2009 43 109 1324 205 801
2010 50 107 1688 288 869
Fisheries Observer Program
No observations in the GOCIFFF were scheduled for
2010. The Fisheries Observer Program functions on a
voluntary basis within this fishery.
Bycatch
Interactions with protected species
Information regarding protected species interactions is
summarised in the Performance Measurement System
table.
Ecosystem impacts
Tropical commercial net fisheries target high-order
predator fish species with highly selective fishing gear
types and methods, and catch small amounts of
bycatch relative to other net fisheries (such as trawl
fishing) (Halliday et al. 2001). There have been no
newly identified ecosystem impacts from the GOCIFFF.
The rate of Illegal, Unreported and Unregulated
incursions in Australia has declined since 2006 and
this trend has also continued in the Gulf of
Carpentaria. In 2010, there were two apprehensions
recorded by the Australian Fisheries Management
Authority within both the eastern and western vertical
lines encapsulating the Gulf of Carpentaria boundaries.
Both vessels came from Merauke. One vessel was a
Type 3 Indonesian shark boat, the other being a Type 4
Indonesian shark boat. Both vessels were
apprehended very close to the 200 nm mile line and
not deep within the GOC.
Annual status report 2011—Gulf of Carpentaria Inshore Fin Fish Fishery 10
60-6465-69
70-7475-7
9
80-84
85-89
90-9495-99
100-10
4
105-10
9
110-11
4
115-1
19
60-6465-69
70-74
75-79
80-8485-8
990-94
95-99
100-10
4
105-10
9
110-11
4
115-1
19
0.0
0.2
0.4
0.0
0.2
0.4
0.0
0.2
0.4
0.0
0.2
0.4
Prop
orti
on o
f cat
ch
Prop
orti
on o
f cat
ch
0.0
0.2
0.4
0.6
0.0
0.2
0.4
0.6
0.0
0.2
0.4
0.6
0.0
0.2
0.4
0.6
2007 n=785
Commercial
2008 n=1479
2009 n=1326
2010 n=1688
2007 n=145
Recreational
2008 n=258
2009 n=205
2010 n=288
0.0
0.2
0.4
0.0
0.2
0.4
0.0
0.2
0.4
0.0
0.2
0.4
Total length (in 5 cm size classes)
Figure 11: Length frequency (total length, cm) of barramundi sampled from the commercial and recreational fishery in the south-east Gulf of Carpentaria from 2007 to 2010 (Source: Fisheries Queensland Fisheries Resource Monitoring database, extract 14 May 2011).
2007 n=785
Commercial
0.0
0.2
0.4
0.6
2007 n=145
Recreational
2008 n=1479
0.0
0.2
0.4
0.6
2008 n=258
2009 n=1326
0.0
0.2
0.4
0.6
2009 n=205
2010 n=1688
0.0
0.2
0.4
0.6
2010 n=288
1 3 5 7 9 11 13 15 17 19 1 3 5 7 9 11 13 15 17 19
Age(years) Figure 12: Age frequency (years) of barramundi sampled from the commercial and recreational fishery in the south-east Gulf of Carpentaria from 2007 to 2010 (Source: Fisheries Queensland Fisheries Resource Monitoring database, extract 14 May 2011).
Annual status report 2010—Gulf of Carpentaria Inshore Fin Fish Fishery 11
Sustainability Assessment
Performance against fishery objectives
The Performance Management System (PMS) for the
GOCIFFF (Fisheries Queensland 2008) provides a series
of measures against which the performance of the
fishery can be assessed and reported (Table 7). Full
details of the PMS can be found at
http://www.dpi.qld.gov.au/documents/Fisheries_Sust
ainableFishing/GOC-PMS-09.pdf
New management arrangements for the GOCIFFF have
now come into force (as of 25 November 2011)
following consideration of the outcomes of the review
of the Gulf Management Plan. The arrangements
include new input controls aimed at reducing the
potential for netting effort for shark and grey mackerel
beginning with the 2012 season. Fisheries Queensland
anticipates revising the PMS for the fishery in 2012 to
account for the changed arrangements.
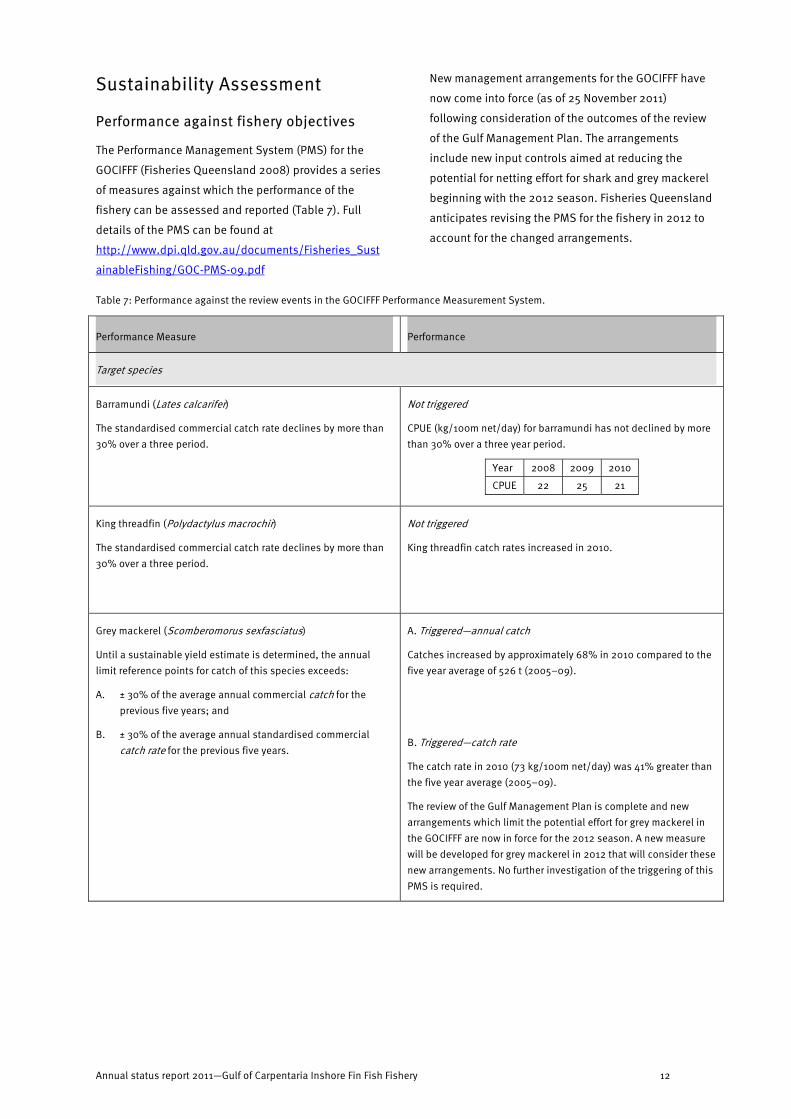
Table 7: Performance against the review events in the GOCIFFF Performance Measurement System.
Performance Measure Performance
Target species
Barramundi (Lates calcarifer)
The standardised commercial catch rate declines by more than 30% over a three period.
Not triggered
CPUE (kg/100m net/day) for barramundi has not declined by more than 30% over a three year period.
Year 2008 2009 2010
CPUE 22 25 21
King threadfin (Polydactylus macrochir)
The standardised commercial catch rate declines by more than 30% over a three period.
Not triggered
King threadfin catch rates increased in 2010.
Grey mackerel (Scomberomorus sexfasciatus)
Until a sustainable yield estimate is determined, the annual limit reference points for catch of this species exceeds:
A. ± 30% of the average annual commercial catch for the previous five years; and
B. ± 30% of the average annual standardised commercial catch rate for the previous five years.
A. Triggered—annual catch
Catches increased by approximately 68% in 2010 compared to the five year average of 526 t (2005–09).
B. Triggered—catch rate
The catch rate in 2010 (73 kg/100m net/day) was 41% greater than the five year average (2005–09).
The review of the Gulf Management Plan is complete and new arrangements which limit the potential effort for grey mackerel in the GOCIFFF are now in force for the 2012 season. A new measure will be developed for grey mackerel in 2012 that will consider these new arrangements. No further investigation of the triggering of this PMS is required.
Annual status report 2011—Gulf of Carpentaria Inshore Fin Fish Fishery 12
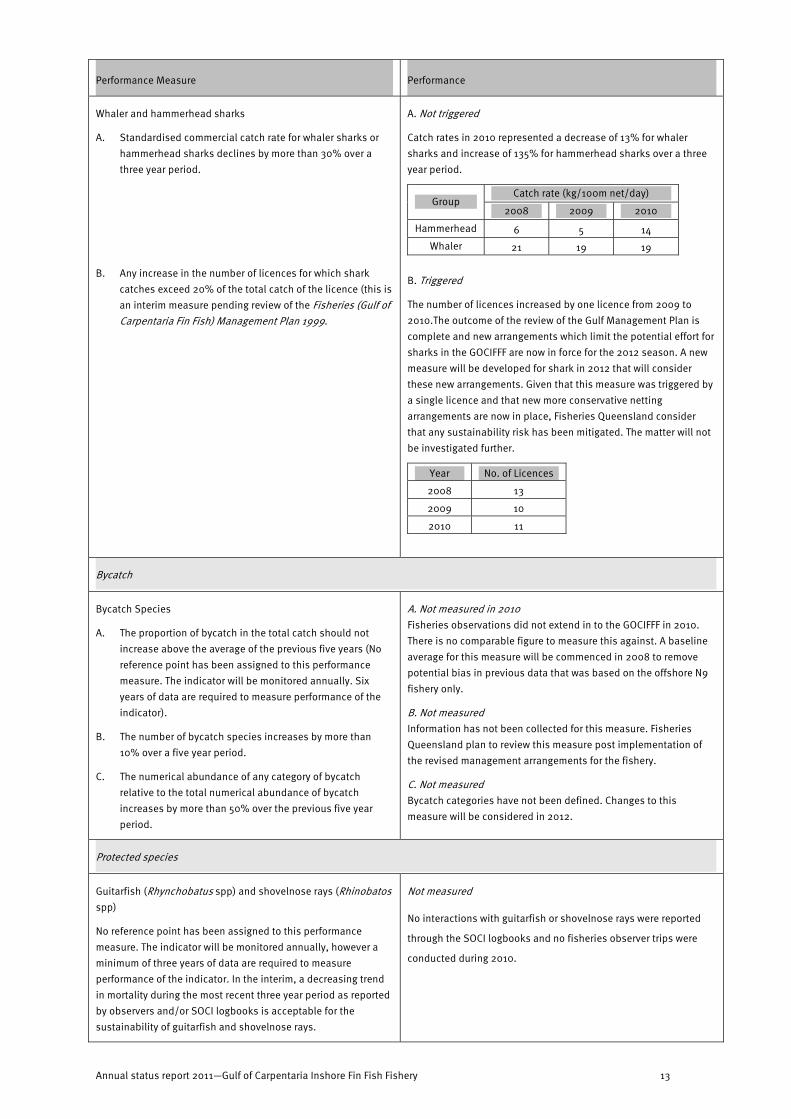
Performance Measure Performance
Whaler and hammerhead sharks
A. Standardised commercial catch rate for whaler sharks or hammerhead sharks declines by more than 30% over a three year period.
B. Any increase in the number of licences for which shark catches exceed 20% of the total catch of the licence (this is an interim measure pending review of the Fisheries (Gulf of Carpentaria Fin Fish) Management Plan 1999.
A. Not triggered
Catch rates in 2010 represented a decrease of 13% for whaler sharks and increase of 135% for hammerhead sharks over a three year period.
Catch rate (kg/100m net/day) Group
2008 2009 2010
Hammerhead 6 5 14 Whaler 21 19 19
B. Triggered
The number of licences increased by one licence from 2009 to 2010.The outcome of the review of the Gulf Management Plan is complete and new arrangements which limit the potential effort for sharks in the GOCIFFF are now in force for the 2012 season. A new measure will be developed for shark in 2012 that will consider these new arrangements. Given that this measure was triggered by a single licence and that new more conservative netting arrangements are now in place, Fisheries Queensland consider that any sustainability risk has been mitigated. The matter will not be investigated further.
Year No. of Licences
2008 13
2009 10
2010 11
Bycatch
Bycatch Species A. Not measured in 2010
A. The proportion of bycatch in the total catch should not increase above the average of the previous five years (No reference point has been assigned to this performance measure. The indicator will be monitored annually. Six years of data are required to measure performance of the
Fisheries observations did not extend in to the GOCIFFF in 2010. There is no comparable figure to measure this against. A baseline average for this measure will be commenced in 2008 to remove potential bias in previous data that was based on the offshore N9 fishery only.
indicator). B. Not measured
B. The number of bycatch species increases by more than 10% over a five year period.
Information has not been collected for this measure. Fisheries Queensland plan to review this measure post implementation of the revised management arrangements for the fishery.
C. The numerical abundance of any category of bycatch relative to the total numerical abundance of bycatch increases by more than 50% over the previous five year period.
C. Not measured Bycatch categories have not been defined. Changes to this measure will be considered in 2012.
Protected species
Guitarfish (Rhynchobatus spp) and shovelnose rays (Rhinobatos Not measured spp)
No interactions with guitarfish or shovelnose rays were reported No reference point has been assigned to this performance
through the SOCI logbooks and no fisheries observer trips were measure. The indicator will be monitored annually, however a minimum of three years of data are required to measure conducted during 2010.
performance of the indicator. In the interim, a decreasing trend in mortality during the most recent three year period as reported by observers and/or SOCI logbooks is acceptable for the sustainability of guitarfish and shovelnose rays.
Annual status report 2011—Gulf of Carpentaria Inshore Fin Fish Fishery 13
Performance Measure Performance
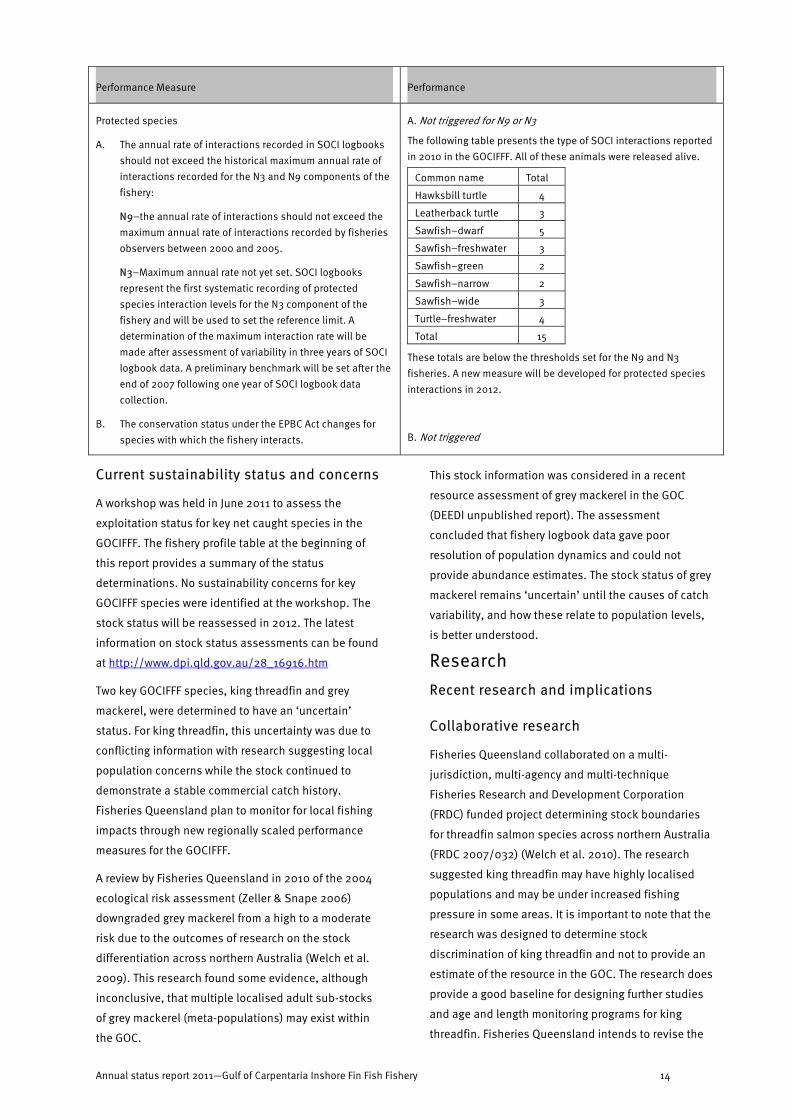
Protected species A. Not triggered for N9 or N3
A. The annual rate of interactions recorded in SOCI logbooks The following table presents the type of SOCI interactions reported
should not exceed the historical maximum annual rate of in 2010 in the GOCIFFF. All of these animals were released alive.
interactions recorded for the N3 and N9 components of the Common name Total fishery: Hawksbill turtle 4
N9–the annual rate of interactions should not exceed the Leatherback turtle 3
maximum annual rate of interactions recorded by fisheries Sawfish–dwarf 5
observers between 2000 and 2005. Sawfish–freshwater 3
N3–Maximum annual rate not yet set. SOCI logbooks Sawfish–green 2
represent the first systematic recording of protected Sawfish–narrow 2
species interaction levels for the N3 component of the Sawfish–wide 3
fishery and will be used to set the reference limit. A Turtle–freshwater 4
determination of the maximum interaction rate will be Total 15 made after assessment of variability in three years of SOCI These totals are below the thresholds set for the N9 and N3 logbook data. A preliminary benchmark will be set after the fisheries. A new measure will be developed for protected species end of 2007 following one year of SOCI logbook data interactions in 2012. collection.
B. The conservation status under the EPBC Act changes for species with which the fishery interacts. B. Not triggered
Current sustainability status and concerns
A workshop was held in June 2011 to assess the
exploitation status for key net caught species in the
GOCIFFF. The fishery profile table at the beginning of
this report provides a summary of the status
determinations. No sustainability concerns for key
GOCIFFF species were identified at the workshop. The
stock status will be reassessed in 2012. The latest
information on stock status assessments can be found
at http://www.dpi.qld.gov.au/28_16916.htm
Two key GOCIFFF species, king threadfin and grey
mackerel, were determined to have an ‘uncertain’
status. For king threadfin, this uncertainty was due to
conflicting information with research suggesting local
population concerns while the stock continued to
demonstrate a stable commercial catch history.
Fisheries Queensland plan to monitor for local fishing
impacts through new regionally scaled performance
measures for the GOCIFFF.
A review by Fisheries Queensland in 2010 of the 2004
ecological risk assessment (Zeller & Snape 2006)
downgraded grey mackerel from a high to a moderate
risk due to the outcomes of research on the stock
differentiation across northern Australia (Welch et al.
2009). This research found some evidence, although
inconclusive, that multiple localised adult sub-stocks
of grey mackerel (meta-populations) may exist within
the GOC.
This stock information was considered in a recent
resource assessment of grey mackerel in the GOC
(DEEDI unpublished report). The assessment
concluded that fishery logbook data gave poor
resolution of population dynamics and could not
provide abundance estimates. The stock status of grey
mackerel remains ‘uncertain’ until the causes of catch
variability, and how these relate to population levels,
is better understood.
Research Recent research and implications
Collaborative research
Fisheries Queensland collaborated on a multi-
jurisdiction, multi-agency and multi-technique
Fisheries Research and Development Corporation
(FRDC) funded project determining stock boundaries
for threadfin salmon species across northern Australia
(FRDC 2007/032) (Welch et al. 2010). The research
suggested king threadfin may have highly localised
populations and may be under increased fishing
pressure in some areas. It is important to note that the
research was designed to determine stock
discrimination of king threadfin and not to provide an
estimate of the resource in the GOC. The research does
provide a good baseline for designing further studies
and age and length monitoring programs for king
threadfin. Fisheries Queensland intends to revise the
Annual status report 2011—Gulf of Carpentaria Inshore Fin Fish Fishery 14
Offences FIN
PMS to include regionally scaled indicators for king
threadfins.
Fishery management Compliance report
During 2010, 3558 units, including 52 commercial net
fishing vessels, were inspected in the GOCIFFF. The
majority of remaining inspections were of recreational
fishers. Ten offences were detected during the period
(Table 8). In addition, two unattended monofilament
nets were seized for which the owner could not be
identified.
All offences during the period resulted in a Fisheries
Infringement Notice (FIN) being issued to the offender.
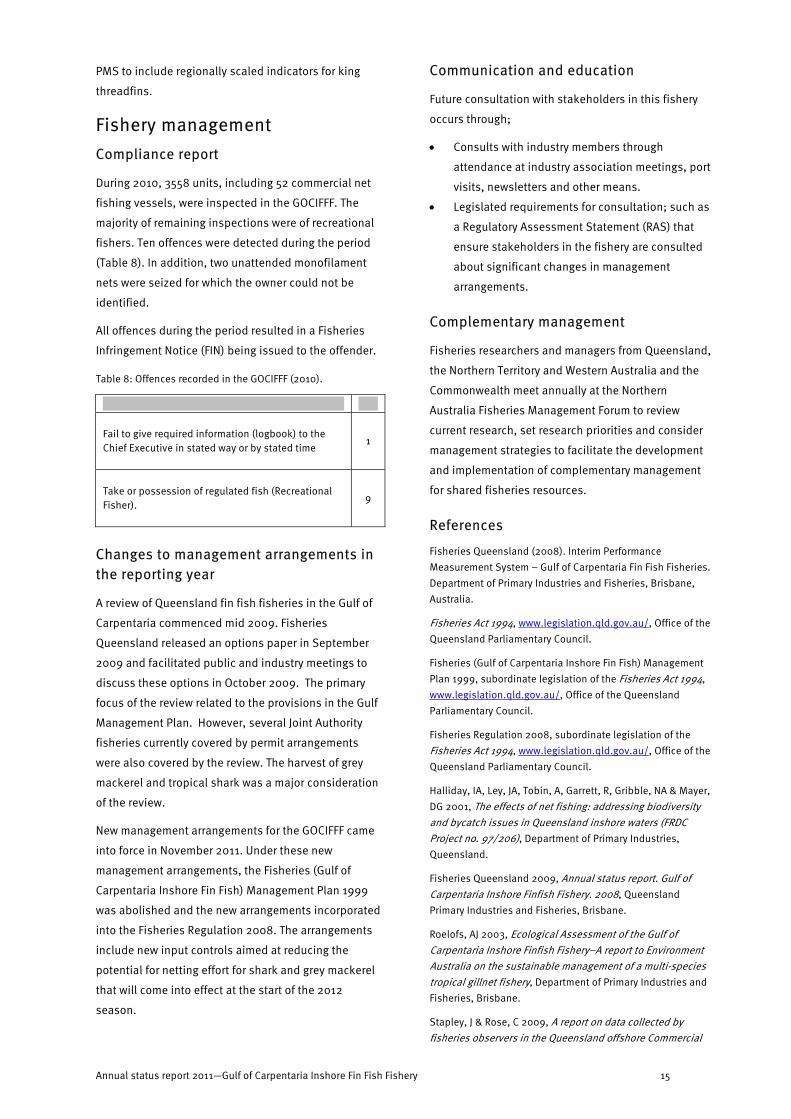
Table 8: Offences recorded in the GOCIFFF (2010).
Fail to give required information (logbook) to the Chief Executive in stated way or by stated time
1
Take or possession of regulated fish (Recreational Fisher).
9
Changes to management arrangements in the reporting year
A review of Queensland fin fish fisheries in the Gulf of
Carpentaria commenced mid 2009. Fisheries
Queensland released an options paper in September
2009 and facilitated public and industry meetings to
discuss these options in October 2009. The primary
focus of the review related to the provisions in the Gulf
Management Plan. However, several Joint Authority
fisheries currently covered by permit arrangements
were also covered by the review. The harvest of grey
mackerel and tropical shark was a major consideration
of the review.
New management arrangements for the GOCIFFF came
into force in November 2011. Under these new
management arrangements, the Fisheries (Gulf of
Carpentaria Inshore Fin Fish) Management Plan 1999
was abolished and the new arrangements incorporated
into the Fisheries Regulation 2008. The arrangements
include new input controls aimed at reducing the
potential for netting effort for shark and grey mackerel
that will come into effect at the start of the 2012
season.
Communication and education
Future consultation with stakeholders in this fishery
occurs through;
• Consults with industry members through
attendance at industry association meetings, port
visits, newsletters and other means.
• Legislated requirements for consultation; such as
a Regulatory Assessment Statement (RAS) that
ensure stakeholders in the fishery are consulted
about significant changes in management
arrangements.
Complementary management
Fisheries researchers and managers from Queensland,
the Northern Territory and Western Australia and the
Commonwealth meet annually at the Northern
Australia Fisheries Management Forum to review
current research, set research priorities and consider
management strategies to facilitate the development
and implementation of complementary management
for shared fisheries resources.
References
Fisheries Queensland (2008). Interim Performance Measurement System – Gulf of Carpentaria Fin Fish Fisheries. Department of Primary Industries and Fisheries, Brisbane, Australia.
Fisheries Act 1994, www.legislation.qld.gov.au/, Office of the Queensland Parliamentary Council.
Fisheries (Gulf of Carpentaria Inshore Fin Fish) Management Plan 1999, subordinate legislation of the Fisheries Act 1994, www.legislation.qld.gov.au/, Office of the Queensland Parliamentary Council.
Fisheries Regulation 2008, subordinate legislation of the Fisheries Act 1994, www.legislation.qld.gov.au/, Office of the Queensland Parliamentary Council.
Halliday, IA, Ley, JA, Tobin, A, Garrett, R, Gribble, NA & Mayer, DG 2001, The effects of net fishing: addressing biodiversity and bycatch issues in Queensland inshore waters (FRDC Project no. 97/206), Department of Primary Industries, Queensland.
Fisheries Queensland 2009, Annual status report. Gulf of Carpentaria Inshore Finfish Fishery. 2008, Queensland Primary Industries and Fisheries, Brisbane.
Roelofs, AJ 2003, Ecological Assessment of the Gulf of Carpentaria Inshore Finfish Fishery–A report to Environment Australia on the sustainable management of a multi-species tropical gillnet fishery, Department of Primary Industries and Fisheries, Brisbane.
Stapley, J & Rose, C 2009, A report on data collected by fisheries observers in the Queensland offshore Commercial
Annual status report 2011—Gulf of Carpentaria Inshore Fin Fish Fishery 15
Mesh Net Fishery (N9) in the Gulf of Carpentaria, 2000-2006, Brisbane.
Zeller, B & Snape, N 2006, Ecological Risk Assessment of Queensland-managed fisheries in the Gulf of Carpentaria. A report to the Australian Government on ecological risk assessment requirements set out in Wildlife Trade Operation approvals for Gulf fisheries under the Environment Protection and Biodiversity Conservation Act 1999, Department of Primary Industries & Fisheries, Brisbane.
Welch, D, Buckworth, R, Ovenden, J, Newman, S, Broderick, D, Lester, R, Ballagh, A, Stapley, J, Charters, R & Gribble, N 2009, Determination of management units for grey mackerel fisheries in northern Australia. Final report, Fisheries Research and Development Corporation Project No 2005/010, Fishing and Fisheries Research Centre Technical Report No. 4, Fishing and Fisheries Research Centre, James Cook University, Townsville, Australia.
Welch, D, Ballagh, A, Newman, S, Lester, R, Moore, B, van Herwerden, L, Horne, J, Allsop, Q, Saunders, T, JM, S & Gribble, N 2010, Defining the stock structure of northern Australia’s threadfin salmon species. Final Report to the Fisheries Research & Development Corporation, Project 2007/032. Fishing & Fisheries Research Centre Technical Report No. 10, James Cook University, Townsville, Australia.
Information compiled by
Anthony Roelofs
Acknowledgements
Sue Helmke, Dr Tracey Scott-Holland, Tara Smith, Dr Malcolm
Dunning.
Annual status report 2011—Gulf of Carpentaria Inshore Fin Fish Fishery 16