ecological assessment of the gulf of carpentaria inshore
TRANSCRIPT
Ecological assessment of the Gulf of Carpentaria Inshore Finfish Fishery
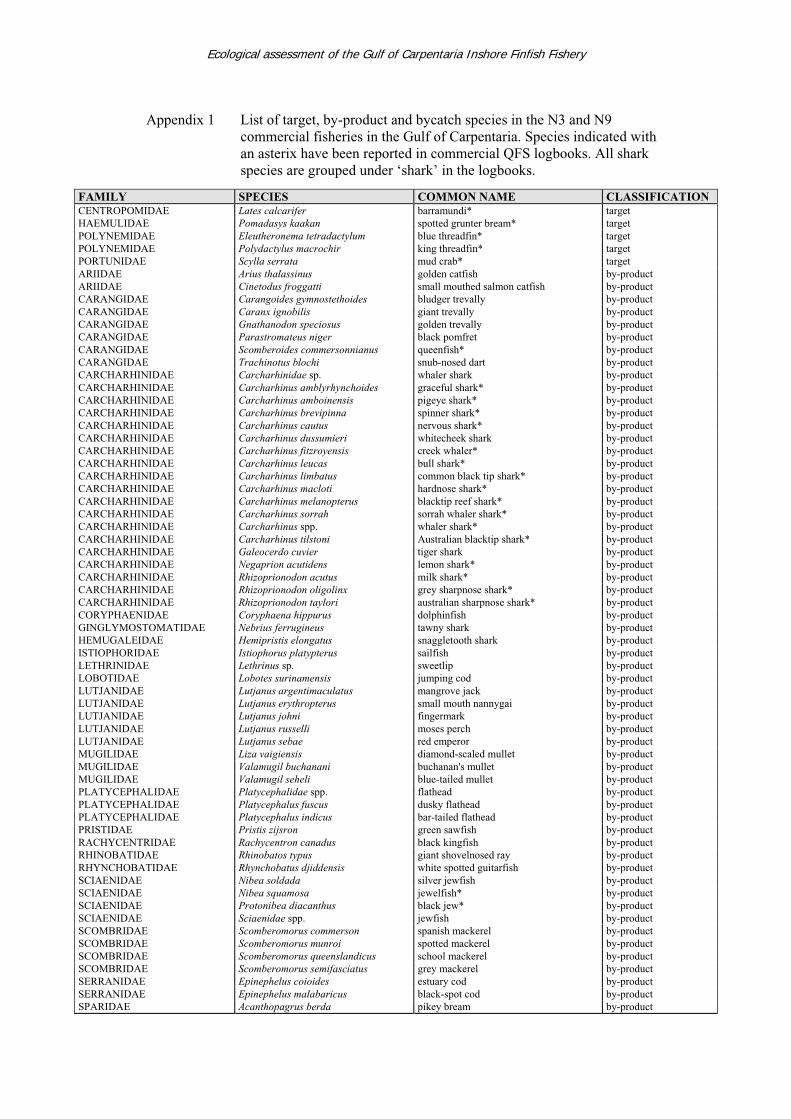
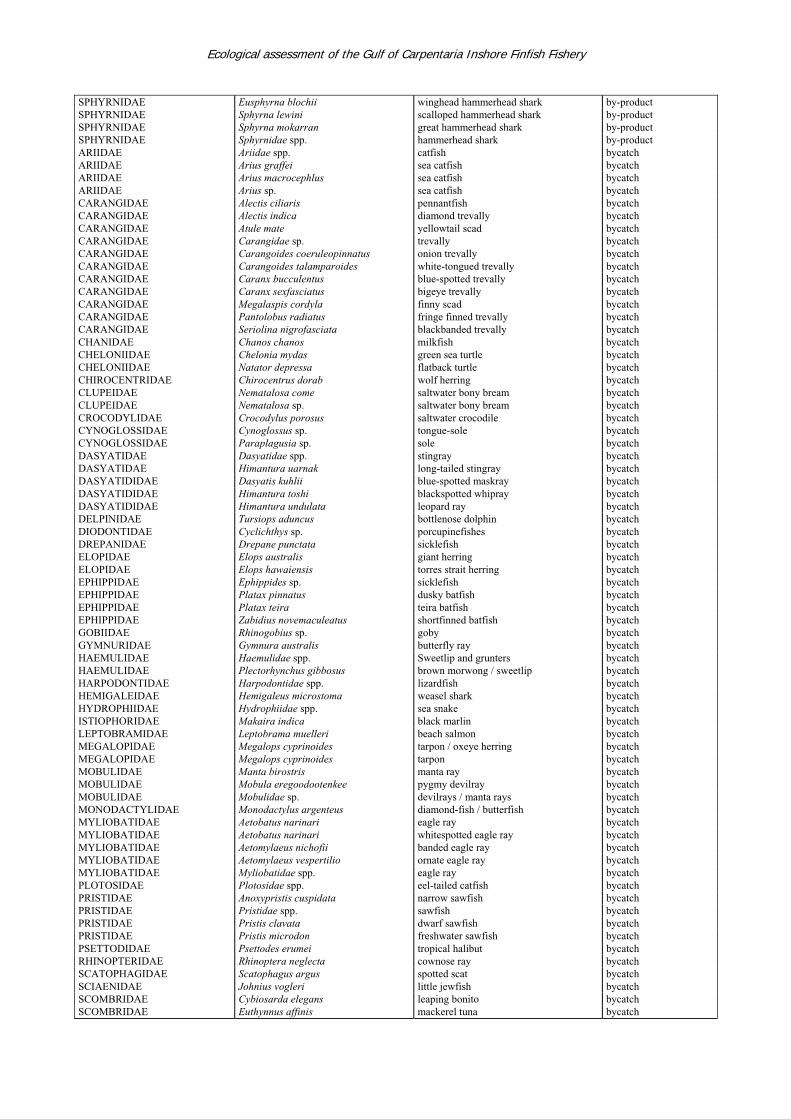
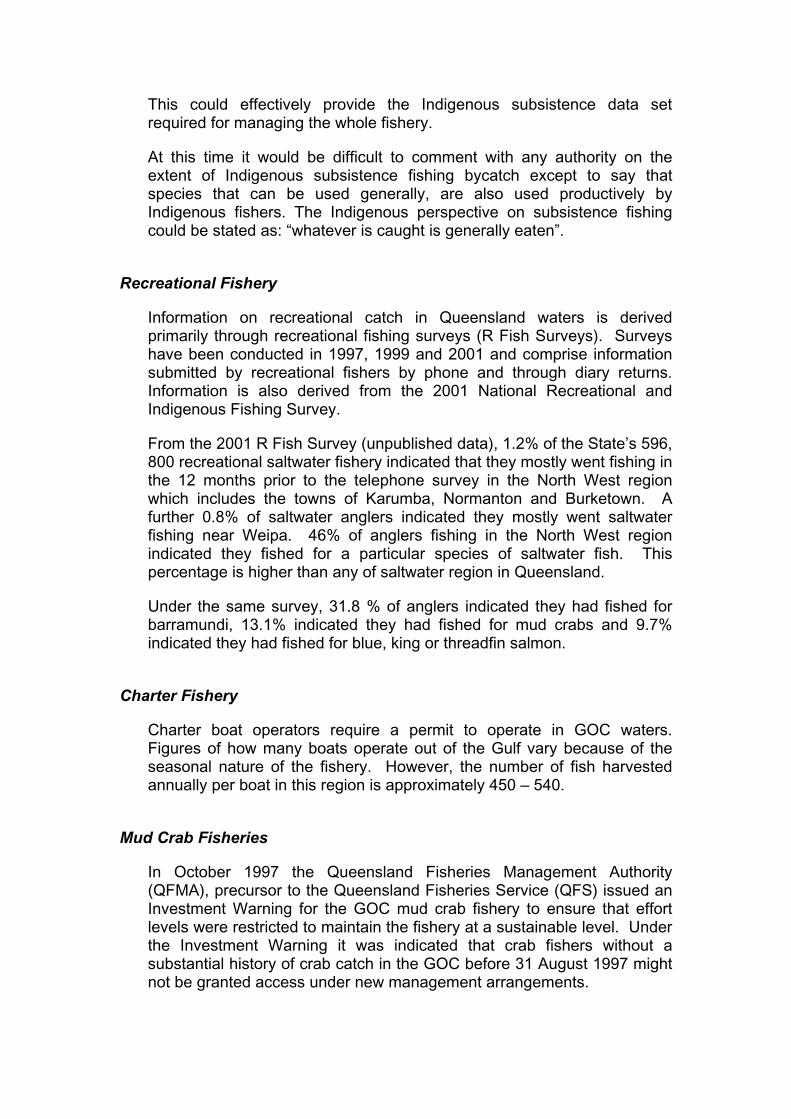
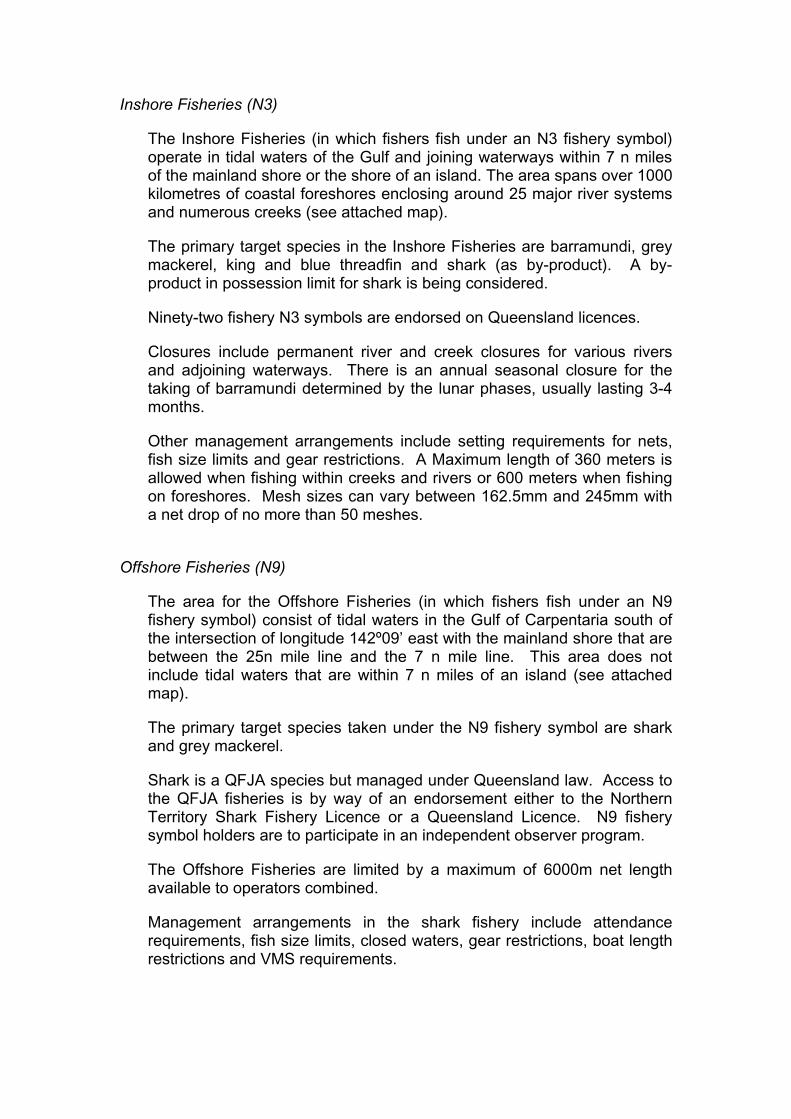
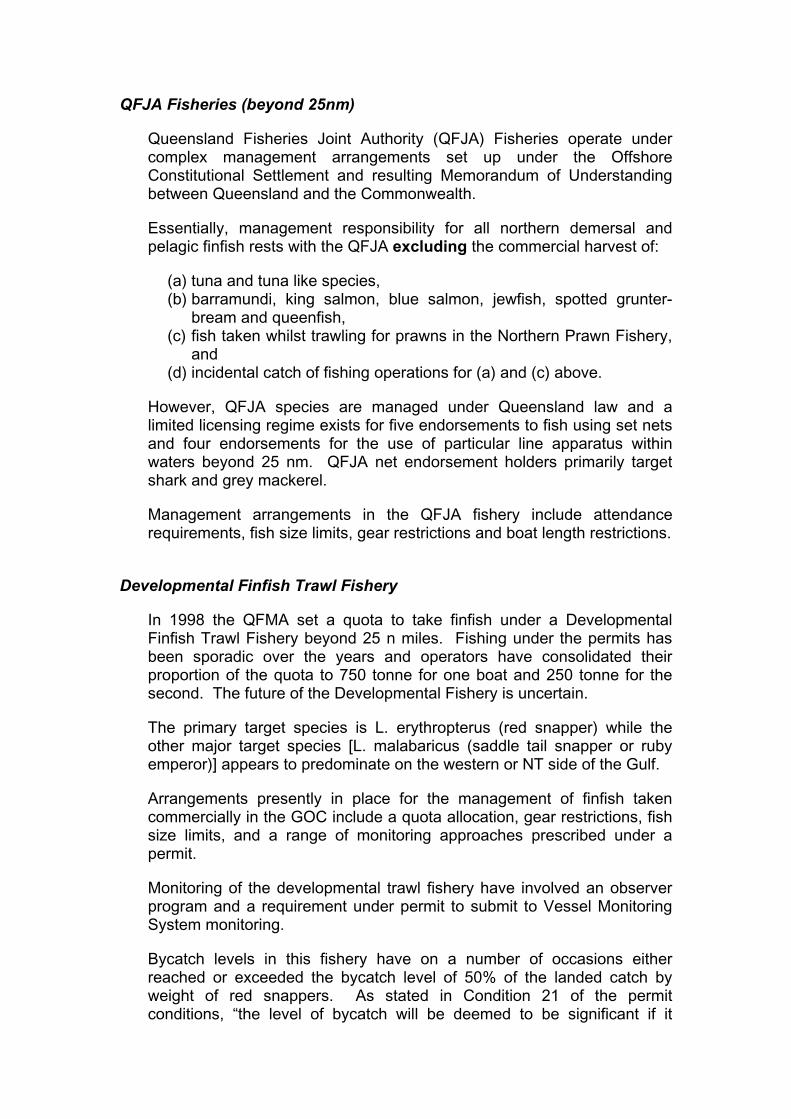
Appendix 1 List of target, by-product and bycatch species in the N3 and N9 commercial fisheries in the Gulf of Carpentaria. Species indicated with an asterix have been reported in commercial QFS logbooks. All shark species are grouped under ‘shark’ in the logbooks.
FAMILY SPECIES COMMON NAME CLASSIFICATION CENTROPOMIDAE Lates calcarifer barramundi* target HAEMULIDAE Pomadasys kaakan spotted grunter bream* target POLYNEMIDAE Eleutheronema tetradactylum blue threadfin* target POLYNEMIDAE Polydactylus macrochir king threadfin* target PORTUNIDAE Scylla serrata mud crab* target ARIIDAE Arius thalassinus golden catfish by-product ARIIDAE Cinetodus froggatti small mouthed salmon catfish by-product CARANGIDAE Carangoides gymnostethoides bludger trevally by-product CARANGIDAE Caranx ignobilis giant trevally by-product CARANGIDAE Gnathanodon speciosus golden trevally by-product CARANGIDAE Parastromateus niger black pomfret by-product CARANGIDAE Scomberoides commersonnianus queenfish* by-product CARANGIDAE Trachinotus blochi snub-nosed dart by-product CARCHARHINIDAE Carcharhinidae sp. whaler shark by-product CARCHARHINIDAE Carcharhinus amblyrhynchoides graceful shark* by-product CARCHARHINIDAE Carcharhinus amboinensis pigeye shark* by-product CARCHARHINIDAE Carcharhinus brevipinna spinner shark* by-product CARCHARHINIDAE Carcharhinus cautus nervous shark* by-product CARCHARHINIDAE Carcharhinus dussumieri whitecheek shark by-product CARCHARHINIDAE Carcharhinus fitzroyensis creek whaler* by-product CARCHARHINIDAE Carcharhinus leucas bull shark* by-product CARCHARHINIDAE Carcharhinus limbatus common black tip shark* by-product CARCHARHINIDAE Carcharhinus macloti hardnose shark* by-product CARCHARHINIDAE Carcharhinus melanopterus blacktip reef shark* by-product CARCHARHINIDAE Carcharhinus sorrah sorrah whaler shark* by-product CARCHARHINIDAE Carcharhinus spp. whaler shark* by-product CARCHARHINIDAE Carcharhinus tilstoni Australian blacktip shark* by-product CARCHARHINIDAE Galeocerdo cuvier tiger shark by-product CARCHARHINIDAE Negaprion acutidens lemon shark* by-product CARCHARHINIDAE Rhizoprionodon acutus milk shark* by-product CARCHARHINIDAE Rhizoprionodon oligolinx grey sharpnose shark* by-product CARCHARHINIDAE Rhizoprionodon taylori australian sharpnose shark* by-product CORYPHAENIDAE Coryphaena hippurus dolphinfish by-product GINGLYMOSTOMATIDAE Nebrius ferrugineus tawny shark by-product HEMUGALEIDAE Hemipristis elongatus snaggletooth shark by-product ISTIOPHORIDAE Istiophorus platypterus sailfish by-product LETHRINIDAE Lethrinus sp. sweetlip by-product LOBOTIDAE Lobotes surinamensis jumping cod by-product LUTJANIDAE Lutjanus argentimaculatus mangrove jack by-product LUTJANIDAE Lutjanus erythropterus small mouth nannygai by-product LUTJANIDAE Lutjanus johni fingermark by-product LUTJANIDAE Lutjanus russelli moses perch by-product LUTJANIDAE Lutjanus sebae red emperor by-product MUGILIDAE Liza vaigiensis diamond-scaled mullet by-product MUGILIDAE Valamugil buchanani buchanan's mullet by-product MUGILIDAE Valamugil seheli blue-tailed mullet by-product PLATYCEPHALIDAE Platycephalidae spp. flathead by-product PLATYCEPHALIDAE Platycephalus fuscus dusky flathead by-product PLATYCEPHALIDAE Platycephalus indicus bar-tailed flathead by-product PRISTIDAE Pristis zijsron green sawfish by-product RACHYCENTRIDAE Rachycentron canadus black kingfish by-product RHINOBATIDAE Rhinobatos typus giant shovelnosed ray by-product RHYNCHOBATIDAE Rhynchobatus djiddensis white spotted guitarfish by-product SCIAENIDAE Nibea soldada silver jewfish by-product SCIAENIDAE Nibea squamosa jewelfish* by-product SCIAENIDAE Protonibea diacanthus black jew* by-product SCIAENIDAE Sciaenidae spp. jewfish by-product SCOMBRIDAE Scomberomorus commerson spanish mackerel by-product SCOMBRIDAE Scomberomorus munroi spotted mackerel by-product SCOMBRIDAE Scomberomorus queenslandicus school mackerel by-product SCOMBRIDAE Scomberomorus semifasciatus grey mackerel by-product SERRANIDAE Epinephelus coioides estuary cod by-product SERRANIDAE Epinephelus malabaricus black-spot cod by-product SPARIDAE Acanthopagrus berda pikey bream by-product
Ecological assessment of the Gulf of Carpentaria Inshore Finfish Fishery
SPHYRNIDAE Eusphyrna blochii winghead hammerhead shark by-product SPHYRNIDAE Sphyrna lewini scalloped hammerhead shark by-product SPHYRNIDAE Sphyrna mokarran great hammerhead shark by-product SPHYRNIDAE Sphyrnidae spp. hammerhead shark by-product ARIIDAE Ariidae spp. catfish bycatch ARIIDAE Arius graffei sea catfish bycatch ARIIDAE Arius macrocephlus sea catfish bycatch ARIIDAE Arius sp. sea catfish bycatch CARANGIDAE Alectis ciliaris pennantfish bycatch CARANGIDAE Alectis indica diamond trevally bycatch CARANGIDAE Atule mate yellowtail scad bycatch CARANGIDAE Carangidae sp. trevally bycatch CARANGIDAE Carangoides coeruleopinnatus onion trevally bycatch CARANGIDAE Carangoides talamparoides white-tongued trevally bycatch CARANGIDAE Caranx bucculentus blue-spotted trevally bycatch CARANGIDAE Caranx sexfasciatus bigeye trevally bycatch CARANGIDAE Megalaspis cordyla finny scad bycatch CARANGIDAE Pantolobus radiatus fringe finned trevally bycatch CARANGIDAE Seriolina nigrofasciata blackbanded trevally bycatch CHANIDAE Chanos chanos milkfish bycatch CHELONIIDAE Chelonia mydas green sea turtle bycatch CHELONIIDAE Natator depressa flatback turtle bycatch CHIROCENTRIDAE Chirocentrus dorab wolf herring bycatch CLUPEIDAE Nematalosa come saltwater bony bream bycatch CLUPEIDAE Nematalosa sp. saltwater bony bream bycatch CROCODYLIDAE Crocodylus porosus saltwater crocodile bycatch CYNOGLOSSIDAE Cynoglossus sp. tongue-sole bycatch CYNOGLOSSIDAE Paraplagusia sp. sole bycatch DASYATIDAE Dasyatidae spp. stingray bycatch DASYATIDAE Himantura uarnak long-tailed stingray bycatch DASYATIDIDAE Dasyatis kuhlii blue-spotted maskray bycatch DASYATIDIDAE Himantura toshi blackspotted whipray bycatch DASYATIDIDAE Himantura undulata leopard ray bycatch DELPINIDAE Tursiops aduncus bottlenose dolphin bycatch DIODONTIDAE Cyclichthys sp. porcupinefishes bycatch DREPANIDAE Drepane punctata sicklefish bycatch ELOPIDAE Elops australis giant herring bycatch ELOPIDAE Elops hawaiensis torres strait herring bycatch EPHIPPIDAE Ephippides sp. sicklefish bycatch EPHIPPIDAE Platax pinnatus dusky batfish bycatch EPHIPPIDAE Platax teira teira batfish bycatch EPHIPPIDAE Zabidius novemaculeatus shortfinned batfish bycatch GOBIIDAE Rhinogobius sp. goby bycatch GYMNURIDAE Gymnura australis butterfly ray bycatch HAEMULIDAE Haemulidae spp. Sweetlip and grunters bycatch HAEMULIDAE Plectorhynchus gibbosus brown morwong / sweetlip bycatch HARPODONTIDAE Harpodontidae spp. lizardfish bycatch HEMIGALEIDAE Hemigaleus microstoma weasel shark bycatch HYDROPHIIDAE Hydrophiidae spp. sea snake bycatch ISTIOPHORIDAE Makaira indica black marlin bycatch LEPTOBRAMIDAE Leptobrama muelleri beach salmon bycatch MEGALOPIDAE Megalops cyprinoides tarpon / oxeye herring bycatch MEGALOPIDAE Megalops cyprinoides tarpon bycatch MOBULIDAE Manta birostris manta ray bycatch MOBULIDAE Mobula eregoodootenkee pygmy devilray bycatch MOBULIDAE Mobulidae sp. devilrays / manta rays bycatch MONODACTYLIDAE Monodactylus argenteus diamond-fish / butterfish bycatch MYLIOBATIDAE Aetobatus narinari eagle ray bycatch MYLIOBATIDAE Aetobatus narinari whitespotted eagle ray bycatch MYLIOBATIDAE Aetomylaeus nichofii banded eagle ray bycatch MYLIOBATIDAE Aetomylaeus vespertilio ornate eagle ray bycatch MYLIOBATIDAE Myliobatidae spp. eagle ray bycatch PLOTOSIDAE Plotosidae spp. eel-tailed catfish bycatch PRISTIDAE Anoxypristis cuspidata narrow sawfish bycatch PRISTIDAE Pristidae spp. sawfish bycatch PRISTIDAE Pristis clavata dwarf sawfish bycatch PRISTIDAE Pristis microdon freshwater sawfish bycatch PSETTODIDAE Psettodes erumei tropical halibut bycatch RHINOPTERIDAE Rhinoptera neglecta cownose ray bycatch SCATOPHAGIDAE Scatophagus argus spotted scat bycatch SCIAENIDAE Johnius vogleri little jewfish bycatch SCOMBRIDAE Cybiosarda elegans leaping bonito bycatch SCOMBRIDAE Euthynnus affinis mackerel tuna bycatch

Ecological assessment of the Gulf of Carpentaria Inshore Finfish Fishery
SCOMBRIDAE Rastrelliger brachysoma short mackerel bycatch SCOMBRIDAE Thunnus tonggol long tail tuna bycatch SCYLIORHINIDAE Atelomycterus sp. banded catshark bycatch SCYLIORHINIDAE Scyliorhinidae sp. catshark bycatch SOLEIDAE Soleidae spp. soles bycatch SPHYRAENIDAE Sphyraena jello slender barracuda bycatch SPHYRAENIDAE Sphyraena sp. barracuda, sea pike bycatch STEGASTOMATIDAE Stegostoma fasciatun leopard shark bycatch SYNODONTIDAE Saurida undosquamis spotted-tailed grinner bycatch TETRAODONTIDAE Arothron stellatus starry pufferfish bycatch TETRAODONTIDAE Tetraodontidae spp. pufferfish bycatch TOXOTIDAE Toxotes chatareus archerfish bycatch

Appendix 2
FINAL DRAFT
BYCATCH ACTION PLAN:
GULF OF CARPENTARIA
INDIGENOUS, RECREATIONAL AND COMMERCIAL FISHERIES
Developed by stakeholders in consultation with the Queensland
Fisheries Service.

The Queensland Fisheries Service (QFS) is the fisheries agency responsible for the management, use, development and protection of the State’s naturally occurring fisheries resources. The QFS is committed to ensuring that fisheries resources are used in an ecologically sustainable way, that optimum benefits are obtained from them, and that access to the resource is fair. The development of a sustainable Bycatch Action Plan is a significant step towards achieving that commitment.
DISCLAIMER
This document is for discussion and comment. It does not commit the Queensland Fisheries Service to either the views expressed or further action. No liability will be accepted for actions taken on the basis of this document. Where the Bycatch Action Plan indicates that proposals are under consideration and are open for public information, discussion and comment, QFS or State Government Policy is yet to be determined.
This document refers to some provisions of fisheries legislation, as at the date of publication. It is not a precise statement of the law and should not be used or relied upon for that purpose. Anyone wishing to obtain exact legislative details should refer to the appropriate statute or regulation (for example, the Fisheries Act 1994, and Fisheries Regulations 1995).
Nothing in this Bycatch Action Plan is intended to suggest it may diminish, extinguish or be wholly or partly inconsistent with the continued existence, enjoyment or exercise of Native Title. The rights and interests of Native Title holders will be treated according to Commonwealth and State laws and the common law.
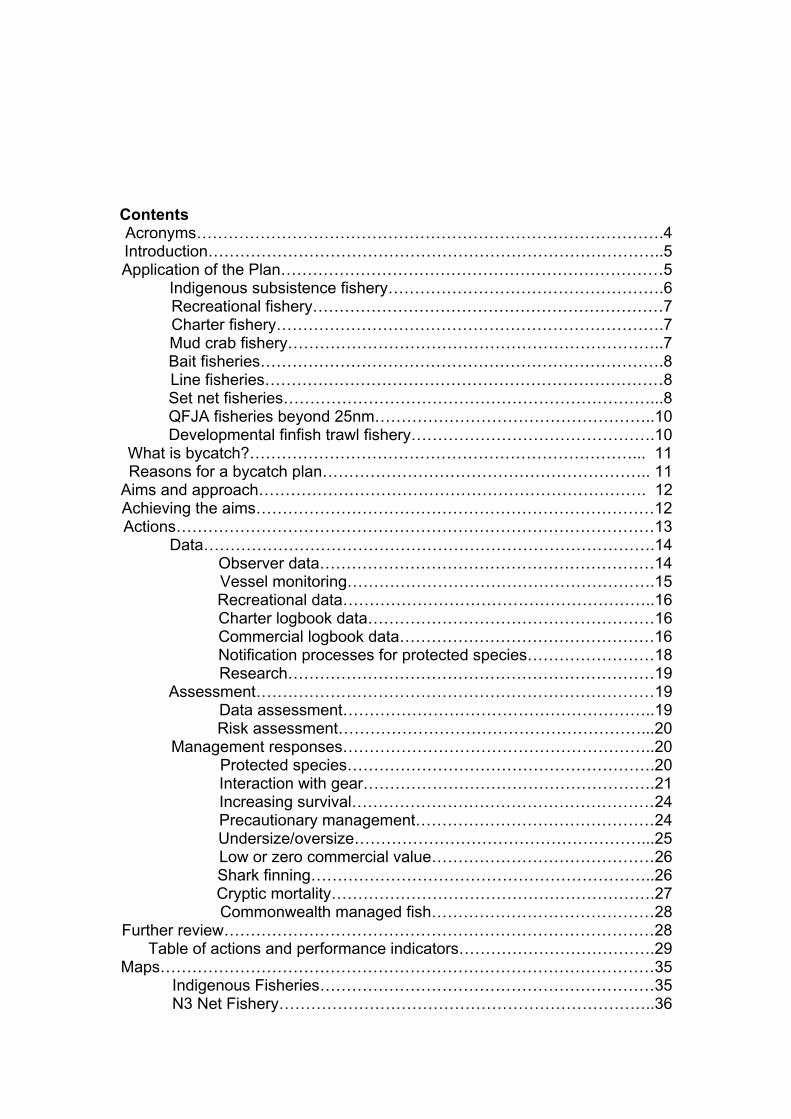
ContentsAcronyms…………………………………………………………………………….4Introduction…………………………………………………………………………..5 Application of the Plan………………………………………………………………5
Indigenous subsistence fishery…………………………………………….6 Recreational fishery…………………………………………………………7 Charter fishery……………………………………………………………….7 Mud crab fishery……………………………………………………………..7 Bait fisheries………………………………………………………………….8 Line fisheries…………………………………………………………………8 Set net fisheries……………………………………………………………...8 QFJA fisheries beyond 25nm……………………………………………..10 Developmental finfish trawl fishery……………………………………….10
What is bycatch?………………………………………………………………... 11 Reasons for a bycatch plan…………………………………………………….. 11
Aims and approach………………………………………………………………. 12 Achieving the aims…………………………………………………………………12 Actions………………………………………………………………………………13
Data………………………………………………………………………….14Observer data………………………………………………………14 Vessel monitoring………………………………………………….15 Recreational data…………………………………………………..16 Charter logbook data………………………………………………16 Commercial logbook data…………………………………………16 Notification processes for protected species……………………18 Research……………………………………………………………19
Assessment…………………………………………………………………19Data assessment…………………………………………………..19
Risk assessment…………………………………………………...20 Management responses…………………………………………………..20
Protected species………………………………………………….20 Interaction with gear……………………………………………….21 Increasing survival…………………………………………………24 Precautionary management………………………………………24 Undersize/oversize………………………………………………...25 Low or zero commercial value……………………………………26 Shark finning………………………………………………………..26 Cryptic mortality…………………………………………………….27 Commonwealth managed fish……………………………………28
Further review………………………………………………………………………28 Table of actions and performance indicators……………………………….29
Maps…………………………………………………………………………………35 Indigenous Fisheries………………………………………………………35
N3 Net Fishery……………………………………………………………..36

N9 Net Fishery……………………………………………………………..37 L4 Line Fishery……………………………………………………………..38 C1 Crab Fishery (Gulf)…………………………………………………….39
Developmental Finfish Trawl Fishery…………………………………….40 History of bycatch measures in the Gulf of Carpentaria……………...41
Acronyms
AFFS Agency of Food and Fibre Sciences BAP Bycatch Action Plan CSIRO Commonwealth Scientific and Industrial Research Organisation DPI Department of Primary IndustriesECCERS Electronic Catch and Effort Reporting Systems FRDC Fisheries Research and Development Corporation GOC Gulf of Carpentaria GOCCFA Gulf of Carpentaria Commercial Fishermen’s Association Gulf MAC Gulf of Carpentaria Management Advisory Committee NPOA-shark National Plan of Action for the Conservation and Management of
SharksNT Northern Territory OCS Offshore Constitutional Settlement QFJA Queensland Fisheries Joint Authority QFMA Queensland Fisheries Management Authority QFS Queensland Fisheries Service VMS Vessel Monitoring System
Introduction
The Bycatch Action Plan BAP has been developed by stakeholders as a strategic plan to manage bycatch in recreational and commercial fisheries in the Gulf of Carpentaria (GOC). The strategies listed are those considered to be of the highest priority to address specific bycatch issues. The BAP is also intended to provide the wider fishing community and the general community with an overall perspective of activity taken to address bycatch in GOC fisheries.
The stakeholders are responsible for implementing the actions listed in the Action Plan. While the Queensland Fisheries Service may be involved in implementing some of the strategies, others may rest entirely with industry and other user groups, such as the review and strengthening of compliance with Codes of Practice. Implementing most of the actions will be a collaborative effort and working groups may be established to prioritise the actions and coordinate the action response.
Application of the Plan
The Bycatch Action Plan (BAP) applies to the following fisheries in the Gulf of Carpentaria (the symbols listed next to an action number indicates which fishery applies to a particular action):
Indigenous = Indigenous Fisheries Rec = Recreational Fisheries Charter = Charter Fisheries C1 = Crab Fisheries N6/7 = Bait Fisheries L4/5 = Line Fisheries Trawl = Developmental Finfish Trawl N3 = Inshore Fishery N9 = Offshore Fishery including QFJA endorsements QFJA + 25 = Queensland Fisheries Joint Authority (QFJA) endorsements other than those attached to N9 fishery symbol All fisheries = applies to all fisheries All commercial fisheries = applies to C1, N6/7, L4/5, N3, N9, QFJA +25.
The Commonwealth Prawn Trawl Fishery operating beyond 25 nautical miles has a BAP applicable to that fishery (available on the website www.afma.gov.au). This fishery will not be discussed in this BAP.

Indigenous Subsistence Fishery
There are more than 15 Aboriginal clan groups located in the GulfMAC region. Each of these has specific issues as a consequence of history and circumstances while other matters might be shared by neighbours, other communities and other sectors.
It is essential that stakeholders and the broader community understand the importance of subsistence fishing and also that Indigenous people do not necessarily want to be constrained by the prevailing view that they only have subsistence interests. Indigenous peoples also have aspirations to become involved in commercial, tourism and charter fishing and when they enter those sectors would need to subscribe to codes of conduct and legislation pertaining to them.
Subsistence fishing is very important in terms of cultural practice, sustaining kinship linkages, providing food and offsetting economic pressures.
The Queensland Fisheries Act 1994 provides for access to fish by Indigenous peoples and the Native Title Act 1993 provides a right for native title holders to hunt and fish within their traditional areas. Traditional owners are not subject to size or bag limits although an important precedent has been set by the traditional owners of the Injinoo Land Trust, in implementing a voluntary regional agreement banning the taking of Black Jewfish.
Traditional fishing sometimes focuses on smaller and/or “fat” fish. These types of targets are frequently associated with edibility (texture and taste), quality (nutritional value) and cultural practice. Often calender plants signal appropriate fishing times for certain species when they are in prime condition and deliver high level nutrition for pregnant women, older or frail individuals and can have medicinal properties. These targets may conflict with current closures and size limits. Certain fish are reserved for senior people and might include smaller fish (below “legal size” for other sectors) with soft flesh for older people who have difficulty chewing. Sometimes spawning fish are targeted for roe.
While rights exist for Indigenous people to fish, parties need to be aware of the motivations of each and recognise real needs for food, cultural survival, economic development and environmentally sustainable development and strike a balance between those needs.
In 1998, Department of Primary Industries, Department of Environment and Heritage and Balkanu collaborated on the development of an Indigenous Subsistence Fishing Survey Kit. This was also overlapped by the National Recreational and Indigenous survey process. The first and only trial of the former kit proved to be very valuable, and relied on a degree of facilitation and some caveats relating to data security. The parties believe that there is potential for the Indigenous Subsistence Fishing Survey Kit given support from traditional owners and agencies.
This could effectively provide the Indigenous subsistence data set required for managing the whole fishery.
At this time it would be difficult to comment with any authority on the extent of Indigenous subsistence fishing bycatch except to say that species that can be used generally, are also used productively by Indigenous fishers. The Indigenous perspective on subsistence fishing could be stated as: “whatever is caught is generally eaten”.
Recreational Fishery
Information on recreational catch in Queensland waters is derived primarily through recreational fishing surveys (R Fish Surveys). Surveys have been conducted in 1997, 1999 and 2001 and comprise information submitted by recreational fishers by phone and through diary returns. Information is also derived from the 2001 National Recreational and Indigenous Fishing Survey.
From the 2001 R Fish Survey (unpublished data), 1.2% of the State’s 596, 800 recreational saltwater fishery indicated that they mostly went fishing in the 12 months prior to the telephone survey in the North West region which includes the towns of Karumba, Normanton and Burketown. A further 0.8% of saltwater anglers indicated they mostly went saltwater fishing near Weipa. 46% of anglers fishing in the North West region indicated they fished for a particular species of saltwater fish. This percentage is higher than any of saltwater region in Queensland.
Under the same survey, 31.8 % of anglers indicated they had fished for barramundi, 13.1% indicated they had fished for mud crabs and 9.7% indicated they had fished for blue, king or threadfin salmon.
Charter Fishery
Charter boat operators require a permit to operate in GOC waters. Figures of how many boats operate out of the Gulf vary because of the seasonal nature of the fishery. However, the number of fish harvested annually per boat in this region is approximately 450 – 540.
Mud Crab Fisheries
In October 1997 the Queensland Fisheries Management Authority (QFMA), precursor to the Queensland Fisheries Service (QFS) issued an Investment Warning for the GOC mud crab fishery to ensure that effort levels were restricted to maintain the fishery at a sustainable level. Under the Investment Warning it was indicated that crab fishers without a substantial history of crab catch in the GOC before 31 August 1997 might not be granted access under new management arrangements.

Around ninety-four C1 Fishery Symbols endorsed on Queensland licences are used to take crabs in the GOC. The C1 Fishery Symbol applies to fishing for mud crab or blue swimmer crab in East Coast and GOC waters although a separate crab symbol for the Gulf is under consideration.
Management arrangements for mud crabs include restrictions on gear and the number of pots that may be used, attendance requirements, fish size restrictions, closed areas, boat length restrictions and a prohibition on the taking of female mud crabs.
Bait Fisheries
There are two fishery symbols, ‘N6’ and ‘N7’ for the purpose of collecting bait in the Gulf of Carpentaria area. The area for both the ‘N6’ and ‘N7’ fishery symbols consist of tidal waters south of the intersection of longitude 142º09’ east with the mainland shore that are between the 25 n mile line and the mainland shore or the shore of an island and adjoining waterways.
There are 1719 ‘N6’ fishery symbols that have been issued for all of Queensland waters with 92 of the 93 ‘N3’ fishery symbol holders and the five ‘N9’ fishery symbol holders also holding an ‘N6’ symbol. Seven ‘N7’ fishery symbols have been issued for use in Queensland waters.
Line Fisheries
The Queensland Fisheries Joint Authority line fishery is managed under Queensland law by way of the ‘L4’ and ‘L5’ Fishery Symbols.
The L4 Fishery operates in tidal waters of the GOC and adjoining waterways between the shore and 25nm. The L5 Fishery operates within 3nm (currently the Fisheries Regulations 1995 specifies the area to be within 25nm but amendments will be implemented by the end of 2002).
Eighty-three primary licences and 113 tender licences are endorsed with an ‘L4’ Fishery Symbol and 22 primary licences and 42 tender licences are endorsed with an ‘L5’ Fishery Symbol. However, there is a significant level of excess capacity currently being addressed by the QFJA and QFS.
The primary species caught in the fishery are spanish mackerel, red emperor and grey mackerel and symbol holders may not land barramundi, threadfin salmon or queenfish.
Set Net Fisheries
The Gulf of Carpentaria Set Net Fishery (GOC Fishery) extends from Slade Point, Cape York, to the Northern Territory border. It is comprised of an inshore set net fishery that principally targets barramundi, and an offshore set mesh fishery, targeting shark and grey mackerel.
Inshore Fisheries (N3)
The Inshore Fisheries (in which fishers fish under an N3 fishery symbol) operate in tidal waters of the Gulf and joining waterways within 7 n miles of the mainland shore or the shore of an island. The area spans over 1000 kilometres of coastal foreshores enclosing around 25 major river systems and numerous creeks (see attached map).
The primary target species in the Inshore Fisheries are barramundi, grey mackerel, king and blue threadfin and shark (as by-product). A by-product in possession limit for shark is being considered.
Ninety-two fishery N3 symbols are endorsed on Queensland licences.
Closures include permanent river and creek closures for various rivers and adjoining waterways. There is an annual seasonal closure for the taking of barramundi determined by the lunar phases, usually lasting 3-4 months.
Other management arrangements include setting requirements for nets, fish size limits and gear restrictions. A Maximum length of 360 meters is allowed when fishing within creeks and rivers or 600 meters when fishing on foreshores. Mesh sizes can vary between 162.5mm and 245mm with a net drop of no more than 50 meshes.
Offshore Fisheries (N9)
The area for the Offshore Fisheries (in which fishers fish under an N9 fishery symbol) consist of tidal waters in the Gulf of Carpentaria south of the intersection of longitude 142º09’ east with the mainland shore that are between the 25n mile line and the 7 n mile line. This area does not include tidal waters that are within 7 n miles of an island (see attached map).
The primary target species taken under the N9 fishery symbol are shark and grey mackerel.
Shark is a QFJA species but managed under Queensland law. Access to the QFJA fisheries is by way of an endorsement either to the Northern Territory Shark Fishery Licence or a Queensland Licence. N9 fishery symbol holders are to participate in an independent observer program.
The Offshore Fisheries are limited by a maximum of 6000m net length available to operators combined.
Management arrangements in the shark fishery include attendance requirements, fish size limits, closed waters, gear restrictions, boat length restrictions and VMS requirements.
QFJA Fisheries (beyond 25nm)
Queensland Fisheries Joint Authority (QFJA) Fisheries operate under complex management arrangements set up under the Offshore Constitutional Settlement and resulting Memorandum of Understanding between Queensland and the Commonwealth.
Essentially, management responsibility for all northern demersal and pelagic finfish rests with the QFJA excluding the commercial harvest of:
(a) tuna and tuna like species, (b) barramundi, king salmon, blue salmon, jewfish, spotted grunter-
bream and queenfish, (c) fish taken whilst trawling for prawns in the Northern Prawn Fishery,
and(d) incidental catch of fishing operations for (a) and (c) above.
However, QFJA species are managed under Queensland law and a limited licensing regime exists for five endorsements to fish using set nets and four endorsements for the use of particular line apparatus within waters beyond 25 nm. QFJA net endorsement holders primarily target shark and grey mackerel.
Management arrangements in the QFJA fishery include attendance requirements, fish size limits, gear restrictions and boat length restrictions.
Developmental Finfish Trawl Fishery
In 1998 the QFMA set a quota to take finfish under a Developmental Finfish Trawl Fishery beyond 25 n miles. Fishing under the permits has been sporadic over the years and operators have consolidated their proportion of the quota to 750 tonne for one boat and 250 tonne for the second. The future of the Developmental Fishery is uncertain.
The primary target species is L. erythropterus (red snapper) while the other major target species [L. malabaricus (saddle tail snapper or ruby emperor)] appears to predominate on the western or NT side of the Gulf.
Arrangements presently in place for the management of finfish taken commercially in the GOC include a quota allocation, gear restrictions, fish size limits, and a range of monitoring approaches prescribed under a permit.
Monitoring of the developmental trawl fishery have involved an observer program and a requirement under permit to submit to Vessel Monitoring System monitoring.
Bycatch levels in this fishery have on a number of occasions either reached or exceeded the bycatch level of 50% of the landed catch by weight of red snappers. As stated in Condition 21 of the permit conditions, “the level of bycatch will be deemed to be significant if it
consistently exceeds 50% of the landed catch by weight of red snappers”. Bycatch levels are currently under review.
What is bycatch?
Bycatch, at its broadest level, may be regarded as all non-targeted catch including by-product, discards and other species interacting with fishing gear. However, for the purposes of this Action Plan, bycatch refers to that part of the catch that interacts with fishing gear and is discarded.
The Commonwealth Policy on Fisheries Bycatch June 2000 (Commonwealth Bycatch Policy) defines bycatch as:
i. that part of a fisher’s catch which is returned to the sea either because it has no commercial value or because regulations preclude it being retained, and
ii. that part of the ‘catch’ that does not reach the deck of the fishing vessel but is affected by interaction with the fishing gear.
The Commonwealth policy and this BAP does not include by-product under its definition of bycatch. By-product is considered to be the part of the catch that is kept or sold but is not primarily a target species. Target and by-product species are managed through fishery-specific Management Plans, Fishing Permit conditions and Offshore Constitutional Settlement arrangements.
Discarding of catch in GOC fisheries occurs for reasons including:
!" regulations – for example, protected species restrictions (Dolphins, Turtles etc), size restrictions, Offshore Constitutional Settlement arrangements (Commonwealth managed) and State regulations; and/or !" markets and market value of catch – for example, fish discarded because of low or zero market value (Milkfish, Queenfish, large sharks).
At this time it would be difficult to comment with any authority on the extent of Indigenous subsistence fishing bycatch except to say that species that can be used generally, are also used productively by Indigenous fishers. The Indigenous perspective on subsistence fishing could be stated as: “whatever is caught is generally eaten”.
Reasons for a Bycatch Plan
Bycatch is of concern for a number of reasons including:
!" Impact on protected or vulnerable species, including turtles, dugong, dolphins, sharks and crocodiles.!" Impact on the wider ecosystem (sustainability).
!" Sectorial access issues for certain fishery resources. !" Increasing emphasis in Commonwealth, State and Territory fisheries on addressing bycatch issues. !" Reduced fishing efficiency and greater operating costs from handling unwanted catch. !" Community concerns over declining fish stocks and the impacts of fishing on the marine ecosystem.
Aims and Approach
1. reduce impacts of fishing on populations of bycatch species and the marine environment by:
(a) minimising the interaction in all fisheries with protected and other bycatch species
(b) increasing the opportunity for survival of bycatch species (c) minimising the waste of marine species
2. improve social acceptability and community and fishers’ awareness and support for the activities taken to address bycatch in the GOC by increasing education and awareness of bycatch issues
3. Identify which actions each sector can take to achieve 1) and 2) above.
Achieving the Aims
The aims of this BAP will be pursued through a focus on those protected and other non-target marine species impacted upon by all Indigenous, recreational and commercial fisheries. The framework for achieving the aims is a precautionary approach to management, recognising the cultural, social and economic significance of the traditional, recreational and commercial fishing sectors in the region.
For the purposes of this Action Plan, a protected species is a species that has been recognised as requiring protection and has been listed under the Environment Protection and Biodiversity Conservation Act 1999 (Cth) (the EPBC Act) or the Nature Conservation Act 1992 (Qld). The BAP specifically addresses five groups of protected species that are likely to interact with fishing activities in GOC Indigenous, recreational and commercial fisheries: cetaceans, turtles, estuarine crocodiles, shark (including sawfish) and dugong. The focus of actions is to avoid or reduce the likelihood of encounters that may take or injure a protected species. Interim action should focus on enhancing the likelihood of survival of species that interact with fishing gear where there is insufficient information to identify specific mitigation measures.
Many species, while not protected by legislation, may currently or in the future be at risk from fishing activities and their harvest may have negative ecological impacts. The Action Plan addresses the aims in relation to
species other than protected species by adopting strategies for five specific bycatch issues. These issues are:
1) The taking or capture of regulated fish (undersize/oversize); 2) The taking or capture of fish with low or zero commercial value; 3) The taking or capture and only part processing of fish – shark
finning; and 4) Cryptic mortality (death after release); and 5) The taking or capture and mortality of Commonwealth managed
fish;
The precautionary approach to sustainable management of fisheries resources is the fundamental basis of the BAP. The precautionary principle requires that “where there are threats of serious or irreversible environmental damage, a lack of full scientific certainty should not be used as a reason for postponing measures to prevent environmental degradation. In the application of the precautionary principle, public and private decisions should be guided by:
(i) careful evaluation to avoid, wherever practicable, serious or irreversible damage to the environment; and
(ii) an assessment of the risk-weighted consequences of various options.” (The Intergovernmental Agreement on the Environment, May 1992).
Where scientific certainty is not possible, cautious reference points for the stocks, and trigger responses, are set. When the reference point is breached or another trigger event occurs, decision frameworks are already in place to implement the response agreed by different user groups and other stakeholders. This may involve for example seasonal or permanent closures or the initiation of further research.
Actions
The actions to be taken are grouped into the following three main categories:
1. collection of current available data on which to base management decisions for all fisheries
2. scientific assessment of the current available data3. preparation of a set of management responses (actions) to be
undertaken.
Data
Observer data
Indigenous, Recreational and Charter Fisheries
There are currently no observer programs for Indigenous, recreational and charter fisheries.
Mud Crab and Line Fisheries
There is currently no observer program specifically for the crab and line fisheries. While crab and line fishing in the GOC are not as extensive as netting operations, data on all of the commercial operations is essential for an accurate assessment on bycatch levels and composition in the GOC. Provided funding is available, the observer programs could be expanded to cover crab and line data.
Expanding the scope of the observer program to include line fisheries will be referred to the QFJA for consideration and would require the amendment of current QFJA permits and/or the inclusion of a fee under the Fisheries Regulations 1995.
Developmental FinfishTrawl Fishery
An observer program operates concurrently with the fishing operations in this developmental fishery. One deployment was successfully completed in November 1998. The cruise report is a confidential document containing sensitive yield and position information. The observer program was suspended from 1 January 1999 because of the low levels of operation in this fishery preventing viable fisheries assessments from being made on limited data. CSIRO and the QFJA program manager have confirmed that the reporting structure is effective for management and fishery assessment purposes.
Set net fisheries
To date, the majority of bycatch information in GOC commercial fisheries has been collected by two main methods: observer information and logbook information.
The observer program is a principal means for monitoring the incidental capture of protected and other non-target species to contribute to the maintenance of biodiversity and to avoid public criticism of industry fishing practices. Continuing the program and expanding it as much as possible to cover all aspects of the Set Net Fishery will aid in determining the numbers and condition of protected species returned and the total catch and size frequency distribution of other bycatch species in the GOC.

It is a condition of commercial licences operating from 7 to 25 nm (the Offshore Fishery) that the authority holder participates in a compulsory self-funded independent observer program. Data collected by the observers for management purposes include bycatch and discards rates, haul by haul geo-referencing (catch, effort and length frequency distribution) and biological data, for example spawning condition, fish size and disease or condition. While no observer program has operated outside the 25nm line, there is no reason to believe the issues would be significantly different from those within 7 to 25nm.
The observer program that operated in tidal waters of the GOC and joining waterways within 7nm of the mainland (the Inshore Fishery) was researched based and was voluntary. The voluntary nature of the Inshore Fishery observer program and the lack of opportunity to collect data from reel boat fishing in areas beyond the foreshore rendered the sampling regime opportunistic and unstructured.
An FRDC-funded CSIRO-led investigation into the sustainability of Northern Australian sharks and rays commenced activities on 1 July 2002 and will run for another three years. The project includes an observer component for gathering information on commercially harvested sharks in the GOC (target fishing as well as bycatch) in Queensland and Northern Territory waters.
Continuing the observer programs in the GOC commercial net fisheries expanding it to all other commercial fisheries and releasing a summary report of the results will clearly benefit all stakeholders by providing access to accurate information. It is suggested that the observer programs be mandatory if they are to maximise data collection.
Vessel Monitoring
Vessels fishing under an N9 fisheries symbol (operating from 7 to 25 nm) and vessels under developmental finfish trawl permits are required to have fitted a Vessel Monitoring System (VMS), which randomly monitors their position. Offshore fishers are required to notify the QFS before entering waters within the 7 nm line.
Action 1 – N3, N9, C1 a) Continue and expand the observer program in the Offshore Fishery
to monitor bycatch levels. Include NT/Commonwealth boats and vessels operating under a line fishery symbol in the GOC area in the observer program and VMS requirements.
b) Continue and expand the observer program in the Inshore Fishery to monitor bycatch levels. The program is to remain voluntary and include land-based operations and activities under a crab fishery symbol.Lead body: QFS, consulting with GOCCFA State of action: Partly implemented
Action 2 – N3, N9, C1 Publicly release an annual summary report (without containing site specific information) analysing results from the expanded observer program to raise awareness about bycatch in the fisheries.
Lead body: GulfMAC State of action: Ready to implement
Recreational data
Data on recreational catch in Queensland waters is derived primarily through recreational fishing surveys. Surveys have been conducted in 1997, 1999 and 2001 and comprise information submitted by recreational fishers by phone and through diary returns. Information has also been derived from the 2001 National Recreational and Indigenous Fishing Survey. Both forms of data will be treated as separate data sets because of different methodologies used and different areas of investigation.
Very little of the survey information specifically relates to recreational fishing in the Gulf region. Participation in the surveys is voluntary and data obtained on the basis of residence, not area fished. Some information is available from commercial fishing competition data required under permit.
As licences are not required for recreational fishing, processes, for example a voluntary recreational logbook, could be explored for exchanging information between the communities and fisheries managers. While the information may not be a reliable or complete source of information on recreational fishing, it may provide a trial for future systematic forms of reporting.
Charter logbook data
Charter operators are required under their permits to return logbook information containing the number of passengers and anglers, the total number of fish kept and fish discarded and the total weight of fish harvested.
Commercial Log book data
New logbooks for Set Net and Crab Fisheries were made available to fishers in April 2002 for the purpose of obtaining more accurate information on the catch of protected species. Fishers are now required to include information about the number and condition upon release of certain protected species. Not all protected species that may interact with nets in the Gulf Fishery are included in the species codes and fishers will need an information paper along with a more extensive list of species codes for a more accurate data record. A specific protected species logbook is currently under development to be used by all commercial fishers concurrently with specific logbooks for a particular fishery. The protected species logbook is currently proposed for 2003.
There is scope for recording in logbooks the catch of bycatch species other than those listed as protected. Information on the catch of shark species is sought from fishers, particularly in light of concerns about the sustainability of sharks characterised by low fecundity and high vulnerability to fishing effort. The QFS is developing a simple shark key so that fishers can a) provide better species identification for retained sharks and b) provide details of any interactions they have with protected/listed endangered shark species. The key will aid in obtaining accurate data and fulfilling Queensland’s responsibilities under the draft National Plan of Action for the Conservation and Management of Sharks (NPOA-Shark) developed for the Department of Agriculture, Fisheries and Forestry - Australia.1
The Electronic Catch and Effort Reporting Systems (ECERS) has been established to make the reporting of daily catch data more efficient. Fishers can only report using ECERS if they have a VMS installed and if reports are sent in by ECERS, fishers are not required to send in paper logs.
It is essential that bycatch data obtained through logbook programs be validated. To date, this information is considered to be incomplete, its accuracy has not been verified and it may be of limited use for scientific analysis.
Action 3 – Indigenous, Rec Improve data collection on Indigenous and recreational fishing for the GOC area, including interaction with protected species and descriptions of bycatch. This information is required for monitoring bycatch for a whole of fisheries assessment.
Lead body: QFS State of action: ongoing
Action 4 – N3, N9, L4/5, Charter Design supporting documentation on bycatch species for better identification and accuracy of reporting in logbooks or ECERS.
Lead body: GOCCFA to provide training, QFS consult with charter boat bodies to provide training, QFS role to design logbooks. State of Action: Aim to upgrade information annually.
Action 5 – N3, N9, L4/5, Charter Continually update waterproof shark identification cards of species known to be in the area and have regular consultations with fishers on species they want to add to the list to improve the accuracy of bycatch reporting. CSIRO has prepared a field guide to Sharks and Rays caught in Australian fisheries which was published in 2002. FRDC Shark project phase II field guides will be produced.
Lead body: QFS, GOCCFA State of action: ongoing
1 Available on the website: www.affa.gov.au
Notification processes for protected species
Notifying the catch of threatened or protected species is essential for obtaining more accurate data on bycatch composition, as well as data on the state of threatened and protected populations. There are no uniform procedures for notifying State and Commonwealth authorities about the catch of threatened or protected species. There are, however, often conflicting independent procedures to follow under the EPBC Act or the Nature Conservation Act, depending on where the species is caught and the list under which it is protected. Further, there are specific reporting requirements attached to licences with N9 fishery symbols. The Bycatch Action Plan Discussion Paper contains information on the various procedures and contact numbers.
Action 6 – all fisheries Develop a guide for fishers clearly outlining which jurisdiction applies to the catch of a particular species of conservation concern in a particular location for the accurate reporting of incidental interactions.
Lead body: Environment Australia State of Action: Aim to have first version by 31/12/03
The notification procedures must have a list of prescribed particulars that are detailed enough to gather information on the species and circumstances of the catch, but not to the extent that it reveals the location of favourite fishing localities.
Action 7 –all fisheries Government authorities will work with scientists and fishers to determine what information would be practical to obtain for gaining the best possible understanding of the state of protected species.
Lead body: QFS.State of action: Undertaking scoping study, first version by 31/12/03
Action 8 –all fisheries Ensure fishers are aware of their legal obligations under relevant legislation regarding reporting requirements for the interaction with protected species.
Lead bodies: Environment Australia and Environmental Protection AgencyState of action: locally implemented through Endangered Species Awareness Course but action is ongoing.
Research
Research projects are set on a priority basis. One group of species afforded a high priority research status due, among other things, to their vulnerability to fishing effort and low fecundity, are sharks. The draft NPOA-Sharks has identified the special management and conservation needs of sharks and calls upon States and Territories to, amongst other things, conduct a range of research and development programs on sharks.
Action 9 – rec, N9, N3Encourage greater participation of the Inshore and Offshore fishing fleet and recreational fishers in the Sawfish-tagging program (participation is currently at approximately 10% and is the only tagging program of its type in Australia) to improve understanding of cryptic mortality and movement.
Lead agency: GOCCFA, QFS/AFFS State of action: ongoing, periodic review
Action 10 – All fisheries Encourage and contribute to research and monitoring for sharks and rays, having regard to the NPOA-Sharks
Lead bodies: QFS and GOCCFA State of action: implemented, ongoing
Assessment
Data assessment
An assessment of the type and level of bycatch data should be carried out to produce a scientifically validated data set for bycatch suitable for quantification and assessment. Assessment could include considering the type of data being collected, the method of collection and its suitability as the basis for ongoing analysis of bycatch in the fisheries. The type of data collected could include information such as catch composition and distribution and a species’ condition upon release.
Action 11 – all fisheries Collect and assess bycatch data with the view to produce a scientifically validated data set for future risk or stock assessments.
Lead body: QFS State of action: ongoing
Data sharing between jurisdictions is a key element of NPOA-Sharks and Environment Australia Ecological Assessments for accreditation of GOC fisheries. The collection and reporting of data should be consistent across jurisdictions if risk assessments are to adequately assess straddling stocks.
Action 12 – all fisheries Establish processes for data collection and sharing between Queensland, the Northern Territory and the Commonwealth. When data become available, ensure that data from both jurisdictions are included in future risk or stock assessments given the likelihood of shared stocks.
Lead body: QFS, NT Fisheries, Commonweath State of action: by December 2004
Risk assessment
A review of existing risk assessment techniques is currently being conducted as a component of the Northern Australian Sharks and Rays: the Sustainability of Target and Bycatch Fisheries, Phase II. The NPOA-Sharks promotes the evaluation of methodology for risk assessment of sharks and rays with a view of adopting a single national risk assessment framework. Risk assessments are conducted on a priority basis.
Action 13 – All fisheries Encourage funding for risk assessment processes to be continued and expanded for species identified on threatened and protected lists as well as those not yet on the list but likely to be unable to sustain additional mortality from fishing (for example, Sawfish species).Identify actions to address impacts on those species determined to have a high and medium level of risk.
Lead bodies: QFS, GulfMAC and GOCCFA State of action: ongoing
Management Responses
Protected species
One of the objectives of the Fisheries (Gulf of Carpentaria Inshore Finfish) Management Plan 1999 (the Management Plan) is to “minimise the unintended adverse effects of fishing on protected wildlife”. The Management Plan aims to achieve this through:
(a) the requirement for attending certain types of net; (b) putting into effect closed water declarations in areas identified as being
important for a protected species; and (c) minimum and maximum mesh sizes for nets.
The appropriate forum for determining where there is an unacceptable level of interactions with protected and threatened wildlife is the GulfMAC. It is a review event for the achievement of the Management Plan objective if:
(a) the recorded incidental catch of protected wildlife significantly increases; or (b) compliance with the attendance requirements and closed water
declarations under the plan significantly declines; or (c) compliance with the requirements under the plan for minimum and
maximum mesh sizes for nets significantly declines.
Minimising interactions between fishing gear and species of conservation concern and other wildlife
There are a number of management measures that can be developed to minimise the risk of interactions with protected and other marine species. These can include introducing closed waters (for example to protect nesting turtles) and restrictions on the design and operation of nets, including mesh sizes, weighting and net soak times. GulfMAC is the most appropriate forum for discussing these issues. Any significant changes to legislation would require extensive stakeholder consultation.
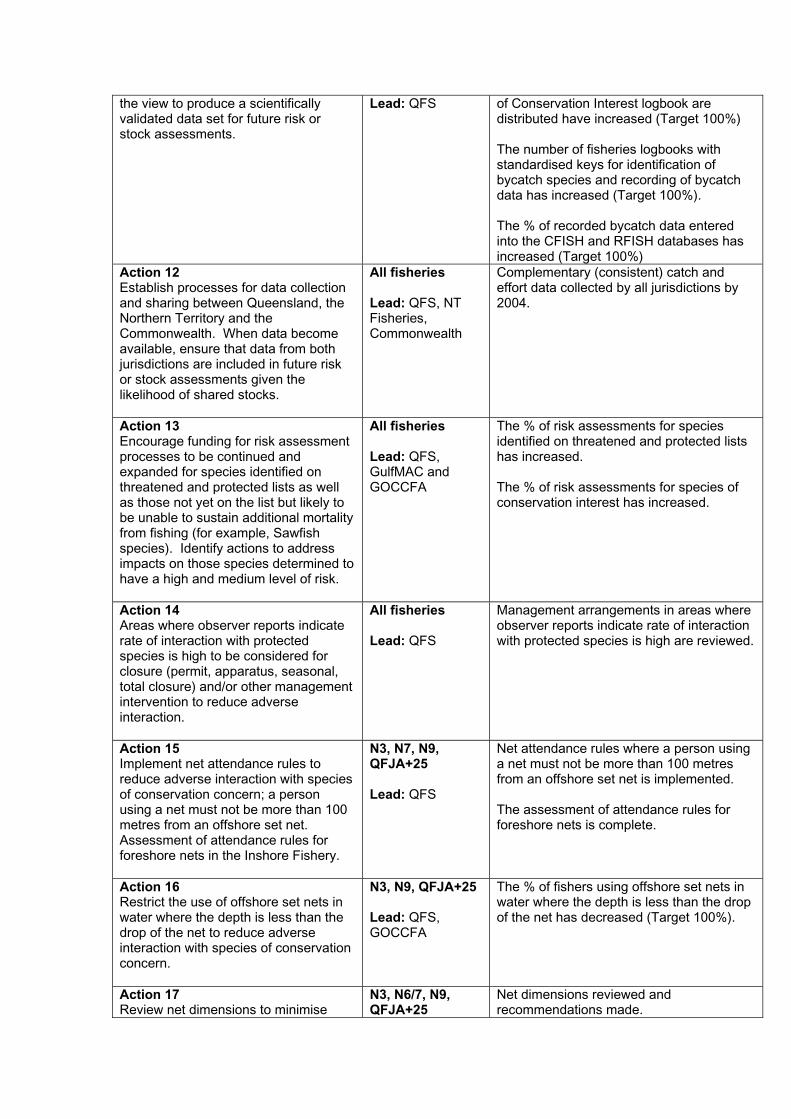
Action 14 – All fisheries Areas where observer reports indicate rate of interaction with protected species is high to be considered for closure (permit, apparatus, seasonal, total closure) and/or other management intervention to reduce adverse interaction.
Lead body: QFS State of action: Norman River closure implemented. Wellesley Islands Protection Area netting restrictions implemented.
Action 15 – N9, N3, N7, QFJA +25 Implement net attendance rules to reduce adverse interaction with species of conservation concern; a person using a net must not be more than 100 metres from an offshore set net. Assessment of attendance rules for foreshore nets in the Inshore Fishery.
Lead body: QFS State of action: implemented attendance rules, assessment of attendance rules completed.
Action 16 – N3, N9, QFJA +25Restrict the use of offshore set nets in water where the depth is less than the drop of the net to reduce adverse interaction with species of conservation concern.
Lead body: QFS, GOCCFA State of action: action implemented. Periodic review.
Action 17 – N3, N6/7, N9, QFJA +25 Review net dimensions to minimise interaction between fishers and species of conservation concern.
Lead body: QFS State of action: ongoing as part of the risk assessment process
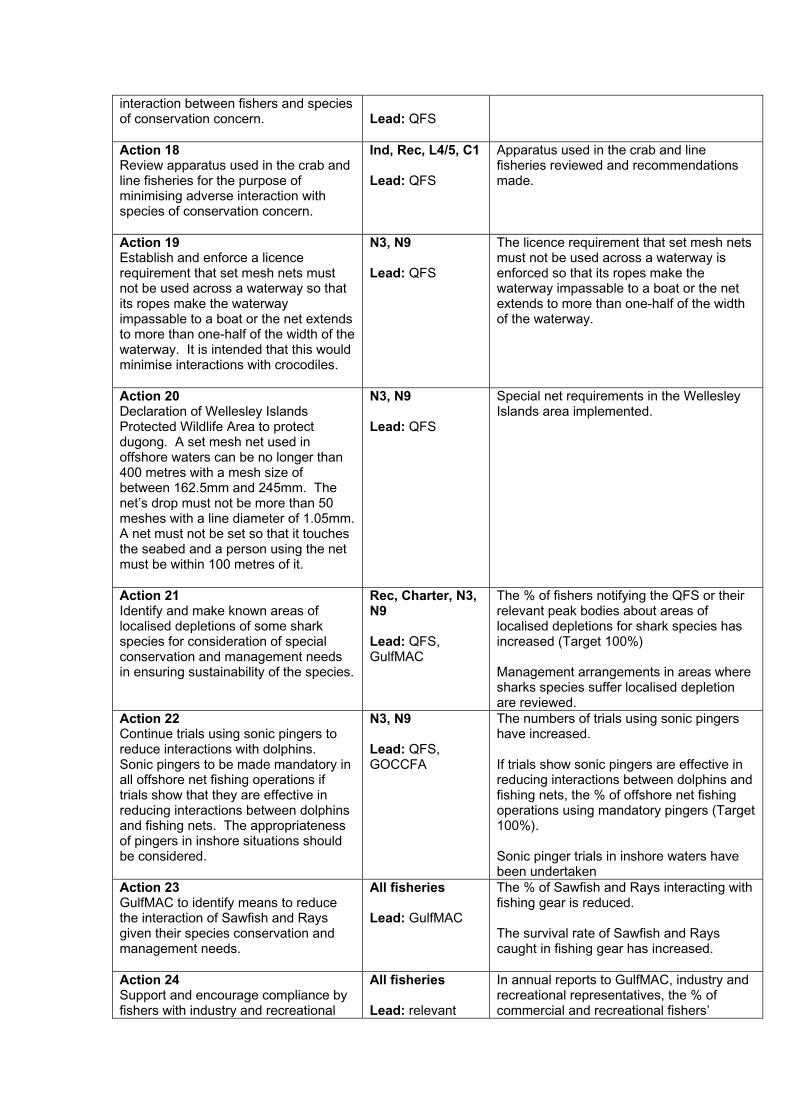
Action 18 - Indigenous, rec, C1, L4/5 Review apparatus used in the crab and line fisheries for the purpose of minimising adverse interaction with species of conservation concern.
Lead agency: QFS State of action: ongoing
Action 19 – N3, N9Establish and enforce a licence requirement that set mesh nets must not be used across a waterway so that its ropes make the waterway impassable to a boat or the net extends to more than one-half of the width of the waterway. It is intended that this would minimise interactions with crocodiles.
Lead body: QFS State of action: implemented
Action 20 – N3, N9Declaration of Wellesley Islands Protected Wildlife Area to protect dugong. A set mesh net used in offshore waters can be no longer than 400 metres with a mesh size of between 162.5mm and 245mm. The net’s drop must not be more than 50 meshes with a line diameter of 1.05mm. A net must not be set so that it touches the seabed and a person using the net must be within 100 metres of it.
Lead body: QFS State of action: implemented
Action 21 – Indigenous, Rec, Charter, N3, N9 Identify and make known areas of localised depletions of some shark species for consideration of special conservation and management needs in ensuring sustainability of the species.
Lead bodies: QFS, GulfMAC State of action: ongoing
Sonic pingers have been shown in overseas trials to reduce the interaction between fishing nets and dolphins. Research is currently under way in Queensland to determine the effectiveness of these devices under local conditions. A number of operators in the Net Fishery are participating in these trials and other fishers have expressed a desire to also be involved. If pingers are shown to be effective in reducing interactions between dolphins (or other protected species) and fishing nets they should be made mandatory in all offshore net fishing operations. This would be introduced through legislative amendment after extensive consultation.
Action 22 – N3, N9Continue trials using sonic pingers to reduce interactions with dolphins. Sonic pingers to be made mandatory in all offshore net fishing operations if trials show that they are effective in reducing interactions

between dolphins and fishing nets. The appropriateness of pingers in inshore situations should be considered.
Lead body: QFS, GOCCFA State of action: ongoing
The capture of benthic dwelling species may increase when nets are in contact with seafloor, or as a result of folds in the net. There may be a number of ways to reduce such bycatch, including prohibiting the use of offshore mesh nets in contact with the sea floor or prohibiting fishing operations where the depth of the water is less than the drop of the net. Research into the issue should be done by an experimental fishing exercise that investigates the effects of net drop reduction on bycatch and catch. The results of such experimental fishing will give a clearer indication of the most appropriate means to address the problem.
Action 23 – All fisheries GulfMAC to identify means to reduce the interaction of Sawfish and Rays given their species conservation and management needs.
Lead body: GulfMAC State of action: ongoing
As part of community-driven Environmental Management Plans, Codes of Practice are an important strategy for minimising interactions with threatened or protected species and take the issue beyond legislative requirements. The Gulf of Carpentaria Commercial Fishermen Code of Conduct created by Industry is currently in circulation and needs to be continuously updated as new legislative requirements, data and technologies impact on the bycatch of protected species. With the increasing organisation of recreational fishing clubs, recreational fishing communities in the GOC are encouraged to develop an agreed upon Codes of Practice guided by the National Recreational Code of Conduct endorsed by SUNFISH or some other Code.
Action 24 – all fisheries Support and encourage compliance by fishers with industry and recreational codes of practice to ensure the success of the Bycatch Action Plan. Industry and recreational representatives can advise GulfMAC annually of compliance.
Lead body: relevant stakeholder bodies State of action: GOCCFA will be reporting annually
Action 25 – all fisheries Distribute, or make available, copies of the Code of Conduct for the Resuscitation of Marine Turtles to all fishers to encourage industry to adopt best practices. Turtles are to be handled in accordance with the code.
Lead body: QFS State of action: Code to be amended to refer to other fisheries and distributed by July 2003.
Increasing the survival of protected species
An aim of the bycatch action plan is to increase the survival of protected species. All net fishers are to complete an Endangered Species Awareness Course and it is proposed that the course be compulsory for other forms of commercial fishing. The course aids in the identification, care and release of protected species. A code of conduct for resuscitation of marine turtles has been developed for the trawl fishery. Handling turtles in accordance with this code of conduct will ensure the survival of released turtles is maximised.
Action 26 – all commercial fisheries Encourage commercial fishers to complete an Endangered Species Awareness Course to improve their understanding of the special conservation and management needs of protected species.
Lead body: GOCCFA State of action: ongoing
Action 27 – all commercial fisheries Encourage fishers to continually update the Sawfish release procedures as part of their endorsement induction program under their Code of Conduct.
Lead agency: GOCCFA through keeping the document up to date State of action: ongoing
Action 28 – all fisheries Development of a Code of Practice on handling sharks, rays and sawfish for all fisheries to aim to reduce cryptic mortality.
Lead body: respective stakeholder bodies State of action: Implementation by October 2003.
Action 29 – all fisheries Support research into survivorship of sharks after release from set nets to assess more accurately the total impact of fishing on shark stocks.
Lead body: QFS State of action: ongoing
Precautionary management
Applying precautionary management to the bycatch of protected species would involve setting cautious limit reference points for species caught. The GulfMAC is the appropriate forum for setting these reference points as a trigger for action and agreement on the action response when the reference point is breached. Such responses may be seasonal closures where fishing activities impact on protected species and their habitat, and initiation of further research. Once the trigger has been activated, it will have to be demonstrated that a given catch is sustainable before fishers are permitted to take it.
Action 30– all fisheries Consolidate information collected from fishers with other information to set precautionary limit reference points for populations of protected species and to determine the realistic action that can be taken if the reference points are breached.
Lead body: QFS.State of action: ongoing through a working group set up under GulfMAC. Within 6 months of obtaining information about current status of protected species in Gulf, present a report to GulfMAC.
Other Bycatch Species
The Action Plan addresses the aims in relation to species other than protected species by adopting strategies for five specific bycatch issues. These issues are:
1) The capture of regulated fish (undersize/oversize); 2) The capture of fish with low or zero commercial value; 3) Shark finning; 4) Cryptic mortality (death after release); and 5) The capture and mortality of Commonwealth managed fish.
Undersize/Oversize
Maximum and minimum size limits are prescribed under regulation which may lead to the discard of oversized and undersized fish. A Code of Practice, for example for recreational and commercial fisheries, may also encourage the release of a particular sized fish in addition to prescribed sizes.
Restrictions on mesh size in nets theoretically achieve the same ends as size limits but prevent the fish being caught in the first place. The capture of undersize/oversize fish in the Gulf Offshore Set Net Fishery appears to be a minor reason for catches being discarded due to the selectivity of the mesh size. The nets are restricted to a mesh size between 162.5mm and 245mm. Observer reports indicate that very few Grey Mackerel, Fingermark and Spanish Mackerel caught in this Fishery are below their minimum size limit.
The problem of undersized and to a lesser extent, oversized fish, is more obvious in the Inshore Fishery. Fishers in the Gulf have suggested decreasing the current maximum legal mesh size of the nets to further reduce the taking of older, sexually mature species and this has been endorsed by the GulfMAC. GulfMAC is the most appropriate forum for discussing the issues surrounding any further proposed restrictions on the design and operation of nets.
Action 31 – N3, N9Review netting arrangements including mesh size and line strength, to minimise the capture of undersized and oversized fish.
Lead body: QFS State of action: For barramundi – October 2003, other species ongoing
Low or Zero Commercial Value
The results of the observer program have the potential to test some of the stronger claims that have been made about the operation of the Fishery. Results from the net observer program show that while some low value species are killed and not utilised, this does not occur at a rate that has often been claimed. Accurate information on bycatch is being collected through the observer program. One of the aims of the observer program is to provide basic information on the fishery to assist in determining sustainable fishing levels for both target and bycatch species. The Offshore observer program has only been running for around two years and the Inshore program over three years, and has already provided valuable information on total catches, species composition and size frequency distribution. Such information is fundamental to the development of any reliable stock assessment.
Action 32 – all commercial fisheries Support and encourage research and development of alternative markets for bycatch and encourage research into the sustainability of these bycatch species and their commercial viability.
Lead body: QFS State of action: ongoing
Shark Finning
In Queensland, it is an offence to have a fin on board a vessel without the corresponding trunk. Operators can divide the meat but only if it allows an inspector to easily count the number of sharks possessed by the person.
Requiring fins to have an accompanying carcass acts as a strong deterrent to finning because of the time needed to handle, process and store shark trunks and because of the impact of processing on target species. However, the requirement may encourage waste where sharks are dead upon landing as fishers are reluctant to keep the carcass as well as the fin. A process for better identification of shark species from the fins would need to be explored.
An alternative approach to reduce shark finning may be to impose a weight limit or quota per trip of fins. While this approach would encourage precautionary catch levels, such levels would not be on an individual species basis. Huge costs would be incurred for the gathering of

information for scientifically-based quotas for bycatch species and for monitoring landings of fins to ensure compliance. There is also a greater risk of high grading of sharks if this approach is adopted.
Action 33 – all fisheries Prohibit the ‘finning’ of sharks and rays in the GOC fisheries in contributing to the sustainability of sharks and rays.
Lead body: QFS State of action: implemented
Cryptic Mortality
Cryptic mortality is mortality not accounted for in quantifying harvest levels of fish stocks due to the death of the animal not being observed as part of the harvesting methodology. “Hidden” bycatch levels increase uncertainty in stock assessments and may also need to be addressed by industry in their efforts to reduce bycatch.
Unaccounted mortalities can arise for several reasons including:
!" where dead fish are discarded (but not recorded) to make space for more lucrative fish, also referred to as ‘high grading of fish’
!" where regulations such as size limits prohibit the taking of certain fish and discards are not recorded
!" where fish are returned to the sea but fail to survive because of the impact of being caught and released, also referred to as ‘post release’ mortality
!" where fish are killed by lost gear, also referred to as ghost fishing !" where fish are killed as a result of fish dropping out of gear prior to the
catch being brought on board, also referred to as ‘drop out’ mortality !" where fish are discarded without being recorded because of severe
damage by predators while fish are in the fishing gear, also referred to as ‘predation’ mortality
Action 34 – all fisheries Attach to licences a condition to participate in educational/training programs on measures to reduce various forms of cryptic mortality.
Lead body: QFS State of action: to be implemented 2004
Action 35 – N3, N6/7, N9 Identify source of discarded nets and investigate options for removal and prevention of net discards to minimise adverse interaction.
Lead body: QFS, Cape York Partnerships, Carpentaria Land Council, Northern Gulf Resource Management Group, GOCCFA. State of action: ongoing – WWF identification book.
Commonwealth Managed Fish
The results from the net observer program show that while some Commonwealth managed species are killed and not utilised, this does not occur at a high rate. The OCS arrangements were established to ensure the sustainable take of Commonwealth controlled species only by Commonwealth endorsed fishers. Bycatch provisions were made so reasonable catches could be taken of Commonwealth controlled fish by Queensland fishing boat licence holders. The structure of the OCS arrangements allows for bycatch limits to be modified over time in consultation with all parties. There is a concern that increasing the bycatch limits for Queensland licence holders to reduce the discard of Commonwealth controlled species could lead to target fishing of these species. However, if the observer reports indicate that legitimate bycatch levels exceed current limits (for example, Long Tail Tuna), then these limits should be reviewed.
Action 36 – all fisheries Work towards consistency of bycatch limits across the Queensland and Northern Territory sides of the Gulf where biologically appropriate.
Lead bodies: QFS and NT Fisheries State of action: ongoing
Further Review
The Offshore compulsory Observer Program has been running for a little over two years. Therefore, it is too soon to have any clear indication of the actual scale of interactions with protected wildlife. A review of the Fishery and the effectiveness of the program will be commenced by 31 July 2003 once more data has been collected. This will provide adequate time to assess the effectiveness of any changes to management arrangements adopted as a result of this Bycatch Action Plan.
Action 37 – all fisheries Ongoing resources committed to the development and continuation of Bycatch Action Plan under the direction of GulfMAC and to revise the Plan, precautionary reference points and in general, to keep up with new data and technologies.
Lead body: GulfMAC State of action: ongoing
Action 38 – all fisheries Review the implementation and effectiveness of the Bycatch Action Plan against performance indicators by 7 October 2004.
Lead body: GulfMACState of action: to be implemented 7 October 2004
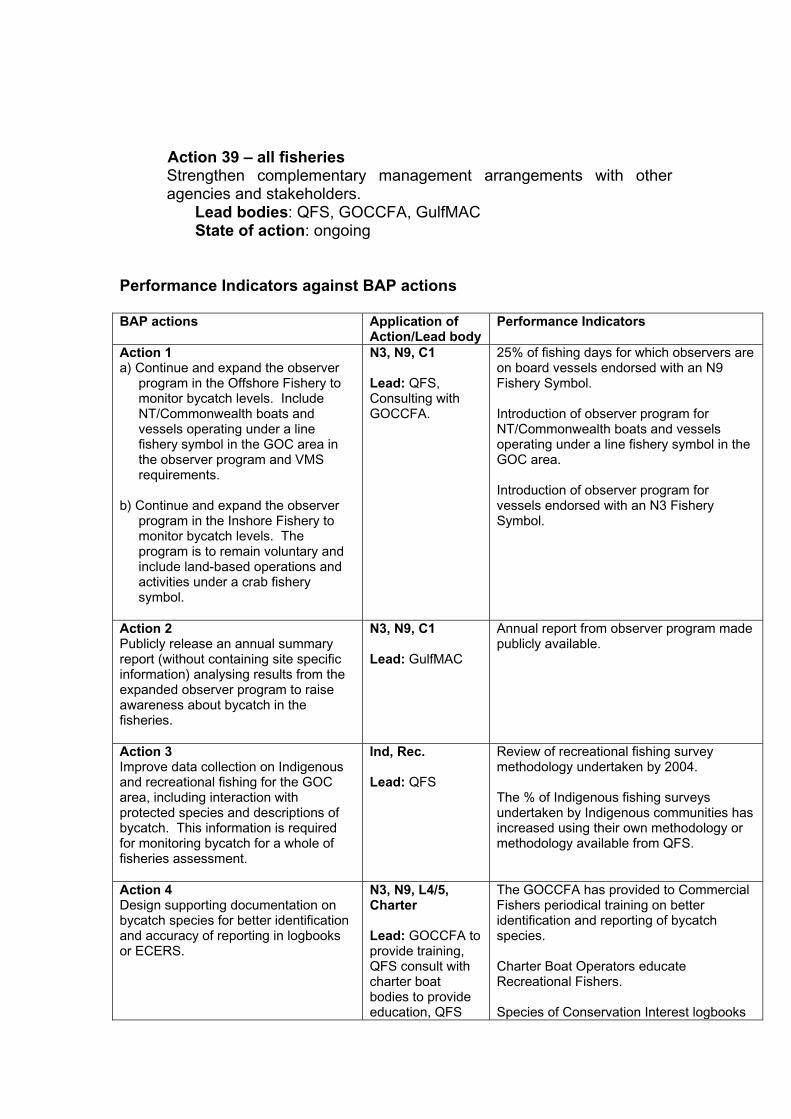
Action 39 – all fisheries Strengthen complementary management arrangements with other agencies and stakeholders.
Lead bodies: QFS, GOCCFA, GulfMAC State of action: ongoing
Performance Indicators against BAP actions
BAP actions Application of Action/Lead body
Performance Indicators
Action 1 a) Continue and expand the observer
program in the Offshore Fishery to monitor bycatch levels. Include NT/Commonwealth boats and vessels operating under a line fishery symbol in the GOC area in the observer program and VMS requirements.
b) Continue and expand the observer program in the Inshore Fishery to monitor bycatch levels. The program is to remain voluntary and include land-based operations and activities under a crab fishery symbol.
N3, N9, C1
Lead: QFS, Consulting with GOCCFA.
25% of fishing days for which observers are on board vessels endorsed with an N9 Fishery Symbol.
Introduction of observer program for NT/Commonwealth boats and vessels operating under a line fishery symbol in the GOC area.
Introduction of observer program for vessels endorsed with an N3 Fishery Symbol.
Action 2 Publicly release an annual summary report (without containing site specific information) analysing results from the expanded observer program to raise awareness about bycatch in the fisheries.
N3, N9, C1
Lead: GulfMAC
Annual report from observer program made publicly available.
Action 3 Improve data collection on Indigenous and recreational fishing for the GOC area, including interaction with protected species and descriptions of bycatch. This information is required for monitoring bycatch for a whole of fisheries assessment.
Ind, Rec.
Lead: QFS
Review of recreational fishing survey methodology undertaken by 2004.
The % of Indigenous fishing surveys undertaken by Indigenous communities has increased using their own methodology or methodology available from QFS.
Action 4 Design supporting documentation on bycatch species for better identification and accuracy of reporting in logbooks or ECERS.
N3, N9, L4/5, Charter
Lead: GOCCFA to provide training, QFS consult with charter boat bodies to provide education, QFS
The GOCCFA has provided to Commercial Fishers periodical training on better identification and reporting of bycatch species.
Charter Boat Operators educate Recreational Fishers.
Species of Conservation Interest logbooks
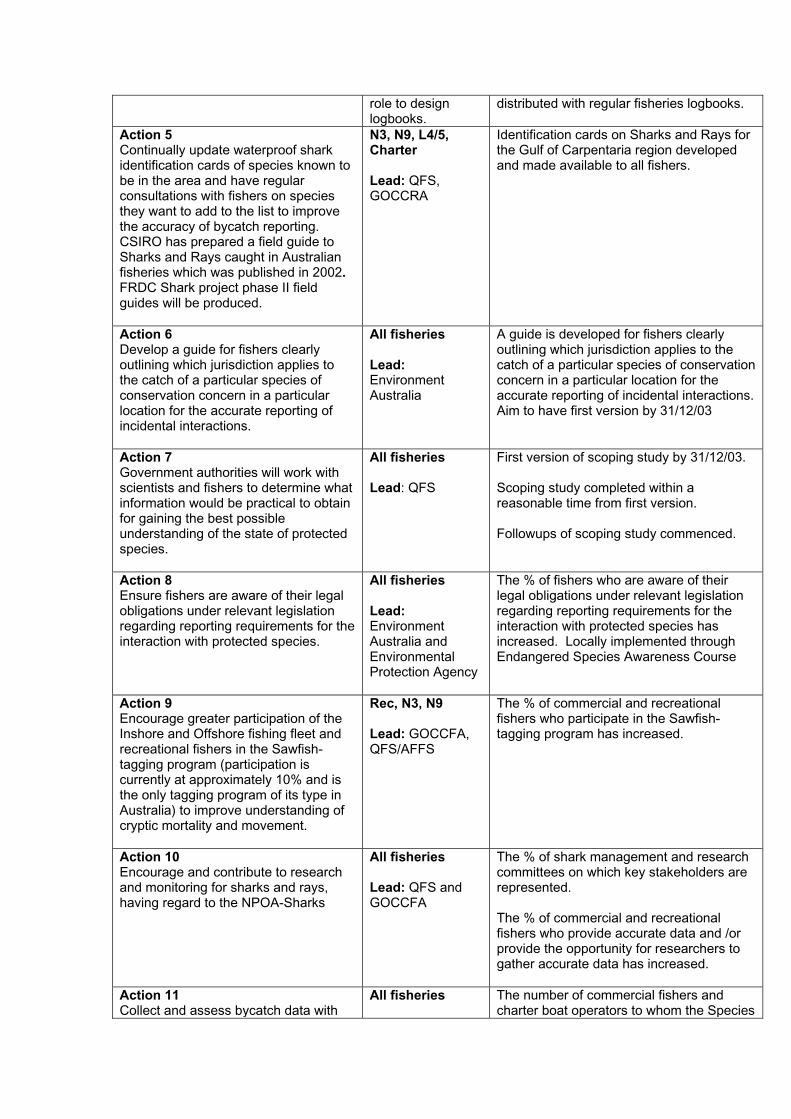
role to design logbooks.
distributed with regular fisheries logbooks.
Action 5 Continually update waterproof shark identification cards of species known to be in the area and have regular consultations with fishers on species they want to add to the list to improve the accuracy of bycatch reporting. CSIRO has prepared a field guide to Sharks and Rays caught in Australian fisheries which was published in 2002.FRDC Shark project phase II field guides will be produced.
N3, N9, L4/5, Charter
Lead: QFS, GOCCRA
Identification cards on Sharks and Rays for the Gulf of Carpentaria region developed and made available to all fishers.
Action 6 Develop a guide for fishers clearly outlining which jurisdiction applies to the catch of a particular species of conservation concern in a particular location for the accurate reporting of incidental interactions.
All fisheries
Lead:Environment Australia
A guide is developed for fishers clearly outlining which jurisdiction applies to the catch of a particular species of conservation concern in a particular location for the accurate reporting of incidental interactions. Aim to have first version by 31/12/03
Action 7 Government authorities will work with scientists and fishers to determine what information would be practical to obtain for gaining the best possible understanding of the state of protected species.
All fisheries
Lead: QFS
First version of scoping study by 31/12/03.
Scoping study completed within a reasonable time from first version.
Followups of scoping study commenced.
Action 8 Ensure fishers are aware of their legal obligations under relevant legislation regarding reporting requirements for the interaction with protected species.
All fisheries
Lead: Environment Australia and Environmental Protection Agency
The % of fishers who are aware of their legal obligations under relevant legislation regarding reporting requirements for the interaction with protected species has increased. Locally implemented through Endangered Species Awareness Course
Action 9 Encourage greater participation of the Inshore and Offshore fishing fleet and recreational fishers in the Sawfish-tagging program (participation is currently at approximately 10% and is the only tagging program of its type in Australia) to improve understanding of cryptic mortality and movement.
Rec, N3, N9
Lead: GOCCFA, QFS/AFFS
The % of commercial and recreational fishers who participate in the Sawfish-tagging program has increased.
Action 10 Encourage and contribute to research and monitoring for sharks and rays, having regard to the NPOA-Sharks
All fisheries
Lead: QFS and GOCCFA
The % of shark management and research committees on which key stakeholders are represented.
The % of commercial and recreational fishers who provide accurate data and /or provide the opportunity for researchers to gather accurate data has increased.
Action 11 Collect and assess bycatch data with
All fisheries The number of commercial fishers and charter boat operators to whom the Species
the view to produce a scientifically validated data set for future risk or stock assessments.
Lead: QFS of Conservation Interest logbook are distributed have increased (Target 100%)
The number of fisheries logbooks with standardised keys for identification of bycatch species and recording of bycatch data has increased (Target 100%).
The % of recorded bycatch data entered into the CFISH and RFISH databases has increased (Target 100%)
Action 12 Establish processes for data collection and sharing between Queensland, the Northern Territory and the Commonwealth. When data become available, ensure that data from both jurisdictions are included in future risk or stock assessments given the likelihood of shared stocks.
All fisheries
Lead: QFS, NT Fisheries, Commonwealth
Complementary (consistent) catch and effort data collected by all jurisdictions by 2004.
Action 13 Encourage funding for risk assessment processes to be continued and expanded for species identified on threatened and protected lists as well as those not yet on the list but likely to be unable to sustain additional mortality from fishing (for example, Sawfish species). Identify actions to address impacts on those species determined to have a high and medium level of risk.
All fisheries
Lead: QFS, GulfMAC and GOCCFA
The % of risk assessments for species identified on threatened and protected lists has increased.
The % of risk assessments for species of conservation interest has increased.
Action 14 Areas where observer reports indicate rate of interaction with protected species is high to be considered for closure (permit, apparatus, seasonal, total closure) and/or other management intervention to reduce adverse interaction.
All fisheries
Lead: QFS
Management arrangements in areas where observer reports indicate rate of interaction with protected species is high are reviewed.
Action 15 Implement net attendance rules to reduce adverse interaction with species of conservation concern; a person using a net must not be more than 100 metres from an offshore set net. Assessment of attendance rules for foreshore nets in the Inshore Fishery.
N3, N7, N9, QFJA+25
Lead: QFS
Net attendance rules where a person using a net must not be more than 100 metres from an offshore set net is implemented.
The assessment of attendance rules for foreshore nets is complete.
Action 16 Restrict the use of offshore set nets in water where the depth is less than the drop of the net to reduce adverse interaction with species of conservation concern.
N3, N9, QFJA+25
Lead: QFS, GOCCFA
The % of fishers using offshore set nets in water where the depth is less than the drop of the net has decreased (Target 100%).
Action 17 Review net dimensions to minimise
N3, N6/7, N9, QFJA+25
Net dimensions reviewed and recommendations made.
interaction between fishers and species of conservation concern. Lead: QFS
Action 18 Review apparatus used in the crab and line fisheries for the purpose of minimising adverse interaction with species of conservation concern.
Ind, Rec, L4/5, C1
Lead: QFS
Apparatus used in the crab and line fisheries reviewed and recommendations made.
Action 19 Establish and enforce a licence requirement that set mesh nets must not be used across a waterway so that its ropes make the waterway impassable to a boat or the net extends to more than one-half of the width of the waterway. It is intended that this would minimise interactions with crocodiles.
N3, N9
Lead: QFS
The licence requirement that set mesh nets must not be used across a waterway is enforced so that its ropes make the waterway impassable to a boat or the net extends to more than one-half of the width of the waterway.
Action 20 Declaration of Wellesley Islands Protected Wildlife Area to protect dugong. A set mesh net used in offshore waters can be no longer than 400 metres with a mesh size of between 162.5mm and 245mm. The net’s drop must not be more than 50 meshes with a line diameter of 1.05mm. A net must not be set so that it touches the seabed and a person using the net must be within 100 metres of it.
N3, N9
Lead: QFS
Special net requirements in the Wellesley Islands area implemented.
Action 21 Identify and make known areas of localised depletions of some shark species for consideration of special conservation and management needs in ensuring sustainability of the species.
Rec, Charter, N3, N9
Lead: QFS,GulfMAC
The % of fishers notifying the QFS or their relevant peak bodies about areas of localised depletions for shark species has increased (Target 100%)
Management arrangements in areas where sharks species suffer localised depletion are reviewed.
Action 22 Continue trials using sonic pingers to reduce interactions with dolphins. Sonic pingers to be made mandatory in all offshore net fishing operations if trials show that they are effective in reducing interactions between dolphins and fishing nets. The appropriateness of pingers in inshore situations should be considered.
N3, N9
Lead: QFS, GOCCFA
The numbers of trials using sonic pingers have increased.
If trials show sonic pingers are effective in reducing interactions between dolphins and fishing nets, the % of offshore net fishing operations using mandatory pingers (Target 100%).
Sonic pinger trials in inshore waters have been undertaken
Action 23 GulfMAC to identify means to reduce the interaction of Sawfish and Rays given their species conservation and management needs.
All fisheries
Lead: GulfMAC
The % of Sawfish and Rays interacting with fishing gear is reduced.
The survival rate of Sawfish and Rays caught in fishing gear has increased.
Action 24 Support and encourage compliance by fishers with industry and recreational
All fisheries
Lead: relevant
In annual reports to GulfMAC, industry and recreational representatives, the % of commercial and recreational fishers’

codes of practice to ensure the success of the Bycatch Action Plan. Industry and recreational representatives can advise GulfMAC annually of compliance.
stakeholder bodies compliance with their respective codes of practice has increased.
Action 25 Distribute, or make available, copies of the Code of Conduct for the Resuscitation of Marine Turtles to all fishers to encourage industry to adopt best practices. Turtles are to be handled in accordance with the code.
All fisheries
Lead: QFS
Code to be amended to refer to other fisheries and distributed by July 2003.
The % of fishers who have a copy of the Code of Conduct for the Resuscitation of Marine Turtles (Target 100%).
Action 26 Encourage commercial fishers to complete an Endangered Species Awareness Course to improve their understanding of the special conservation and management needs of protected species.
All commercial fisheries
Lead: GOCCFA
The % of commercial fishers who have completed an Endangered Species Awareness Course has increased.
Action 27 Encourage fishers to continually update the Sawfish release procedures as part of their endorsement induction program under their code of conduct.
All commercial fisheries
Lead: GOCCFA through keeping the document up to date
The % of fishers who have updated the Sawfish Release Procedures as part of their endorsement induction program under their code of conduct (Target 100%).
Action 28 Development of a Code of Practice on handling sharks, rays and sawfish for all fisheries to aim to reduce cryptic mortality.
All fisheries
Lead: respective stakeholder bodies
A Code of Practice on handling sharks (including sawfish) and rays has been developed for Indigenous, recreational and commercial fisheries. The Code is implemented by October 2003.
Action 29 Support research into survivorship of sharks after release from set nets to assess more accurately the total impact of fishing on shark stocks.
All fisheries
Lead: QFS
Letters of support provided for research proposals including shark survivorship.
Action 30 Consolidate information collected from fishers with other information to set precautionary limit reference points for populations of protected species and to determine the realistic action that can be taken if the reference points are breached.
All fisheries
Lead: QFS
Working group set up under GulfMAC.
Precautionary limit reference points are set for populations of protected species.
Appropriate responses are set for a breach of a precautionary limit reference point for populations of protected species.
Within 6 months of obtaining information about current status of protected species in Gulf, the working group presents a report to GulfMAC.
Action 31 Review netting arrangements including mesh size and line
N3, N9
Lead: QFS
The % of species for which netting arrangements are reviewed has increased.
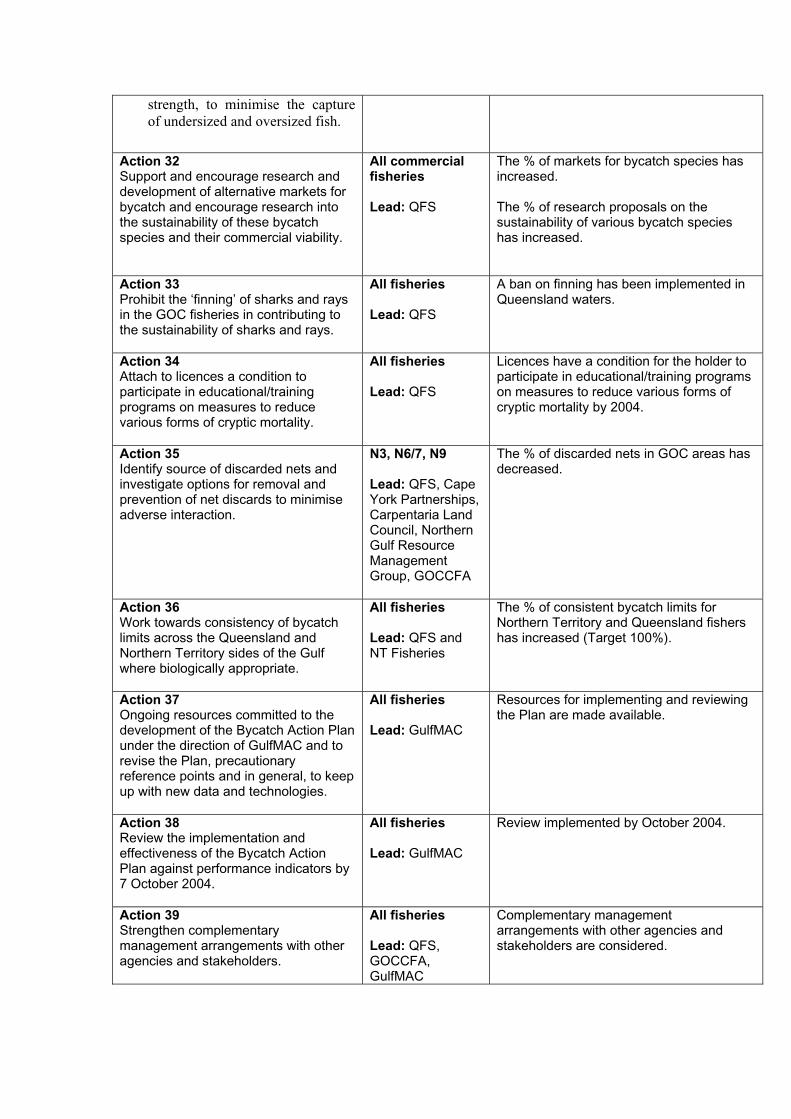
strength, to minimise the capture of undersized and oversized fish.
Action 32 Support and encourage research and development of alternative markets for bycatch and encourage research into the sustainability of these bycatch species and their commercial viability.
All commercial fisheries
Lead: QFS
The % of markets for bycatch species has increased.
The % of research proposals on the sustainability of various bycatch species has increased.
Action 33 Prohibit the ‘finning’ of sharks and rays in the GOC fisheries in contributing to the sustainability of sharks and rays.
All fisheries
Lead: QFS
A ban on finning has been implemented in Queensland waters.
Action 34 Attach to licences a condition to participate in educational/training programs on measures to reduce various forms of cryptic mortality.
All fisheries
Lead: QFS
Licences have a condition for the holder to participate in educational/training programs on measures to reduce various forms of cryptic mortality by 2004.
Action 35 Identify source of discarded nets and investigate options for removal and prevention of net discards to minimise adverse interaction.
N3, N6/7, N9
Lead: QFS, Cape York Partnerships, Carpentaria Land Council, Northern Gulf Resource Management Group, GOCCFA
The % of discarded nets in GOC areas has decreased.
Action 36 Work towards consistency of bycatch limits across the Queensland and Northern Territory sides of the Gulf where biologically appropriate.
All fisheries
Lead: QFS and NT Fisheries
The % of consistent bycatch limits for Northern Territory and Queensland fishers has increased (Target 100%).
Action 37 Ongoing resources committed to the development of the Bycatch Action Plan under the direction of GulfMAC and to revise the Plan, precautionary reference points and in general, to keep up with new data and technologies.
All fisheries
Lead: GulfMAC
Resources for implementing and reviewing the Plan are made available.
Action 38 Review the implementation and effectiveness of the Bycatch Action Plan against performance indicators by 7 October 2004.
All fisheries
Lead: GulfMAC
Review implemented by October 2004.
Action 39 Strengthen complementary management arrangements with other agencies and stakeholders.
All fisheries
Lead: QFS, GOCCFA,GulfMAC
Complementary management arrangements with other agencies and stakeholders are considered.
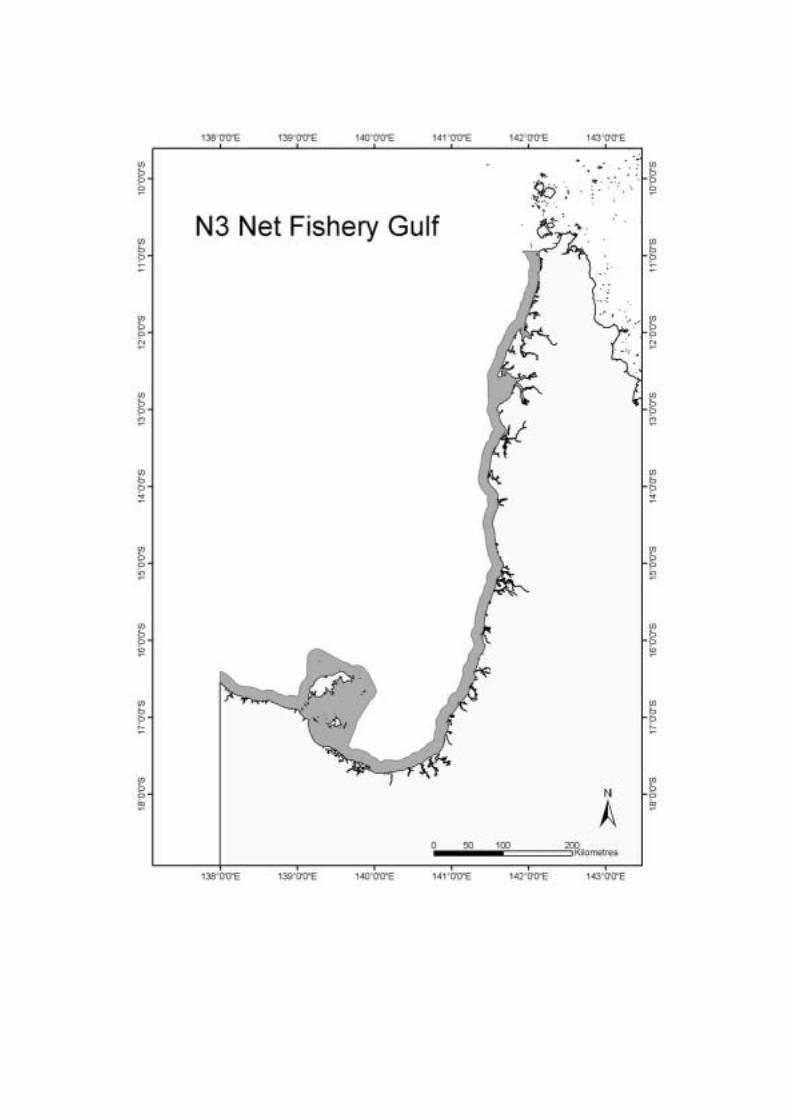
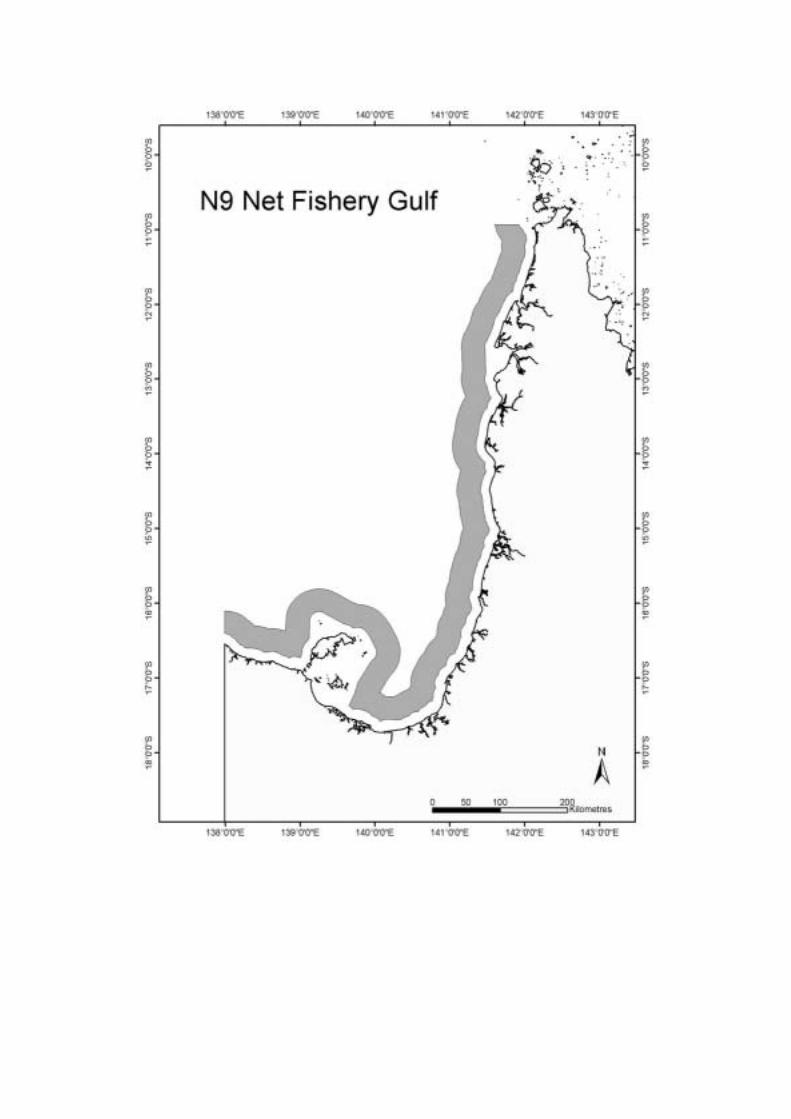
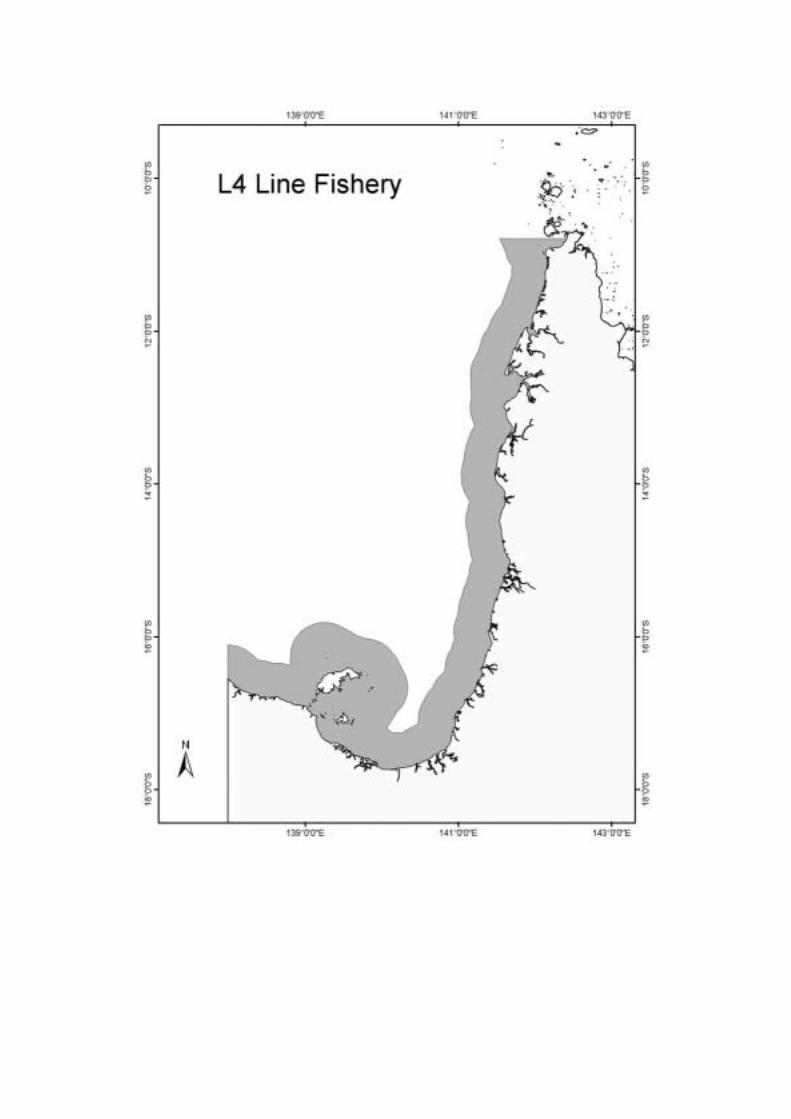
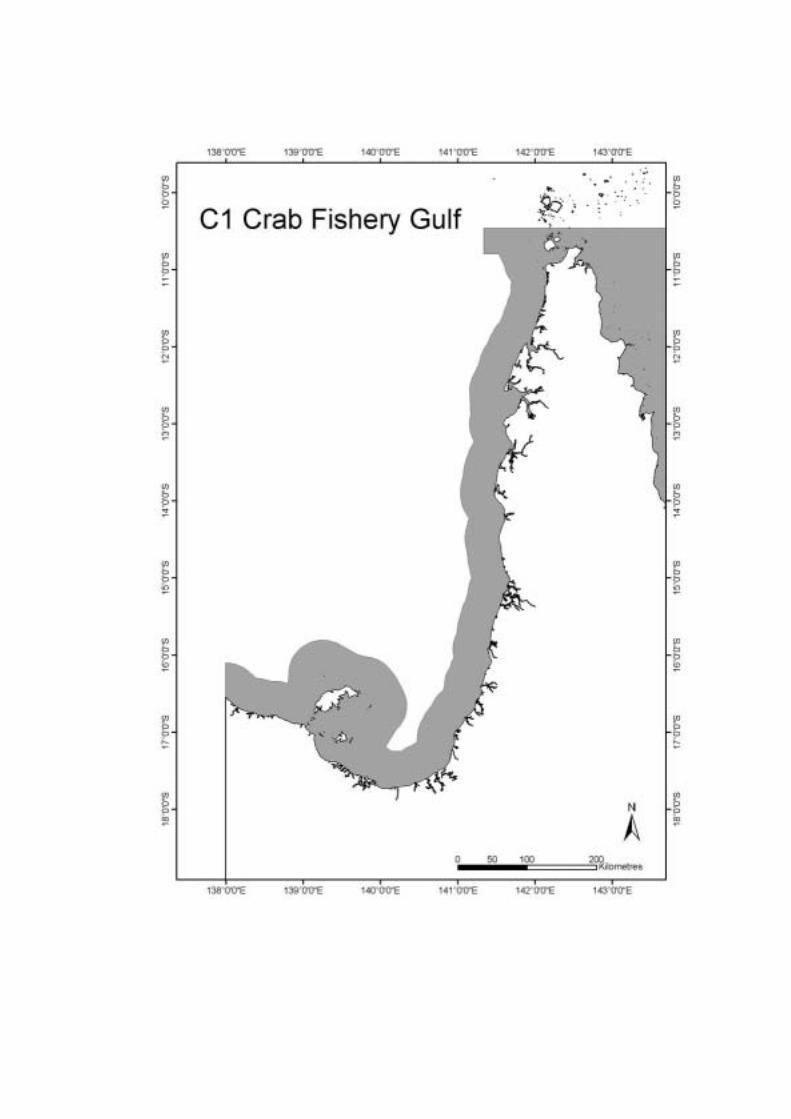

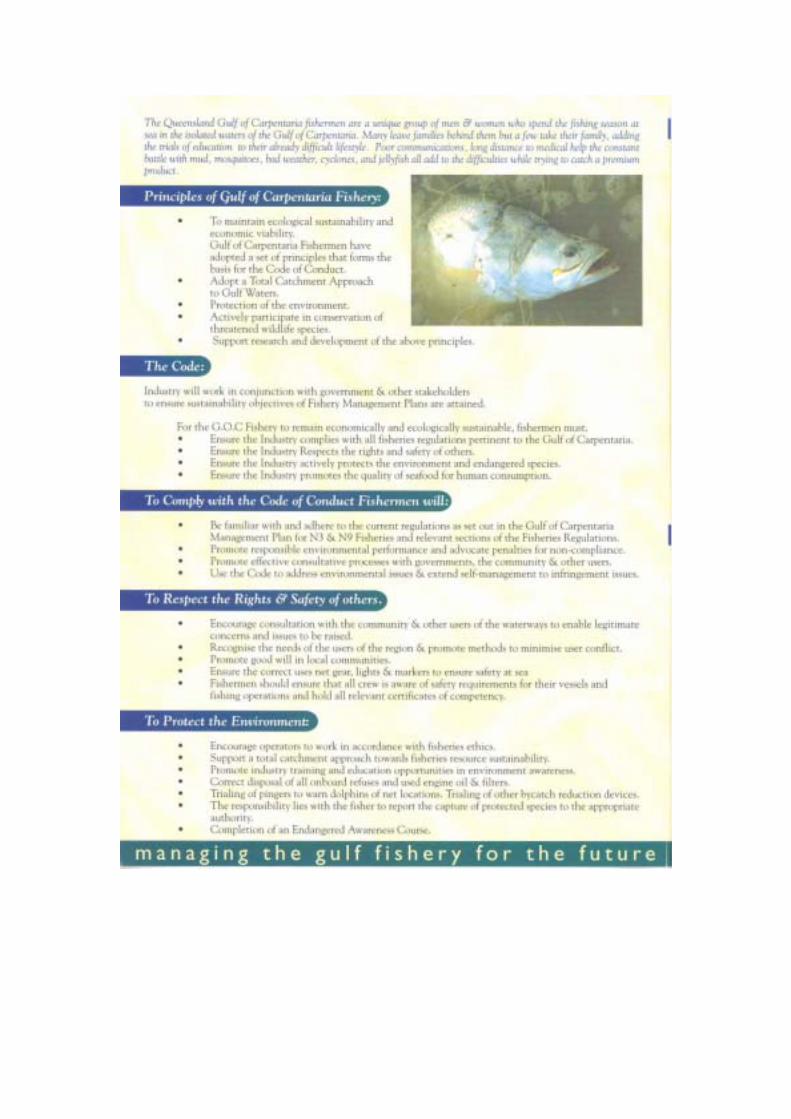
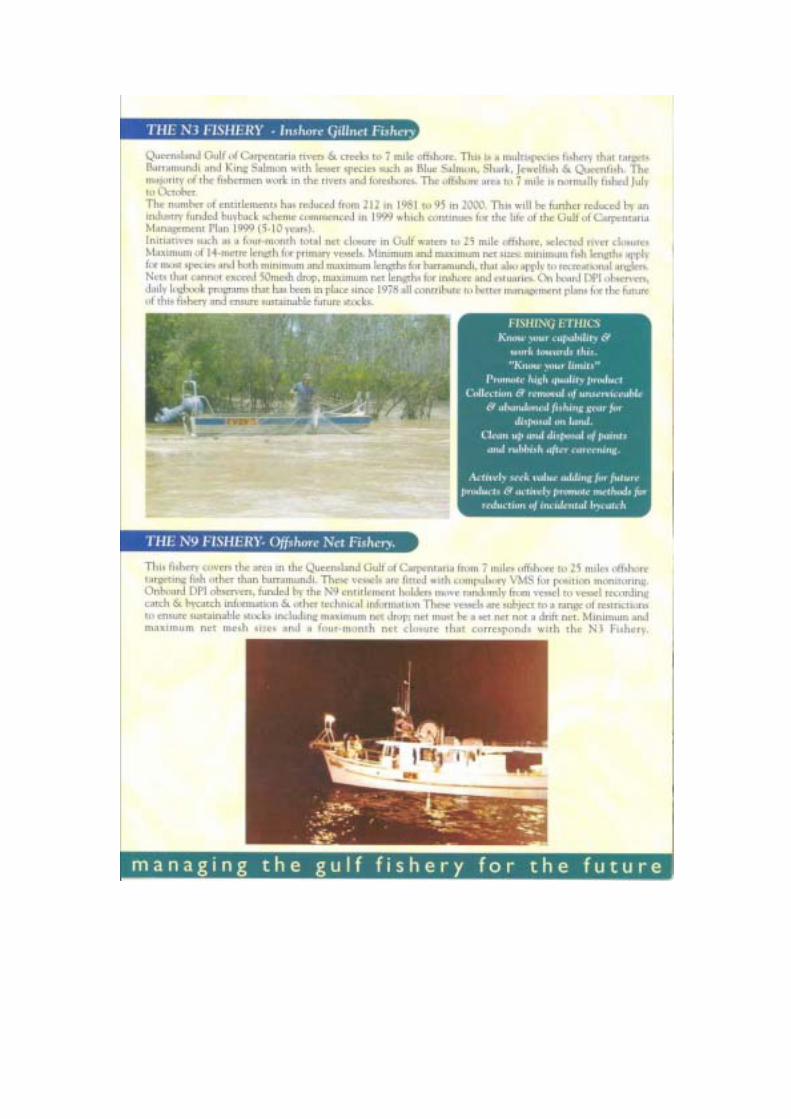
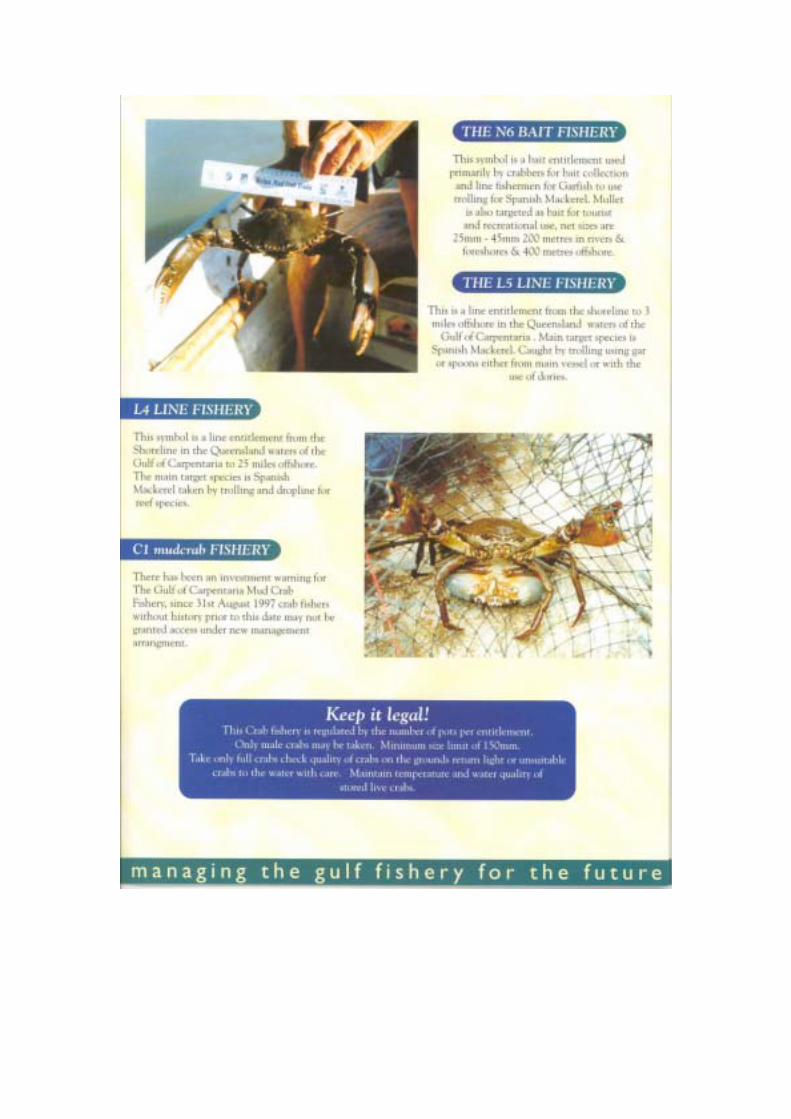
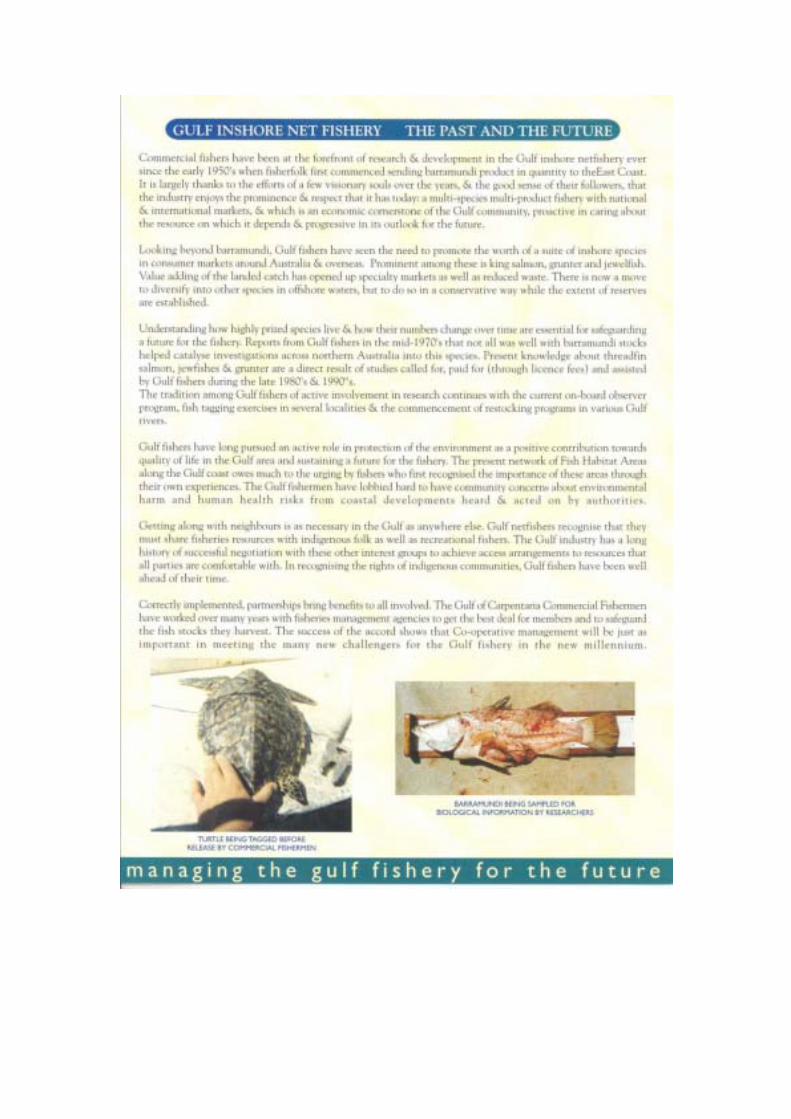

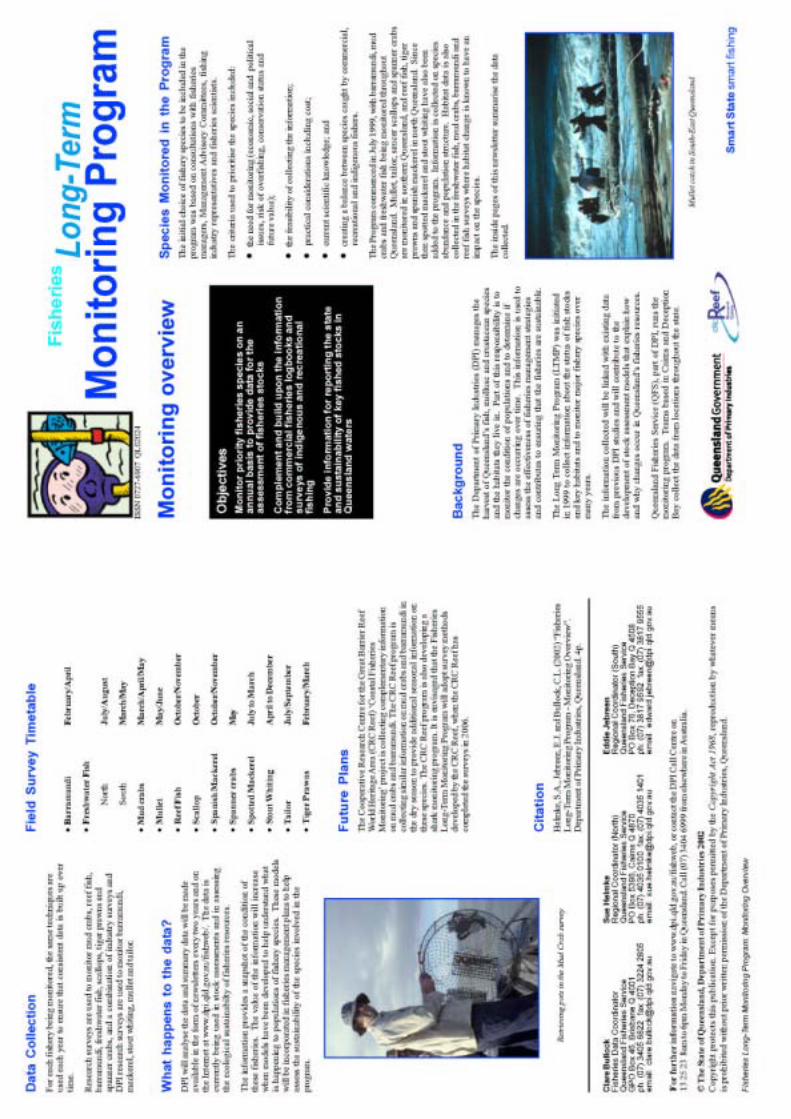
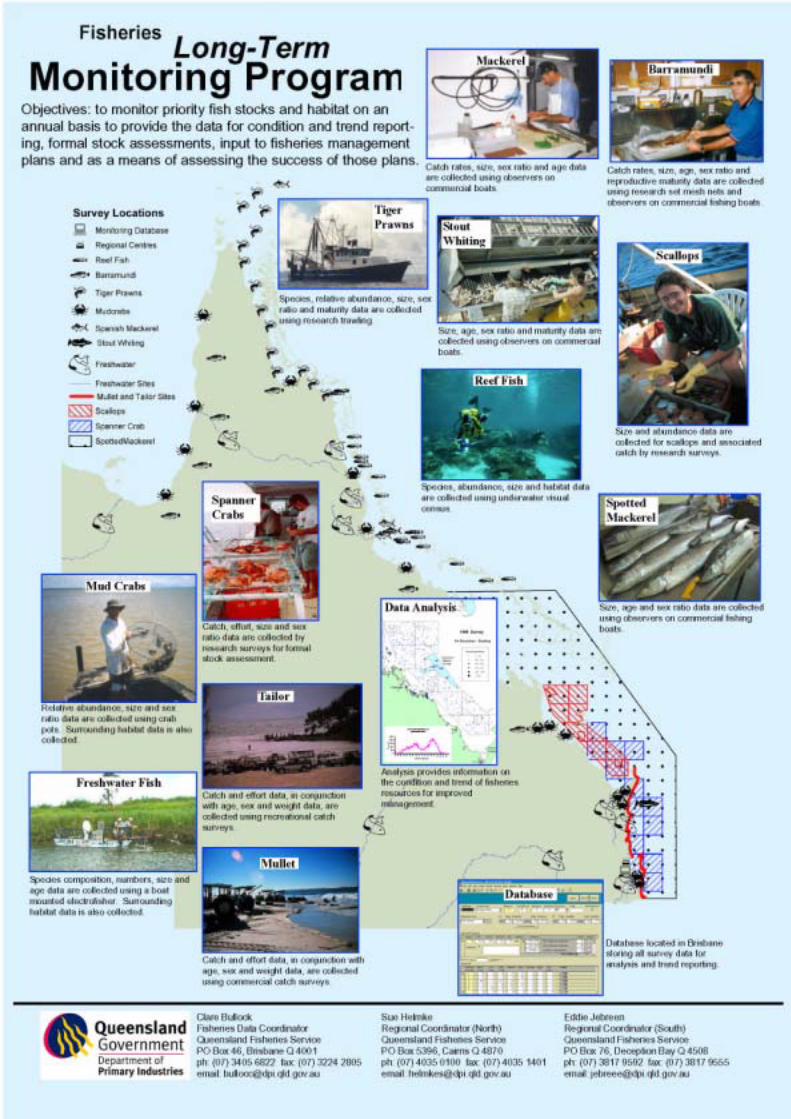
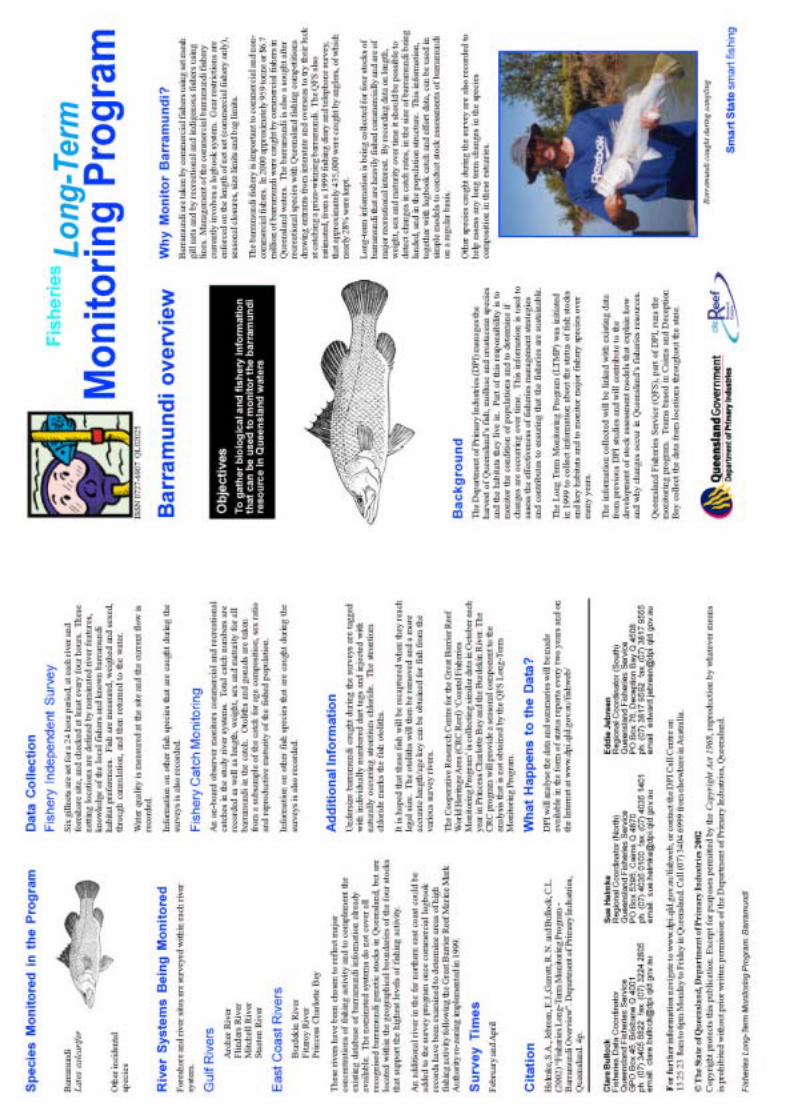
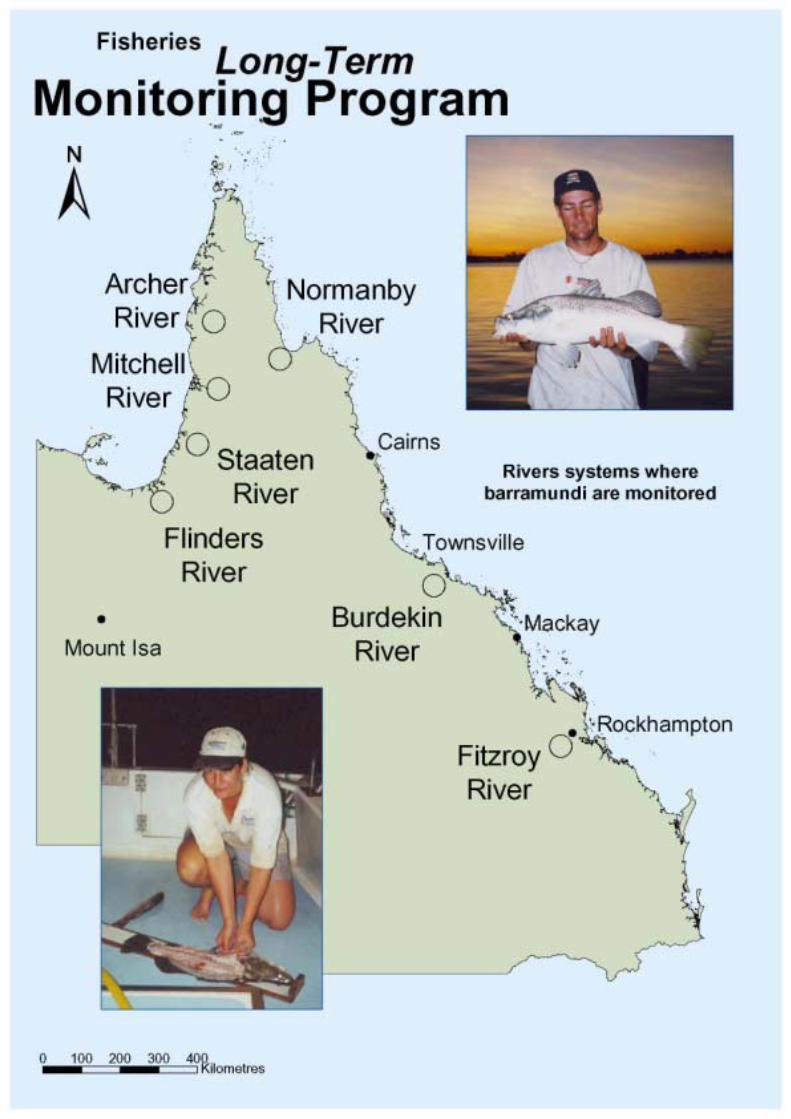
In fo rmat ion Se r i e s QI02012
Queensland’s
Current condition and recent trends 1988–2000
Department of Primary Industr iesBrisbane 2002
fisheries resources
Edited by
L.E. Williams
Please refer tothe IntroductionSection forguidance on howto interpretinformationpresented in thisSection of thereport
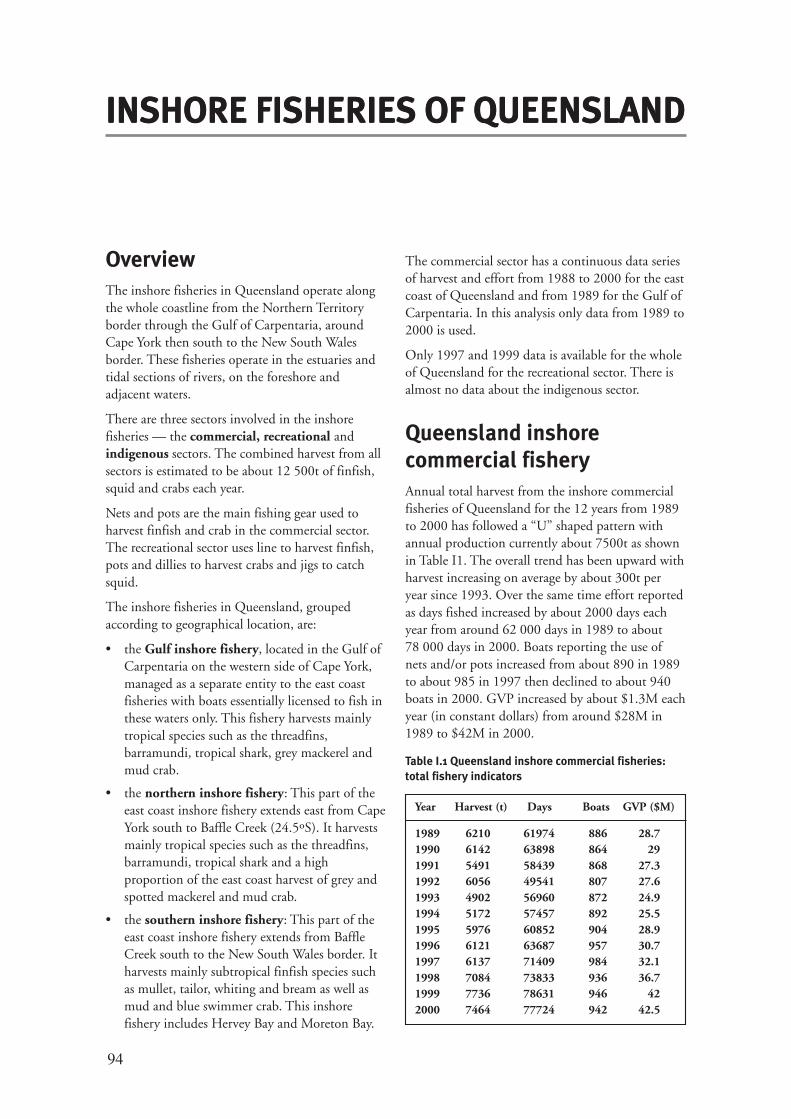
94
OverviewThe inshore fisheries in Queensland operate alongthe whole coastline from the Northern Territoryborder through the Gulf of Carpentaria, aroundCape York then south to the New South Walesborder. These fisheries operate in the estuaries andtidal sections of rivers, on the foreshore andadjacent waters.
There are three sectors involved in the inshorefisheries — the commercial, recreational andindigenous sectors. The combined harvest from allsectors is estimated to be about 12 500t of finfish,squid and crabs each year.
Nets and pots are the main fishing gear used toharvest finfish and crab in the commercial sector.The recreational sector uses line to harvest finfish,pots and dillies to harvest crabs and jigs to catchsquid.
The inshore fisheries in Queensland, groupedaccording to geographical location, are:
• the Gulf inshore fishery, located in the Gulf ofCarpentaria on the western side of Cape York,managed as a separate entity to the east coastfisheries with boats essentially licensed to fish inthese waters only. This fishery harvests mainlytropical species such as the threadfins,barramundi, tropical shark, grey mackerel andmud crab.
• the northern inshore fishery: This part of theeast coast inshore fishery extends east from CapeYork south to Baffle Creek (24.5ºS). It harvestsmainly tropical species such as the threadfins,barramundi, tropical shark and a highproportion of the east coast harvest of grey andspotted mackerel and mud crab.
• the southern inshore fishery: This part of theeast coast inshore fishery extends from BaffleCreek south to the New South Wales border. Itharvests mainly subtropical finfish species suchas mullet, tailor, whiting and bream as well asmud and blue swimmer crab. This inshorefishery includes Hervey Bay and Moreton Bay.
INSHORE FISHERIES OF QUEENSLANDINSHORE FISHERIES OF QUEENSLANDINSHORE FISHERIES OF QUEENSLANDINSHORE FISHERIES OF QUEENSLANDINSHORE FISHERIES OF QUEENSLAND
The commercial sector has a continuous data seriesof harvest and effort from 1988 to 2000 for the eastcoast of Queensland and from 1989 for the Gulf ofCarpentaria. In this analysis only data from 1989 to2000 is used.
Only 1997 and 1999 data is available for the wholeof Queensland for the recreational sector. There isalmost no data about the indigenous sector.
Queensland inshorecommercial fisheryAnnual total harvest from the inshore commercialfisheries of Queensland for the 12 years from 1989to 2000 has followed a “U” shaped pattern withannual production currently about 7500t as shownin Table I1. The overall trend has been upward withharvest increasing on average by about 300t peryear since 1993. Over the same time effort reportedas days fished increased by about 2000 days eachyear from around 62 000 days in 1989 to about78 000 days in 2000. Boats reporting the use ofnets and/or pots increased from about 890 in 1989to about 985 in 1997 then declined to about 940boats in 2000. GVP increased by about $1.3M eachyear (in constant dollars) from around $28M in1989 to $42M in 2000.
Table I.1 Queensland inshore commercial fisheries:total fishery indicators
Year Harvest (t) Days Boats GVP ($M)
1989 6210 61974 886 28.71990 6142 63898 864 291991 5491 58439 868 27.31992 6056 49541 807 27.61993 4902 56960 872 24.91994 5172 57457 892 25.51995 5976 60852 904 28.91996 6121 63687 957 30.71997 6137 71409 984 32.11998 7084 73833 936 36.71999 7736 78631 946 422000 7464 77724 942 42.5
95
The inshore fisheries are complex with about 9% ofthe fleet potting for crabs only, about 47% usingnet gear only and about 44% using both crab andnet gear. The trend is toward more specialisation inthe crab fishery while the number of boats that onlynet fish shows a small decline. The proportion ofboats using both net and crab gear increased slightlyover the last 12 years.
The relative importance of the net fishery to totalinshore fishery production declined from 1989 to2000. In 1989, net-caught product was about 90%of the total landings by weight, used about 70% ofthe effort as days fished and contributed about 80%of the GVP to the fishery. In 2000, the net fisherycontributed about 80% of the weight harvestedfrom the inshore fishery, used about 50% of theeffort and contributed about 70% of the GVP ofthe fishery.
From 1989 to 2000 the GVP of net harvestincreased by about $0.75M each year from about$22M in 1989 to about $29M in 2000. Thisresulted from a 400t increase in finfish harvest overthe period. From 1992 onwards fishing efforttypically increased by about 500 days per year to ahigh of 44 000 days in 1997 then declined to about40 000 days in 2000.
The relative importance of the pot fishery (whichharvests mud and blue swimmer crabs) to totalproduction from the inshore fisheries increasedfrom 1989 to 2000. In 1989 pot-caught productmade up around 10% of the total landing byweight, used about 30% of the effort andcontributed about 20% of the GVP to the fishery.
In 2000, the pot fishery contributed about 20% ofthe weight harvested from the inshore fishery, usedabout 50% of the effort and contributed about30% of the GVP of the fishery.
The pot fishery increased its GVP to about $13.8Min 2000, an increase of about $0.7M each year from1989. Harvest increased by about 800t over the12 years and fishing effort almost doubled to about44 000 days. The number of boats potting for crabsincreased by about 15% over the period 1989 to2000.
Table I.2 shows that the main species groupharvested by the inshore commercial fishery interms of tonnage is mullet. Mullets’ contribution tothe total harvest declined from almost half in 1989to about 20% of the total harvest by weight in2000. Harvest of species such as mud crab andshark had an almost threefold increase over thestudy period. In addition harvest of species such asgrey and spotted mackerel, blue swimmer crab andking threadfin almost doubled from 1989 to 2000.The harvest of the other species specified did notshow any significant change. Analyses later in thereport will describe changes in selected speciesharvests in more detail.
The distribution of net and pot harvests along theeast coast of Queensland is shown in Figure I.1.From 1998 to 2000 the Moreton Bay areadominated harvests along this coastline with about30% of the east coast landings from the inshorefisheries. Moreton Bay produced about 25% of theeast-coast net catch and about 5% of the inshorecrab catches over these three years.
Species name 1989 1990 1991 1992 1993 1994 1995 1996 1997 1998 1999 2000
Mullet* 2396 2262 1755 2486 1408 1703 2267 1934 1461 2025 2190 1487Barramundi 670 540 734 479 567 507 567 643 574 731 901 822Crab — mud 343 395 379 406 442 435 442 509 564 656 824 964Shark* 294 383 286 335 423 504 636 560 598 664 714 875Mackerel — grey 246 322 197 195 127 197 211 370 619 521 466 558Crab — blue swimmer 247 241 296 168 189 192 190 218 244 413 597 458Threadfin — king 272 366 420 337 321 230 231 261 236 301 371 319Whiting* 310 310 281 293 270 214 209 255 325 309 297 238Bream* 221 222 173 176 143 133 214 155 187 145 160 185Tailor 240 172 127 165 111 185 128 167 137 187 120 205Threadfin — blue 126 133 150 149 161 174 150 149 141 124 173 117Mackerel — spotted 20 41 27 81 129 67 121 132 208 118 153 406Gar* 92 66 75 89 79 47 65 101 99 118 104 104Rabbitfish 110 94 114 94 37 76 57 52 81 150 72 116Other 624 595 476 604 496 508 488 617 663 621 596 610
Total 6210 6142 5491 6056 4902 5172 5976 6121 6137 7084 7736 7464
Table I.2 Queensland inshore commercial fisheries: main species harvested (t)
* A number of species comprise the harvest
96
In the late 1980s and early 1990s the southerninshore fishery dominated Queensland. As shownin Figure I.2, this fishery dominated productionwith about 70% of the landings by weight, and wasresponsible for slightly more than half of the valueof the fishery. Effort in the southern inshore fisheryabsorbed about 40% of the total effort forQueensland. At the same time the northern inshorefishery produced about 20% of the harvest byweight, 25% of the total value of the fishery andrequired about 40% of the total effort. The Gulfinshore fishery produced slightly less than 15% ofthe total landing and about 20% of the value of thefishery using about 20% of the total fishing effort.
In 2000, the relative contributions of the threeinshore fisheries to total State inshore harvestchanged markedly compared to the late 1980s. Thecontribution to total harvest from the southerninshore fishery declined to about 47% of the totallandings, the northern inshore fishery shareincreased to about 28% and the Gulf inshorefishery share increased to almost 25% of the totalState inshore commercial landings. At the sametime the proportional contribution of the southerninshore fishery to the value (GVP) of the total
Figure I.1 Harvest (t) from the east coast inshorefisheries averaged for years 1998–2000 in half-degreelatitude bands
Figure I.2 Changes in the proportion of harvestbetween areas from 1989 to 2000
inshore fishery remained consistent at about 40%while the northern inshore fishery contributionincreased to about 30% and the Gulf inshorefisheries contributed almost the same value. Effortallocation in 2000 changed compared to the earlyyears with total effort in the fishery increasingoverall. Relative proportions only changed slightly.The relative proportion of boats in each fisheryremained relatively constant with about 11% of theState’s inshore fleet in the Gulf, and about 50% inthe northern fishery and 40% in the southernfishery.
Queensland inshorerecreational fisheryInshore recreational fishing is an important activityfor many people in Queensland. The dimension ofthis activity ranges from fishing as a sportingcompetition to fishing as a recreational componentof an occasion such as a holiday, through to theactivities of dedicated “meat hunting” fishers.
At this stage it is not possible to estimate theproportion of recreational fishers in Queenslandwho fish in the inshore fishery compared to the “offshore” or reef fishery. Overall, an estimated 660 000anglers aged 15 years or more fished at least onceduring 1997 and 1999 in Queensland.
The estimated recreational harvest is based on thenumbers of fish harvested by fish species groups(data from RFISH surveys) multiplied by theestimated average weight of those species whencaught. The information provides estimates only,and no conclusion about the trends in recreationalharvest should be drawn from these figures. Asfuture survey results are published it will be possibleto describe trends in recreational fish harvests.
0 10 20 30 40 50 60 70 80
Gulf
Northern
Southern
Percent State Inshore harvest
1989 2000
0 500 1000 1500 2000
Cape York
Orford Bay
Shelburne Bay
Temple Bay
Lloyd Bay
Cape Sidmouth
Roberts Point
PCB
Cape Bedford
Cooktown
Bloomfield
Cape Tribulation
Cairns
Babinda
Mission Beach
Cardwell
Ingham
Townsville
Burdekin
Bowen
Repulse Bay
Mackay
Notch Point
Shoalwater Bay
Byfield
Rockhampton
Gladstone
Seventeen-seventy
Bundaberg
Hervey Bay
Tin Can Bay
Noosa
Mooloolaba
Moreton Bay
Southport
Coolangatta
Harvest (t)
Net Pot
Harvest (t)Percent state inshore harvest
Cape YorkOxford Bay
Shelburne BayTemple Bay
Lloyd BayCape Sidmouth
Roberts PointPCB
Cape BedfordCooktownBloomfield
Cape TribulationCairns
BabindaMission Beach
CardwellIngham
TownsvilleBurdekin
BowenRepulse Bay
MackayNotch Point
Shoalwater BayByfield
RockhamptonGladstone
Seventeen-SeventyBundabergHervey Bay
Tin Can BayNoosa
MooloolabaMoreton Bay
SouthportCoolongatta
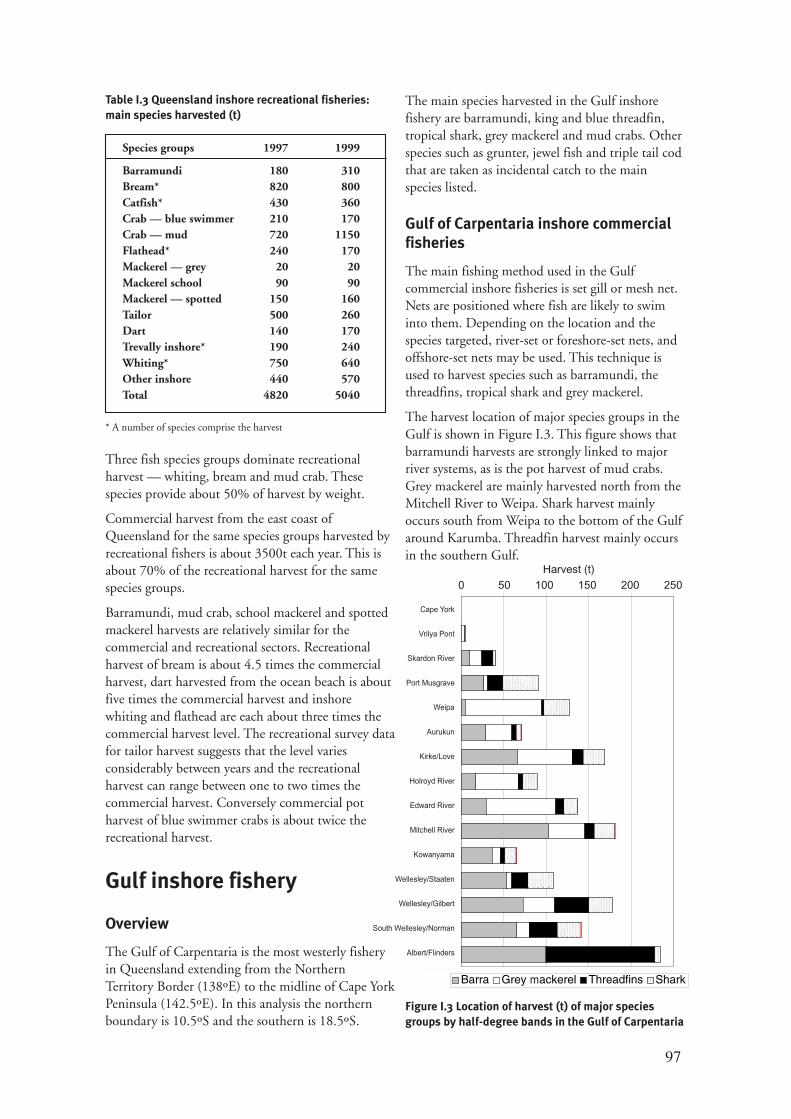
97
pe York
ya Point
on River
usgrave
Weipa
Aurukun
ke/Love
yd River
rd River
ell River
anyama
/Staaten
y/Gilbert
Norman
Flinders
Barra Grey Mackerel Threadfins Shark
Three fish species groups dominate recreationalharvest — whiting, bream and mud crab. Thesespecies provide about 50% of harvest by weight.
Commercial harvest from the east coast ofQueensland for the same species groups harvested byrecreational fishers is about 3500t each year. This isabout 70% of the recreational harvest for the samespecies groups.
Barramundi, mud crab, school mackerel and spottedmackerel harvests are relatively similar for thecommercial and recreational sectors. Recreationalharvest of bream is about 4.5 times the commercialharvest, dart harvested from the ocean beach is aboutfive times the commercial harvest and inshorewhiting and flathead are each about three times thecommercial harvest level. The recreational survey datafor tailor harvest suggests that the level variesconsiderably between years and the recreationalharvest can range between one to two times thecommercial harvest. Conversely commercial potharvest of blue swimmer crabs is about twice therecreational harvest.
Gulf inshore fishery
Overview
The Gulf of Carpentaria is the most westerly fisheryin Queensland extending from the NorthernTerritory Border (138ºE) to the midline of Cape YorkPeninsula (142.5ºE). In this analysis the northernboundary is 10.5ºS and the southern is 18.5ºS.
The main species harvested in the Gulf inshorefishery are barramundi, king and blue threadfin,tropical shark, grey mackerel and mud crabs. Otherspecies such as grunter, jewel fish and triple tail codthat are taken as incidental catch to the mainspecies listed.
Gulf of Carpentaria inshore commercialfisheries
The main fishing method used in the Gulfcommercial inshore fisheries is set gill or mesh net.Nets are positioned where fish are likely to swiminto them. Depending on the location and thespecies targeted, river-set or foreshore-set nets, andoffshore-set nets may be used. This technique isused to harvest species such as barramundi, thethreadfins, tropical shark and grey mackerel.
The harvest location of major species groups in theGulf is shown in Figure I.3. This figure shows thatbarramundi harvests are strongly linked to majorriver systems, as is the pot harvest of mud crabs.Grey mackerel are mainly harvested north from theMitchell River to Weipa. Shark harvest mainlyoccurs south from Weipa to the bottom of the Gulfaround Karumba. Threadfin harvest mainly occursin the southern Gulf.
Figure I.3 Location of harvest (t) of major speciesgroups by half-degree bands in the Gulf of Carpentaria
Table I.3 Queensland inshore recreational fisheries:main species harvested (t)
Species groups 1997 1999
Barramundi 180 310Bream* 820 800Catfish* 430 360Crab — blue swimmer 210 170Crab — mud 720 1150Flathead* 240 170Mackerel — grey 20 20Mackerel school 90 90Mackerel — spotted 150 160Tailor 500 260Dart 140 170Trevally inshore* 190 240Whiting* 750 640Other inshore 440 570Total 4820 5040
0 50 100 150 200 250Harvest (t)
* A number of species comprise the harvest
m
Cape York
Vrilya Pont
Skardon River
Port Musgrave
Weipa
Aurukun
Kirke/Love
Holroyd River
Edward River
Mitchell River
Kowanyama
Wellesley/Staaten
Wellesley/Gilbert
South Wellesley/Norman
Albert/Flinders
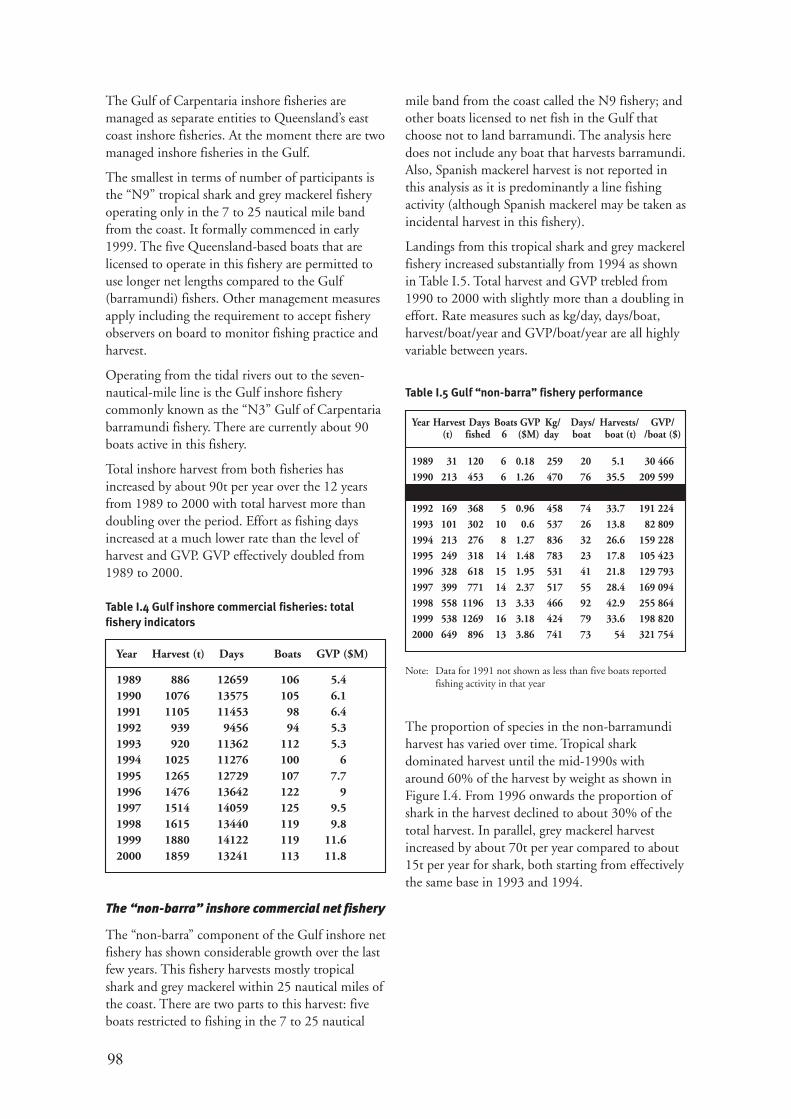
98
The Gulf of Carpentaria inshore fisheries aremanaged as separate entities to Queensland’s eastcoast inshore fisheries. At the moment there are twomanaged inshore fisheries in the Gulf.
The smallest in terms of number of participants isthe “N9” tropical shark and grey mackerel fisheryoperating only in the 7 to 25 nautical mile bandfrom the coast. It formally commenced in early1999. The five Queensland-based boats that arelicensed to operate in this fishery are permitted touse longer net lengths compared to the Gulf(barramundi) fishers. Other management measuresapply including the requirement to accept fisheryobservers on board to monitor fishing practice andharvest.
Operating from the tidal rivers out to the seven-nautical-mile line is the Gulf inshore fisherycommonly known as the “N3” Gulf of Carpentariabarramundi fishery. There are currently about 90boats active in this fishery.
Total inshore harvest from both fisheries hasincreased by about 90t per year over the 12 yearsfrom 1989 to 2000 with total harvest more thandoubling over the period. Effort as fishing daysincreased at a much lower rate than the level ofharvest and GVP. GVP effectively doubled from1989 to 2000.
Table I.4 Gulf inshore commercial fisheries: totalfishery indicators
The “non-barra” inshore commercial net fishery
The “non-barra” component of the Gulf inshore netfishery has shown considerable growth over the lastfew years. This fishery harvests mostly tropicalshark and grey mackerel within 25 nautical miles ofthe coast. There are two parts to this harvest: fiveboats restricted to fishing in the 7 to 25 nautical
mile band from the coast called the N9 fishery; andother boats licensed to net fish in the Gulf thatchoose not to land barramundi. The analysis heredoes not include any boat that harvests barramundi.Also, Spanish mackerel harvest is not reported inthis analysis as it is predominantly a line fishingactivity (although Spanish mackerel may be taken asincidental harvest in this fishery).
Landings from this tropical shark and grey mackerelfishery increased substantially from 1994 as shownin Table I.5. Total harvest and GVP trebled from1990 to 2000 with slightly more than a doubling ineffort. Rate measures such as kg/day, days/boat,harvest/boat/year and GVP/boat/year are all highlyvariable between years.
Table I.5 Gulf “non-barra” fishery performance
Year Harvest (t) Days Boats GVP ($M)
1989 886 12659 106 5.41990 1076 13575 105 6.11991 1105 11453 98 6.41992 939 9456 94 5.31993 920 11362 112 5.31994 1025 11276 100 61995 1265 12729 107 7.71996 1476 13642 122 91997 1514 14059 125 9.51998 1615 13440 119 9.81999 1880 14122 119 11.62000 1859 13241 113 11.8
The proportion of species in the non-barramundiharvest has varied over time. Tropical sharkdominated harvest until the mid-1990s witharound 60% of the harvest by weight as shown inFigure I.4. From 1996 onwards the proportion ofshark in the harvest declined to about 30% of thetotal harvest. In parallel, grey mackerel harvestincreased by about 70t per year compared to about15t per year for shark, both starting from effectivelythe same base in 1993 and 1994.
Year Harvest Days Boats GVP Kg/ Days/ Harvests/ GVP/(t) fished 6 ($M) day boat boat (t) /boat ($)
1989 31 120 6 0.18 259 20 5.1 30 466
1990 213 453 6 1.26 470 76 35.5 209 599
1991 131 202 2 0.78 650 101 65.6 389 409
1992 169 368 5 0.96 458 74 33.7 191 224
1993 101 302 10 0.6 537 26 13.8 82 809
1994 213 276 8 1.27 836 32 26.6 159 228
1995 249 318 14 1.48 783 23 17.8 105 423
1996 328 618 15 1.95 531 41 21.8 129 793
1997 399 771 14 2.37 517 55 28.4 169 094
1998 558 1196 13 3.33 466 92 42.9 255 864
1999 538 1269 16 3.18 424 79 33.6 198 820
2000 649 896 13 3.86 741 73 54 321 754
Note: Data for 1991 not shown as less than five boats reportedfishing activity in that year
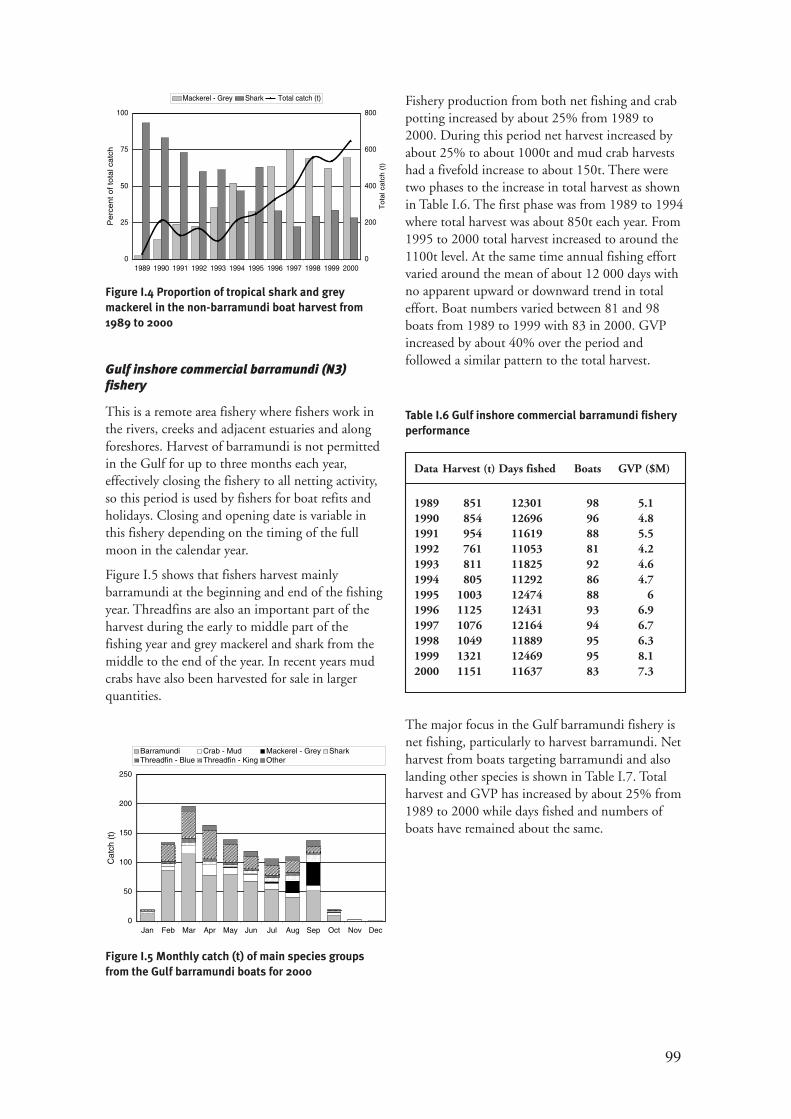
99
0
25
50
75
100
1989 1990 1991 1992 1993 1994 1995 1996 1997 1998 1999 2000
Pe
rce
nt
of
tota
l ca
tch
0
200
400
600
800
Tota
l catc
h (
t)
Mackerel - Grey Shark Total catch (t)
0
50
100
150
200
250
Jan Feb Mar Apr May Jun Jul Aug Sep Oct Nov Dec
Cat
ch (
t)
Barramundi Crab - Mud Mackerel - Grey SharkThreadfin - Blue Threadfin - King Other
Figure I.4 Proportion of tropical shark and greymackerel in the non-barramundi boat harvest from1989 to 2000
Gulf inshore commercial barramundi (N3)fishery
This is a remote area fishery where fishers work inthe rivers, creeks and adjacent estuaries and alongforeshores. Harvest of barramundi is not permittedin the Gulf for up to three months each year,effectively closing the fishery to all netting activity,so this period is used by fishers for boat refits andholidays. Closing and opening date is variable inthis fishery depending on the timing of the fullmoon in the calendar year.
Figure I.5 shows that fishers harvest mainlybarramundi at the beginning and end of the fishingyear. Threadfins are also an important part of theharvest during the early to middle part of thefishing year and grey mackerel and shark from themiddle to the end of the year. In recent years mudcrabs have also been harvested for sale in largerquantities.
Figure I.5 Monthly catch (t) of main species groupsfrom the Gulf barramundi boats for 2000
Fishery production from both net fishing and crabpotting increased by about 25% from 1989 to2000. During this period net harvest increased byabout 25% to about 1000t and mud crab harvestshad a fivefold increase to about 150t. There weretwo phases to the increase in total harvest as shownin Table I.6. The first phase was from 1989 to 1994where total harvest was about 850t each year. From1995 to 2000 total harvest increased to around the1100t level. At the same time annual fishing effortvaried around the mean of about 12 000 days withno apparent upward or downward trend in totaleffort. Boat numbers varied between 81 and 98boats from 1989 to 1999 with 83 in 2000. GVPincreased by about 40% over the period andfollowed a similar pattern to the total harvest.
Data Harvest (t) Days fished Boats GVP ($M)
1989 851 12301 98 5.11990 854 12696 96 4.81991 954 11619 88 5.51992 761 11053 81 4.21993 811 11825 92 4.61994 805 11292 86 4.71995 1003 12474 88 61996 1125 12431 93 6.91997 1076 12164 94 6.71998 1049 11889 95 6.31999 1321 12469 95 8.12000 1151 11637 83 7.3
The major focus in the Gulf barramundi fishery isnet fishing, particularly to harvest barramundi. Netharvest from boats targeting barramundi and alsolanding other species is shown in Table I.7. Totalharvest and GVP has increased by about 25% from1989 to 2000 while days fished and numbers ofboats have remained about the same.
Table I.6 Gulf inshore commercial barramundi fisheryperformance
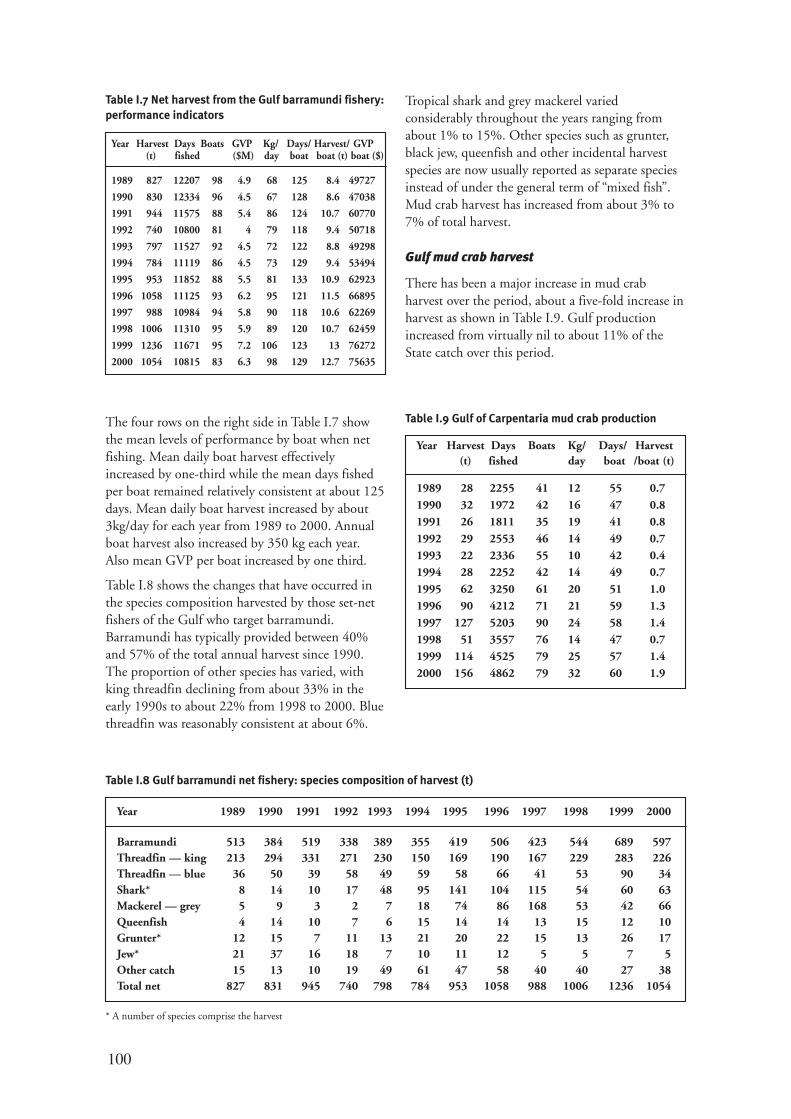
100
Table I.7 Net harvest from the Gulf barramundi fishery:performance indicators
Tropical shark and grey mackerel variedconsiderably throughout the years ranging fromabout 1% to 15%. Other species such as grunter,black jew, queenfish and other incidental harvestspecies are now usually reported as separate speciesinstead of under the general term of “mixed fish”.Mud crab harvest has increased from about 3% to7% of total harvest.
Gulf mud crab harvest
There has been a major increase in mud crabharvest over the period, about a five-fold increase inharvest as shown in Table I.9. Gulf productionincreased from virtually nil to about 11% of theState catch over this period.
The four rows on the right side in Table I.7 showthe mean levels of performance by boat when netfishing. Mean daily boat harvest effectivelyincreased by one-third while the mean days fishedper boat remained relatively consistent at about 125days. Mean daily boat harvest increased by about3kg/day for each year from 1989 to 2000. Annualboat harvest also increased by 350 kg each year.Also mean GVP per boat increased by one third.
Table I.8 shows the changes that have occurred inthe species composition harvested by those set-netfishers of the Gulf who target barramundi.Barramundi has typically provided between 40%and 57% of the total annual harvest since 1990.The proportion of other species has varied, withking threadfin declining from about 33% in theearly 1990s to about 22% from 1998 to 2000. Bluethreadfin was reasonably consistent at about 6%.
Year Harvest Days Boats GVP Kg/ Days/ Harvest/ GVP(t) fished ($M) day boat boat (t) boat ($)
1989 827 12207 98 4.9 68 125 8.4 49727
1990 830 12334 96 4.5 67 128 8.6 47038
1991 944 11575 88 5.4 86 124 10.7 60770
1992 740 10800 81 4 79 118 9.4 50718
1993 797 11527 92 4.5 72 122 8.8 49298
1994 784 11119 86 4.5 73 129 9.4 53494
1995 953 11852 88 5.5 81 133 10.9 62923
1996 1058 11125 93 6.2 95 121 11.5 66895
1997 988 10984 94 5.8 90 118 10.6 62269
1998 1006 11310 95 5.9 89 120 10.7 62459
1999 1236 11671 95 7.2 106 123 13 76272
2000 1054 10815 83 6.3 98 129 12.7 75635
* A number of species comprise the harvest
Table I.8 Gulf barramundi net fishery: species composition of harvest (t)
Year 1989 1990 1991 1992 1993 1994 1995 1996 1997 1998 1999 2000
Barramundi 513 384 519 338 389 355 419 506 423 544 689 597Threadfin — king 213 294 331 271 230 150 169 190 167 229 283 226Threadfin — blue 36 50 39 58 49 59 58 66 41 53 90 34Shark* 8 14 10 17 48 95 141 104 115 54 60 63Mackerel — grey 5 9 3 2 7 18 74 86 168 53 42 66Queenfish 4 14 10 7 6 15 14 14 13 15 12 10Grunter* 12 15 7 11 13 21 20 22 15 13 26 17Jew* 21 37 16 18 7 10 11 12 5 5 7 5Other catch 15 13 10 19 49 61 47 58 40 40 27 38Total net 827 831 945 740 798 784 953 1058 988 1006 1236 1054
Table I.9 Gulf of Carpentaria mud crab production
Year Harvest Days Boats Kg/ Days/ Harvest(t) fished day boat /boat (t)
1989 28 2255 41 12 55 0.71990 32 1972 42 16 47 0.81991 26 1811 35 19 41 0.81992 29 2553 46 14 49 0.71993 22 2336 55 10 42 0.41994 28 2252 42 14 49 0.71995 62 3250 61 20 51 1.01996 90 4212 71 21 59 1.31997 127 5203 90 24 58 1.41998 51 3557 76 14 47 0.71999 114 4525 79 25 57 1.42000 156 4862 79 32 60 1.9
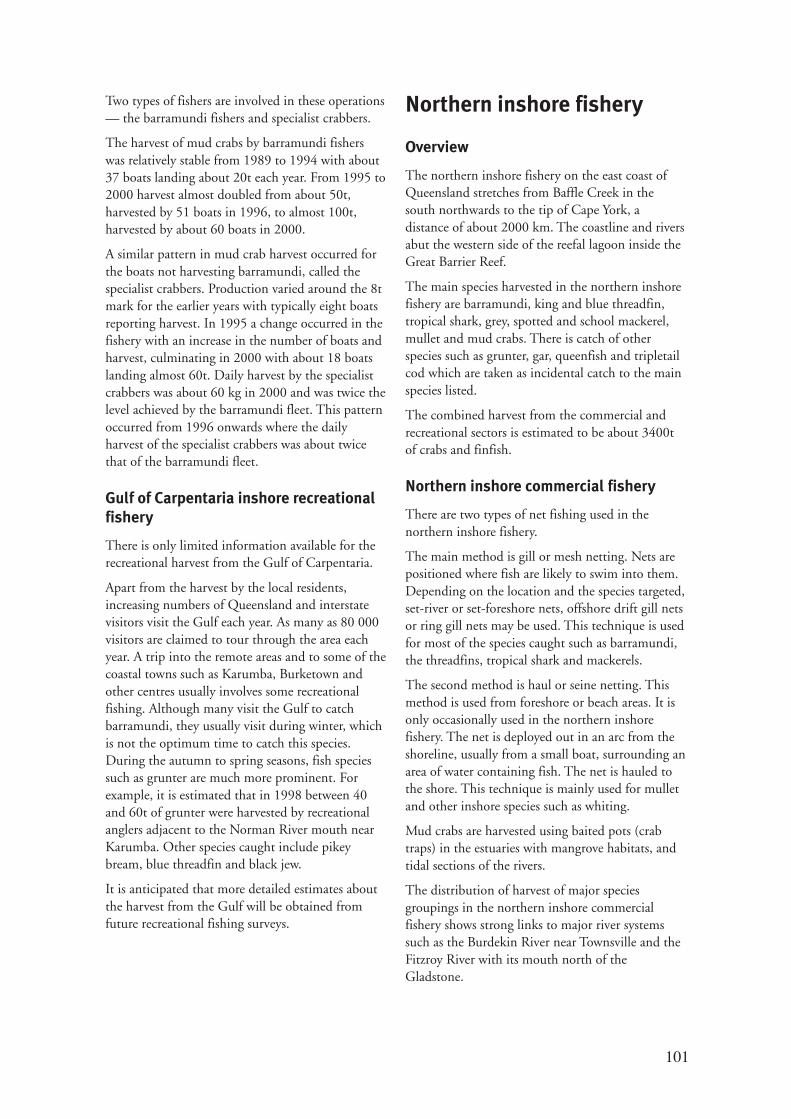
101
Two types of fishers are involved in these operations— the barramundi fishers and specialist crabbers.
The harvest of mud crabs by barramundi fisherswas relatively stable from 1989 to 1994 with about37 boats landing about 20t each year. From 1995 to2000 harvest almost doubled from about 50t,harvested by 51 boats in 1996, to almost 100t,harvested by about 60 boats in 2000.
A similar pattern in mud crab harvest occurred forthe boats not harvesting barramundi, called thespecialist crabbers. Production varied around the 8tmark for the earlier years with typically eight boatsreporting harvest. In 1995 a change occurred in thefishery with an increase in the number of boats andharvest, culminating in 2000 with about 18 boatslanding almost 60t. Daily harvest by the specialistcrabbers was about 60 kg in 2000 and was twice thelevel achieved by the barramundi fleet. This patternoccurred from 1996 onwards where the dailyharvest of the specialist crabbers was about twicethat of the barramundi fleet.
Gulf of Carpentaria inshore recreationalfishery
There is only limited information available for therecreational harvest from the Gulf of Carpentaria.
Apart from the harvest by the local residents,increasing numbers of Queensland and interstatevisitors visit the Gulf each year. As many as 80 000visitors are claimed to tour through the area eachyear. A trip into the remote areas and to some of thecoastal towns such as Karumba, Burketown andother centres usually involves some recreationalfishing. Although many visit the Gulf to catchbarramundi, they usually visit during winter, whichis not the optimum time to catch this species.During the autumn to spring seasons, fish speciessuch as grunter are much more prominent. Forexample, it is estimated that in 1998 between 40and 60t of grunter were harvested by recreationalanglers adjacent to the Norman River mouth nearKarumba. Other species caught include pikeybream, blue threadfin and black jew.
It is anticipated that more detailed estimates aboutthe harvest from the Gulf will be obtained fromfuture recreational fishing surveys.
Northern inshore fishery
Overview
The northern inshore fishery on the east coast ofQueensland stretches from Baffle Creek in thesouth northwards to the tip of Cape York, adistance of about 2000 km. The coastline and riversabut the western side of the reefal lagoon inside theGreat Barrier Reef.
The main species harvested in the northern inshorefishery are barramundi, king and blue threadfin,tropical shark, grey, spotted and school mackerel,mullet and mud crabs. There is catch of otherspecies such as grunter, gar, queenfish and tripletailcod which are taken as incidental catch to the mainspecies listed.
The combined harvest from the commercial andrecreational sectors is estimated to be about 3400tof crabs and finfish.
Northern inshore commercial fishery
There are two types of net fishing used in thenorthern inshore fishery.
The main method is gill or mesh netting. Nets arepositioned where fish are likely to swim into them.Depending on the location and the species targeted,set-river or set-foreshore nets, offshore drift gill netsor ring gill nets may be used. This technique is usedfor most of the species caught such as barramundi,the threadfins, tropical shark and mackerels.
The second method is haul or seine netting. Thismethod is used from foreshore or beach areas. It isonly occasionally used in the northern inshorefishery. The net is deployed out in an arc from theshoreline, usually from a small boat, surrounding anarea of water containing fish. The net is hauled tothe shore. This technique is mainly used for mulletand other inshore species such as whiting.
Mud crabs are harvested using baited pots (crabtraps) in the estuaries with mangrove habitats, andtidal sections of the rivers.
The distribution of harvest of major speciesgroupings in the northern inshore commercialfishery shows strong links to major river systemssuch as the Burdekin River near Townsville and theFitzroy River with its mouth north of theGladstone.

102
Figure I.6 Distribution of harvest of major speciesgroups by half-degree bands for the northern inshorecommercial fishery
Table I.10 shows total harvest from this fisheryincreased by around 80% over the 12 years from1989 to 2000. This appears to be largely due to thedramatic 170% increase in crab harvest fromaround 250 to 650t over the period. At the sametime, net harvest increased by about 60% fromalmost 900 to 1400t. Concurrently, fishing effort in
terms of days fished increased overall by around40%, although the trend followed a “U” shapedcurve with the least amount of effort being reportedin 1992. As with the total harvest, the pot effortdoubled while net effort effectively declined by20% over the period. Boat numbers increasedslightly, reaching a peak in 1997 then decliningthrough to 2000. GVP doubled over the periodincreasing to slightly more than $14M.
The main species harvested in the northern inshorecommercial sector are show in table I.11.
Mud crab harvest, as a proportion of total fisherylandings, increased from about 20% to 30% overthe period. Tropical shark harvest also increasedslightly as a proportion of total harvest whilebarramundi, threadfin and mackerel harvestdeclined slightly.
Table I.10 Northern inshore commercial fishery:performance indicators
0 100 200 300 400
Cape York
Orford Bay
Shelburne Bay
Temple Bay
Lloyd Bay
Cape Sidmouth
Roberts Point
PCB
Cape Bedford
Cooktown
Bloomfield
Cape Tribulation
Cairns
Babinda
Mission Beach
Cardwell
Ingham
Townsville
Burdekin
Bowen
Repulse Bay
Mackay
Notch Point
Shoalwater Bay
Byfield
Rockhampton
Gladstone
Seventeen-seventy
Harvest (t)
Mud Crab Shark OthersBarra Mackerel Threadfins
Harvest (t)
Species name 1989 1990 1991 1992 1993 1994 1995 1996 1997 1998 1999 2000
Crab — mud 238 295 271 274 284 295 274 290 333 478 545 646Shark* 176 117 130 151 185 209 233 220 302 323 350 465Barramundi 152 150 209 134 167 142 136 128 152 176 199 214Mullet* 86 92 132 111 100 151 226 186 128 137 129 156Threadfin — blue 88 78 104 85 92 101 87 79 95 66 78 74Mackerel — grey 134 161 64 73 56 52 46 60 124 61 63 35Threadfin — king 52 62 80 60 71 64 53 60 62 61 72 81Mackerel — spotted 16 36 6 25 37 6 25 29 73 72 38 145Queenfish 20 32 27 26 30 22 24 34 38 35 32 39Gar* 20 19 14 15 11 15 20 32 34 25 33 40Northern inshore total 1124 1227 1222 1107 1151 1199 1267 1275 1573 1608 1725 2059
Table I.11 Northern inshore commercial fishery: main species harvested (t)
* A number of species comprise the harvest
Year Harvest (t) Days fished Boats GVP ($M)
1989 1126 24303 456 71990 1228 26262 465 7.71991 1224 22966 465 7.51992 1108 18916 430 71993 1152 21219 424 7.51994 1200 22156 441 7.61995 1269 22883 462 7.71996 1277 23751 486 7.91997 1573 29721 549 9.91998 1608 30055 508 10.91999 1725 31972 529 11.92000 2059 33363 532 14.3
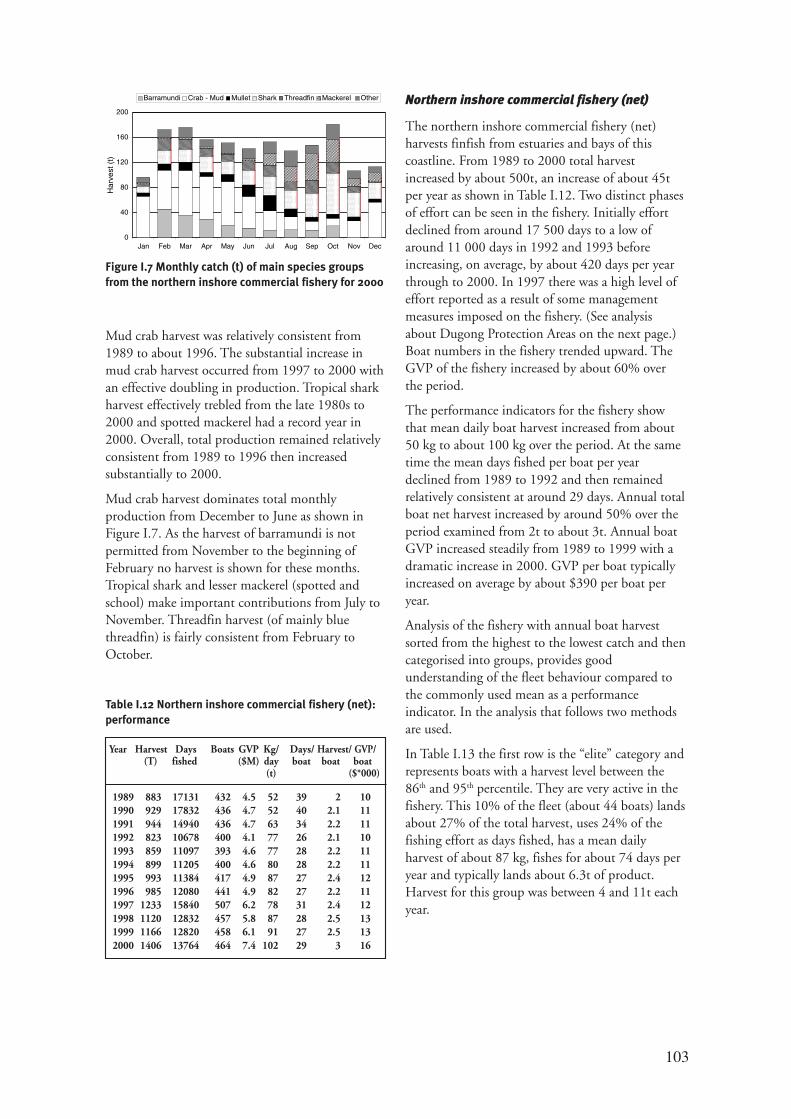
103
Mud crab harvest was relatively consistent from1989 to about 1996. The substantial increase inmud crab harvest occurred from 1997 to 2000 withan effective doubling in production. Tropical sharkharvest effectively trebled from the late 1980s to2000 and spotted mackerel had a record year in2000. Overall, total production remained relativelyconsistent from 1989 to 1996 then increasedsubstantially to 2000.
Mud crab harvest dominates total monthlyproduction from December to June as shown inFigure I.7. As the harvest of barramundi is notpermitted from November to the beginning ofFebruary no harvest is shown for these months.Tropical shark and lesser mackerel (spotted andschool) make important contributions from July toNovember. Threadfin harvest (of mainly bluethreadfin) is fairly consistent from February toOctober.
0
40
80
120
160
200
Jan Feb Mar Apr May Jun Jul Aug Sep Oct Nov Dec
Har
vest
(t)
Barramundi Crab - Mud Mullet Shark Threadfin Mackerel Other
Figure I.7 Monthly catch (t) of main species groupsfrom the northern inshore commercial fishery for 2000
Northern inshore commercial fishery (net)
The northern inshore commercial fishery (net)harvests finfish from estuaries and bays of thiscoastline. From 1989 to 2000 total harvestincreased by about 500t, an increase of about 45tper year as shown in Table I.12. Two distinct phasesof effort can be seen in the fishery. Initially effortdeclined from around 17 500 days to a low ofaround 11 000 days in 1992 and 1993 beforeincreasing, on average, by about 420 days per yearthrough to 2000. In 1997 there was a high level ofeffort reported as a result of some managementmeasures imposed on the fishery. (See analysisabout Dugong Protection Areas on the next page.)Boat numbers in the fishery trended upward. TheGVP of the fishery increased by about 60% overthe period.
The performance indicators for the fishery showthat mean daily boat harvest increased from about50 kg to about 100 kg over the period. At the sametime the mean days fished per boat per yeardeclined from 1989 to 1992 and then remainedrelatively consistent at around 29 days. Annual totalboat net harvest increased by around 50% over theperiod examined from 2t to about 3t. Annual boatGVP increased steadily from 1989 to 1999 with adramatic increase in 2000. GVP per boat typicallyincreased on average by about $390 per boat peryear.
Analysis of the fishery with annual boat harvestsorted from the highest to the lowest catch and thencategorised into groups, provides goodunderstanding of the fleet behaviour compared tothe commonly used mean as a performanceindicator. In the analysis that follows two methodsare used.
In Table I.13 the first row is the “elite” category andrepresents boats with a harvest level between the86th and 95th percentile. They are very active in thefishery. This 10% of the fleet (about 44 boats) landsabout 27% of the total harvest, uses 24% of thefishing effort as days fished, has a mean dailyharvest of about 87 kg, fishes for about 74 days peryear and typically lands about 6.3t of product.Harvest for this group was between 4 and 11t eachyear.
Table I.12 Northern inshore commercial fishery (net):performance
1989 883 17131 432 4.5 52 39 2 101990 929 17832 436 4.7 52 40 2.1 111991 944 14940 436 4.7 63 34 2.2 111992 823 10678 400 4.1 77 26 2.1 101993 859 11097 393 4.6 77 28 2.2 111994 899 11205 400 4.6 80 28 2.2 111995 993 11384 417 4.9 87 27 2.4 121996 985 12080 441 4.9 82 27 2.2 111997 1233 15840 507 6.2 78 31 2.4 121998 1120 12832 457 5.8 87 28 2.5 131999 1166 12820 458 6.1 91 27 2.5 132000 1406 13764 464 7.4 102 29 3 16
Year Harvest Days Boats GVP Kg/ Days/ Harvest/lGVP/(T) fished ($M) day boat boat boat
(t) ($*000)
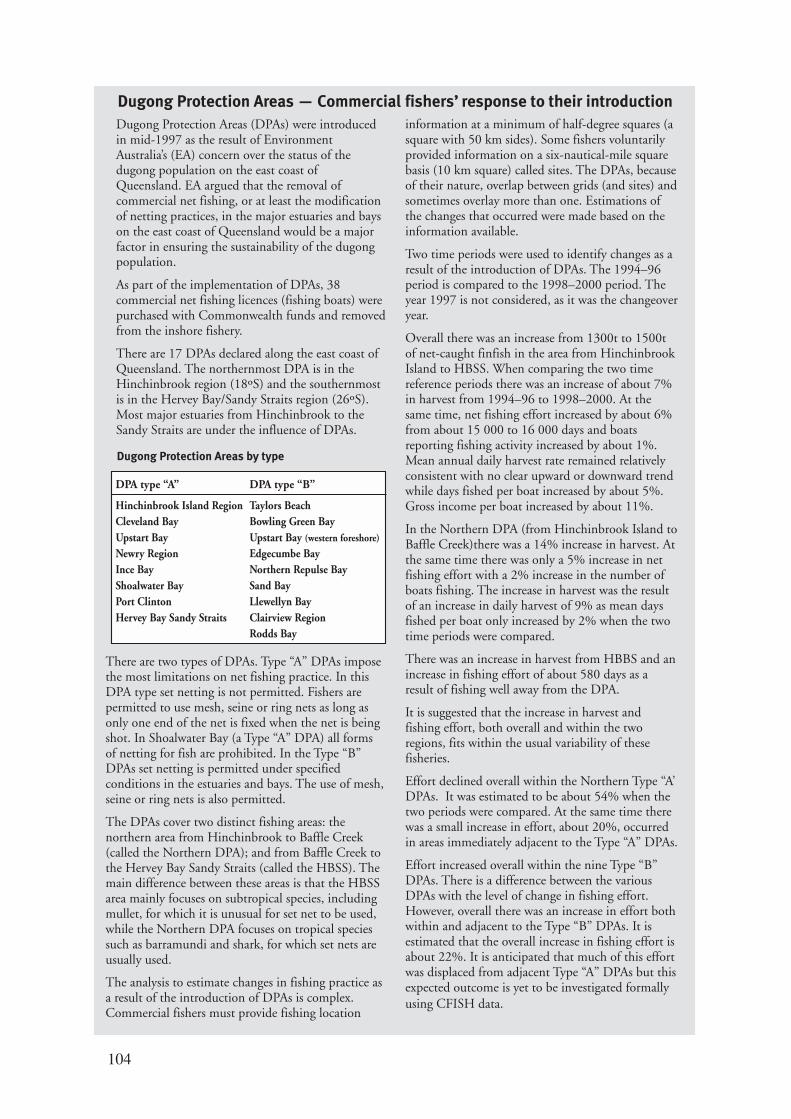
104
Dugong Protection Areas (DPAs) were introducedin mid-1997 as the result of EnvironmentAustralia’s (EA) concern over the status of thedugong population on the east coast ofQueensland. EA argued that the removal ofcommercial net fishing, or at least the modificationof netting practices, in the major estuaries and bayson the east coast of Queensland would be a majorfactor in ensuring the sustainability of the dugongpopulation.
As part of the implementation of DPAs, 38commercial net fishing licences (fishing boats) werepurchased with Commonwealth funds and removedfrom the inshore fishery.
There are 17 DPAs declared along the east coast ofQueensland. The northernmost DPA is in theHinchinbrook region (18ºS) and the southernmostis in the Hervey Bay/Sandy Straits region (26ºS).Most major estuaries from Hinchinbrook to theSandy Straits are under the influence of DPAs.
information at a minimum of half-degree squares (asquare with 50 km sides). Some fishers voluntarilyprovided information on a six-nautical-mile squarebasis (10 km square) called sites. The DPAs, becauseof their nature, overlap between grids (and sites) andsometimes overlay more than one. Estimations ofthe changes that occurred were made based on theinformation available.
Two time periods were used to identify changes as aresult of the introduction of DPAs. The 1994–96period is compared to the 1998–2000 period. Theyear 1997 is not considered, as it was the changeoveryear.
Overall there was an increase from 1300t to 1500tof net-caught finfish in the area from HinchinbrookIsland to HBSS. When comparing the two timereference periods there was an increase of about 7%in harvest from 1994–96 to 1998–2000. At thesame time, net fishing effort increased by about 6%from about 15 000 to 16 000 days and boatsreporting fishing activity increased by about 1%.Mean annual daily harvest rate remained relativelyconsistent with no clear upward or downward trendwhile days fished per boat increased by about 5%.Gross income per boat increased by about 11%.
In the Northern DPA (from Hinchinbrook Island toBaffle Creek)there was a 14% increase in harvest. Atthe same time there was only a 5% increase in netfishing effort with a 2% increase in the number ofboats fishing. The increase in harvest was the resultof an increase in daily harvest of 9% as mean daysfished per boat only increased by 2% when the twotime periods were compared.
There was an increase in harvest from HBBS and anincrease in fishing effort of about 580 days as aresult of fishing well away from the DPA.
It is suggested that the increase in harvest andfishing effort, both overall and within the tworegions, fits within the usual variability of thesefisheries.
Effort declined overall within the Northern Type “A’DPAs. It was estimated to be about 54% when thetwo periods were compared. At the same time therewas a small increase in effort, about 20%, occurredin areas immediately adjacent to the Type “A” DPAs.
Effort increased overall within the nine Type “B”DPAs. There is a difference between the variousDPAs with the level of change in fishing effort.However, overall there was an increase in effort bothwithin and adjacent to the Type “B” DPAs. It isestimated that the overall increase in fishing effort isabout 22%. It is anticipated that much of this effortwas displaced from adjacent Type “A” DPAs but thisexpected outcome is yet to be investigated formallyusing CFISH data.
Dugong Protection Areas — Commercial fishers’ response to their introduction
There are two types of DPAs. Type “A” DPAs imposethe most limitations on net fishing practice. In thisDPA type set netting is not permitted. Fishers arepermitted to use mesh, seine or ring nets as long asonly one end of the net is fixed when the net is beingshot. In Shoalwater Bay (a Type “A” DPA) all formsof netting for fish are prohibited. In the Type “B”DPAs set netting is permitted under specifiedconditions in the estuaries and bays. The use of mesh,seine or ring nets is also permitted.
The DPAs cover two distinct fishing areas: thenorthern area from Hinchinbrook to Baffle Creek(called the Northern DPA); and from Baffle Creek tothe Hervey Bay Sandy Straits (called the HBSS). Themain difference between these areas is that the HBSSarea mainly focuses on subtropical species, includingmullet, for which it is unusual for set net to be used,while the Northern DPA focuses on tropical speciessuch as barramundi and shark, for which set nets areusually used.
The analysis to estimate changes in fishing practice asa result of the introduction of DPAs is complex.Commercial fishers must provide fishing location
Dugong Protection Areas by type
DPA type “A” DPA type “B”
Hinchinbrook Island Region Taylors BeachCleveland Bay Bowling Green BayUpstart Bay Upstart Bay (western foreshore)
Newry Region Edgecumbe BayInce Bay Northern Repulse BayShoalwater Bay Sand BayPort Clinton Llewellyn BayHervey Bay Sandy Straits Clairview Region
Rodds Bay
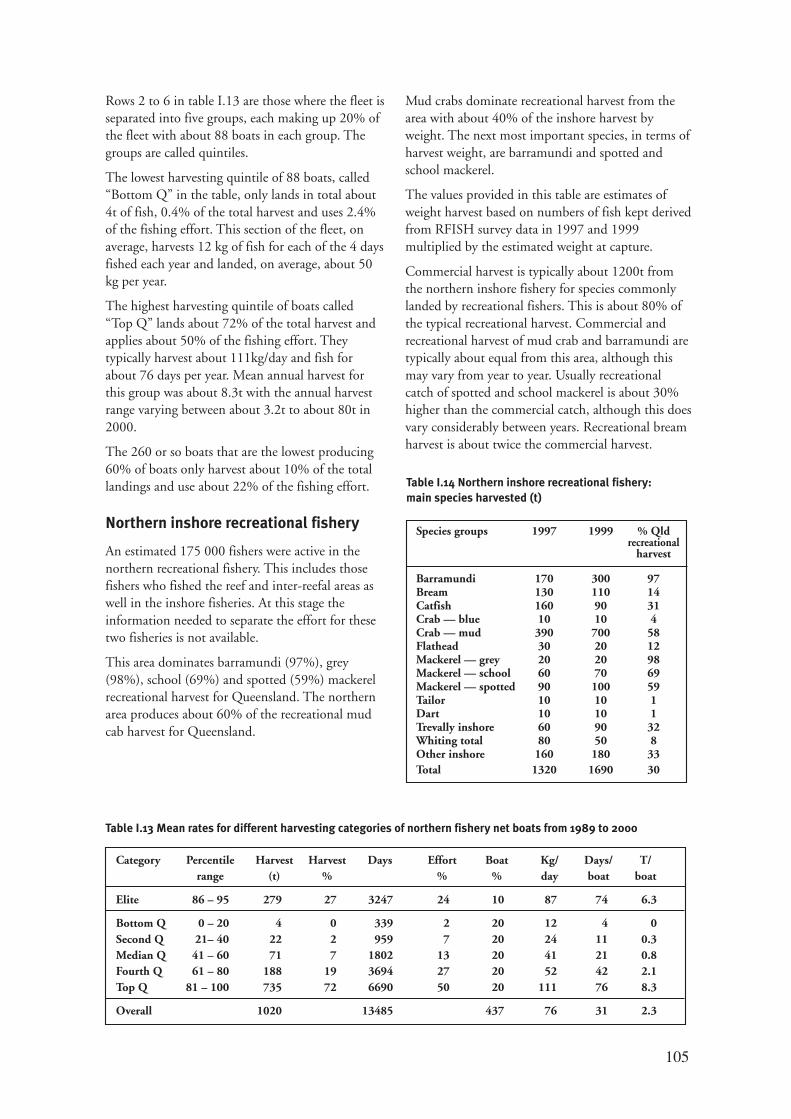
105
Rows 2 to 6 in table I.13 are those where the fleet isseparated into five groups, each making up 20% ofthe fleet with about 88 boats in each group. Thegroups are called quintiles.
The lowest harvesting quintile of 88 boats, called“Bottom Q” in the table, only lands in total about4t of fish, 0.4% of the total harvest and uses 2.4%of the fishing effort. This section of the fleet, onaverage, harvests 12 kg of fish for each of the 4 daysfished each year and landed, on average, about 50kg per year.
The highest harvesting quintile of boats called“Top Q” lands about 72% of the total harvest andapplies about 50% of the fishing effort. Theytypically harvest about 111kg/day and fish forabout 76 days per year. Mean annual harvest forthis group was about 8.3t with the annual harvestrange varying between about 3.2t to about 80t in2000.
The 260 or so boats that are the lowest producing60% of boats only harvest about 10% of the totallandings and use about 22% of the fishing effort.
Northern inshore recreational fishery
An estimated 175 000 fishers were active in thenorthern recreational fishery. This includes thosefishers who fished the reef and inter-reefal areas aswell in the inshore fisheries. At this stage theinformation needed to separate the effort for thesetwo fisheries is not available.
This area dominates barramundi (97%), grey(98%), school (69%) and spotted (59%) mackerelrecreational harvest for Queensland. The northernarea produces about 60% of the recreational mudcab harvest for Queensland.
Mud crabs dominate recreational harvest from thearea with about 40% of the inshore harvest byweight. The next most important species, in terms ofharvest weight, are barramundi and spotted andschool mackerel.
The values provided in this table are estimates ofweight harvest based on numbers of fish kept derivedfrom RFISH survey data in 1997 and 1999multiplied by the estimated weight at capture.
Commercial harvest is typically about 1200t fromthe northern inshore fishery for species commonlylanded by recreational fishers. This is about 80% ofthe typical recreational harvest. Commercial andrecreational harvest of mud crab and barramundi aretypically about equal from this area, although thismay vary from year to year. Usually recreationalcatch of spotted and school mackerel is about 30%higher than the commercial catch, although this doesvary considerably between years. Recreational breamharvest is about twice the commercial harvest.
Table I.13 Mean rates for different harvesting categories of northern fishery net boats from 1989 to 2000
Table I.14 Northern inshore recreational fishery:main species harvested (t)
Species groups 1997 1999 % Qldrecreational
harvest
Barramundi 170 300 97Bream 130 110 14Catfish 160 90 31Crab — blue 10 10 4Crab — mud 390 700 58Flathead 30 20 12Mackerel — grey 20 20 98Mackerel — school 60 70 69Mackerel — spotted 90 100 59Tailor 10 10 1Dart 10 10 1Trevally inshore 60 90 32Whiting total 80 50 8Other inshore 160 180 33Total 1320 1690 30
Category Percentile Harvest Harvest Days Effort Boat Kg/ Days/ T/range (t) % % % day boat boat
Elite 86 – 95 279 27 3247 24 10 87 74 6.3
Bottom Q 0 – 20 4 0 339 2 20 12 4 0Second Q 21– 40 22 2 959 7 20 24 11 0.3Median Q 41 – 60 71 7 1802 13 20 41 21 0.8Fourth Q 61 – 80 188 19 3694 27 20 52 42 2.1Top Q 81 – 100 735 72 6690 50 20 111 76 8.3
Overall 1020 13485 437 76 31 2.3
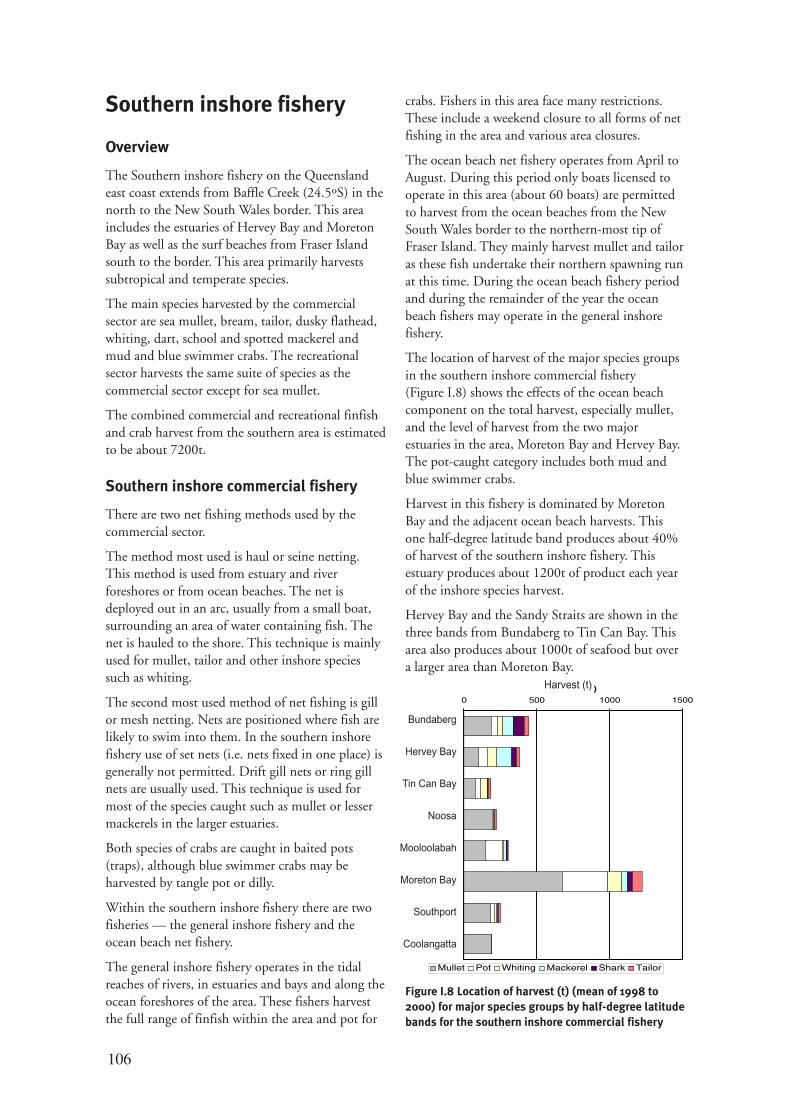
106
Southern inshore fishery
Overview
The Southern inshore fishery on the Queenslandeast coast extends from Baffle Creek (24.5ºS) in thenorth to the New South Wales border. This areaincludes the estuaries of Hervey Bay and MoretonBay as well as the surf beaches from Fraser Islandsouth to the border. This area primarily harvestssubtropical and temperate species.
The main species harvested by the commercialsector are sea mullet, bream, tailor, dusky flathead,whiting, dart, school and spotted mackerel andmud and blue swimmer crabs. The recreationalsector harvests the same suite of species as thecommercial sector except for sea mullet.
The combined commercial and recreational finfishand crab harvest from the southern area is estimatedto be about 7200t.
Southern inshore commercial fishery
There are two net fishing methods used by thecommercial sector.
The method most used is haul or seine netting.This method is used from estuary and riverforeshores or from ocean beaches. The net isdeployed out in an arc, usually from a small boat,surrounding an area of water containing fish. Thenet is hauled to the shore. This technique is mainlyused for mullet, tailor and other inshore speciessuch as whiting.
The second most used method of net fishing is gillor mesh netting. Nets are positioned where fish arelikely to swim into them. In the southern inshorefishery use of set nets (i.e. nets fixed in one place) isgenerally not permitted. Drift gill nets or ring gillnets are usually used. This technique is used formost of the species caught such as mullet or lessermackerels in the larger estuaries.
Both species of crabs are caught in baited pots(traps), although blue swimmer crabs may beharvested by tangle pot or dilly.
Within the southern inshore fishery there are twofisheries — the general inshore fishery and theocean beach net fishery.
The general inshore fishery operates in the tidalreaches of rivers, in estuaries and bays and along theocean foreshores of the area. These fishers harvestthe full range of finfish within the area and pot for
crabs. Fishers in this area face many restrictions.These include a weekend closure to all forms of netfishing in the area and various area closures.
The ocean beach net fishery operates from April toAugust. During this period only boats licensed tooperate in this area (about 60 boats) are permittedto harvest from the ocean beaches from the NewSouth Wales border to the northern-most tip ofFraser Island. They mainly harvest mullet and tailoras these fish undertake their northern spawning runat this time. During the ocean beach fishery periodand during the remainder of the year the oceanbeach fishers may operate in the general inshorefishery.
The location of harvest of the major species groupsin the southern inshore commercial fishery(Figure I.8) shows the effects of the ocean beachcomponent on the total harvest, especially mullet,and the level of harvest from the two majorestuaries in the area, Moreton Bay and Hervey Bay.The pot-caught category includes both mud andblue swimmer crabs.
Harvest in this fishery is dominated by MoretonBay and the adjacent ocean beach harvests. Thisone half-degree latitude band produces about 40%of harvest of the southern inshore fishery. Thisestuary produces about 1200t of product each yearof the inshore species harvest.
Hervey Bay and the Sandy Straits are shown in thethree bands from Bundaberg to Tin Can Bay. Thisarea also produces about 1000t of seafood but overa larger area than Moreton Bay.
Figure I.8 Location of harvest (t) (mean of 1998 to2000) for major species groups by half-degree latitudebands for the southern inshore commercial fishery
0 500 1000 1500
Bundaberg
Hervey Bay
Tin Can Bay
Noosa
Mooloolaba
Moreton Bay
Southport
Coolangatta
Harvest (t)
Mullet Pot Whiting Mackerel Shark Tailor
Harvest (t)
Bundaberg
Hervey Bay
Tin Can Bay
Noosa
Mooloolabah
Moreton Bay
Southport
Coolangatta
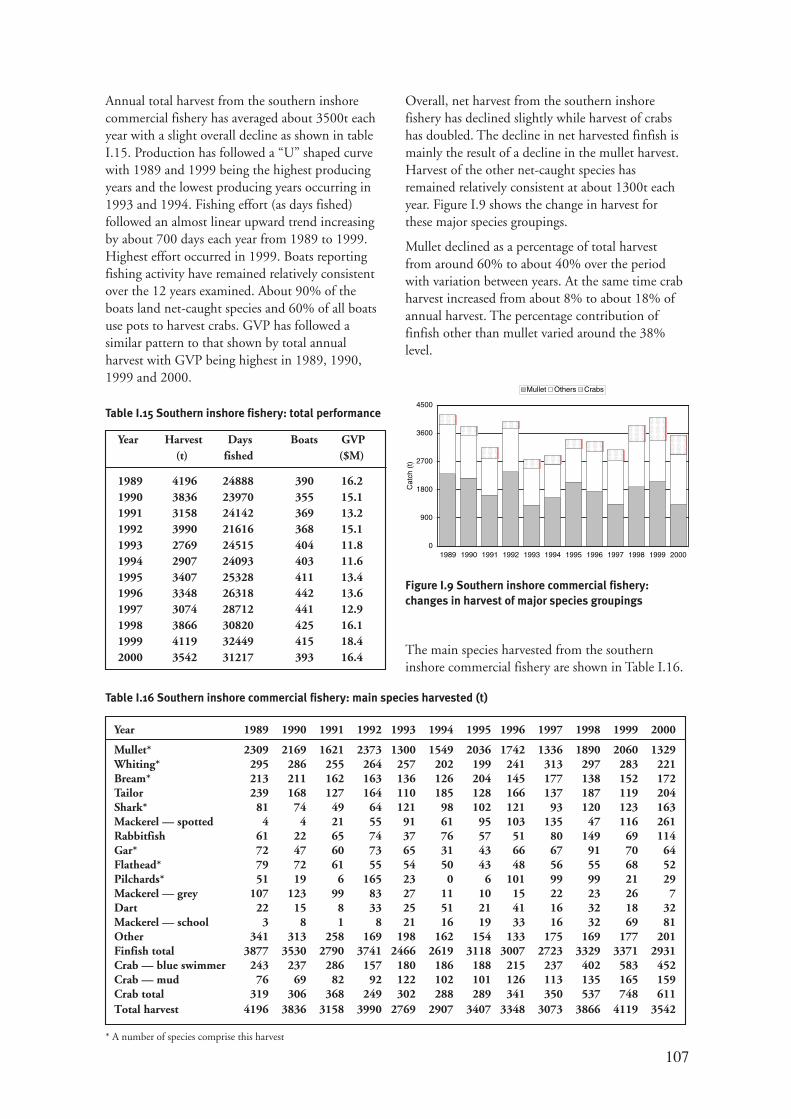
107
0
900
1800
2700
3600
4500
1989 1990 1991 1992 1993 1994 1995 1996 1997 1998 1999 2000
Cat
ch (
t)
Mullet Others Crabs
Annual total harvest from the southern inshorecommercial fishery has averaged about 3500t eachyear with a slight overall decline as shown in tableI.15. Production has followed a “U” shaped curvewith 1989 and 1999 being the highest producingyears and the lowest producing years occurring in1993 and 1994. Fishing effort (as days fished)followed an almost linear upward trend increasingby about 700 days each year from 1989 to 1999.Highest effort occurred in 1999. Boats reportingfishing activity have remained relatively consistentover the 12 years examined. About 90% of theboats land net-caught species and 60% of all boatsuse pots to harvest crabs. GVP has followed asimilar pattern to that shown by total annualharvest with GVP being highest in 1989, 1990,1999 and 2000.
Year Harvest Days Boats GVP(t) fished ($M)
1989 4196 24888 390 16.21990 3836 23970 355 15.11991 3158 24142 369 13.21992 3990 21616 368 15.11993 2769 24515 404 11.81994 2907 24093 403 11.61995 3407 25328 411 13.41996 3348 26318 442 13.61997 3074 28712 441 12.91998 3866 30820 425 16.11999 4119 32449 415 18.42000 3542 31217 393 16.4
Table I.15 Southern inshore fishery: total performance
Overall, net harvest from the southern inshorefishery has declined slightly while harvest of crabshas doubled. The decline in net harvested finfish ismainly the result of a decline in the mullet harvest.Harvest of the other net-caught species hasremained relatively consistent at about 1300t eachyear. Figure I.9 shows the change in harvest forthese major species groupings.
Mullet declined as a percentage of total harvestfrom around 60% to about 40% over the periodwith variation between years. At the same time crabharvest increased from about 8% to about 18% ofannual harvest. The percentage contribution offinfish other than mullet varied around the 38%level.
Figure I.9 Southern inshore commercial fishery:changes in harvest of major species groupings
The main species harvested from the southerninshore commercial fishery are shown in Table I.16.
Year 1989 1990 1991 1992 1993 1994 1995 1996 1997 1998 1999 2000
Mullet* 2309 2169 1621 2373 1300 1549 2036 1742 1336 1890 2060 1329Whiting* 295 286 255 264 257 202 199 241 313 297 283 221Bream* 213 211 162 163 136 126 204 145 177 138 152 172Tailor 239 168 127 164 110 185 128 166 137 187 119 204Shark* 81 74 49 64 121 98 102 121 93 120 123 163Mackerel — spotted 4 4 21 55 91 61 95 103 135 47 116 261Rabbitfish 61 22 65 74 37 76 57 51 80 149 69 114Gar* 72 47 60 73 65 31 43 66 67 91 70 64Flathead* 79 72 61 55 54 50 43 48 56 55 68 52Pilchards* 51 19 6 165 23 0 6 101 99 99 21 29Mackerel — grey 107 123 99 83 27 11 10 15 22 23 26 7Dart 22 15 8 33 25 51 21 41 16 32 18 32Mackerel — school 3 8 1 8 21 16 19 33 16 32 69 81Other 341 313 258 169 198 162 154 133 175 169 177 201Finfish total 3877 3530 2790 3741 2466 2619 3118 3007 2723 3329 3371 2931Crab — blue swimmer 243 237 286 157 180 186 188 215 237 402 583 452Crab — mud 76 69 82 92 122 102 101 126 113 135 165 159Crab total 319 306 368 249 302 288 289 341 350 537 748 611Total harvest 4196 3836 3158 3990 2769 2907 3407 3348 3073 3866 4119 3542
* A number of species comprise this harvest
Table I.16 Southern inshore commercial fishery: main species harvested (t)
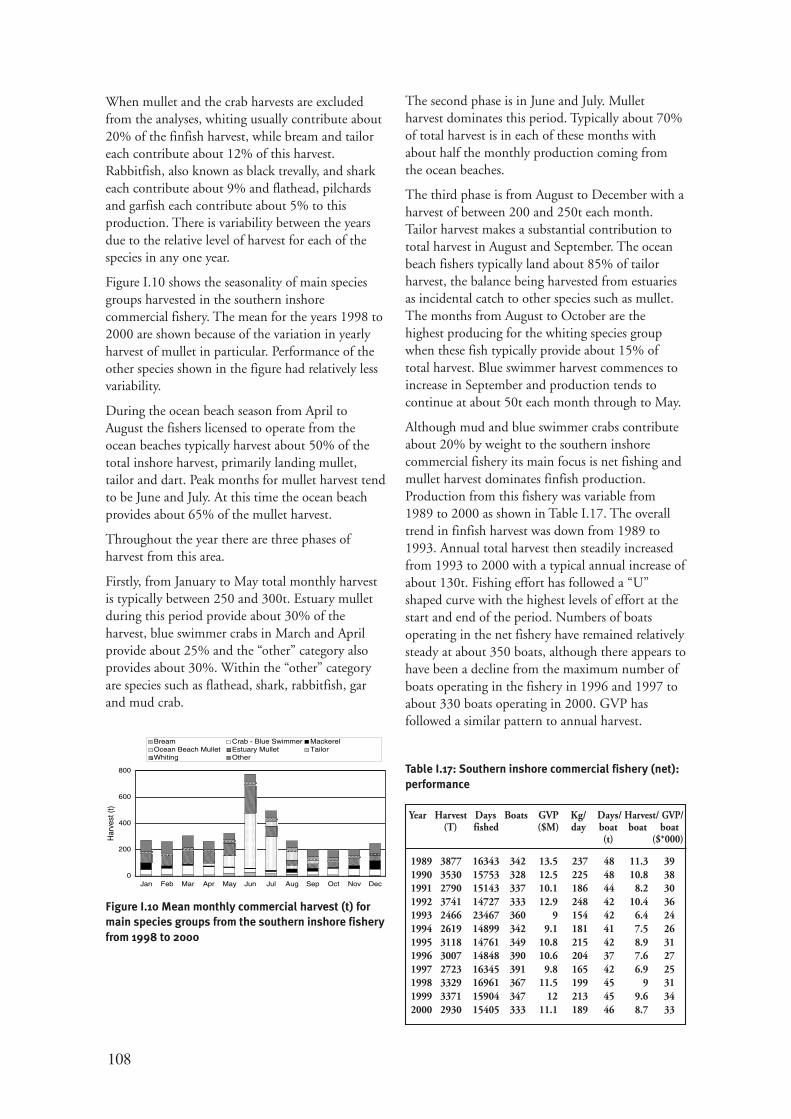
108
When mullet and the crab harvests are excludedfrom the analyses, whiting usually contribute about20% of the finfish harvest, while bream and tailoreach contribute about 12% of this harvest.Rabbitfish, also known as black trevally, and sharkeach contribute about 9% and flathead, pilchardsand garfish each contribute about 5% to thisproduction. There is variability between the yearsdue to the relative level of harvest for each of thespecies in any one year.
Figure I.10 shows the seasonality of main speciesgroups harvested in the southern inshorecommercial fishery. The mean for the years 1998 to2000 are shown because of the variation in yearlyharvest of mullet in particular. Performance of theother species shown in the figure had relatively lessvariability.
During the ocean beach season from April toAugust the fishers licensed to operate from theocean beaches typically harvest about 50% of thetotal inshore harvest, primarily landing mullet,tailor and dart. Peak months for mullet harvest tendto be June and July. At this time the ocean beachprovides about 65% of the mullet harvest.
Throughout the year there are three phases ofharvest from this area.
Firstly, from January to May total monthly harvestis typically between 250 and 300t. Estuary mulletduring this period provide about 30% of theharvest, blue swimmer crabs in March and Aprilprovide about 25% and the “other” category alsoprovides about 30%. Within the “other” categoryare species such as flathead, shark, rabbitfish, garand mud crab.
The second phase is in June and July. Mulletharvest dominates this period. Typically about 70%of total harvest is in each of these months withabout half the monthly production coming fromthe ocean beaches.
The third phase is from August to December with aharvest of between 200 and 250t each month.Tailor harvest makes a substantial contribution tototal harvest in August and September. The oceanbeach fishers typically land about 85% of tailorharvest, the balance being harvested from estuariesas incidental catch to other species such as mullet.The months from August to October are thehighest producing for the whiting species groupwhen these fish typically provide about 15% oftotal harvest. Blue swimmer harvest commences toincrease in September and production tends tocontinue at about 50t each month through to May.
Although mud and blue swimmer crabs contributeabout 20% by weight to the southern inshorecommercial fishery its main focus is net fishing andmullet harvest dominates finfish production.Production from this fishery was variable from1989 to 2000 as shown in Table I.17. The overalltrend in finfish harvest was down from 1989 to1993. Annual total harvest then steadily increasedfrom 1993 to 2000 with a typical annual increase ofabout 130t. Fishing effort has followed a “U”shaped curve with the highest levels of effort at thestart and end of the period. Numbers of boatsoperating in the net fishery have remained relativelysteady at about 350 boats, although there appears tohave been a decline from the maximum number ofboats operating in the fishery in 1996 and 1997 toabout 330 boats operating in 2000. GVP hasfollowed a similar pattern to annual harvest.
Figure I.10 Mean monthly commercial harvest (t) formain species groups from the southern inshore fisheryfrom 1998 to 2000
Year Harvest Days Boats GVP Kg/ Days/ Harvest/lGVP/(T) fished ($M) day boat boat boat
(t) ($*000)
1989 3877 16343 342 13.5 237 48 11.3 391990 3530 15753 328 12.5 225 48 10.8 381991 2790 15143 337 10.1 186 44 8.2 301992 3741 14727 333 12.9 248 42 10.4 361993 2466 23467 360 9 154 42 6.4 241994 2619 14899 342 9.1 181 41 7.5 261995 3118 14761 349 10.8 215 42 8.9 311996 3007 14848 390 10.6 204 37 7.6 271997 2723 16345 391 9.8 165 42 6.9 251998 3329 16961 367 11.5 199 45 9 311999 3371 15904 347 12 213 45 9.6 342000 2930 15405 333 11.1 189 46 8.7 33
Table I.17: Southern inshore commercial fishery (net):performance
0
200
400
600
800
Jan Feb Mar Apr May Jun Jul Aug Sep Oct Nov Dec
Har
vest
(t)
Bream Crab - Blue Swimmer MackerelOcean Beach Mullet Estuary Mullet TailorWhiting Other
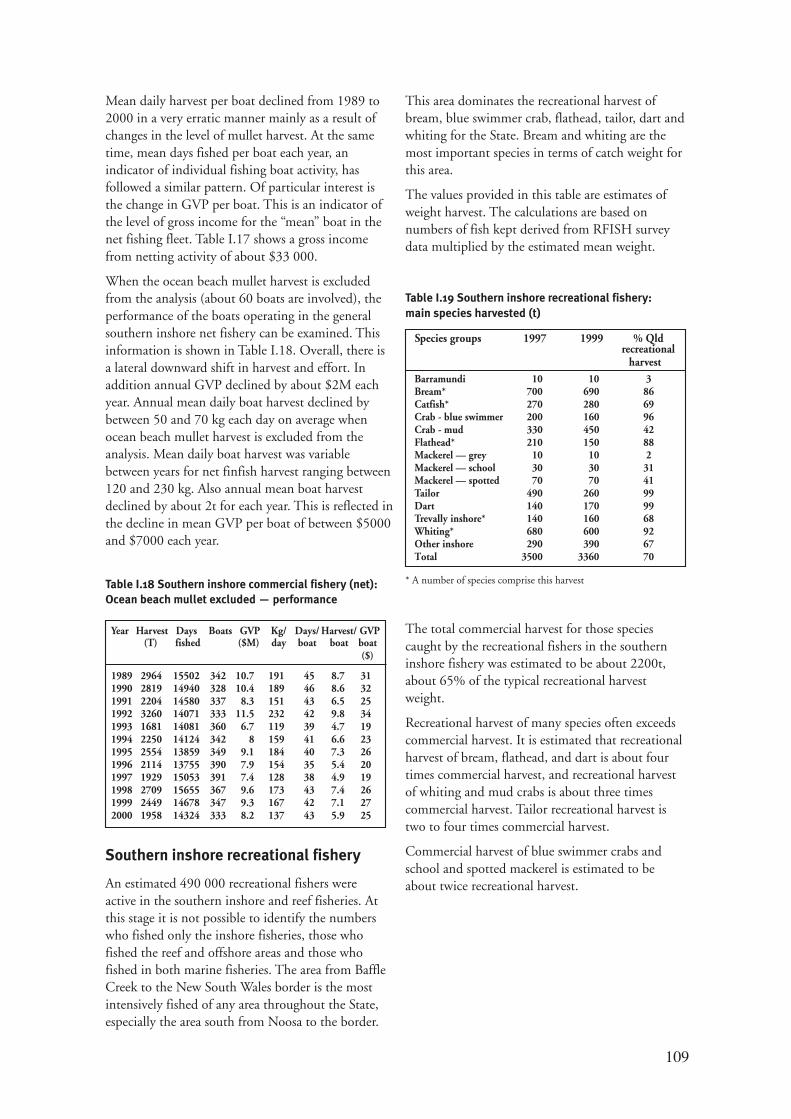
109
Mean daily harvest per boat declined from 1989 to2000 in a very erratic manner mainly as a result ofchanges in the level of mullet harvest. At the sametime, mean days fished per boat each year, anindicator of individual fishing boat activity, hasfollowed a similar pattern. Of particular interest isthe change in GVP per boat. This is an indicator ofthe level of gross income for the “mean” boat in thenet fishing fleet. Table I.17 shows a gross incomefrom netting activity of about $33 000.
When the ocean beach mullet harvest is excludedfrom the analysis (about 60 boats are involved), theperformance of the boats operating in the generalsouthern inshore net fishery can be examined. Thisinformation is shown in Table I.18. Overall, there isa lateral downward shift in harvest and effort. Inaddition annual GVP declined by about $2M eachyear. Annual mean daily boat harvest declined bybetween 50 and 70 kg each day on average whenocean beach mullet harvest is excluded from theanalysis. Mean daily boat harvest was variablebetween years for net finfish harvest ranging between120 and 230 kg. Also annual mean boat harvestdeclined by about 2t for each year. This is reflected inthe decline in mean GVP per boat of between $5000and $7000 each year.
Southern inshore recreational fishery
An estimated 490 000 recreational fishers wereactive in the southern inshore and reef fisheries. Atthis stage it is not possible to identify the numberswho fished only the inshore fisheries, those whofished the reef and offshore areas and those whofished in both marine fisheries. The area from BaffleCreek to the New South Wales border is the mostintensively fished of any area throughout the State,especially the area south from Noosa to the border.
Table I.18 Southern inshore commercial fishery (net):Ocean beach mullet excluded — performance
Table I.19 Southern inshore recreational fishery:main species harvested (t)
Species groups 1997 1999 % Qldrecreational
harvestBarramundi 10 10 3Bream* 700 690 86Catfish* 270 280 69Crab - blue swimmer 200 160 96Crab - mud 330 450 42Flathead* 210 150 88Mackerel — grey 10 10 2Mackerel — school 30 30 31Mackerel — spotted 70 70 41Tailor 490 260 99Dart 140 170 99Trevally inshore* 140 160 68Whiting* 680 600 92Other inshore 290 390 67Total 3500 3360 70
This area dominates the recreational harvest ofbream, blue swimmer crab, flathead, tailor, dart andwhiting for the State. Bream and whiting are themost important species in terms of catch weight forthis area.
The values provided in this table are estimates ofweight harvest. The calculations are based onnumbers of fish kept derived from RFISH surveydata multiplied by the estimated mean weight.
Year Harvest Days Boats GVP Kg/ Days/ Harvest/ GVP(T) fished ($M) day boat boat boat
($)
1989 2964 15502 342 10.7 191 45 8.7 311990 2819 14940 328 10.4 189 46 8.6 321991 2204 14580 337 8.3 151 43 6.5 251992 3260 14071 333 11.5 232 42 9.8 341993 1681 14081 360 6.7 119 39 4.7 191994 2250 14124 342 8 159 41 6.6 231995 2554 13859 349 9.1 184 40 7.3 261996 2114 13755 390 7.9 154 35 5.4 201997 1929 15053 391 7.4 128 38 4.9 191998 2709 15655 367 9.6 173 43 7.4 261999 2449 14678 347 9.3 167 42 7.1 272000 1958 14324 333 8.2 137 43 5.9 25
* A number of species comprise this harvest
The total commercial harvest for those speciescaught by the recreational fishers in the southerninshore fishery was estimated to be about 2200t,about 65% of the typical recreational harvestweight.
Recreational harvest of many species often exceedscommercial harvest. It is estimated that recreationalharvest of bream, flathead, and dart is about fourtimes commercial harvest, and recreational harvestof whiting and mud crabs is about three timescommercial harvest. Tailor recreational harvest istwo to four times commercial harvest.
Commercial harvest of blue swimmer crabs andschool and spotted mackerel is estimated to beabout twice recreational harvest.
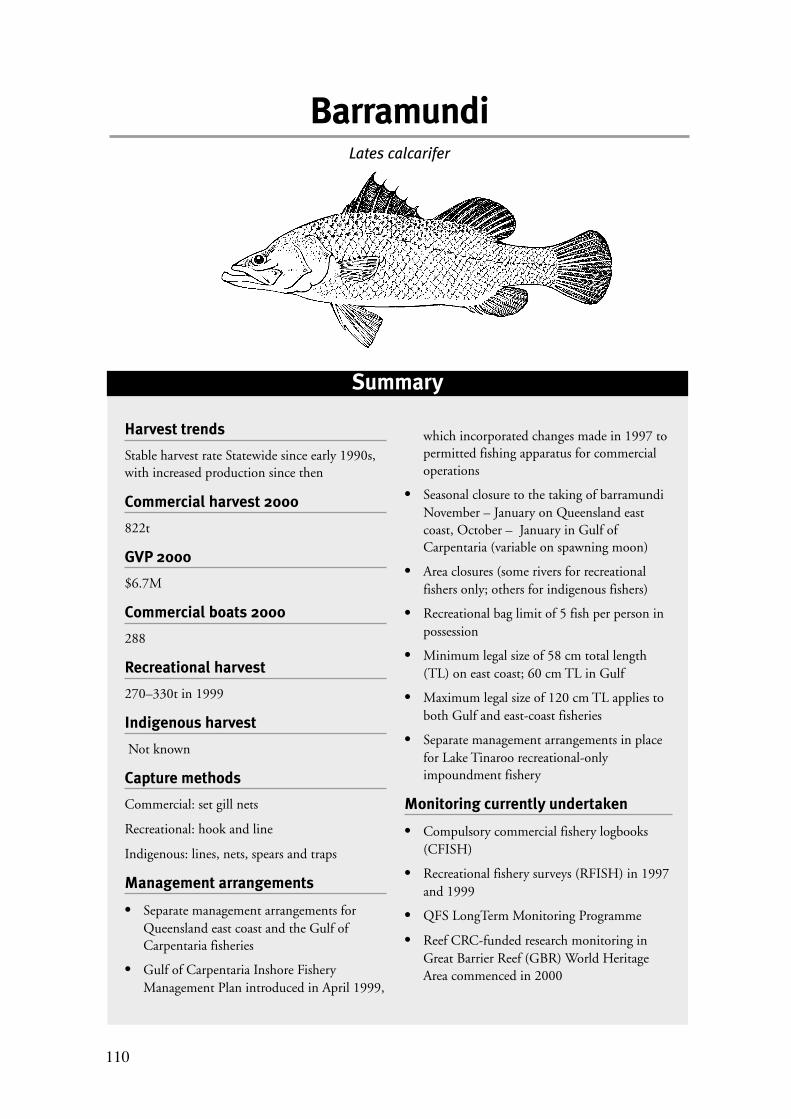
110
Summary
Harvest trends
Stable harvest rate Statewide since early 1990s,with increased production since then
Commercial harvest 2000
822t
GVP 2000
$6.7M
Commercial boats 2000
288
Recreational harvest
270–330t in 1999
Indigenous harvest
Not known
Capture methods
Commercial: set gill nets
Recreational: hook and line
Indigenous: lines, nets, spears and traps
Management arrangements
• Separate management arrangements forQueensland east coast and the Gulf ofCarpentaria fisheries
• Gulf of Carpentaria Inshore FisheryManagement Plan introduced in April 1999,
BarramundiLates calcarifer
which incorporated changes made in 1997 topermitted fishing apparatus for commercialoperations
• Seasonal closure to the taking of barramundiNovember – January on Queensland eastcoast, October – January in Gulf ofCarpentaria (variable on spawning moon)
• Area closures (some rivers for recreationalfishers only; others for indigenous fishers)
• Recreational bag limit of 5 fish per person inpossession
• Minimum legal size of 58 cm total length(TL) on east coast; 60 cm TL in Gulf
• Maximum legal size of 120 cm TL applies toboth Gulf and east-coast fisheries
• Separate management arrangements in placefor Lake Tinaroo recreational-onlyimpoundment fishery
Monitoring currently undertaken
• Compulsory commercial fishery logbooks(CFISH)
• Recreational fishery surveys (RFISH) in 1997and 1999
• QFS LongTerm Monitoring Programme
• Reef CRC-funded research monitoring inGreat Barrier Reef (GBR) World HeritageArea commenced in 2000

111
Resource concerns
• High reliance on narrow span of yearclasses for the commercial harvest, withmost fish taken in the east-coast fisherybeing sexually immature; premium marketprices paid for small fish
• Loss of habitat through urban and ruraldevelopment and other land uses,especially in east-coast coastal swamps andfreshwater riverine areas for juvenile fish
• Recreational fisher diaries should have thecapacity to allow estimation of Gulf ofCarpentaria and east-coast catches, and torefine harvest to smaller areas thanstatistical divisions with reasonable levelsof confidence in the results.
• Potential impacts on local fishpopulations, especially in river systemsadjacent to Gulf ports, with rapidexpansion over last 2 years of high-volumeand high-turnaround supply of “iki-jimi”iced “fresh” whole fish to markets insouth-eastern Queensland and interstate.
Commercial harvest
Barramundi are harvested as part of the gill-netfisheries on the east coast of Queensland and in theGulf of Carpentaria. These areas are managed asseparate entities and will be reported on separately.
Generally, the harvest of barramundi in Queenslandis only permitted for about nine months each yeardue to the imposition of a seasonal closure duringthe species’ peak breeding season. There is a strongseasonal influence on harvest with the largestbarramundi catches occurring in the months priorto and following the wet season. About two-thirdsof the annual harvest is landed in the four monthsFebruary – May.
In Queensland, about 300 boats recordedbarramundi harvests each year over the past decade.About one-third of these boats operated in the Gulfof Carpentaria. The annual Queensland harvest ofbarramundi fell from a reported 670t in 1989 to480t in 1992, then rose in almost every year,reaching 900t in 1999 and 822t in 2000. About75% of Queensland barramundi production inrecent years has come from the Gulf. Reportedfishing effort declined from around 15 700 days in1992 to about 13 300 days in 1996, then graduallyincreased to about 15 000 days in 2000. Abouttwo-thirds of the fishing effort Statewide occurredin the Gulf-net fishery.
On the east coast of Queensland, about 250 boatsreported barramundi harvest each year since 1989.The Northern Region and the Capricorn region
Profile of the resource
Background
The barramundi (Lates calcarifer) is a largepredatory fish species found in coastal regions oftropical Australia and throughout much of theIndo-West Pacific. Barramundi use fresh andestuarine waters at different stages of their life cycle.In Australia, barramundi are found in rivers andforeshores, from southern Queensland, north tocentral coastal Western Australia.
Queensland produces about 50% of Australia’swild-caught barramundi.
Over the last few years, the combined harvest fromthe commercial and recreational harvest inQueensland has been around 1000–1200t per year.The recreational harvest comprises about 30% of alllandings.
Aquaculture farms in Queensland produced about500t of barramundi in each of the last two years.This production is anticipated to increase in thefuture.
��������
���
���������
�����
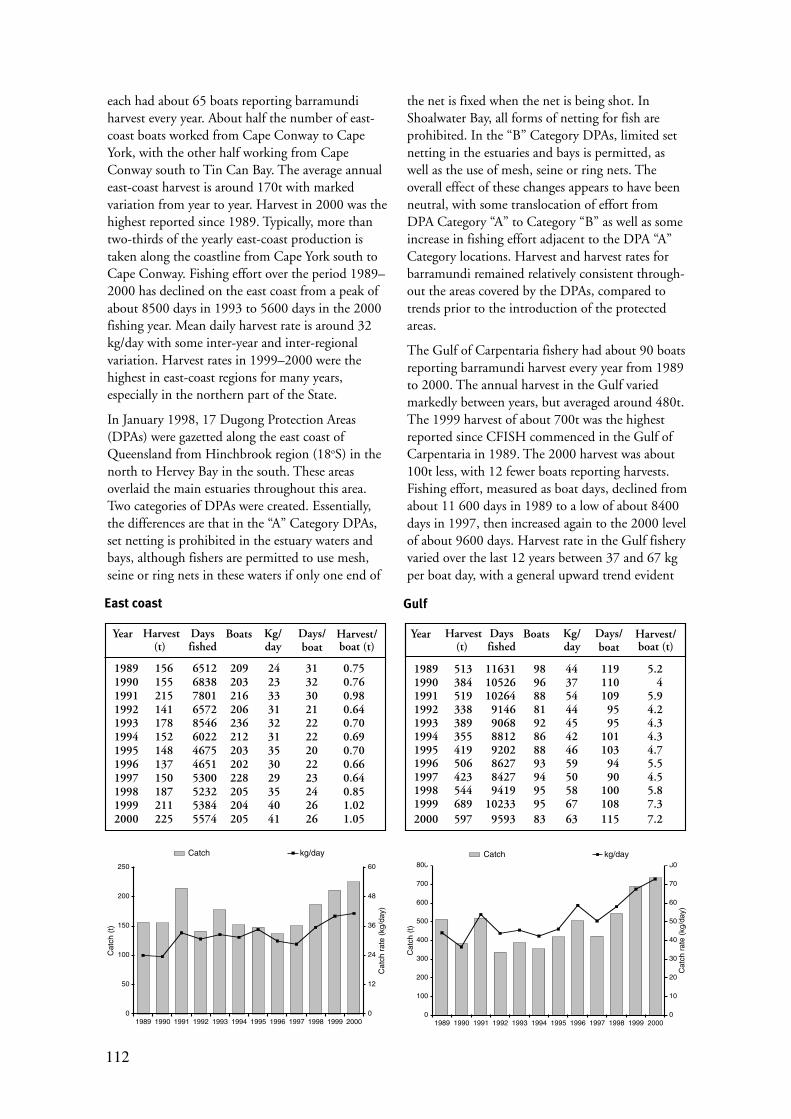
112
each had about 65 boats reporting barramundiharvest every year. About half the number of east-coast boats worked from Cape Conway to CapeYork, with the other half working from CapeConway south to Tin Can Bay. The average annualeast-coast harvest is around 170t with markedvariation from year to year. Harvest in 2000 was thehighest reported since 1989. Typically, more thantwo-thirds of the yearly east-coast production istaken along the coastline from Cape York south toCape Conway. Fishing effort over the period 1989–2000 has declined on the east coast from a peak ofabout 8500 days in 1993 to 5600 days in the 2000fishing year. Mean daily harvest rate is around 32kg/day with some inter-year and inter-regionalvariation. Harvest rates in 1999–2000 were thehighest in east-coast regions for many years,especially in the northern part of the State.
In January 1998, 17 Dugong Protection Areas(DPAs) were gazetted along the east coast ofQueensland from Hinchbrook region (18oS) in thenorth to Hervey Bay in the south. These areasoverlaid the main estuaries throughout this area.Two categories of DPAs were created. Essentially,the differences are that in the “A” Category DPAs,set netting is prohibited in the estuary waters andbays, although fishers are permitted to use mesh,seine or ring nets in these waters if only one end of
the net is fixed when the net is being shot. InShoalwater Bay, all forms of netting for fish areprohibited. In the “B” Category DPAs, limited setnetting in the estuaries and bays is permitted, aswell as the use of mesh, seine or ring nets. Theoverall effect of these changes appears to have beenneutral, with some translocation of effort fromDPA Category “A” to Category “B” as well as someincrease in fishing effort adjacent to the DPA “A”Category locations. Harvest and harvest rates forbarramundi remained relatively consistent through-out the areas covered by the DPAs, compared totrends prior to the introduction of the protectedareas.
The Gulf of Carpentaria fishery had about 90 boatsreporting barramundi harvest every year from 1989to 2000. The annual harvest in the Gulf variedmarkedly between years, but averaged around 480t.The 1999 harvest of about 700t was the highestreported since CFISH commenced in the Gulf ofCarpentaria in 1989. The 2000 harvest was about100t less, with 12 fewer boats reporting harvests.Fishing effort, measured as boat days, declined fromabout 11 600 days in 1989 to a low of about 8400days in 1997, then increased again to the 2000 levelof about 9600 days. Harvest rate in the Gulf fisheryvaried over the last 12 years between 37 and 67 kgper boat day, with a general upward trend evident
0
50
100
150
200
250
1989 1990 1991 1992 1993 1994 1995 1996 1997 1998 1999 2000
Cat
ch (
t)
0
12
24
36
48
60
Cat
ch r
ate
(kg/
day)
Catch kg/day
1989 513 11631 98 44 119 5.21990 384 10526 96 37 110 41991 519 10264 88 54 109 5.91992 338 9146 81 44 95 4.21993 389 9068 92 45 95 4.31994 355 8812 86 42 101 4.31995 419 9202 88 46 103 4.71996 506 8627 93 59 94 5.51997 423 8427 94 50 90 4.51998 544 9419 95 58 100 5.81999 689 10233 95 67 108 7.32000 597 9593 83 63 115 7.2
Gulf
0
100
200
300
400
500
600
700
800
1989 1990 1991 1992 1993 1994 1995 1996 1997 1998 1999 2000
Cat
ch (
t)
0
10
20
30
40
50
60
70
80
Cat
ch r
ate
(kg/
day)
Catch kg/day
1989 156 6512 209 24 31 0.751990 155 6838 203 23 32 0.761991 215 7801 216 33 30 0.981992 141 6572 206 31 21 0.641993 178 8546 236 32 22 0.701994 152 6022 212 31 22 0.691995 148 4675 203 35 20 0.701996 137 4651 202 30 22 0.661997 150 5300 228 29 23 0.641998 187 5232 205 35 24 0.851999 211 5384 204 40 26 1.022000 225 5574 205 41 26 1.05
East coast
Kg/day
Harvest/boat (t)
Daysfished
Harvest(t)
Days/boat
BoatsYear Kg/day
Harvest/boat (t)
Daysfished
Harvest(t)
Days/boat
BoatsYear
113
per boat day, with a general upward trend evidentthrough the 1990s of about 2.5 kg/day in each year.Days on which barramundi were landed each yearincreased from the low level of about 90 days perboat in 1997 to about 115 days per boat in 2000.In 1999 and 2000, about 7t of barramundi werelanded per boat, a marked increase from previousyears.
One of the greatest differences apparent betweenthe commercial fishery in Gulf waters and thoseoperating in different regions of the east coast is inthe time spent fishing for barramundi. In the Gulf,the mean number of days per boat per year is about100 days, while for the whole east coast the yearlymean is around 25 days, with a gradual fall-off sincethe early 1990s. Within the various fishing regionsof the east coast, annual fishing time varied betweenabout 50 days in the Far North region (withmarked changes every year) to around eight days inthe Fraser – Burnett Region.
Recreational harvest
The Queensland Fisheries Service recreationalfisher’s diary program in 1997 and 1999 suggestedthat anglers harvested about 70 000 barramundi in1997 and about 120 000 barramundi in 1999.From the data collected, it is not possible toseparate harvest between the Gulf of Carpentariaand the east coast of Queensland. Most anglers whoresponded to the survey were east-coast residents.They indicated that the majority of their fishingactivities were conducted in east-coast areas, so it islikely that most of the reported angler harvest ofbarramundi also came from the east coast.
The weight of barramundi caught by anglers wasnot recorded in either RFISH survey, so anapproximate total weight of the recreational catchwas calculated using the mean weight of a legal-sized barramundi (approximately 2.5 kg). Thus, theestimated weight of recreational harvest ofbarramundi was 175–225t in 1997 and 275–330tin 1999.
The recreational fishing pressure on barramundi inQueensland may grow in future years, givenfavourable media publicity, improved access to whatwere once remote fishing grounds, and thebarramundi restocking programs that are underwayin coastal waterways along the east coast and thesouthern Gulf of Carpentaria. As well, the put-and-take impoundment fisheries for barramundi arerapidly developing across the State as stockinginitiatives expand for these waterbodies.
Indigenous harvest
Data for the Indigenous sector of the fishery arealmost completely lacking. An Indigenous fishingsurvey procedure was recently developed jointly byDPI, the Queensland Environmental ProtectionAgency and the Balkanu Aboriginal DevelopmentCorporation to provide information on fishingactivities in Indigenous communities, and its use isbeing widely promoted in Queensland.
Biological and ecologicalbackgroundQueensland barramundi have an annual summerspawning period, with the timing and duration ofbreeding varying between regions, different riversystems, and from year to year, depending on watertemperature and salinity. In the northern Gulf andthe Far North region of the far Northern east coast,barramundi spawn as early as October, while stocksin southern areas such as Rockhampton may spawnas late as March or April. Spawning activity peaksduring new- and full-moon periods during thesummer months.
Generally, fish spawn around river mouths so thatlarval and juvenile barramundi can use the manycoastal swamps and lagoons that form during themonsoon season as protected food-rich nurseryhabitats. Annual wet season rainfall influences adultspawning success and juvenile recruitment.
Juvenile barramundi are highly dependent onestuarine and freshwater habitats. Juveniles movefrom the estuarine areas upstream into freshwaterhabitats to grow, and remain there for a year ormore. During the dry season, barramundi maybecome landlocked in up-river waterholes andlagoons of river systems, and move to tidal waterswhen access is opened with flood rains. River damsand stream barriers restrict the access to and fromfreshwater riverine juvenile habitats, and canprevent the participation of adult fish in spawningruns to coastal waters.
For many years, a direct correlation has beenrecognised between monthly discharge rates inrivers and the monthly barramundi harvest fromthose river systems. Typically, barramundi catchesare highest in the months immediately before, andjust after, the summer breeding season duringwhich the taking of the species is not permitted.
Breeding success in barramundi can be enhanced inhigh rainfall years, and a strong year class recruiting
114
to the fishery some years later often follows suchevents. Rainfall levels in the southern Gulf ofCarpentaria hinterland have been shown toinfluence the barramundi harvest in adjacent coastalwaters for up to some seven years later. Thisrelationship allows for predictions of likely catchlevels in the fishery for several years in advance, andis an aid to fishery management planning as well asbusiness planning by operators in the fishery.
There are genetically distinct barramundi stocks inthe Gulf of Carpentaria and along the eastQueensland coast, with maturity of each stockreached at different fish sizes. The stocks may begrouped into those where barramundi mature at alarge size and usually greater age, and those wherematurity is attained at a much smaller size andearlier in life. The late-maturing fish stock generallyoccur in the southern part of the Gulf and alongthe east coast of Queensland. The early-maturingfish stock is found on both coastlines around CapeYork Peninsula north of about 13oS.
Barramundi from the late-maturing stock attain theminimum legal size of 580–600 mm TL at aboutthree years of age and are usually still sexuallyimmature at this size. Sexual maturity in this stockusually occurs when the fish are older and larger —at about 4–5 years of age. These barramunditypically mature first as male fish, then changegender to female from about 90 cm and at about7–8 years of age. Female barramundi can live formore than 30 years and reach 1.5m TL and 60 kgbody weight. The females are highly fecund, withbroodstock in aquaculture hatcheries producingabout 300 000 eggs per kg of body weight at eachspawning event during the breeding season.Consequently, large female barramundi are vital insustaining egg production in wild populations.
Fish from the early-maturing stock on far northernCape York Peninsula can become sexually active inthe second year of life, maturing as males fromabout 30 cm in length, with females first appearingas small as 50–60 cm TL.
MarketingWild-caught barramundi product is sold withinQueensland and interstate. The predominant saleform is frozen fillets (especially from the Gulf ofCarpentaria), and iced gilled-and-gutted fish. Theprice paid to fishers for frozen fillet is usuallybetween $10–11/kg.
A premium market has recently developed forsupply of iki-jimi bled iced whole fish, especially for
southern state capitals. Such product is currentlybringing returns of up to $7/kg for wholebarramundi and represents a value-adding opportunityto fishers compared with the more usual fillet sale.
Marketers are not interested in very large fishbecause the fillet size is too large (apart from“display” fish for restaurants) and because of thecompetition for consumer purchasing fromimported barramundi product and other localinshore and reef-fish species. Premium prices arepaid for barramundi at the smaller end of the sizerange.
Queensland barramundi compete with similarproduct from the Northern Territory, farmed fishwithin Australia, and imports from South-East Asia.
Current resource statusTrends
Harvests from the Gulf and the east coastindicate that 1999–2000 were robust years forthe Queensland barramundi fishery. Statewide,commercial landings have nearly doubled since1992, following a decline over the precedingfive years when levels of effort fell sharply.Harvest rates for both the Gulf and east-coastnet fisheries have also trended upwards, butwith substantial inter-year variation.
The two Statewide surveys used to estimaterecreational barramundi catch show thatrecreational harvest is equal to or more thanthe commercial harvest on the east coast.
Comments
Adding to the complexity of the analyses fromthe fishery-dependent database is the effect ofclimate, especially rainfall, on barramundifishery production. Flood rains in 1991promoted a very strong recruitment pulse inthat year in both Gulf and east-coast districts.The 1991 high rainfall event contributed tothe high levels of harvest demonstrated in1995–96. Lower rainfall in 1992–93,especially in the Gulf area, can be associatedwith the lower level of barramundi harvest in1997. The high harvest levels of 1998–2000,especially in the Gulf fishery, can be attributed,in part, to elevated levels of fishing effort.However, the strength of the recruitment tothe fishery in those years is indicated by the risein harvest rates.
115
Detailed analysis of harvest and effort trends inthe Gulf fishery, using the CFISH database,suggests that an underlying fundamentalincrease in the size of the barramundi resourcehas occurred in Gulf waters since the early1980s. Modelling exercises have establishedthat over a 20-year period, the stocks haveimproved at a rate of up to 1.8% per annum.At current recorded levels of fishing effort, theGulf barramundi fishery is regarded as beingfully exploited but sustainable.
For the moment, the status of the barramundiresource on the east coast is much less easilydetermined when the available CFISHinformation is examined. Additional data overlonger timescales will be required before anyoutputs from the fishery models can be viewedwith confidence. In addition, the effects ofrecreational fishing pressure and harvest willneed to be incorporated into any models.
New management arrangements that wereintroduced to the Gulf fishery in 1997 and1999 have reduced the length of the annualfishing season and increased the minimum sizeat which barramundi may be legally harvested.
On the east coast, the implementation ofmeasures to protect dugong populations in1997–98 reduced net fisher numbers througha buy-back scheme, and changed the type ofnet fishing that could be undertaken in theDPAs. Reported level of effort in the east-coastcommercial fishery was lower in 1998 than in1997, and increased slightly to 2000. Bothharvest and harvest rates were elevated during1999–2000. Isolating the effect of thesemeasures from the confounding influences ofclimatic and other environmental variablesneeds to be undertaken as a matter of priority.
Fishery-independent data are required toprovide an assessment of resource status that isnot constrained by the limitations ofinformation from fishing operators withregulated harvesting gear, and working toeconomic imperatives. The QueenslandFisheries Service commenced a Long TermMonitoring Programme in 1999 which focuseson developing the appropriate researchdatabase over time to do this for a suite of keyspecies, and includes barramundi. Since April2000, the programme has collected details of
barramundi population size/age frequency andsex structure from six major fishing groundsaround the State each year, in accordance witha standardised procedure that involves researchnetting and commercial fishery harvestsurveys. It is expected that, over the long term,the initiative will be an annual event revealingtrends in resource abundance and conditionacross Queensland, and it will contribute atregular intervals to stock assessments on thenominated fishing grounds. A preliminarystock assessment analysis will be undertaken inmid-2002.
Within the Great Barrier Reef World HeritageArea, additional monitoring of barramundiresources is being conducted through fundingfrom the Reef CRC. The data collectedcomplements that derived from the QFSprogramme to provide an enhancedinformation source for management.
Further readingDunstan, D.J. (1959) The barramundi Lates
calcarifer (Bloch) in Queensland waters. Tech.Pap. Div. Fish. CSIRO No 5, 22 pp.
Garrett, R.N. (1987) Reproduction in QueenslandBarramundi (Lates calcarifer) Pp.38–43 inCopeland, J.W. and Grey D.L. (eds).Management of wild and cultured seabass/barramundi (Lates calcarifer). ACIARProceedings No 20, 210 pp.
Gribble, N.A. (ed) (1998) Tropical ResourceAssessment Program: fisheries stock assessmentworkshop. Conference and WorkshopProceedings, Department of Primary Industries.QC98003, 54 pp.
Russell, D.J. (1988) An assessment of the eastQueensland inshore gill net fishery. InformationSeries, Department of Primary Industries.QI88024, 57 pp.
Williams, L. (1998) Gulf set net fishery —monitoring and assessment. Pp. 5–27 in Garrett,R.N. (ed) Biology and harvest of tropical fishes inthe Queensland Gulf of Carpentaria gill net fishery.Information Series, Department of PrimaryIndustries. QI98018, 119 pp.
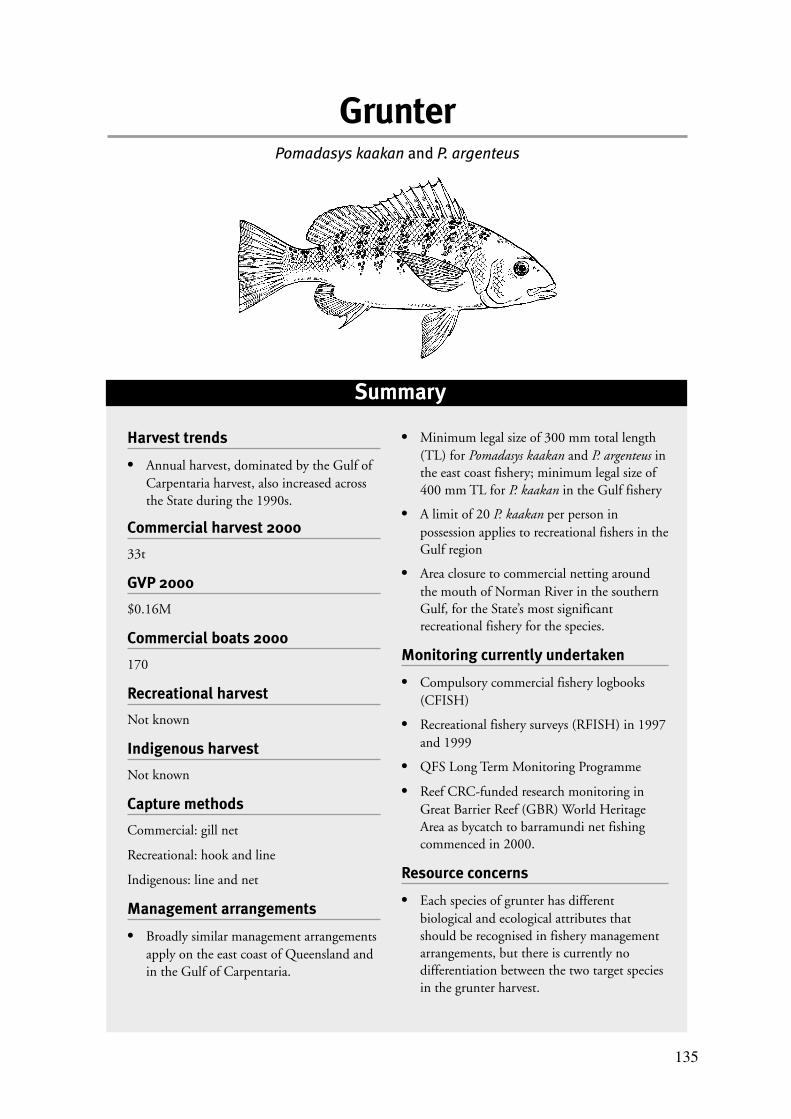
135
Summary
Harvest trends
• Annual harvest, dominated by the Gulf ofCarpentaria harvest, also increased acrossthe State during the 1990s.
Commercial harvest 2000
33t
GVP 2000
$0.16M
Commercial boats 2000
170
Recreational harvest
Not known
Indigenous harvest
Not known
Capture methods
Commercial: gill net
Recreational: hook and line
Indigenous: line and net
Management arrangements
• Broadly similar management arrangementsapply on the east coast of Queensland andin the Gulf of Carpentaria.
• Minimum legal size of 300 mm total length(TL) for Pomadasys kaakan and P. argenteus inthe east coast fishery; minimum legal size of400 mm TL for P. kaakan in the Gulf fishery
• A limit of 20 P. kaakan per person inpossession applies to recreational fishers in theGulf region
• Area closure to commercial netting aroundthe mouth of Norman River in the southernGulf, for the State’s most significantrecreational fishery for the species.
Monitoring currently undertaken
• Compulsory commercial fishery logbooks(CFISH)
• Recreational fishery surveys (RFISH) in 1997and 1999
• QFS Long Term Monitoring Programme
• Reef CRC-funded research monitoring inGreat Barrier Reef (GBR) World HeritageArea as bycatch to barramundi net fishingcommenced in 2000.
Resource concerns
• Each species of grunter has differentbiological and ecological attributes thatshould be recognised in fishery managementarrangements, but there is currently nodifferentiation between the two target speciesin the grunter harvest.
GrunterPomadasys kaakan and P. argenteus
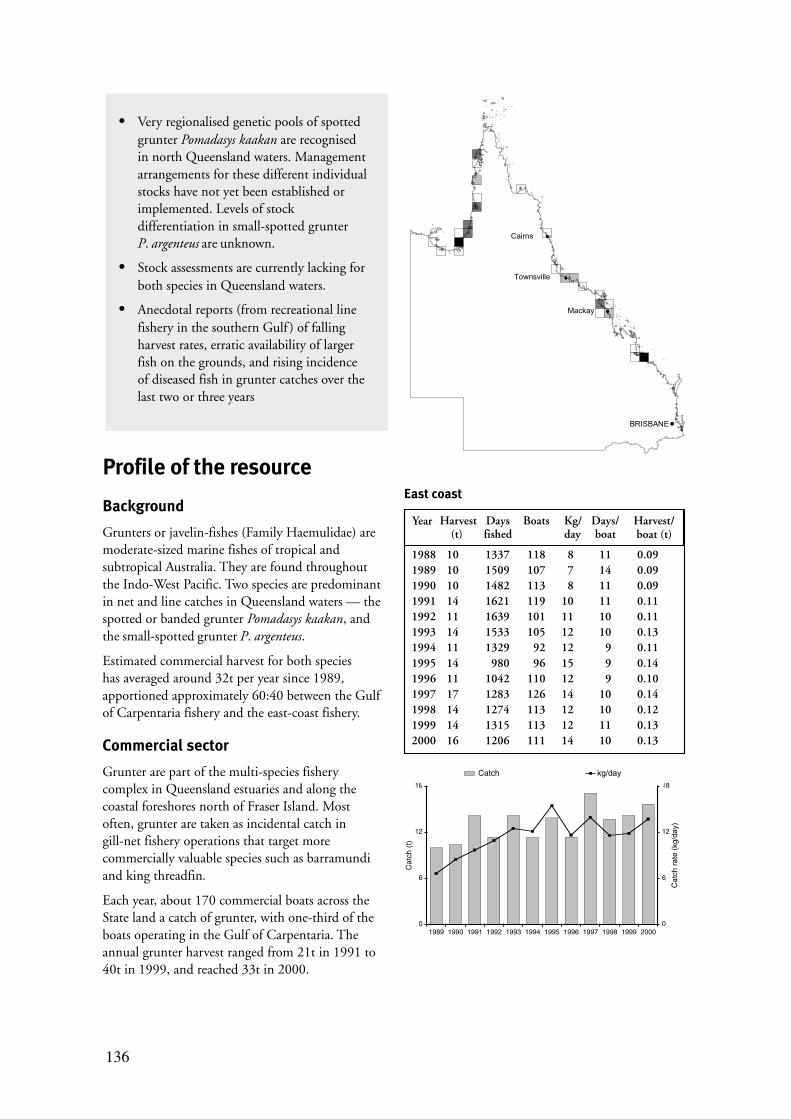
136
• Very regionalised genetic pools of spottedgrunter Pomadasys kaakan are recognisedin north Queensland waters. Managementarrangements for these different individualstocks have not yet been established orimplemented. Levels of stockdifferentiation in small-spotted grunterP. argenteus are unknown.
• Stock assessments are currently lacking forboth species in Queensland waters.
• Anecdotal reports (from recreational linefishery in the southern Gulf ) of fallingharvest rates, erratic availability of largerfish on the grounds, and rising incidenceof diseased fish in grunter catches over thelast two or three years
Profile of the resource
Background
Grunters or javelin-fishes (Family Haemulidae) aremoderate-sized marine fishes of tropical andsubtropical Australia. They are found throughoutthe Indo-West Pacific. Two species are predominantin net and line catches in Queensland waters — thespotted or banded grunter Pomadasys kaakan, andthe small-spotted grunter P. argenteus.
Estimated commercial harvest for both specieshas averaged around 32t per year since 1989,apportioned approximately 60:40 between the Gulfof Carpentaria fishery and the east-coast fishery.
Commercial sector
Grunter are part of the multi-species fisherycomplex in Queensland estuaries and along thecoastal foreshores north of Fraser Island. Mostoften, grunter are taken as incidental catch ingill-net fishery operations that target morecommercially valuable species such as barramundiand king threadfin.
Each year, about 170 commercial boats across theState land a catch of grunter, with one-third of theboats operating in the Gulf of Carpentaria. Theannual grunter harvest ranged from 21t in 1991 to40t in 1999, and reached 33t in 2000.
��������
���
���������
�����
1988 10 1337 118 8 11 0.091989 10 1509 107 7 14 0.091990 10 1482 113 8 11 0.091991 14 1621 119 10 11 0.111992 11 1639 101 11 10 0.111993 14 1533 105 12 10 0.131994 11 1329 92 12 9 0.111995 14 980 96 15 9 0.141996 11 1042 110 12 9 0.101997 17 1283 126 14 10 0.141998 14 1274 113 12 10 0.121999 14 1315 113 12 11 0.132000 16 1206 111 14 10 0.13
East coast
0
6
12
18
1989 1990 1991 1992 1993 1994 1995 1996 1997 1998 1999 2000
Cat
ch (
t)
0
6
12
18
Cat
ch r
ate
(kg/
day)
Catch kg/day
Kg/day
Harvest/boat (t)
Daysfished
Harvest(t)
Days/boat
BoatsYear
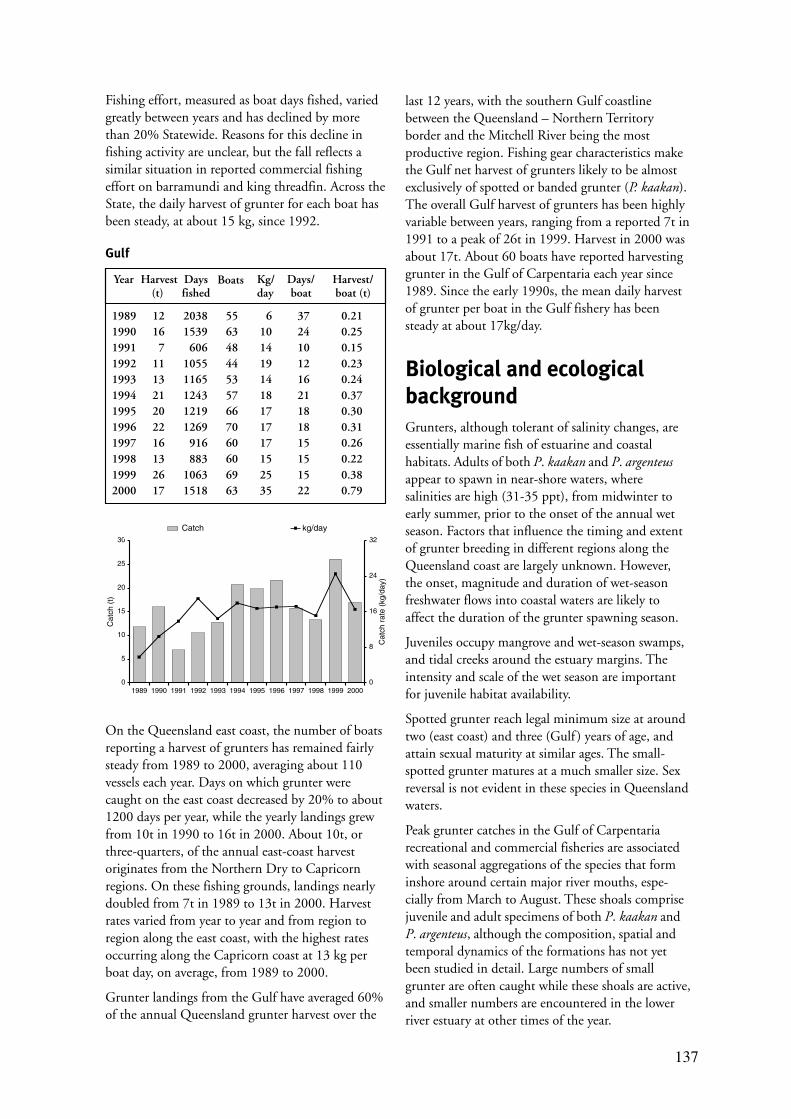
137
Fishing effort, measured as boat days fished, variedgreatly between years and has declined by morethan 20% Statewide. Reasons for this decline infishing activity are unclear, but the fall reflects asimilar situation in reported commercial fishingeffort on barramundi and king threadfin. Across theState, the daily harvest of grunter for each boat hasbeen steady, at about 15 kg, since 1992.
last 12 years, with the southern Gulf coastlinebetween the Queensland – Northern Territoryborder and the Mitchell River being the mostproductive region. Fishing gear characteristics makethe Gulf net harvest of grunters likely to be almostexclusively of spotted or banded grunter (P. kaakan).The overall Gulf harvest of grunters has been highlyvariable between years, ranging from a reported 7t in1991 to a peak of 26t in 1999. Harvest in 2000 wasabout 17t. About 60 boats have reported harvestinggrunter in the Gulf of Carpentaria each year since1989. Since the early 1990s, the mean daily harvestof grunter per boat in the Gulf fishery has beensteady at about 17kg/day.
Biological and ecologicalbackgroundGrunters, although tolerant of salinity changes, areessentially marine fish of estuarine and coastalhabitats. Adults of both P. kaakan and P. argenteusappear to spawn in near-shore waters, wheresalinities are high (31-35 ppt), from midwinter toearly summer, prior to the onset of the annual wetseason. Factors that influence the timing and extentof grunter breeding in different regions along theQueensland coast are largely unknown. However,the onset, magnitude and duration of wet-seasonfreshwater flows into coastal waters are likely toaffect the duration of the grunter spawning season.
Juveniles occupy mangrove and wet-season swamps,and tidal creeks around the estuary margins. Theintensity and scale of the wet season are importantfor juvenile habitat availability.
Spotted grunter reach legal minimum size at aroundtwo (east coast) and three (Gulf ) years of age, andattain sexual maturity at similar ages. The small-spotted grunter matures at a much smaller size. Sexreversal is not evident in these species in Queenslandwaters.
Peak grunter catches in the Gulf of Carpentariarecreational and commercial fisheries are associatedwith seasonal aggregations of the species that forminshore around certain major river mouths, espe-cially from March to August. These shoals comprisejuvenile and adult specimens of both P. kaakan andP. argenteus, although the composition, spatial andtemporal dynamics of the formations has not yetbeen studied in detail. Large numbers of smallgrunter are often caught while these shoals are active,and smaller numbers are encountered in the lowerriver estuary at other times of the year.
On the Queensland east coast, the number of boatsreporting a harvest of grunters has remained fairlysteady from 1989 to 2000, averaging about 110vessels each year. Days on which grunter werecaught on the east coast decreased by 20% to about1200 days per year, while the yearly landings grewfrom 10t in 1990 to 16t in 2000. About 10t, orthree-quarters, of the annual east-coast harvestoriginates from the Northern Dry to Capricornregions. On these fishing grounds, landings nearlydoubled from 7t in 1989 to 13t in 2000. Harvestrates varied from year to year and from region toregion along the east coast, with the highest ratesoccurring along the Capricorn coast at 13 kg perboat day, on average, from 1989 to 2000.
Grunter landings from the Gulf have averaged 60%of the annual Queensland grunter harvest over the
1989 12 2038 55 6 37 0.211990 16 1539 63 10 24 0.251991 7 606 48 14 10 0.151992 11 1055 44 19 12 0.231993 13 1165 53 14 16 0.241994 21 1243 57 18 21 0.371995 20 1219 66 17 18 0.301996 22 1269 70 17 18 0.311997 16 916 60 17 15 0.261998 13 883 60 15 15 0.221999 26 1063 69 25 15 0.382000 17 1518 63 35 22 0.79
Gulf
0
5
10
15
20
25
30
1989 1990 1991 1992 1993 1994 1995 1996 1997 1998 1999 2000
Cat
ch (
t)
0
8
16
24
32
Cat
ch r
ate
(kg/
day)
Catch kg/day
Kg/day
Harvest/boat (t)
Daysfished
Harvest(t)
Days/boat
BoatsYear
138
Genetic analyses suggest that distinct stocks ofspotted grunter occur within the Gulf ofCarpentaria and along the east Queensland coast.No equivalent details are yet available for the small-spotted grunter.
MarketingGrunters are mainly sold within Queensland asfrozen fillet (especially product from Gulf ofCarpentaria and far northern east-coast fisheries)and iced gilled-and-gutted fish. Grunters are fine-eating table-fish, and are readily sold in localmarkets near the east-coast fishing grounds, and inmajor coastal population centres.
Frozen fillets of grunter return about $5–5.50/kg tocommercial fishers, and iki jimi iced whole fishabout $4/kg. The demand in southern states for ikijimi whole barramundi and threadfins apparentlydoes not extend to grunters; they have a body shapethat enables relatively poor recovery of useable fleshcompared with the other named species, so they arenot well favoured by processors.
Comments
Grunter landings constitute only a minorcomponent of the inshore commercial fishery,so harvests and harvest rate data from thecommercial logbook programme do notprovide sufficient information to judge stockstatus for the grunter species.
Recreational fishery activity, by contrast, maybe more highly focused (such as in theseasonal line fisheries for spotted grunter atKarumba and Weipa in the Gulf ), andperformance data from this sector may bemore useful in establishing trends over time.Unfortunately, the information from thissector is currently very limited.
The lack of data prevents, for the present, anyreliable stock assessment of either P. kaakan orP. argenteus in Queensland waters.
Current resource status
Trends
Production from the commercial fishery hasvaried along with reported levels of fishingeffort. There was an overall increase in totalharvest and harvest rate through the 1990s.Very strong growth in fishing activity oc-curred in 1999, especially in the Gulf fishery.This was, perhaps, a result of increasedgrunter abundance — or an increased level ofbycatch from target fishing for other speciesin certain locations, as fishers reacted to newmarket opportunities.
Elsewhere in the State, the landings exhibit ahighly variable yearly performance across allregions, strongly supporting the notion thatcommercial grunter harvest is usually only anincidental result of targeted fishing activityfor higher-valued species.
Further readingBade, T.M. (1989) Aspects of the biology of grunter
(Teleostei: Haemulidae) from north Queenslandwaters. PhD Thesis. James Cook University.228 pp.
Garrett, R.N. (1998) Biology and harvest of tropicalfishes in the Queensland Gulf of Carpentariagillnet fishery. Information Series, Departmentof Primary Industries. QI98018, 119 pp.
McKay, R. (1984) Classification of the grunters andjavelin fishes of Australia. Australian Fisheries,43: 37–40.
Russell, D.J. (1988) An assessment of the eastQueensland inshore gill net fishery. Informationseries, Department of Primary Industries.QI88024, 57 pp.
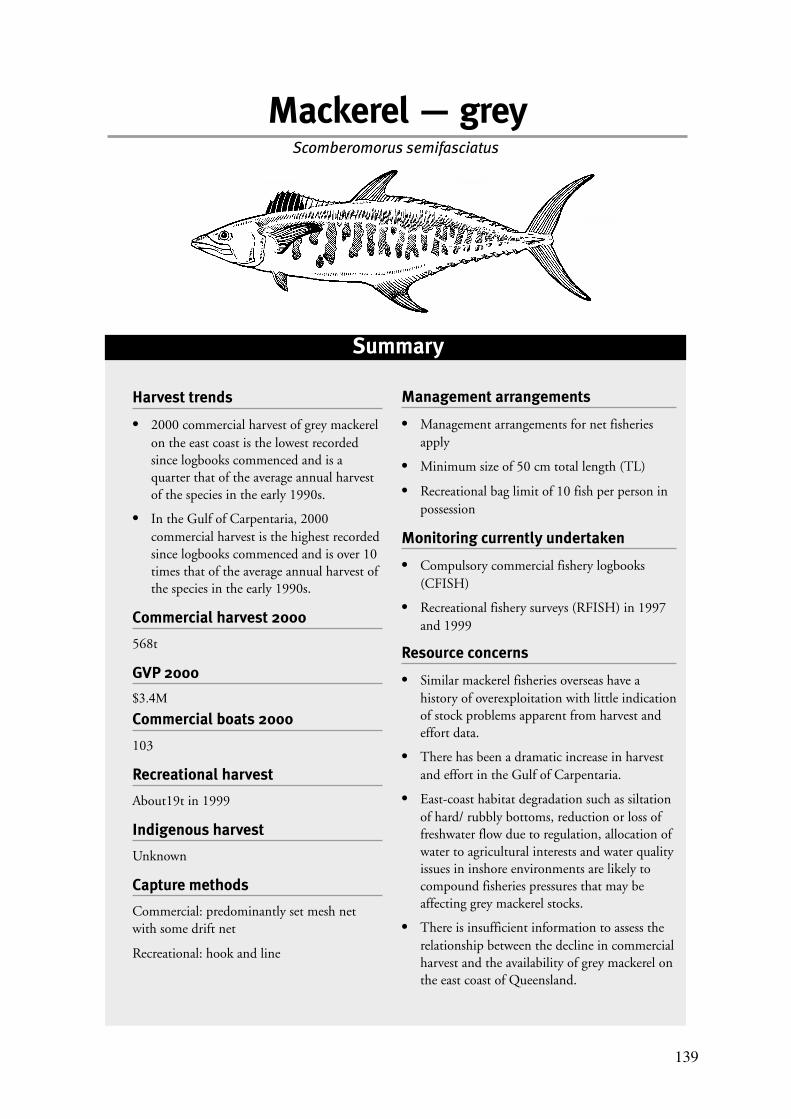
139
Summary
Mackerel — grey
Harvest trends
• 2000 commercial harvest of grey mackerelon the east coast is the lowest recordedsince logbooks commenced and is aquarter that of the average annual harvestof the species in the early 1990s.
• In the Gulf of Carpentaria, 2000commercial harvest is the highest recordedsince logbooks commenced and is over 10times that of the average annual harvest ofthe species in the early 1990s.
Commercial harvest 2000
568t
GVP 2000
$3.4M
Commercial boats 2000
103
Recreational harvest
About19t in 1999
Indigenous harvest
Unknown
Capture methods
Commercial: predominantly set mesh netwith some drift net
Recreational: hook and line
Management arrangements
• Management arrangements for net fisheriesapply
• Minimum size of 50 cm total length (TL)
• Recreational bag limit of 10 fish per person inpossession
Monitoring currently undertaken
• Compulsory commercial fishery logbooks(CFISH)
• Recreational fishery surveys (RFISH) in 1997and 1999
Resource concerns
• Similar mackerel fisheries overseas have ahistory of overexploitation with little indicationof stock problems apparent from harvest andeffort data.
• There has been a dramatic increase in harvestand effort in the Gulf of Carpentaria.
• East-coast habitat degradation such as siltationof hard/ rubbly bottoms, reduction or loss offreshwater flow due to regulation, allocation ofwater to agricultural interests and water qualityissues in inshore environments are likely tocompound fisheries pressures that may beaffecting grey mackerel stocks.
• There is insufficient information to assess therelationship between the decline in commercialharvest and the availability of grey mackerel onthe east coast of Queensland.
Scomberomorus semifasciatus
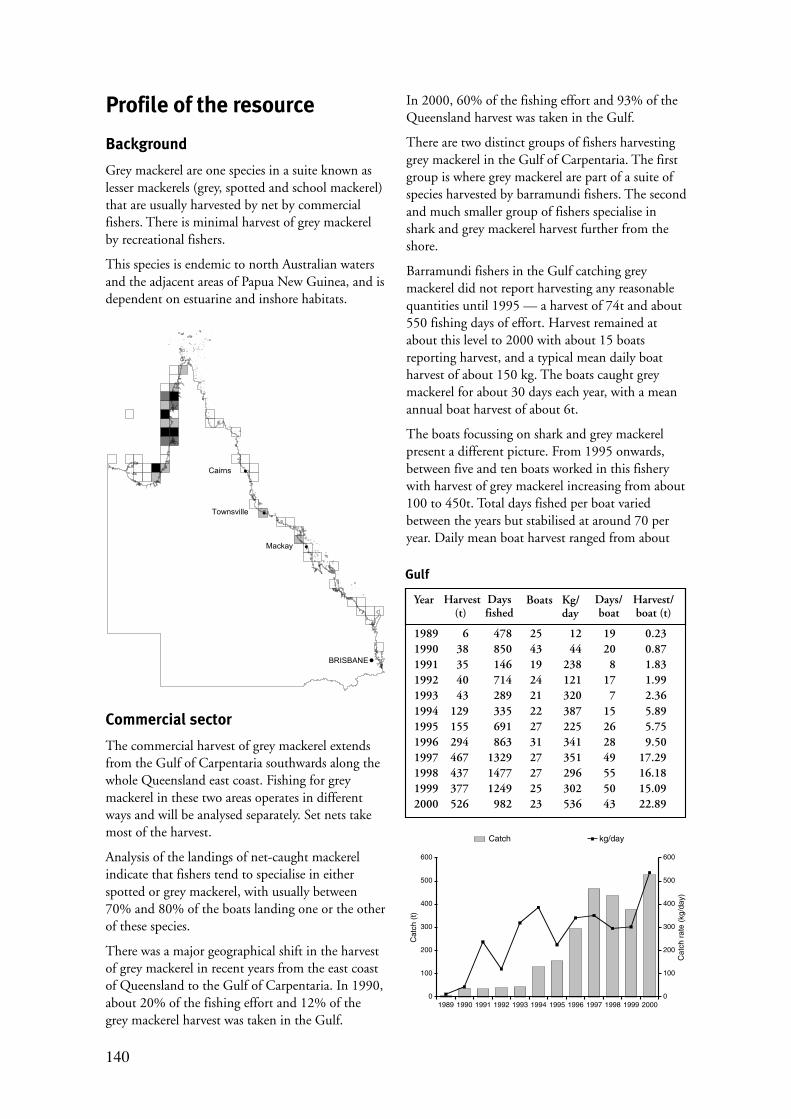
140
Profile of the resource
Background
Grey mackerel are one species in a suite known aslesser mackerels (grey, spotted and school mackerel)that are usually harvested by net by commercialfishers. There is minimal harvest of grey mackerelby recreational fishers.
This species is endemic to north Australian watersand the adjacent areas of Papua New Guinea, and isdependent on estuarine and inshore habitats.
In 2000, 60% of the fishing effort and 93% of theQueensland harvest was taken in the Gulf.
There are two distinct groups of fishers harvestinggrey mackerel in the Gulf of Carpentaria. The firstgroup is where grey mackerel are part of a suite ofspecies harvested by barramundi fishers. The secondand much smaller group of fishers specialise inshark and grey mackerel harvest further from theshore.
Barramundi fishers in the Gulf catching greymackerel did not report harvesting any reasonablequantities until 1995 — a harvest of 74t and about550 fishing days of effort. Harvest remained atabout this level to 2000 with about 15 boatsreporting harvest, and a typical mean daily boatharvest of about 150 kg. The boats caught greymackerel for about 30 days each year, with a meanannual boat harvest of about 6t.
The boats focussing on shark and grey mackerelpresent a different picture. From 1995 onwards,between five and ten boats worked in this fisherywith harvest of grey mackerel increasing from about100 to 450t. Total days fished per boat variedbetween the years but stabilised at around 70 peryear. Daily mean boat harvest ranged from about
��������
���
���������
�����
Commercial sector
The commercial harvest of grey mackerel extendsfrom the Gulf of Carpentaria southwards along thewhole Queensland east coast. Fishing for greymackerel in these two areas operates in differentways and will be analysed separately. Set nets takemost of the harvest.
Analysis of the landings of net-caught mackerelindicate that fishers tend to specialise in eitherspotted or grey mackerel, with usually between70% and 80% of the boats landing one or the otherof these species.
There was a major geographical shift in the harvestof grey mackerel in recent years from the east coastof Queensland to the Gulf of Carpentaria. In 1990,about 20% of the fishing effort and 12% of thegrey mackerel harvest was taken in the Gulf.
0
100
200
300
400
500
600
1989 1990 1991 1992 1993 1994 1995 1996 1997 1998 1999 2000
Cat
ch (
t)
0
100
200
300
400
500
600
Cat
ch r
ate
(kg/
day)
Catch kg/day
1989 6 478 25 12 19 0.231990 38 850 43 44 20 0.871991 35 146 19 238 8 1.831992 40 714 24 121 17 1.991993 43 289 21 320 7 2.361994 129 335 22 387 15 5.891995 155 691 27 225 26 5.751996 294 863 31 341 28 9.501997 467 1329 27 351 49 17.291998 437 1477 27 296 55 16.181999 377 1249 25 302 50 15.092000 526 982 23 536 43 22.89
Gulf
Kg/day
Harvest/boat (t)
Daysfished
Harvest(t)
Days/boat
BoatsYear

141
400 to 750 kg. In 2000 the highest daily meanharvest probably occurred as the result of five fishersbeing permitted to use twice the maximum lengthof net that could be used prior to then. Annualharvest per boat each year was typically about 42t.About 70% of the Gulf harvest occurs from July toSeptember.
The harvest of grey mackerel on the east coast ofQueensland presents a different picture. From ahigh of around 250t per year from 1988 to 1990,annual harvest declined to around 80t in 1996,jumped to about 150t in 1997, then declined againto about 40t in 2000. Over the total period, boatnumbers reporting harvest declined from around250 boats at the start of the period to between 80and 130 boats from 1993 to 2000. Over the 13years, mean daily boat harvest was about 80 kg witha range between about 60 and 105 kg. There wasno obvious upward or downward trend. Theseasonal nature of much of the grey mackerelfishery on the east coast is demonstrated by the factthat the mean days fished per boat year were only7 to 14 days. The mean annual boat harvest from1993 to 2000 was about 1t. The overall perform-ance of the east-coast grey mackerel annual harvestis strongly correlated to the number of boatsharvesting grey mackerel and the mean number ofdays fished each year.
The Northern Dry, Fraser – Burnett, and Swainsregions dominate grey mackerel production on theeast coast of Queensland with 85% of east-coastharvest.
There are two distinct phases in the Northern Dryregion. From 1988 to 1990 grey mackerel landingswere about 100t each year with about 50 boatsinvolved in the harvest. Mean annual daily harvestwas about 100 kg. Boats harvested fish, on average,for 22 days each year and landed about 2.2t eachyear. From 1991 to 2000, annual harvest droppedto about 40t each year. Boats harvesting greymackerel steadily declined in number, from themid-thirties to the low-twenties, and days fished perboat declined to about 10 days each year. Meandaily harvest remained relatively consistent at about115 kg/day with some inter-year variation. In thisregion, about 70% of the harvest occurs inSeptember and October.
In the Fraser – Burnett region there were also twophases. Grey mackerel harvest was in the 75 to 110trange from 1988 to 1992 before declining toaround 15t, on average, from 1993 to 2000.During the first phase, about 70 boats reportedharvest of this fish, with a mean daily harvest ofabout 100kg/day and boats typically landed greymackerel for about 13 days per year. Mean annualharvest per boat was about 1.5t. In the secondphase, from 1993 to 2000, boats reporting greymackerel harvest steadily declined from about38 to 16. Mean daily harvest was less than half ofthat achieved in the first phase — a typical meanannual daily harvest was about 50 kg with a rangeof between 38 and 80 kg. Mean number of boatdays fished each year when grey mackerel wereharvested was about 10, with a range of 9 to 17days. There are two main harvest periods in theFraser – Burnett region, with each contributingabout 25% of the annual catch. They are April andMay and later in the year during October andNovember.
Annual harvest from the Swains region was about14t with a range of 5 to 27t. There was no upwardor downward trend in annual harvest and,compared to the other two areas, production wasremarkably consistent. Mean daily boat harvest washighly variable ranging between 22 and 146 kg witha mean of about 85 kg. However, from 1990variability reduced, with a range between 66 and146 kg each day.
Associated species caught with grey mackerelinclude shark, trevally, threadfin, queenfish,0
50
100
150
200
250
300
1988 1989 1990 1991 1992 1993 1994 1995 1996 1997 1998 1999 2000
Cat
ch (
t)
0
20
40
60
80
100
120
Cat
ch r
ate
(kg/
day)
Catch kg/day
East coast
1989 241 3707 259 65 14 0.931990 285 3229 231 90 14 1.221991 163 2905 242 62 11 0.651992 155 1913 174 105 9 0.911993 84 1517 131 76 6 0.491994 67 1184 110 83 7 0.601995 55 947 94 58 9 0.551996 75 980 97 79 10 0.771997 152 1604 123 97 12 1.221998 85 1081 98 79 11 0.881999 89 915 83 106 10 1.022000 42 680 80 65 8 0.52
Kg/day
Harvest/boat (t)
Daysfished
Harvest(t)
Days/boat
BoatsYear
142
long-tail tuna and pomfret. Bycatch and discard ofqueenfish and long-tail tuna appears to be aproblem on occasions, although a market seems tobe developing for queenfish.
Recreational sector
Three surveys provide information about lessermackerel harvest. A telephone survey in 1994–95specifically targeted recreational fishers who claimedto have caught these mackerels in the previous year,and there were two Queensland Fisheries Servicerecreational fishing surveys (RFISH) in 1997 and1999. The 1994–95 survey found that mostrecreational anglers could not accurately distinguishbetween the three species of lesser mackerel, whichare consequently grouped together as lessermackerel.
The 1994–95 survey estimated that about 19 000boats were used to target lesser mackerel inQueensland waters with a total effort estimated tobe 120 000 boat days. The total number of lessermackerel caught and kept by occupants of theseboats was estimated to be 370 000.
A Statewide diary survey of fishers contacted in the1994–95 survey estimated the recreational greymackerel harvest for 1995 to be about 12t.This was about 4% of total grey mackerel harvestfor Queensland.
The 1997 RFISH survey found that about 400 000mackerel were harvested, of which an estimated8000 were grey mackerel with a harvest weight ofabout 18t, comprising about 4% of the total Stategrey mackerel harvest.
The 1999 RFISH survey suggested that about220 000 mackerel were harvested, of which about5000 were grey mackerel with a harvest weight of19t, comprising about 3% of the total State greymackerel harvest.
Biological and ecologicalbackgroundGrey mackerel are distributed in the waters ofnorthern Australia from Shark Bay in WesternAustralia to northern New South Wales andsouthern Papua New Guinea. They are a pelagicspecies that are generally captured in inshore watersof higher turbidity than waters frequented byspotted mackerel. There is some evidence thatlarvae and juveniles are dependent on estuarineand coastal nursery habitats, and fishers report
freshwater flows are important to availability of greymackerel.
Grey mackerel appear to spawn across their entireQueensland distribution between October andJanuary. They are fast growing, with total length(TL) at first maturity for females at 75 cm and formales at 64 cm, at between one and two years ofage. The oldest female and male were aged 12 and11 years respectively. The female was 104 cm TLand the male 98 cm TL.
Grey mackerel are pelagic predators, feedingexclusively on baitfish (sardines, herrings).
The stock structure of grey mackerel is unclear.There is genetic differentiation between fish fromthe Gulf of Carpentaria and those from theQueensland east coast, however no evidence ofstock differentiation amongst the east-coastpopulation has been found.
Grey mackerel are captured predominantly by thecommercial net fishery. Insufficient numbers of fishhave been tagged or recaptured to investigate fishmovement patterns or assist in elucidation of east-coast stock structure.
MarketingThe markets for lesser mackerels have changedsubstantially in the last five years with thedevelopment of valuable export markets, primarilyin Japan, for whole fresh fish. Various domestic andexport markets have different product specificationsand many commercial fishers are adapting to theserequirements.
The export market requirement of whole fresh fishallows fishers to increase effective effort in thefishery when fish are seasonally abundant andweather conditions are conducive to fishing.Prior to the development of the export market,fishers had to spend considerable time filleting andprocessing the harvest after a couple of days ofsuccessful fishing, when they could have been usingthis time to continue fishing.
Queensland east-coast grey mackerel harvest wasprimarily filleted for use in the domestic fish andchip trade and sold fresh in Brisbane and Sydneymarkets. A significant part of the harvest is nowexported to Japan and Taiwan or sold on thedomestic market as whole product.
The dominant product form of grey mackerel fromthe Gulf of Carpentaria is frozen fillet, a significantamount of which is sold in north Queensland.
143
Current resource status
Trends
There was a dramatic increase in greymackerel harvest from 1988 to 2000 on aStatewide basis. East-Coast harvest and effortdecreased dramatically from the late 1980sand early 1990s whilst the Gulf ofCarpentaria harvest increased dramaticallyfrom 1995 to 2000.
Comments
The dramatic changes in commercial harvestof grey mackerel in the two major harvestareas of the east coast of Queensland and theGulf of Carpentaria should be viewed withconcern.
The grey mackerel fisheries on the east coastof Queensland and in the Gulf of Carpentariashould be assessed separately. This is becauseof separate populations in the Gulf and on theeast coast and major differences in how thefisheries are managed and operated. There isno indication of movement or displacementof fishing effort from the east coast to theGulf of Carpentaria.
The decline in the east-coast harvest is likelyto be due to a number of commercial fisherydependent factors as well as seasonal andenvironmental variables affecting fishabundance. The effects of habitat degradationand freshwater influence are thought to besignificant but have not been quantified.
Some commercial fishers believe that theintroduction of Dugong Protection Areas onthe east coast of Queensland in 1997, whichprohibited or restricted various nettingactivities in some important grey mackerelfishing grounds, has caused the decline ineffort for, and harvest of, grey mackerel.
In some areas in the last five years, due to theretirement of some commercial fishers, thereappears to be a loss of expertise in targetinggrey mackerel that may account for some lossin target effort and harvest.
A review of the management measures forgrey mackerel on the east coast should beundertaken.
The harvest of grey mackerel in the Gulfof Carpentaria is a relatively recentphenomenon. There are concerns about thelevel of harvest in the Gulf and whether it issustainable.
The dramatic increase in harvest in the Gulffrom 1995, and the associated changes infishing operations, necessitates a review ofmanagement arrangements.
Increased monitoring, including the use ofobservers on fishing vessels and moredetailed reporting of fishing activity bycommercial fishers, together with long-termfishery independent monitoring, isrecommended on the east coast and in theGulf of Carpentaria.
Further readingCameron, D. and Begg, G. (2002) Fisheries biology
and interaction in the northern Australian smallmackerel fishery. Draft final report to FisheriesResearch and Development Corporation.
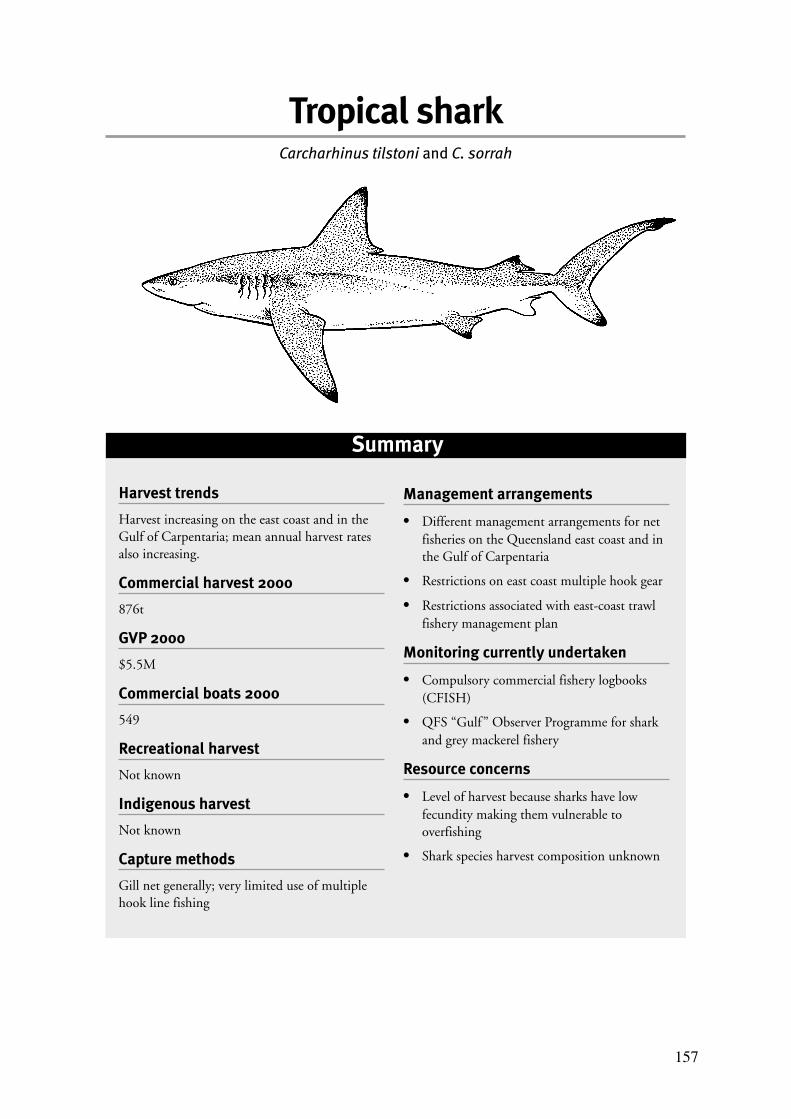
157
Summary
Harvest trends
Harvest increasing on the east coast and in theGulf of Carpentaria; mean annual harvest ratesalso increasing.
Commercial harvest 2000
876t
GVP 2000
$5.5M
Commercial boats 2000
549
Recreational harvest
Not known
Indigenous harvest
Not known
Capture methods
Gill net generally; very limited use of multiplehook line fishing
Tropical sharkCarcharhinus tilstoni and C. sorrah
Management arrangements
• Different management arrangements for netfisheries on the Queensland east coast and inthe Gulf of Carpentaria
• Restrictions on east coast multiple hook gear
• Restrictions associated with east-coast trawlfishery management plan
Monitoring currently undertaken
• Compulsory commercial fishery logbooks(CFISH)
• QFS “Gulf” Observer Programme for sharkand grey mackerel fishery
Resource concerns
• Level of harvest because sharks have lowfecundity making them vulnerable tooverfishing
• Shark species harvest composition unknown
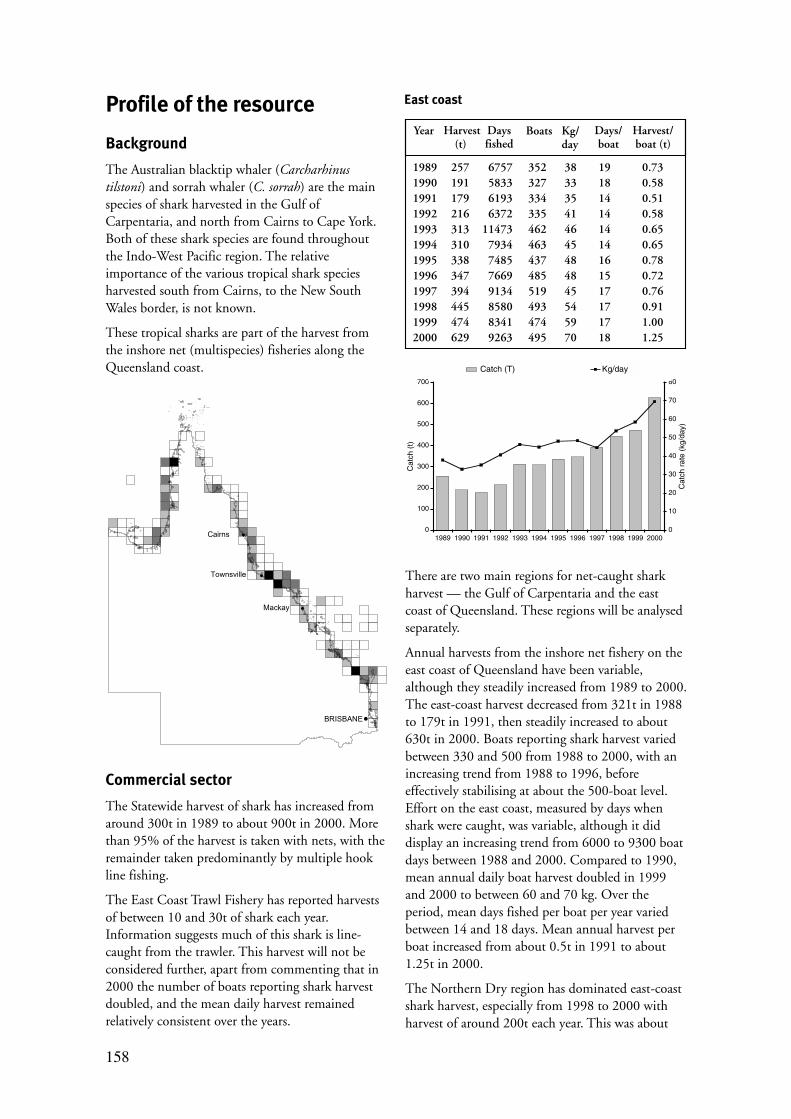
158
Profile of the resource
Background
The Australian blacktip whaler (Carcharhinustilstoni) and sorrah whaler (C. sorrah) are the mainspecies of shark harvested in the Gulf ofCarpentaria, and north from Cairns to Cape York.Both of these shark species are found throughoutthe Indo-West Pacific region. The relativeimportance of the various tropical shark speciesharvested south from Cairns, to the New SouthWales border, is not known.
These tropical sharks are part of the harvest fromthe inshore net (multispecies) fisheries along theQueensland coast.
There are two main regions for net-caught sharkharvest — the Gulf of Carpentaria and the eastcoast of Queensland. These regions will be analysedseparately.
Annual harvests from the inshore net fishery on theeast coast of Queensland have been variable,although they steadily increased from 1989 to 2000.The east-coast harvest decreased from 321t in 1988to 179t in 1991, then steadily increased to about630t in 2000. Boats reporting shark harvest variedbetween 330 and 500 from 1988 to 2000, with anincreasing trend from 1988 to 1996, beforeeffectively stabilising at about the 500-boat level.Effort on the east coast, measured by days whenshark were caught, was variable, although it diddisplay an increasing trend from 6000 to 9300 boatdays between 1988 and 2000. Compared to 1990,mean annual daily boat harvest doubled in 1999and 2000 to between 60 and 70 kg. Over theperiod, mean days fished per boat per year variedbetween 14 and 18 days. Mean annual harvest perboat increased from about 0.5t in 1991 to about1.25t in 2000.
The Northern Dry region has dominated east-coastshark harvest, especially from 1998 to 2000 withharvest of around 200t each year. This was about
Commercial sector
The Statewide harvest of shark has increased fromaround 300t in 1989 to about 900t in 2000. Morethan 95% of the harvest is taken with nets, with theremainder taken predominantly by multiple hookline fishing.
The East Coast Trawl Fishery has reported harvestsof between 10 and 30t of shark each year.Information suggests much of this shark is line-caught from the trawler. This harvest will not beconsidered further, apart from commenting that in2000 the number of boats reporting shark harvestdoubled, and the mean daily harvest remainedrelatively consistent over the years.
0
100
200
300
400
500
600
700
1989 1990 1991 1992 1993 1994 1995 1996 1997 1998 1999 2000
Cat
ch (
t)
0
10
20
30
40
50
60
70
80
Cat
ch r
ate
(kg/
day)
Catch (T) Kg/day c
1989 257 6757 352 38 19 0.731990 191 5833 327 33 18 0.581991 179 6193 334 35 14 0.511992 216 6372 335 41 14 0.581993 313 11473 462 46 14 0.651994 310 7934 463 45 14 0.651995 338 7485 437 48 16 0.781996 347 7669 485 48 15 0.721997 394 9134 519 45 17 0.761998 445 8580 493 54 17 0.911999 474 8341 474 59 17 1.002000 629 9263 495 70 18 1.25
East coast
��������
���
���������
�����
Kg/day
Harvest/boat (t)
Daysfished
Harvest(t)
Days/boat
BoatsYear
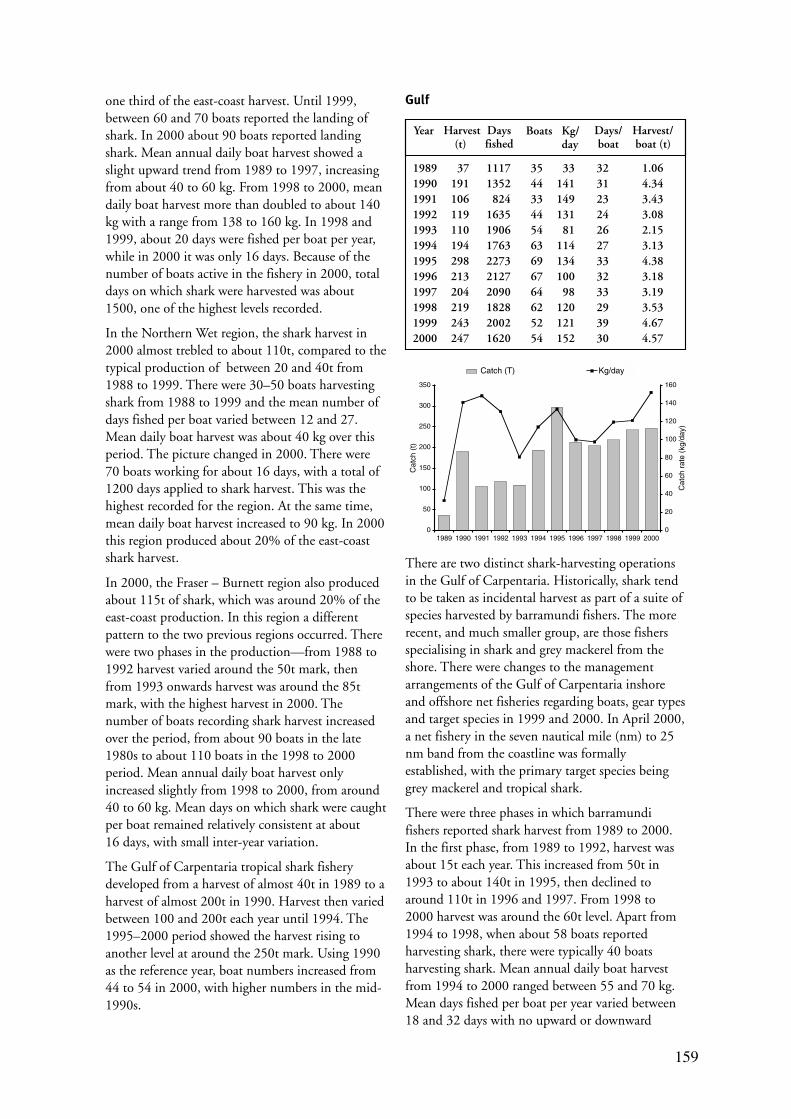
159
one third of the east-coast harvest. Until 1999,between 60 and 70 boats reported the landing ofshark. In 2000 about 90 boats reported landingshark. Mean annual daily boat harvest showed aslight upward trend from 1989 to 1997, increasingfrom about 40 to 60 kg. From 1998 to 2000, meandaily boat harvest more than doubled to about 140kg with a range from 138 to 160 kg. In 1998 and1999, about 20 days were fished per boat per year,while in 2000 it was only 16 days. Because of thenumber of boats active in the fishery in 2000, totaldays on which shark were harvested was about1500, one of the highest levels recorded.
In the Northern Wet region, the shark harvest in2000 almost trebled to about 110t, compared to thetypical production of between 20 and 40t from1988 to 1999. There were 30–50 boats harvestingshark from 1988 to 1999 and the mean number ofdays fished per boat varied between 12 and 27.Mean daily boat harvest was about 40 kg over thisperiod. The picture changed in 2000. There were70 boats working for about 16 days, with a total of1200 days applied to shark harvest. This was thehighest recorded for the region. At the same time,mean daily boat harvest increased to 90 kg. In 2000this region produced about 20% of the east-coastshark harvest.
In 2000, the Fraser – Burnett region also producedabout 115t of shark, which was around 20% of theeast-coast production. In this region a differentpattern to the two previous regions occurred. Therewere two phases in the production—from 1988 to1992 harvest varied around the 50t mark, thenfrom 1993 onwards harvest was around the 85tmark, with the highest harvest in 2000. Thenumber of boats recording shark harvest increasedover the period, from about 90 boats in the late1980s to about 110 boats in the 1998 to 2000period. Mean annual daily boat harvest onlyincreased slightly from 1998 to 2000, from around40 to 60 kg. Mean days on which shark were caughtper boat remained relatively consistent at about16 days, with small inter-year variation.
The Gulf of Carpentaria tropical shark fisherydeveloped from a harvest of almost 40t in 1989 to aharvest of almost 200t in 1990. Harvest then variedbetween 100 and 200t each year until 1994. The1995–2000 period showed the harvest rising toanother level at around the 250t mark. Using 1990as the reference year, boat numbers increased from44 to 54 in 2000, with higher numbers in the mid-1990s.
There are two distinct shark-harvesting operationsin the Gulf of Carpentaria. Historically, shark tendto be taken as incidental harvest as part of a suite ofspecies harvested by barramundi fishers. The morerecent, and much smaller group, are those fishersspecialising in shark and grey mackerel from theshore. There were changes to the managementarrangements of the Gulf of Carpentaria inshoreand offshore net fisheries regarding boats, gear typesand target species in 1999 and 2000. In April 2000,a net fishery in the seven nautical mile (nm) to 25nm band from the coastline was formallyestablished, with the primary target species beinggrey mackerel and tropical shark.
There were three phases in which barramundifishers reported shark harvest from 1989 to 2000.In the first phase, from 1989 to 1992, harvest wasabout 15t each year. This increased from 50t in1993 to about 140t in 1995, then declined toaround 110t in 1996 and 1997. From 1998 to2000 harvest was around the 60t level. Apart from1994 to 1998, when about 58 boats reportedharvesting shark, there were typically 40 boatsharvesting shark. Mean annual daily boat harvestfrom 1994 to 2000 ranged between 55 and 70 kg.Mean days fished per boat per year varied between18 and 32 days with no upward or downward
1989 37 1117 35 33 32 1.061990 191 1352 44 141 31 4.341991 106 824 33 149 23 3.431992 119 1635 44 131 24 3.081993 110 1906 54 81 26 2.151994 194 1763 63 114 27 3.131995 298 2273 69 134 33 4.381996 213 2127 67 100 32 3.181997 204 2090 64 98 33 3.191998 219 1828 62 120 29 3.531999 243 2002 52 121 39 4.672000 247 1620 54 152 30 4.57
0
50
100
150
200
250
300
350
1989 1990 1991 1992 1993 1994 1995 1996 1997 1998 1999 2000
Cat
ch (
t)
0
20
40
60
80
100
120
140
160
Cat
ch r
ate
(kg/
day)
Catch (T) Kg/day c
Gulf
Kg/day
Harvest/boat (t)
Daysfished
Harvest(t)
Days/boat
BoatsYear
160
trend. The increase in shark production from thissector of the Gulf fleet was caused by two factors —the introduction of “reel” boats into the fleet, andsome targeted shark fishing during the winter partsof the year. Subsequently a few of these operationsmoved into the specialist shark and grey mackerelfishery.
The specialist tropical shark and grey mackerelfishery formally came into being in mid-2000. Priorto then some fishers specialised initially in tropicalshark harvest, then expanded the range of speciesharvested to include grey mackerel. These fishersdid not (or were not licensed to) harvestbarramundi. Specialist harvest of shark commencedin 1990, with a harvest of about 180t. Harvest from1990 to 2000 varied within the range of 60–184t.There was no clear upward trend, with the level ofharvest dependent on the number of boatsoperating in the fishery. Boat numbers variedbetween two and 12. This report only presentsdetailed analyses where there are five or more boatsworking in the fishery. This occurred in 1994.Mean annual daily harvest was highest in 1995 atalmost 800 kg, with boats fishing for about 40 daysand typically landing about 30t each. From 1996 to2000 mean daily harvest tended to stabilise ataround 200 kg. Year 2000 had a daily harvest ofabout 280 kg, probably as the result of some boatsbeing licensed to use additional net. Mean harvestper boat each year was about 14t with some inter-year variation.
Biological and ecologicalbackgroundCommercial harvest consists mainly of whalersharks (Carcharhinus tilstoni, C. limbatus, C. sorrah,C. cautus, C. amblyrhynchos, C. macloti, Negaprionacutidens and Rhizoprionodon acutus).
There is currently no clear indication of thecomposition and relative importance of the sharkspecies harvested south of Cairns. A survey of sharkcatches from Cairns into the Gulf of Carpentariaindicate most of the harvest consists of theAustralian blacktip whaler (Carcharhinus tilstoni)and sorrah whaler (C. sorrah).
The distribution of the major commercial sharkspecies varies spatially and seasonally throughoutthe northern half of Australia. They inhabit mostmarine and estuarine habitats. Individuals of somespecies may make substantial seasonal along-shore
movements. “Offshore” shark species are oftenhighly patchy, requiring considerable search andfishing effort to locate concentrations.
There is insufficient evidence to suggest that there ismore than one genetic stock of the dominantspecies (C. tilstoni) in commercial fisheries inAustralian waters.
The sharks that dominate the Gulf and east-coastfisheries generally attain sexual maturity at over onemetre total length (TL) and at around 3–4 years.
They produce live offspring (generally three to fivepups) during summer, at around 50 cm length,which grow about 15 cm in length per year. Sharkgestation period is 7–12 months.
Sharks feed on a variety of prey that includes mostlyfish, but also take commercially important prawnsand cephalopods.
Habitat requirements for many of the sharks are notclear, but Australian blacktip whaler (Carcharhinustilstoni) and sorrah whaler (C. sorrah) are notstrongly reliant on estuarine and foreshore areas forjuvenile habitat.
MarketingShark in fillet and trunk form are sold inQueensland and southern Australia. There are nowuniform maximum permissible concentrationstandards applying to mercury levels for sharkthroughout Australia (0.1 mg/kg). Current levels ofmercury in landed shark are not known.
The main competition for Queensland sharkproducts for the southern markets is from similarspecies harvested in the Northern Territory andnorthern Western Australia.
Concerns have been raised about the finning ofshark without the retention of the carcass. Thismatter is currently being addressed.
161
Current resource status
Trends
Shark harvest and effort on the east coasthave been variable, with an increase in totalharvest. The Gulf harvest also shows anincrease in total harvest. In both areas, effort,in terms of days fished, has been variable,mainly as a result of the number of boatsentering and leaving shark harvesting activity.The east coast mean daily boat harvestremained relatively stable over the periodfrom 1988 to 1997, with an increasing trendfor 1997–2000. In the Gulf, mean daily boatharvest was highly variable from 1988 until1996, but a steady upward trend has becomeapparent in the years from 1997 to 2000.This increase in trend may be the effect ofchanges in fishing practice.
Comments
Stock assessment for Queensland sharkresources has not been undertaken.Sustainability of the shark resource at currentharvest and effort levels is unknown. Untilthe species composition of Queensland sharkis understood, and logbooks modified toaccept the information, useful stockassessment of Queensland shark will not bepossible.
The effect of climate on resource availabilityis unknown, although it is likely that changesin ocean currents and water temperaturecould influence the extent of the movementof tropical shark species into southernQueensland and New South Wales watersduring the summer months.
Further readingAnon. (1990) Northern pelagic fish stock research.
Final report to the Fishing Industry Researchand Development Council, Projects 83/49 and86/87, 325 pp.
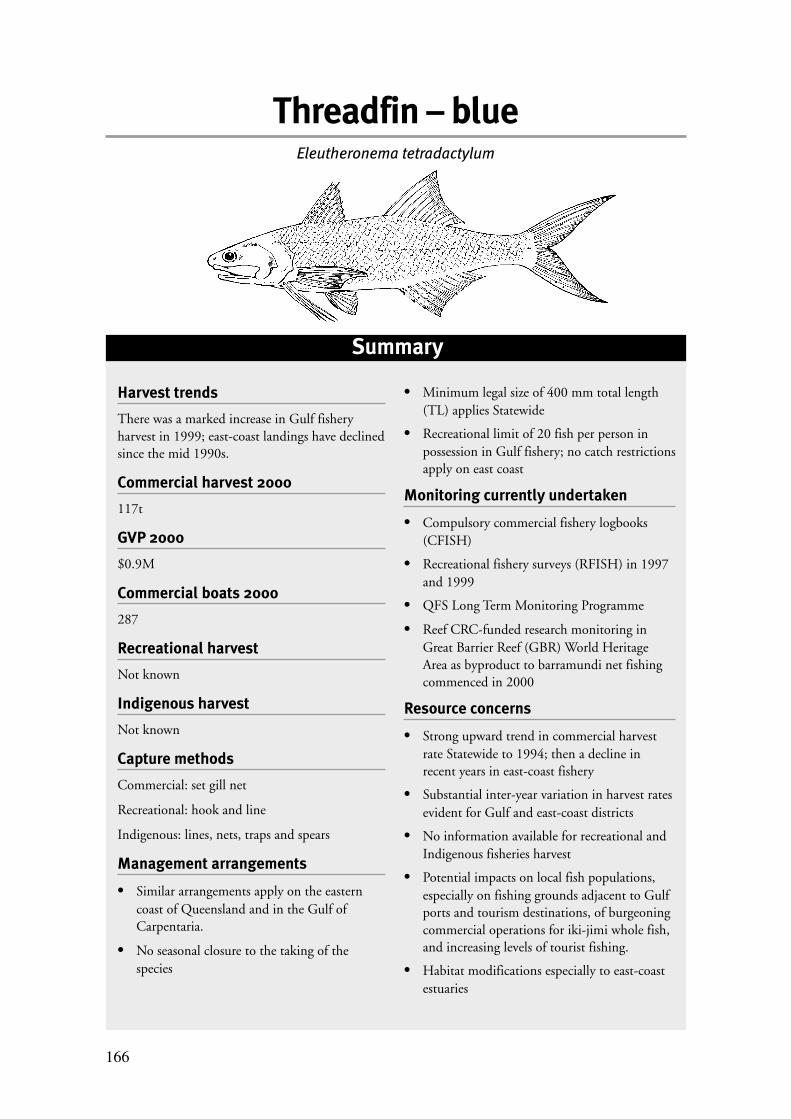
166
Summary
Harvest trends
There was a marked increase in Gulf fisheryharvest in 1999; east-coast landings have declinedsince the mid 1990s.
Commercial harvest 2000
117t
GVP 2000
$0.9M
Commercial boats 2000
287
Recreational harvest
Not known
Indigenous harvest
Not known
Capture methods
Commercial: set gill net
Recreational: hook and line
Indigenous: lines, nets, traps and spears
Management arrangements
• Similar arrangements apply on the easterncoast of Queensland and in the Gulf ofCarpentaria.
• No seasonal closure to the taking of thespecies
• Minimum legal size of 400 mm total length(TL) applies Statewide
• Recreational limit of 20 fish per person inpossession in Gulf fishery; no catch restrictionsapply on east coast
Monitoring currently undertaken
• Compulsory commercial fishery logbooks(CFISH)
• Recreational fishery surveys (RFISH) in 1997and 1999
• QFS Long Term Monitoring Programme
• Reef CRC-funded research monitoring inGreat Barrier Reef (GBR) World HeritageArea as byproduct to barramundi net fishingcommenced in 2000
Resource concerns
• Strong upward trend in commercial harvestrate Statewide to 1994; then a decline inrecent years in east-coast fishery
• Substantial inter-year variation in harvest ratesevident for Gulf and east-coast districts
• No information available for recreational andIndigenous fisheries harvest
• Potential impacts on local fish populations,especially on fishing grounds adjacent to Gulfports and tourism destinations, of burgeoningcommercial operations for iki-jimi whole fish,and increasing levels of tourist fishing.
• Habitat modifications especially to east-coastestuaries
Threadfin – blueEleutheronema tetradactylum

167
Profile of the resource
Background
The blue threadfin (Eleutheronema tetradactylum),also referred to as blue salmon or blue-nosedsalmon, is a fast-growing predatory fish of sandyshores and muddy estuaries throughout the tropicalIndo-West Pacific region. The species is a memberof the Polynemidae or tasselfishes, and is known bya variety of common names in northern Australia.
The reported commercial harvest in Queenslandwaters has averaged about 160t per year over thelast 12 years, with over two-thirds of the harvestlanded from the Queensland east coast, north fromFraser Island.
Commercial sector
Blue threadfin are harvested as part of thecommercial inshore set-net fisheries, which operatealong the Queensland coast from Inskip Point nearFraser Island north, to Cape York Peninsula andwest along the Gulf coast to the Queensland –Northern Territory border. The inshore set-netfisheries are multiple species fisheries, withbarramundi, king threadfin and blue threadfinbeing the preferred targets. In tropical easternQueensland, blue threadfin catches dominate gill-net landings in the cooler months, especially inforeshore and lower estuary areas.
From 1989 to 2000, about 300 boats each yearreported harvesting blue threadfin, with most(70%) fishing in Queensland east-coast waters.Statewide, harvest increased each year from 127t in1989 to a peak of 174t in 1994, then fell to 124t in1998 before rising to 173t in 1999. The harvest in2000 of 117t is the lowest recorded for the speciessince 1989.
Effort decreased by about a third over the 12 years,from a reported high of about 8800 boat days in1989 to 5200 days in 2000. Mean daily harvest perboat increased from 14 kg in 1989 to 31 kg in 1999then fell in the 2000 season to 24 kg. Highest meandaily harvest occurred in the Swains and Capricornregions at around 29 kg per day.
On the east coast of Queensland, the number ofboats reporting a harvest of blue threadfin averagedabout 230 every year between 1989 and 2000. Themajority of east-coast operators worked thecoastline between the Northern Wet and Fraser –Burnett regions (15oS to 26oS) with the Capricorncoast exhibiting the highest level of activity withsome 86 boats fishing there each year. The annualeast-coast harvest was about 90t over the period1989–2000, or approximately 60% of the Stateharvest. The harvest declined from a peak of 115tin 1994 to 81t in 1999 and 2000. Effort hasdecreased from a peak of 6300 boat days in 1993 to3400 boat days in 2000. Harvest rates have varied
0
20
40
60
80
100
120
140
1989 1990 1991 1992 1993 1994 1995 1996 1997 1998 1999 2000
Cat
ch (
t)
0
5
10
15
20
25
30
35
Cat
ch r
ate
(kg/
day)
Catch kg/day
1989 91 4833 221 19 22 0.411990 83 4283 214 19 20 0.391991 111 5451 242 23 17 0.391992 91 5618 234 25 14 0.351993 112 6271 272 26 14 0.361994 115 4507 245 33 13 0.441995 92 3456 225 30 13 0.401996 82 3080 218 28 14 0.381997 100 3885 233 27 16 0.431998 71 3154 197 24 15 0.351999 81 3309 202 25 16 0.402000 81 3442 220 25 15 0.37
East coast
��������
���
���������
�����
Kg/day
Harvest/boat (t)
Daysfished
Harvest(t)
Days/boat
BoatsYear
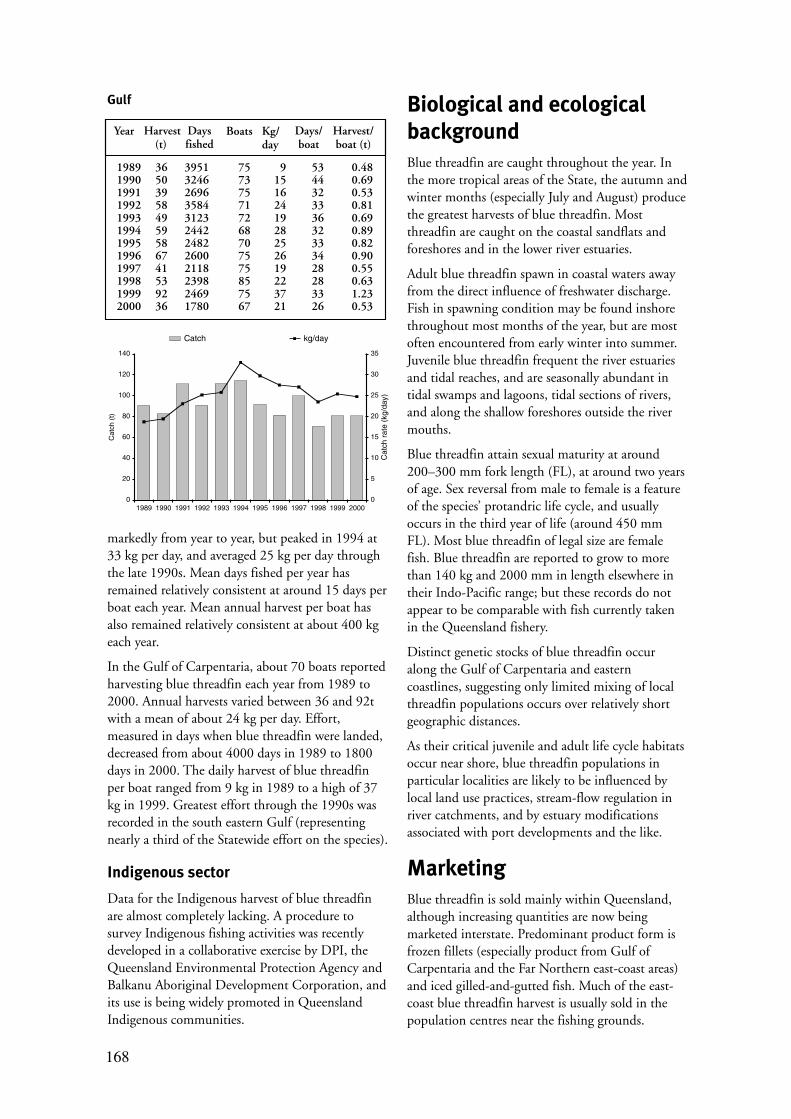
168
markedly from year to year, but peaked in 1994 at33 kg per day, and averaged 25 kg per day throughthe late 1990s. Mean days fished per year hasremained relatively consistent at around 15 days perboat each year. Mean annual harvest per boat hasalso remained relatively consistent at about 400 kgeach year.
In the Gulf of Carpentaria, about 70 boats reportedharvesting blue threadfin each year from 1989 to2000. Annual harvests varied between 36 and 92twith a mean of about 24 kg per day. Effort,measured in days when blue threadfin were landed,decreased from about 4000 days in 1989 to 1800days in 2000. The daily harvest of blue threadfinper boat ranged from 9 kg in 1989 to a high of 37kg in 1999. Greatest effort through the 1990s wasrecorded in the south eastern Gulf (representingnearly a third of the Statewide effort on the species).
Indigenous sector
Data for the Indigenous harvest of blue threadfinare almost completely lacking. A procedure tosurvey Indigenous fishing activities was recentlydeveloped in a collaborative exercise by DPI, theQueensland Environmental Protection Agency andBalkanu Aboriginal Development Corporation, andits use is being widely promoted in QueenslandIndigenous communities.
Biological and ecologicalbackgroundBlue threadfin are caught throughout the year. Inthe more tropical areas of the State, the autumn andwinter months (especially July and August) producethe greatest harvests of blue threadfin. Mostthreadfin are caught on the coastal sandflats andforeshores and in the lower river estuaries.
Adult blue threadfin spawn in coastal waters awayfrom the direct influence of freshwater discharge.Fish in spawning condition may be found inshorethroughout most months of the year, but are mostoften encountered from early winter into summer.Juvenile blue threadfin frequent the river estuariesand tidal reaches, and are seasonally abundant intidal swamps and lagoons, tidal sections of rivers,and along the shallow foreshores outside the rivermouths.
Blue threadfin attain sexual maturity at around200–300 mm fork length (FL), at around two yearsof age. Sex reversal from male to female is a featureof the species’ protandric life cycle, and usuallyoccurs in the third year of life (around 450 mmFL). Most blue threadfin of legal size are femalefish. Blue threadfin are reported to grow to morethan 140 kg and 2000 mm in length elsewhere intheir Indo-Pacific range; but these records do notappear to be comparable with fish currently takenin the Queensland fishery.
Distinct genetic stocks of blue threadfin occuralong the Gulf of Carpentaria and easterncoastlines, suggesting only limited mixing of localthreadfin populations occurs over relatively shortgeographic distances.
As their critical juvenile and adult life cycle habitatsoccur near shore, blue threadfin populations inparticular localities are likely to be influenced bylocal land use practices, stream-flow regulation inriver catchments, and by estuary modificationsassociated with port developments and the like.
MarketingBlue threadfin is sold mainly within Queensland,although increasing quantities are now beingmarketed interstate. Predominant product form isfrozen fillets (especially product from Gulf ofCarpentaria and the Far Northern east-coast areas)and iced gilled-and-gutted fish. Much of the east-coast blue threadfin harvest is usually sold in thepopulation centres near the fishing grounds.
0
20
40
60
80
100
120
140
1989 1990 1991 1992 1993 1994 1995 1996 1997 1998 1999 2000
Cat
ch (
t)
0
5
10
15
20
25
30
35
Cat
ch r
ate
(kg/
day)
Catch kg/day
Gulf
1989 36 3951 75 9 53 0.481990 50 3246 73 15 44 0.691991 39 2696 75 16 32 0.531992 58 3584 71 24 33 0.811993 49 3123 72 19 36 0.691994 59 2442 68 28 32 0.891995 58 2482 70 25 33 0.821996 67 2600 75 26 34 0.901997 41 2118 75 19 28 0.551998 53 2398 85 22 28 0.631999 92 2469 75 37 33 1.232000 36 1780 67 21 26 0.53
Kg/day
Harvest/boat (t)
Daysfished
Harvest(t)
Days/boat
BoatsYear
169
Frozen fillet product returns about $3–3.50/kg tothe fisher. As with barramundi, a premium markethas developed in southern States over the last coupleof years for iki-jimi iced whole threadfin. Thisproduct brings around $3/kg to the fisher, aconsiderable improvement on the return for fillets.Supplying this market has led to an increased levelof target fishing for the species in both Gulf andeast-coast fisheries. It is likely that the elevatedlandings and harvest rates shown in the Gulf fisheryfor 1999 reflect the reaction by at least some fishersto this changed market environment (rather thanpointing to an enhanced level of abundance ofthreadfin on the fishing grounds in this year).
Queensland blue threadfin fillets compete withsimilar product from the Northern Territory.Incidents of threadfin fillets being substituted asbarramundi have been reported in southernmarkets, but the level is unknown. The species isfarmed in South-East Asia, but there appears to belittle demand for the imported aquaculture productin Queensland.
Current resource status
Trends
Statewide commercial fishery landings havehovered around 140–150t each year from1991–97. Reported landings in the Gulffishery rose dramatically in 1999, perhaps inresponse to a higher market demand. On theeast coast, there has been a gradual decreasein annual harvest levels since the mid 1990s.Across the State, blue threadfin harvest ratesimproved slowly over the period 1989–99,then declined again in 2000.
Comments
While east-coast fishers have long targetedblue threadfin when they are locallyabundant, Gulf harvests of the species haveusually been bycatch of target fishing forbarramundi or king threadfin. Large harvestsof blues can often be made in nettingactivities for king threadfin on the coastalshores.
The dramatic increase in reported Gulflandings of blue threadfin in 1999 is likely tohave resulted from target fishing in season, as
well as an increased retention of the species asbyproduct. Fishers appeared to take advantageof new market supply opportunities, ratherthan there being any increase in fishpopulation numbers on the fishing groundsbeyond normal seasonal variations. Thisactivity does not appear to have been sustainedin 2000.
The gazetting of Dugong Protection Areas(DPAs) may have had an effect on harvestfrom the east-coast fishery. Reduced levels offishing activity and a loss of blue threadfingrounds may have contributed to the 20%decline observed in recorded productionstatistics.
The impact (on blue threadfin stocks overtime) of increased fishing pressure on Gulffishing grounds that are adjacent to ports andtourism centres (pressure that is market-drivenin the case of the commercial fishery andtourist fishery based in the recreational sector)is a cause for concern. The evidence from stockgenetics research into the species suggests thatdiscrete local populations exist on the differentgrounds; heavy fishing pressure may have thepotential to cause local stock depletions.
The effects of climate on blue threadfinpopulation dynamics are unknown. Researchpublished on blue threadfin in Indian waterscorrelated peak catches with times of moderatesea temperatures and coastal salinities. As withking threadfin, the strength of recruitment tothe blue threadfin fishery appears to beinfluenced each year by the productivity ofnear-shore environments that serve as habitatsfor the juvenile fish.
Further readingKeenan, C.P. (1998) Gulf fish stock genetics.
29–59pp. in Garrett, R.N. (ed) Biology andharvest of tropical fishes in he Queensland Gulf ofCarpentaria gillnet fishery. Information Series,Department of Primary Industries. QI9808, 119 pp.
Stanger J.D. (1974) A study of the growth, feedingand reproduction of the threadfin Eleutheronematetradactylum (Shaw). Hons Thesis. James CookUniversity 126 pp.
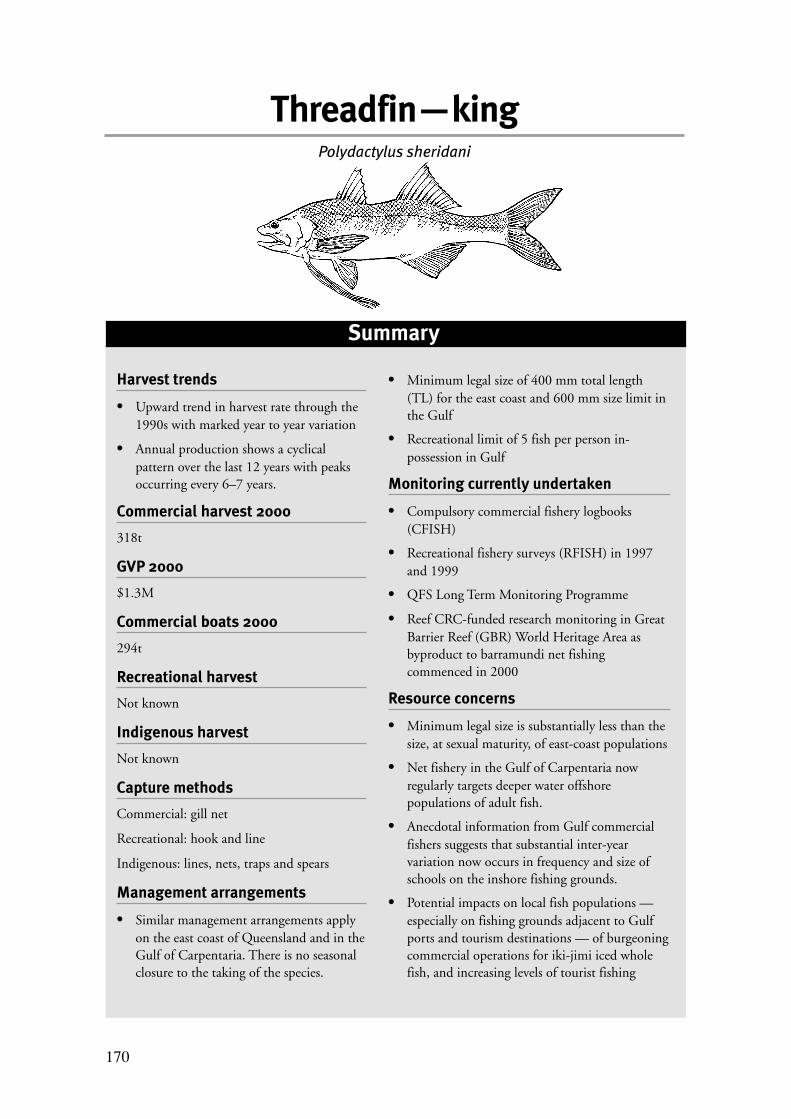
170
Summary
Harvest trends
• Upward trend in harvest rate through the1990s with marked year to year variation
• Annual production shows a cyclicalpattern over the last 12 years with peaksoccurring every 6–7 years.
Commercial harvest 2000
318t
GVP 2000
$1.3M
Commercial boats 2000
294t
Recreational harvest
Not known
Indigenous harvest
Not known
Capture methods
Commercial: gill net
Recreational: hook and line
Indigenous: lines, nets, traps and spears
Management arrangements
• Similar management arrangements applyon the east coast of Queensland and in theGulf of Carpentaria. There is no seasonalclosure to the taking of the species.
Threadfin—kingPolydactylus sheridani
• Minimum legal size of 400 mm total length(TL) for the east coast and 600 mm size limit inthe Gulf
• Recreational limit of 5 fish per person in-possession in Gulf
Monitoring currently undertaken
• Compulsory commercial fishery logbooks(CFISH)
• Recreational fishery surveys (RFISH) in 1997and 1999
• QFS Long Term Monitoring Programme
• Reef CRC-funded research monitoring in GreatBarrier Reef (GBR) World Heritage Area asbyproduct to barramundi net fishingcommenced in 2000
Resource concerns
• Minimum legal size is substantially less than thesize, at sexual maturity, of east-coast populations
• Net fishery in the Gulf of Carpentaria nowregularly targets deeper water offshorepopulations of adult fish.
• Anecdotal information from Gulf commercialfishers suggests that substantial inter-yearvariation now occurs in frequency and size ofschools on the inshore fishing grounds.
• Potential impacts on local fish populations —especially on fishing grounds adjacent to Gulfports and tourism destinations — of burgeoningcommercial operations for iki-jimi iced wholefish, and increasing levels of tourist fishing

171
threadfin, along the foreshores, provide analternative fishery target.
Since 1989, around 300 boats have reportedlanding king threadfin each year in Queensland,with almost a third of these working in Gulf ofCarpentaria waters.
Queensland’s annual king threadfin harvestdeclined from 420t in 1991 to about 230t in 1994and 1995—a decrease of about 55%. Harvestreturned to 1991 levels over the next five years,peaking in 1999 at more than 370t. Harvest in2000 was about 320t. These fluctuations occurredagainst a background of diminishing fishing effortas measured in boat days. Days on which fish wereharvested declined from about 12 700 boat days in1989 to 7800 boat days in 2000, a decline of overone third. The reasons for the decline in effort arenot clear.
Profile of the resource
Background
King threadfin or king salmon (Polydactylussheridani) is a large predatory fish species(Polynemidae or tasselfishes) of tropical estuarineand inshore waters around northern Australia. It isdistributed throughout the Indo-Pacific region.
The king threadfin has a complicated life cycle,starting life as a male and transforming into afemale part way through its lifetime. The speciescan grow to more than 1500 mm in length and 30kg in weight. Its fine-eating qualities make kingthreadfin highly prized in net and line fisheries,especially in southern Gulf of Carpentaria waterswhere very large schools are found.
Commercial sector
King threadfin are harvested as part of thecommercial set-net inshore fisheries operating alongthe Queensland coast from Inskip Point near FraserIsland, north to Cape York Peninsula, and westalong the Gulf coast to the Queensland – NorthernTerritory border.
In tropical Queensland, king threadfin harvests arean important part of gill-net landings through latesummer and the cooler months, especially along thecoastal foreshores and in lower estuary areas. Whenwet-season flood flows make netting forbarramundi in Gulf rivers ineffective, king
0
10
20
30
40
50
60
70
80
90
100
1989 1990 1991 1992 1993 1994 1995 1996 1997 1998 1999 2000
Cat
ch (
t)
0
5
10
15
20
25
30
35
Cat
ch r
ate
(kg/
day)
Catch kg/day
On the Queensland east coast, king threadfincatches extend from Cape York south to about TinCan Bay at the southern extremity of Fraser Island.Boats reporting a harvest of king threadfinremained relatively consistent at about 215 eachyear in 1989–2000 for the east coast ofQueensland. The annual harvest ranged between 58and 92t, with the peak harvest recorded in 2000.
East coast
1989 58 3948 195 15 20 0.301990 72 4159 198 17 21 0.361991 89 5116 222 21 18 0.391992 65 4995 215 24 12 0.291993 91 5510 240 26 13 0.331994 79 4285 226 25 13 0.321995 62 2711 199 27 11 0.291996 67 2975 214 25 13 0.311997 67 2889 223 24 13 0.301998 71 3147 210 24 14 0.331999 82 3209 205 26 15 0.392000 92 3348 218 29 14 0.42
Kg/day
Harvest/boat (t)
Daysfished
Harvest(t)
Days/boat
BoatsYear
��������
���
���������
�����
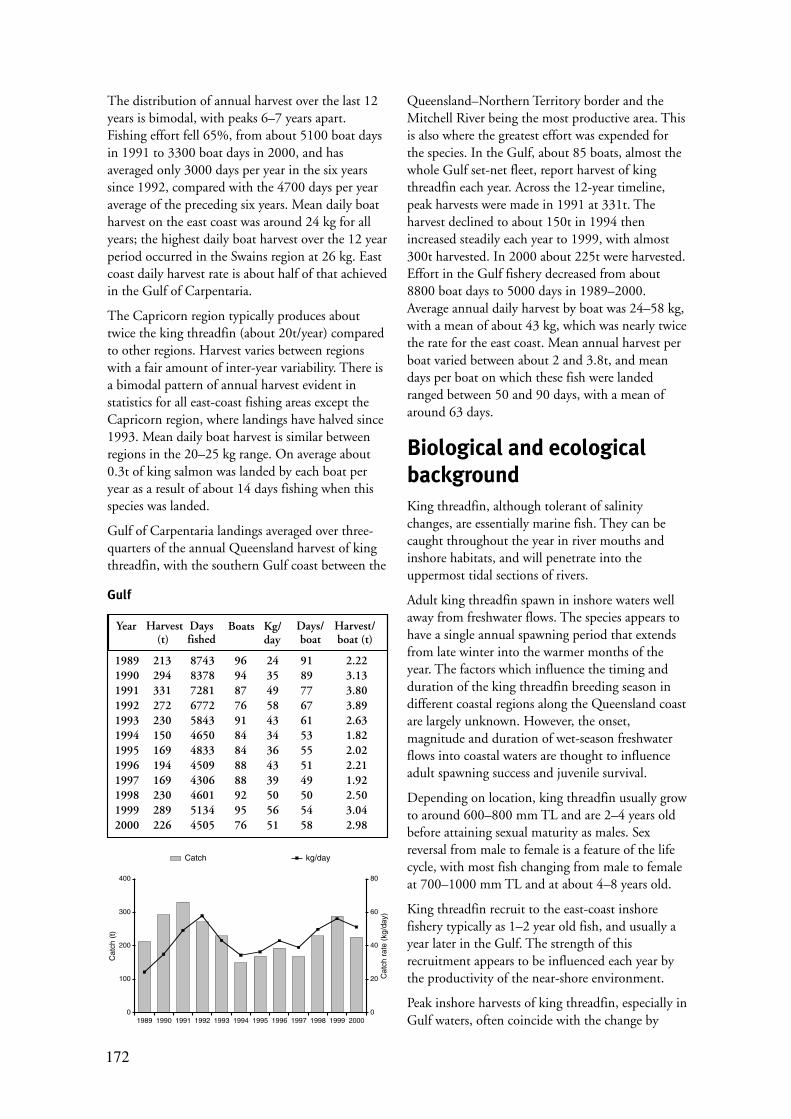
172
The distribution of annual harvest over the last 12years is bimodal, with peaks 6–7 years apart.Fishing effort fell 65%, from about 5100 boat daysin 1991 to 3300 boat days in 2000, and hasaveraged only 3000 days per year in the six yearssince 1992, compared with the 4700 days per yearaverage of the preceding six years. Mean daily boatharvest on the east coast was around 24 kg for allyears; the highest daily boat harvest over the 12 yearperiod occurred in the Swains region at 26 kg. Eastcoast daily harvest rate is about half of that achievedin the Gulf of Carpentaria.
The Capricorn region typically produces abouttwice the king threadfin (about 20t/year) comparedto other regions. Harvest varies between regionswith a fair amount of inter-year variability. There isa bimodal pattern of annual harvest evident instatistics for all east-coast fishing areas except theCapricorn region, where landings have halved since1993. Mean daily boat harvest is similar betweenregions in the 20–25 kg range. On average about0.3t of king salmon was landed by each boat peryear as a result of about 14 days fishing when thisspecies was landed.
Gulf of Carpentaria landings averaged over three-quarters of the annual Queensland harvest of kingthreadfin, with the southern Gulf coast between the
Queensland–Northern Territory border and theMitchell River being the most productive area. Thisis also where the greatest effort was expended forthe species. In the Gulf, about 85 boats, almost thewhole Gulf set-net fleet, report harvest of kingthreadfin each year. Across the 12-year timeline,peak harvests were made in 1991 at 331t. Theharvest declined to about 150t in 1994 thenincreased steadily each year to 1999, with almost300t harvested. In 2000 about 225t were harvested.Effort in the Gulf fishery decreased from about8800 boat days to 5000 days in 1989–2000.Average annual daily harvest by boat was 24–58 kg,with a mean of about 43 kg, which was nearly twicethe rate for the east coast. Mean annual harvest perboat varied between about 2 and 3.8t, and meandays per boat on which these fish were landedranged between 50 and 90 days, with a mean ofaround 63 days.
Biological and ecologicalbackgroundKing threadfin, although tolerant of salinitychanges, are essentially marine fish. They can becaught throughout the year in river mouths andinshore habitats, and will penetrate into theuppermost tidal sections of rivers.
Adult king threadfin spawn in inshore waters wellaway from freshwater flows. The species appears tohave a single annual spawning period that extendsfrom late winter into the warmer months of theyear. The factors which influence the timing andduration of the king threadfin breeding season indifferent coastal regions along the Queensland coastare largely unknown. However, the onset,magnitude and duration of wet-season freshwaterflows into coastal waters are thought to influenceadult spawning success and juvenile survival.
Depending on location, king threadfin usually growto around 600–800 mm TL and are 2–4 years oldbefore attaining sexual maturity as males. Sexreversal from male to female is a feature of the lifecycle, with most fish changing from male to femaleat 700–1000 mm TL and at about 4–8 years old.
King threadfin recruit to the east-coast inshorefishery typically as 1–2 year old fish, and usually ayear later in the Gulf. The strength of thisrecruitment appears to be influenced each year bythe productivity of the near-shore environment.
Peak inshore harvests of king threadfin, especially inGulf waters, often coincide with the change by
Gulf
1989 213 8743 96 24 91 2.221990 294 8378 94 35 89 3.131991 331 7281 87 49 77 3.801992 272 6772 76 58 67 3.891993 230 5843 91 43 61 2.631994 150 4650 84 34 53 1.821995 169 4833 84 36 55 2.021996 194 4509 88 43 51 2.211997 169 4306 88 39 49 1.921998 230 4601 92 50 50 2.501999 289 5134 95 56 54 3.042000 226 4505 76 51 58 2.98
0
100
200
300
400
1989 1990 1991 1992 1993 1994 1995 1996 1997 1998 1999 2000
Cat
ch (
t)
0
20
40
60
80
Cat
ch r
ate
(kg/
day)
Catch kg/day
Kg/day
Harvest/boat (t)
Daysfished
Harvest(t)
Days/boat
BoatsYear
173
inshore fishers from riverine-habitat fishingtargeting barramundi, to foreshore habitats inautumn, as water temperatures drop and freshwaterflows return to normal after the wet season. Schoolsof adult threadfins frequenting near-shore feedingand spawning grounds at this time are vulnerablefishing targets.
Distinct genetic king threadfin stocks occur in theGulf of Carpentaria and along the east Queenslandcoast, but their biological and ecologicalsignificance for fishery resource management is notyet well understood.
MarketingKing threadfin is sold mainly within Queensland,with smaller quantities traded on interstate markets.The predominant product form is frozen fillets(especially from the Gulf of Carpentaria and farnorthern east-coast fisheries) and iced gilled-and-gutted fish. East-coast product from local fishinggrounds finds ready sales in nearby populationcentres.
Frozen fillet product returns about $6–6.50/kg tothe fisher. As with barramundi, a premium markethas developed on the Australian east coast for iki-jimi iced whole threadfin. This product form bringsaround $4/kg whole weight to the fisher. Supplyingthis market has led to target fishing for the speciesby some operators who work within range oftransport outlets for iced fish.
Queensland processed king threadfin competes withsimilar product from the Northern Territory andPapua New Guinea. Despite the very recentdevelopment of the market, iced product from Gulffishers now competes directly with Territorysupplies for the lucrative “fresh fish” trade insouthern capitals. Substitutions for barramundifillets have occurred, but the level is unknown.
Current resource status
Trends
Marked changes in fishery performance areapparent over the last 12 years. Daily boatharvest rates have trended upwards despite anoverall decrease in reported fishing effort. Inboth Gulf and east-coast commercial fisheries,annual harvests have cycled over time with anapparent peak occurring every 6–7 years or so.
Comments
No detailed assessment of the status ofQueensland king threadfin stock is available.
Anecdotal information from commercialfishers in the Gulf suggests that, in recentyears, there has been great variability from yearto year in the frequency of schools of kingthreadfin on the inshore grounds. In addition,they comment that the number of fish in theschools is also highly variable. This mayexplain why there has been less fishing activityreported in this fishery over the latter half ofthe 1990s, at least in the southern Gulf.Greater effort on harvesting king threadfin in1999–2000 may have resulted from targetfishing to supply the iced “fresh fish” marketsin southern Australia.
The reasons for the supposed decline in fishabundance in southern Gulf waters are notclear. The effect of climate on fisheryproductivity is unknown. Harvest of theclosely related Indian threadfin, Polynemusindicus, demonstrates a repeating pattern of astrong fishery year, followed by several years oflower harvests. This cycling may indicaterecruitment patterning if fishery effort remainsconstant. Detection of a repeated cyclingpattern in king threadfin harvests, as nowdemonstrated from the Queensland data set of1989–2000, gives support to the notion that asimilar and yet unknown mechanism mayoperate to control the species abundance innorthern Australian waters.
Further readingKeenan, C.P. (1998) Gulf fish stock genetics.
p 29–59 in Garrett, R.N. (ed), Biology andharvest of tropical fishes in the Queensland Gulf ofCarpentaria gillnet fishery. Information Series,Department of Primary Industries. QI9808,119 pp.
McPherson, G.R. (1998) Reproductive biology offive target fish species in the Gulf of Carpentariainshore gillnet fishery. Ibid. 87–111 pp.
Russell, D.J. (1988) An assessment of the eastQueensland inshore gill net fishery. InformationSeries, Department of Primary Industries.QI88024, 57 pp.
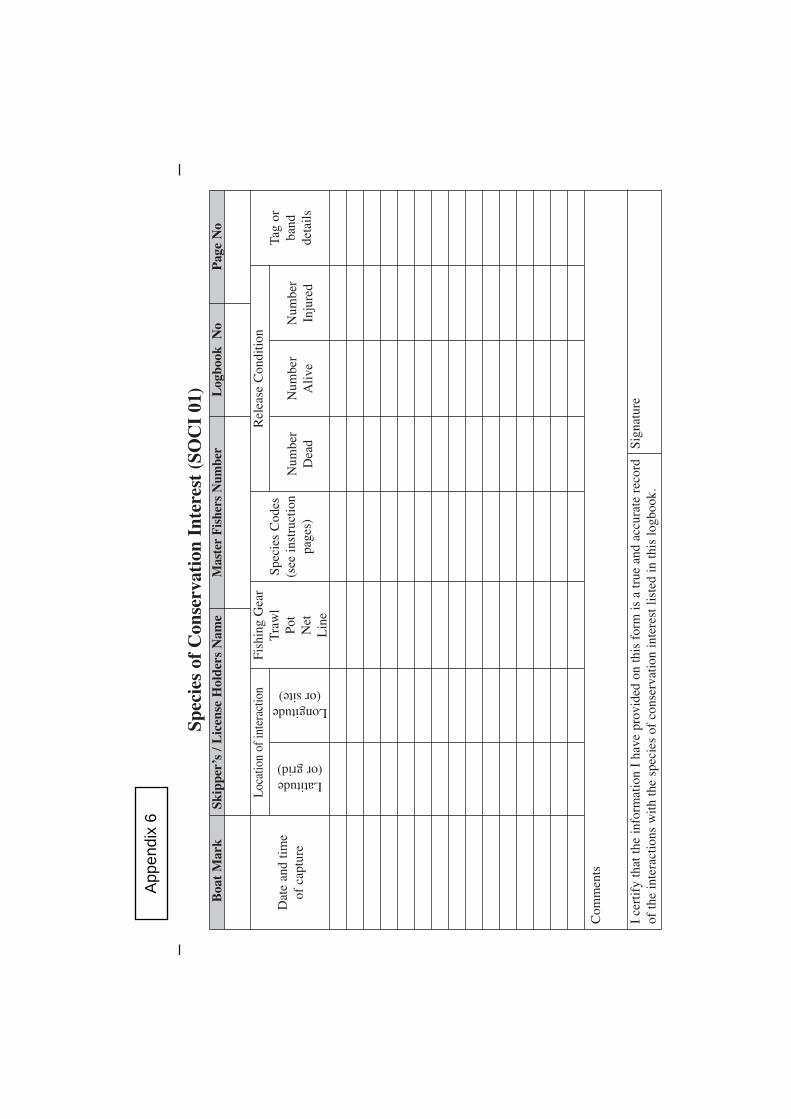
Spec
ies
of C
onse
rvat
ion
Inte
rest
(SO
CI
01) Log
book
No
Pag
e N
oB
oat
Mar
kSk
ippe
r’s
/ Lic
ense
Hol
ders
Nam
eM
aste
rF
ishe
rs N
umbe
r
Dat
e an
d tim
eof
cap
ture
Loca
tion
of in
tera
ctio
n
Com
men
ts
I ce
rtif
y th
at th
e in
form
atio
n I
have
pro
vide
d on
this
for
m is
a tr
ue a
nd a
ccur
ate
reco
rdof
the
inte
ract
ions
with
the
spec
ies
of c
onse
rvat
ion
inte
rest
list
ed in
this
logb
ook.
Sign
atur
e
Fish
ing
Gea
rT
raw
lPo
tN
etL
ine
Spec
ies
Cod
es(s
ee in
stru
ctio
npa
ges)
Num
ber
Dea
dN
umbe
rA
live
Num
ber
Inju
red
Tag
orba
ndde
tails
Latitude(or grid)
Longitude(or site)
Rel
ease
Con
ditio
n
App
endi
x 6
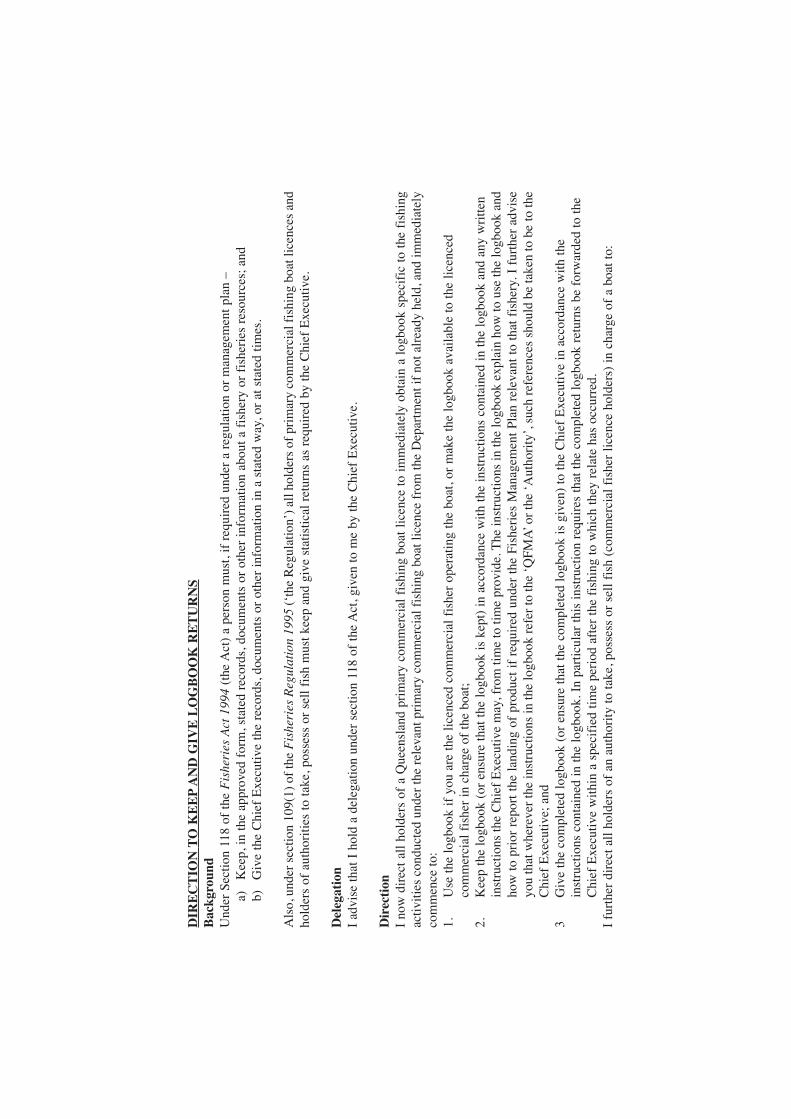
DIR
EC
TIO
N T
O K
EE
PA
ND
GIV
E L
OG
BO
OK
RE
TU
RN
SB
ackg
roun
dU
nder
Sec
tion
118
of th
e F
ishe
ries
Act
199
4(t
he A
ct)
a pe
rson
mus
t, if
req
uire
d un
der
a re
gula
tion
or m
anag
emen
t pla
n –
a)K
eep,
in th
e ap
prov
ed f
orm
, sta
ted
reco
rds,
doc
umen
ts o
r ot
her
info
rmat
ion
abou
t a f
ishe
ry o
r fi
sher
ies
reso
urce
s; a
nd
b)
Giv
e th
e C
hief
Exe
cutiv
e th
e re
cord
s, d
ocum
ents
or
othe
r in
form
atio
n in
a s
tate
d w
ay, o
r at
sta
ted
times
.
Als
o, u
nder
sec
tion
109(
1) o
f th
e F
ishe
ries
Reg
ulat
ion
1995
(‘th
e R
egul
atio
n’)
all h
olde
rs o
f pr
imar
y co
mm
erci
al f
ishi
ng b
oat l
icen
ces
and
hold
ers
of a
utho
ritie
s to
take
, pos
sess
or
sell
fish
mus
t kee
p an
d gi
ve s
tatis
tical
ret
urns
as
requ
ired
by
the
Chi
ef E
xecu
tive.
Del
egat
ion
I ad
vise
that
I h
old
a de
lega
tion
unde
r se
ctio
n 11
8 of
the
Act
, giv
en to
me
by th
e C
hief
Exe
cutiv
e.
Dir
ecti
onI
now
dir
ect
all
hold
ers
of a
Que
ensl
and
prim
ary
com
mer
cial
fis
hing
boa
t lic
ence
to
imm
edia
tely
obt
ain
a lo
gboo
k sp
ecif
ic t
o th
e fi
shin
gac
tiviti
es c
ondu
cted
und
er th
e re
leva
nt p
rim
ary
com
mer
cial
fis
hing
boa
t lic
ence
fro
m th
e D
epar
tmen
t if
not a
lrea
dy h
eld,
and
imm
edia
tely
com
men
ce to
:1.
U
se th
e lo
gboo
k if
you
are
the
licen
ced
com
mer
cial
fis
her
oper
atin
g th
e bo
at, o
r m
ake
the
logb
ook
avai
labl
e to
the
licen
ced
com
mer
cial
fis
her
in c
harg
e of
the
boat
;2.
K
eep
the
logb
ook
(or
ensu
re th
at th
e lo
gboo
k is
kep
t) in
acc
orda
nce
with
the
inst
ruct
ions
con
tain
ed in
the
logb
ook
and
any
wri
tten
inst
ruct
ions
the
Chi
ef E
xecu
tive
may
, fro
m ti
me
to ti
me
prov
ide.
The
inst
ruct
ions
in th
e lo
gboo
k ex
plai
n ho
w to
use
the
logb
ook
and
how
to
prio
r re
port
the
lan
ding
of
prod
uct
if r
equi
red
unde
r th
e Fi
sher
ies
Man
agem
ent
Plan
rel
evan
t to
tha
t fi
sher
y. I
fur
ther
adv
ise
you
that
whe
reve
r th
e in
stru
ctio
ns in
the
logb
ook
refe
r to
the
‘QFM
A’o
r th
e ‘A
utho
rity
’, s
uch
refe
renc
es s
houl
d be
take
n to
be
to th
eC
hief
Exe
cutiv
e; a
nd3
Giv
e th
e co
mpl
eted
logb
ook
(or
ensu
re th
at th
e co
mpl
eted
logb
ook
is g
iven
) to
the
Chi
ef E
xecu
tive
in a
ccor
danc
e w
ith th
e in
stru
ctio
ns c
onta
ined
in th
e lo
gboo
k. I
n pa
rtic
ular
this
inst
ruct
ion
requ
ires
that
the
com
plet
ed lo
gboo
k re
turn
s be
for
war
ded
to th
e C
hief
Exe
cutiv
e w
ithin
a s
peci
fied
tim
e pe
riod
aft
er th
e fi
shin
g to
whi
ch th
ey r
elat
e ha
s oc
curr
ed.
I fu
rthe
r di
rect
all
hold
ers
of a
n au
thor
ity to
take
, pos
sess
or
sell
fish
(co
mm
erci
al f
ishe
r lic
ence
hol
ders
) in
cha
rge
of a
boa
t to:

1.
Ens
ure
that
a lo
gboo
k sp
ecif
ic to
the
fish
ing
activ
ity to
be
unde
rtak
en u
nder
the
rele
vant
pri
mar
y co
mm
erci
al f
ishi
ng b
oat l
icen
ce is
avai
labl
e to
be
com
plet
ed b
efor
e co
mm
enci
ng f
ishi
ng a
ctiv
ities
. If
the
owne
r of
the
boat
is u
nabl
e to
mak
e a
logb
ook
avai
labl
e, it
isad
vise
d th
at y
ou c
onta
ct th
e D
epar
tmen
t dir
ectly
to o
btai
n a
logb
ook
befo
re c
omm
enci
ng f
ishi
ng a
ctiv
ities
. Any
logb
ook
obta
ined
fr
om th
e D
epar
tmen
t mus
t rem
ain
on th
e bo
at th
at it
was
issu
ed to
.Pl
ease
not
e th
at u
nder
Sec
tion
118
of t
he A
ct,
a pe
rson
who
fai
ls t
o co
mpl
y w
ith a
n ob
ligat
ion
to k
eep
and
give
the
log
book
or
othe
rin
form
atio
n ab
out f
ishe
ries
req
uire
d by
the
Chi
ef E
xecu
tive
is li
able
to p
rose
cutio
n fo
r an
off
ence
aga
inst
the
Act
(m
axim
um p
enal
ty 5
00pe
nalty
uni
ts).
J A
Gill
espi
eA
ctin
g D
eput
y D
irec
tor-
Gen
eral
/ D
eleg
ate
Que
ensl
and
Fis
heri
es S
ervi
ce
LE
GIS
LA
TIV
E R
EQ
UIR
EM
EN
TS
All
Que
ensl
and
fish
erie
s ar
e m
anag
ed u
nder
the
Fis
heri
es A
ct 1
994
(the
Act
), th
e F
ishe
ries
Reg
ulat
ion
1995
(the
Reg
ulat
ion)
. You
sho
uld
be f
amili
ar w
ith th
e pr
ovis
ions
of
this
legi
slat
ion.
Und
er o
ther
Sta
te a
nd C
omm
onw
ealth
legi
slat
ion,
you
als
o ha
ve a
n ob
ligat
ion
to r
epor
t int
erac
tions
with
a r
ange
of
spec
ies
to th
e re
leva
ntG
over
nmen
t Dep
artm
ent.
The
Com
mon
wea
lth E
nvir
onm
ent P
rote
ctio
n an
d B
iodi
vers
ity
Con
serv
atio
n A
ct 1
999
(the
EPB
C A
ct)
requ
ires
that
a p
erso
n w
hose
act
ion
resu
lts in
the
deat
h or
inju
ry o
f an
y an
imal
list
ed a
s th
reat
ened
, mig
rato
ry, m
arin
e or
a c
etac
ean
unde
r th
e E
PBC
Act
in a
Com
mon
wea
lthA
rea
to r
epor
t to
the
Secr
etar
y, E
nvir
onm
ent A
ustr
alia
.E
nvir
onm
ent A
ustr
alia
Mar
ine
& W
ater
Div
isio
n:(0
2) 6
274
1223
Fac
sim
ile:
(02)
627
4 10
06A
ddre
ss:
GP
O B
OX
787
, CA
NB
ER
RA
AC
T26
01T
he Q
ueen
slan
d N
atur
e C
onse
rvat
ion
Act
199
2an
d su
bord
inat
e le
gisl
atio
n re
quir
e th
at a
per
son
repo
rt t
he a
ccid
enta
l ta
king
of
a w
hale
,do
lphi
n or
dug
ong
to a
con
serv
atio
n of
fice
r, E
nvir
onm
enta
l Pro
tect
ion
Age
ncy.
Q
ld E
nvir
onm
enta
l Pro
tect
ion
Age
ncy
(Wild
life
Hot
line)
:
1300
360
898
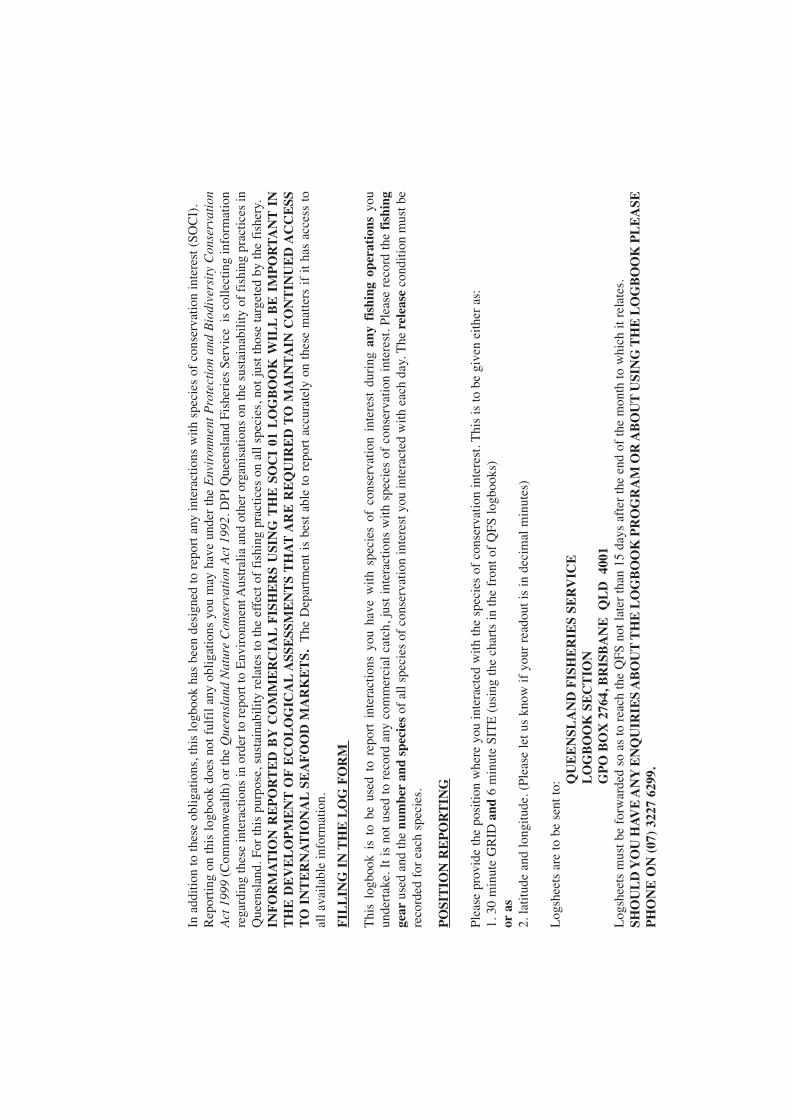
In a
dditi
on to
thes
e ob
ligat
ions
, thi
s lo
gboo
k ha
s be
en d
esig
ned
to r
epor
t any
inte
ract
ions
with
spe
cies
of
cons
erva
tion
inte
rest
(SO
CI)
. R
epor
ting
on th
is lo
gboo
k do
es n
ot f
ulfi
l any
obl
igat
ions
you
may
hav
e un
der
the
Env
iron
men
t P
rote
ctio
n an
d B
iodi
vers
ity
Con
serv
atio
nA
ct 1
999
(Com
mon
wea
lth)
or th
e Q
ueen
slan
d N
atur
e C
onse
rvat
ion
Act
199
2.D
PI Q
ueen
slan
d Fi
sher
ies
Serv
ice
is c
olle
ctin
g in
form
atio
nre
gard
ing
thes
e in
tera
ctio
ns in
ord
er to
rep
ort t
o E
nvir
onm
ent A
ustr
alia
and
oth
er o
rgan
isat
ions
on
the
sust
aina
bilit
y of
fis
hing
pra
ctic
es in
Que
ensl
and.
For
this
pur
pose
, sus
tain
abili
ty r
elat
es to
the
effe
ct o
f fi
shin
g pr
actic
es o
n al
l spe
cies
, not
just
thos
e ta
rget
ed b
y th
e fi
sher
y.
INF
OR
MA
TIO
N R
EP
OR
TE
D B
YC
OM
ME
RC
IAL
FIS
HE
RS
USI
NG
TH
E S
OC
I 01
LO
GB
OO
K W
ILL
BE
IM
PO
RT
AN
TIN
TH
E D
EV
EL
OP
ME
NT
OF
EC
OL
OG
ICA
LA
SSE
SSM
EN
TS
TH
AT
AR
E R
EQ
UIR
ED
TO
MA
INT
AIN
CO
NT
INU
ED
AC
CE
SST
O I
NT
ER
NA
TIO
NA
LSE
AF
OO
D M
AR
KE
TS.
The
Dep
artm
ent
is b
est
able
to
repo
rt a
ccur
atel
y on
the
se m
atte
rs i
f it
has
acce
ss t
oal
l ava
ilabl
e in
form
atio
n.
FIL
LIN
G I
N T
HE
LO
G F
OR
M
Thi
s lo
gboo
k is
to
be u
sed
to r
epor
t in
tera
ctio
ns y
ou h
ave
with
spe
cies
of
cons
erva
tion
inte
rest
dur
ing
any
fish
ing
oper
atio
nsyo
uun
dert
ake.
It
is n
ot u
sed
to r
ecor
d an
y co
mm
erci
al c
atch
, jus
t in
tera
ctio
ns w
ith s
peci
es o
f co
nser
vatio
n in
tere
st. P
leas
e re
cord
the
fis
hing
gear
used
and
the
num
ber
and
spec
ies
of a
ll sp
ecie
s of
con
serv
atio
n in
tere
st y
ou in
tera
cted
with
eac
h da
y. T
he r
elea
seco
nditi
on m
ust b
ere
cord
ed f
or e
ach
spec
ies.
PO
SIT
ION
RE
PO
RT
ING
Plea
se p
rovi
de th
e po
sitio
n w
here
you
inte
ract
ed w
ith th
e sp
ecie
s of
con
serv
atio
n in
tere
st. T
his
is to
be
give
n ei
ther
as:
1. 3
0 m
inut
e G
RID
and
6 m
inut
e SI
TE
(us
ing
the
char
ts in
the
fron
t of
QFS
logb
ooks
) or
as2.
latit
ude
and
long
itude
. (Pl
ease
let u
s kn
ow if
you
r re
adou
t is
in d
ecim
al m
inut
es)
Log
shee
ts a
re to
be
sent
to: Q
UE
EN
SLA
ND
FIS
HE
RIE
S SE
RV
ICE
LO
GB
OO
K S
EC
TIO
NG
PO
BO
X 2
764,
BR
ISB
AN
E Q
LD
400
1L
ogsh
eets
mus
t be
forw
arde
d so
as
to r
each
the
QFS
not
late
r th
an 1
5 da
ys a
fter
the
end
of th
e m
onth
to w
hich
it r
elat
es.
SHO
UL
D Y
OU
HA
VE
AN
YE
NQ
UIR
IES
AB
OU
TT
HE
LO
GB
OO
K P
RO
GR
AM
OR
AB
OU
TU
SIN
G T
HE
LO
GB
OO
K P
LE
ASE
PH
ON
E O
N (
07)
3227
629
9.

Spec
ies
of C
onse
rvat
ion
Inte
rest
(SO
CI
01) Log
book
No
Pag
e N
oB
oat
Mar
kSk
ippe
r’s
/ Lic
ense
Hol
ders
Nam
eM
aste
rF
ishe
rs N
umbe
r
Dat
e an
d tim
eof
cap
ture
Loc
atio
n of
inte
ract
ion
Com
men
ts
I ce
rtif
y th
at th
e in
form
atio
n I
have
pro
vide
d on
this
for
m is
a tr
ue a
nd a
ccur
ate
reco
rdof
the
inte
ract
ions
with
the
spec
ies
of c
onse
rvat
ion
inte
rest
list
ed in
this
logb
ook.
Sign
atur
e
Fish
ing
Gea
rT
raw
lPo
tN
etL
ine
Spec
ies
Cod
es(s
ee in
stru
ctio
npa
ges)
Num
ber
Dea
dN
umbe
rA
live
Num
ber
Inju
red
Tag
orba
ndde
tails
Latitude(or grid)
Longitude(or site)
Rel
ease
Con
ditio
nFX
XK
Reg
Bean
QM
MO
O33
3H
R B
ean
1/2/
03
10.
00A
B912
Net
Du
112
/5/0
3
08.0
0A
B91
Pot
Cor
1
EXAM
PLE
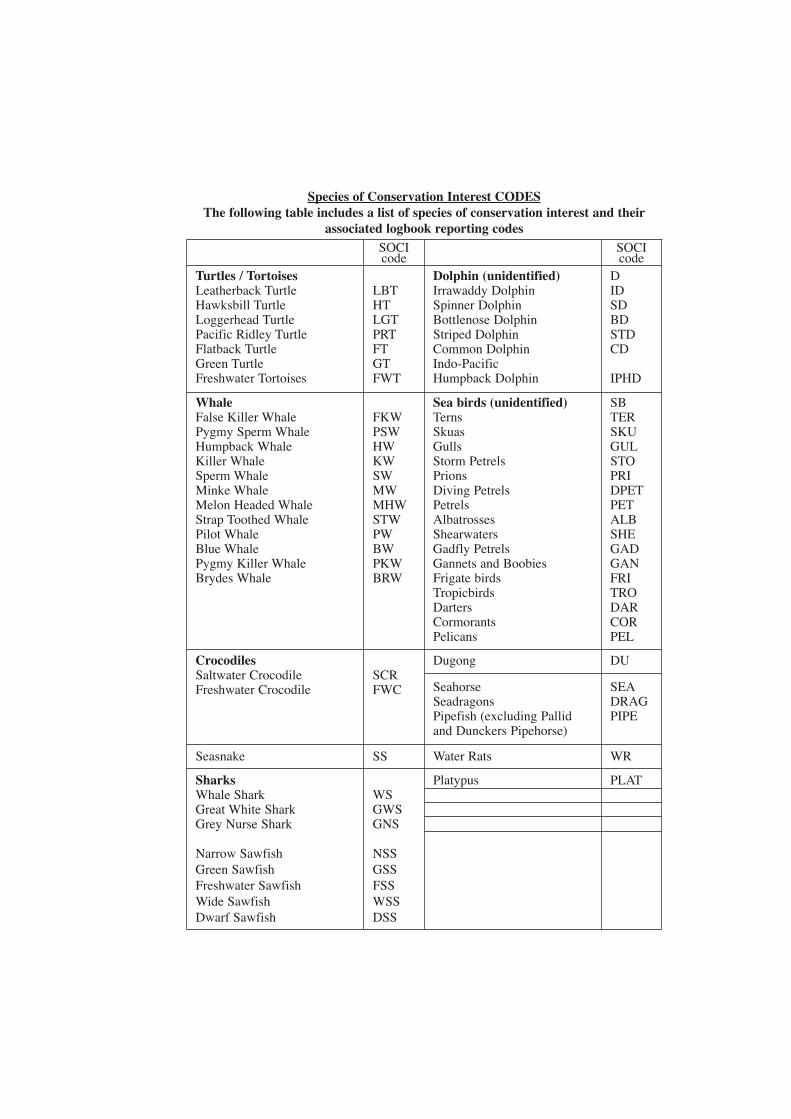
Species of Conservation Interest CODESThe following table includes a list of species of conservation interest and their
associated logbook reporting codes
Turtles / TortoisesLeatherback Turtle Hawksbill TurtleLoggerhead Turtle Pacific Ridley Turtle Flatback Turtle Green Turtle Freshwater Tortoises
Dolphin (unidentified)Irrawaddy DolphinSpinner DolphinBottlenose DolphinStriped Dolphin Common Dolphin Indo-PacificHumpback Dolphin
SOCIcode
SOCIcode
LBTHTLGTPRTFTGTFWT
DIDSDBDSTDCD
IPHD
CrocodilesSaltwater CrocodileFreshwater Crocodile
Dugong
Seasnake SS WRWater Rats
SharksWhale SharkGreat White SharkGrey Nurse Shark
WSGWSGNS
PLATPlatypus
Narrow SawfishGreen SawfishFreshwater SawfishWide SawfishDwarf Sawfish
NSSGSSFSSWSSDSS
SeahorseSeadragonsPipefish (excluding Pallid and Dunckers Pipehorse)
SCRFWC
DU
SEADRAGPIPE
WhaleFalse Killer WhalePygmy Sperm WhaleHumpback WhaleKiller WhaleSperm WhaleMinke WhaleMelon Headed WhaleStrap Toothed WhalePilot WhaleBlue WhalePygmy Killer WhaleBrydes Whale
Sea birds (unidentified)TernsSkuasGullsStorm PetrelsPrionsDiving PetrelsPetrelsAlbatrossesShearwatersGadfly PetrelsGannets and BoobiesFrigate birdsTropicbirdsDartersCormorantsPelicans
FKWPSWHWKWSWMWMHWSTWPWBWPKWBRW
SBTERSKUGULSTOPRIDPETPETALBSHEGADGANFRITRODARCORPEL
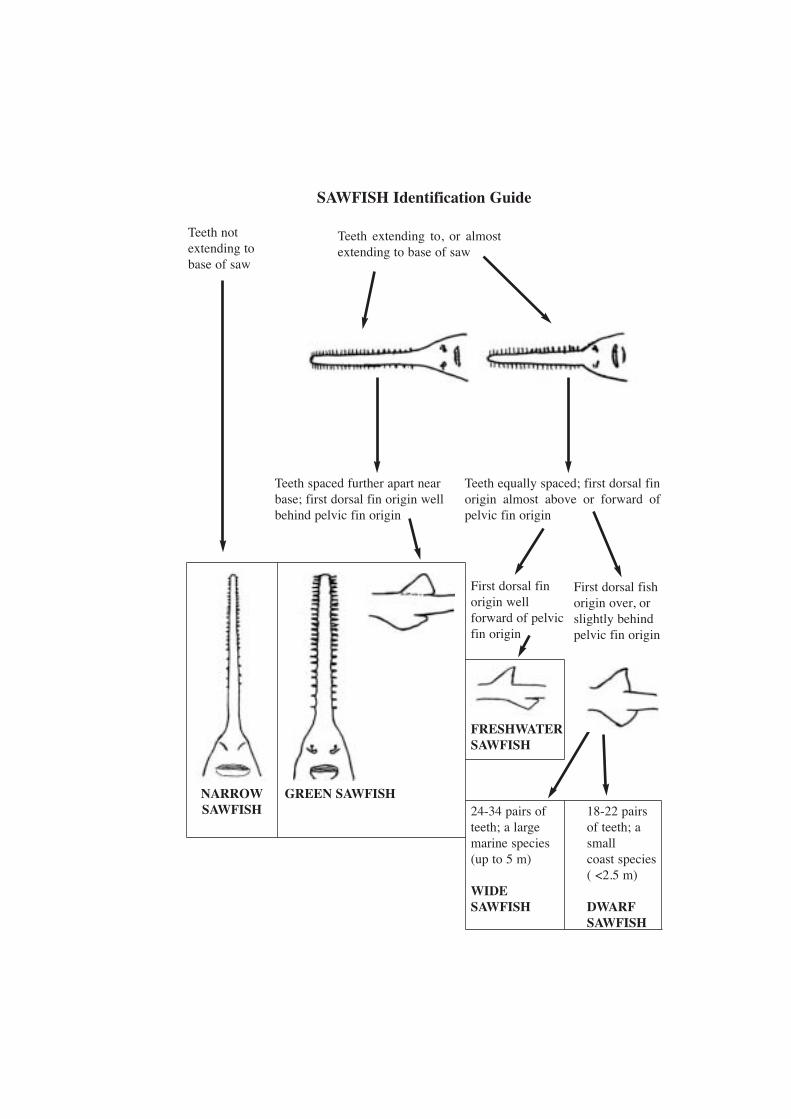
Teeth spaced further apart near base; first dorsal fin origin well behind pelvic fin origin
SAWFISH Identification Guide
Teeth not extending to base of saw
Teeth extending to, or almostextending to base of saw
Teeth equally spaced; first dorsal fin origin almost above or forward ofpelvic fin origin
First dorsal fin origin wellforward of pelvic fin origin
NARROWSAWFISH
GREEN SAWFISH
First dorsal fishorigin over, orslightly behind pelvic fin origin
FRESHWATER SAWFISH
24-34 pairs ofteeth; a largemarine species(up to 5 m)
WIDESAWFISH
18-22 pairsof teeth; asmall coast species( <2.5 m)
DWARFSAWFISH
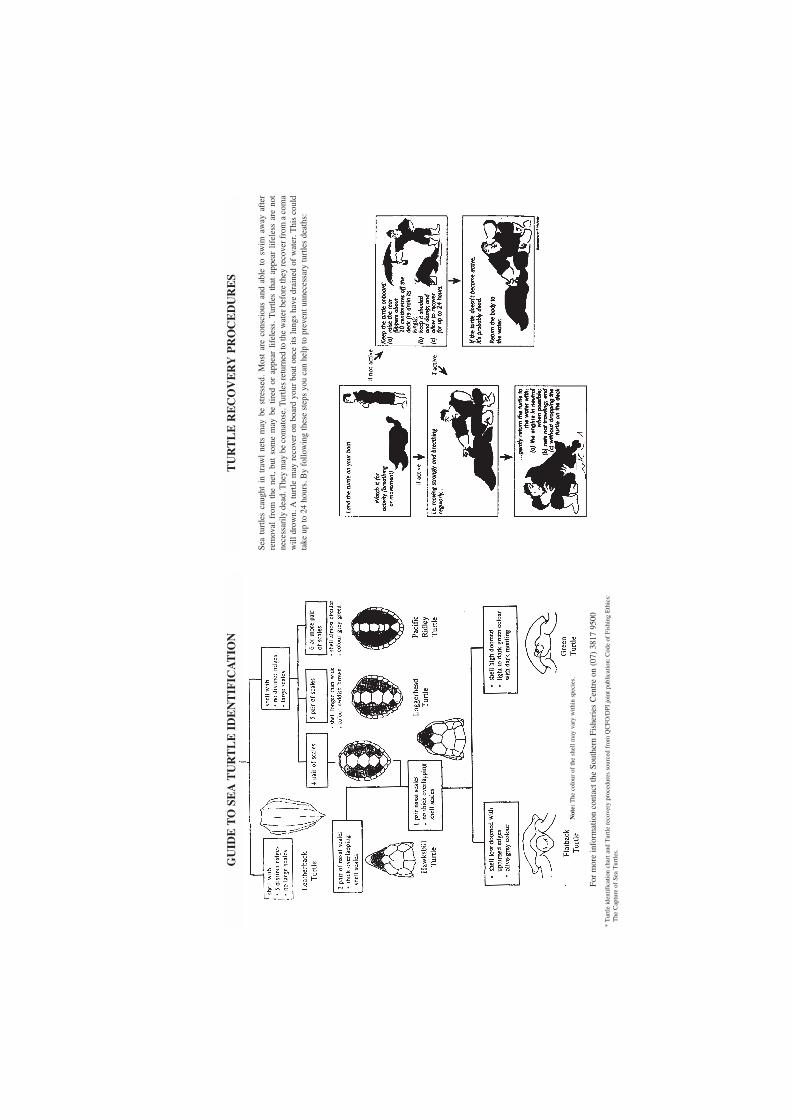
GU
IDE
TO
SE
A T
UR
TL
E I
DE
NT
IFIC
AT
ION
TU
RT
LE
RE
CO
VE
RY
PR
OC
ED
UR
ES
Not
e:T
he c
olou
r of
the
shel
l may
var
y w
ithin
spe
cies
.
For
mor
e in
form
atio
n co
ntac
t the
Sou
ther
n Fi
sher
ies
Cen
tre
on (
07)
3817
950
0
* T
urtle
iden
tific
atio
n ch
art a
nd T
urtle
rec
over
y pr
oced
ures
sou
rced
fro
m Q
CFO
/DPI
join
t pub
licat
ion:
Cod
e of
Fis
hing
Eth
ics:
The
Cap
ture
of
Sea
Tur
tles.
Sea
turt
les
caug
ht i
n tr
awl
nets
may
be
stre
ssed
. M
ost
are
cons
ciou
s an
d ab
le t
o sw
im a
way
aft
erre
mov
al f
rom
the
net
, bu
t so
me
may
be
tired
or
appe
ar l
ifel
ess.
Tur
tles
that
app
ear
lifel
ess
are
not
nece
ssar
ily d
ead.
The
y m
ay b
e co
mat
ose.
Tur
tles
retu
rned
to th
e w
ater
bef
ore
they
reco
ver f
rom
a c
oma
will
dro
wn.
A t
urtle
may
rec
over
on
boar
d yo
ur b
oat
once
its
lun
gs h
ave
drai
ned
of w
ater
. Thi
s co
uld
take
up
to 2
4 ho
urs.
By
follo
win
g th
ese
step
s yo
u ca
n he
lp to
pre
vent
unn
eces
sary
turt
les
deat
hs:
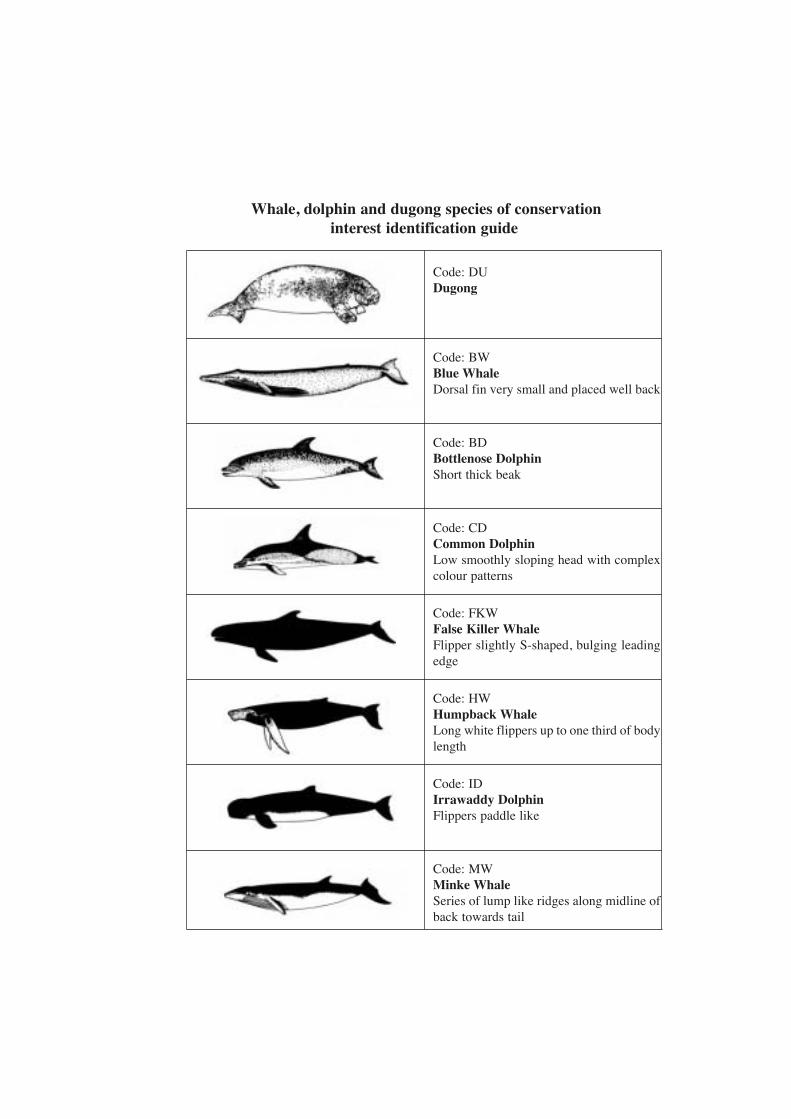
Whale, dolphin and dugong species of conservationinterest identification guide
Code: DUDugong
Code: BWBlue WhaleDorsal fin very small and placed well back
Code: BDBottlenose DolphinShort thick beak
Code: CDCommon DolphinLow smoothly sloping head with complexcolour patterns
Code: FKWFalse Killer WhaleFlipper slightly S-shaped, bulging leadingedge
Code: HWHumpback WhaleLong white flippers up to one third of bodylength
Code: IDIrrawaddy DolphinFlippers paddle like
Code: MWMinke WhaleSeries of lump like ridges along midline ofback towards tail
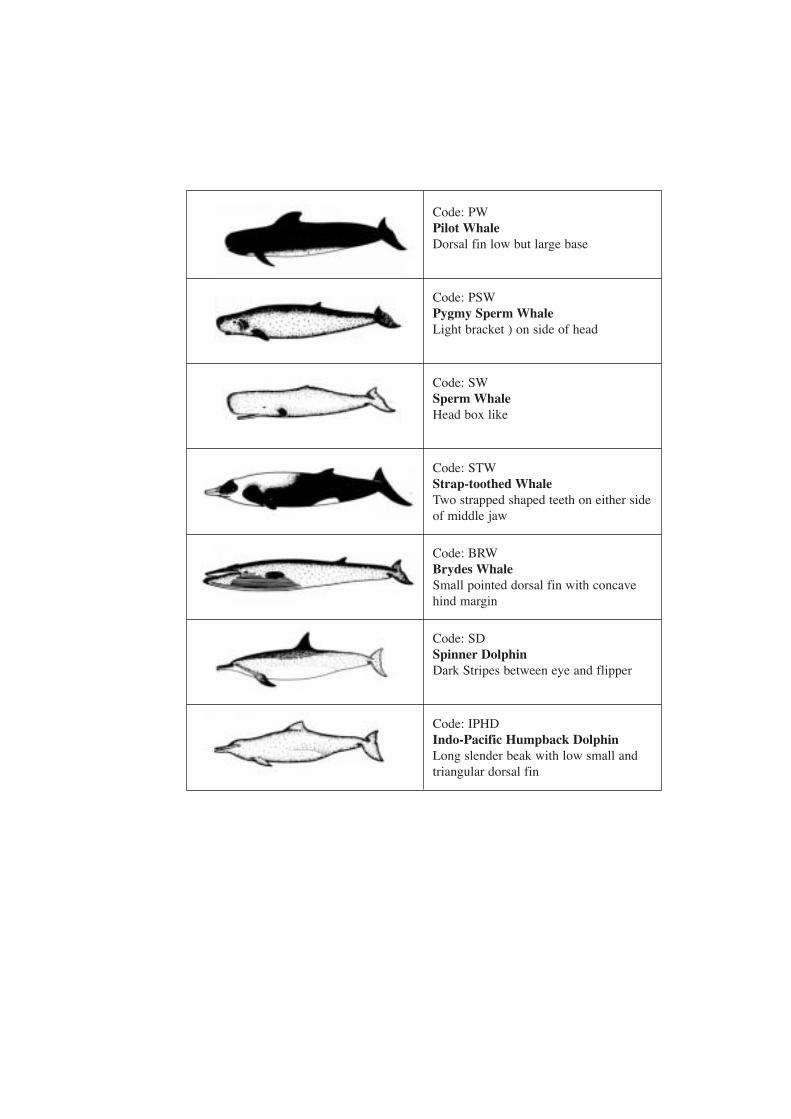
Code: PWPilot WhaleDorsal fin low but large base
Code: PSWPygmy Sperm WhaleLight bracket ) on side of head
Code: SWSperm WhaleHead box like
Code: STWStrap-toothed WhaleTwo strapped shaped teeth on either side of middle jaw
Code: BRWBrydes WhaleSmall pointed dorsal fin with concave hind margin
Code: SDSpinner DolphinDark Stripes between eye and flipper
Code: IPHDIndo-Pacific Humpback DolphinLong slender beak with low small and triangular dorsal fin
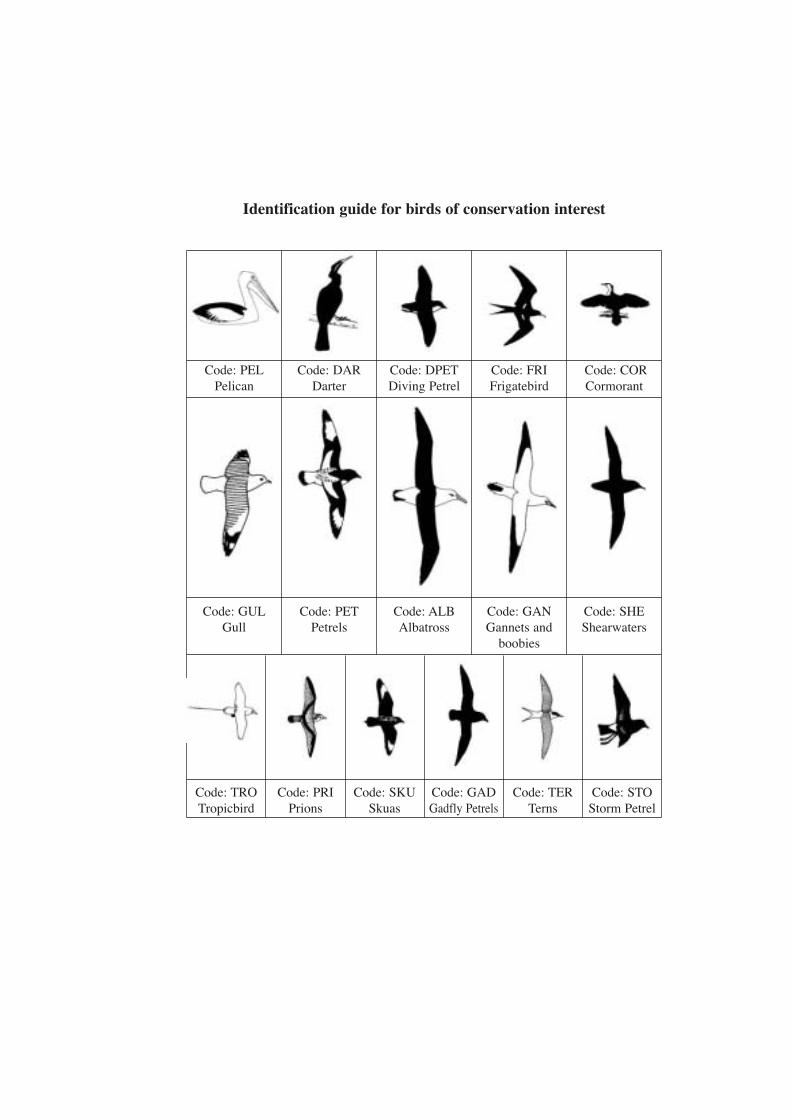
Identification guide for birds of conservation interest
Code: PELPelican
Code: DARDarter
Code: DPETDiving Petrel
Code: FRIFrigatebird
Code: CORCormorant
Code: GULGull
Code: PETPetrels
Code: ALBAlbatross
Code: GANGannets and
boobies
Code: SHEShearwaters
Code: TROTropicbird
Code: PRIPrions
Code: SKUSkuas
Code: GADGadfly Petrels
Code: TERTerns
Code: STOStorm Petrel