water in the roper region of the gulf of carpentaria ... · pdf filewater in the roper region...
TRANSCRIPT
Water in the Roper region of theGulf of Carpentaria Drainage DivisionA report to the Australian Government from the CSIRO Northern Australia Sustainable Yields Project
August 2009
Water in the Roper region of the

ii Water in the Roper region August 2009 © CSIRO 2009
Northern Australia Sustainable Yields Project acknowledgments
Prepared by CSIRO for the Australian Government under the Raising National Water Standards Program of the National Water
Commission (NWC). Important aspects of the work were undertaken by the Northern Territory Department of Natural Resources,
Environment, The Arts and Sport (NRETAS); the Queensland Department of Environment and Resource Management (QDERM); the
New South Wales Department of Water and Energy; Sinclair Knight Merz; Environmental Hydrology Associates and Jolly Consulting.
The Project was guided and reviewed by a Steering Committee (Kerry Olsson, NWC – co-chair; Chris Schweizer, Department of the
Environment, Water, Heritage and the Arts (DEWHA) – co-chair; Tom Hatton, CSIRO; Louise Minty, Bureau of Meteorology (BoM); Lucy,
Vincent, Bureau of Rural Sciences (BRS); Tom Crothers, QDERM; Lyall Hinrichsen, QDERM; Ian Lancaster, NRETAS; Mark Pearcey,
DoW; Michael Douglas, Tropical Rivers and Coastal Knowledge (TRaCK); Dene Moliere, Environmental Research Institute of the
Supervising Scientist (eriss); secretariat support by Angus MacGregor, DEWHA) and benefited from additional reviews by a Technical
Reference Panel and other experts, both inside and outside CSIRO.
Northern Australia Sustainable Yields Project disclaimers
Derived from or contains data and/or software provided by the Organisations. The Organisations give no warranty in relation to the data
and/or software they provided (including accuracy, reliability, completeness, currency or suitability) and accept no liability (including
without limitation, liability in negligence) for any loss, damage or costs (including consequential damage) relating to any use or reliance
on the data or software including any material derived from that data or software. Data must not be used for direct marketing or be used
in breach of the privacy laws. Organisations include: the Northern Territory Department of Natural Resources, Environment, The Arts
and Sport; the Queensland Department of Environment and Resource Management; the New South Wales Department of Water and
Energy.
CSIRO advises that the information contained in this publication comprises general statements based on scientific research. The reader
is advised and needs to be aware that such information may be incomplete or unable to be used in any specific situation. No reliance or
actions must therefore be made on that information without seeking prior expert professional, scientific and technical advice. To the
extent permitted by law, CSIRO (including its employees and consultants) excludes all liability to any person for any consequences,
including but not limited to all losses, damages, costs, expenses and any other compensation, arising directly or indirectly from using
this publication (in part or in whole) and any information or material contained in it. Data are assumed to be correct as received from the
organisations.
Citation
CSIRO (2009) Water in the Roper region, pp 59-120 in CSIRO (2009) Water in the Gulf of Carpentaria Drainage Division. A report to the
Australian Government from the CSIRO Northern Australia Sustainable Yields Project. CSIRO Water for a Healthy Country Flagship,
Australia. xl + 479pp
Publication Details
Published by CSIRO © 2009 all rights reserved. This work is copyright. Apart from any use as permitted under the Copyright Act 1968,
no part may be reproduced by any process without prior written permission from CSIRO.
ISSN 1835-095X
Cover photograph: Minyerri Waterhole, NT
Courtesy of the Northern Territory Department of Natural Resources, Environment and The Arts
Photographer: Ursula Zaar

© CSIRO 2009 August 2009 Water in the Roper region ▪ iii
Director’s Foreword
Following the November 2006 Summit on the southern Murray-Darling Basin (MDB), the then Prime Minister and MDB
state Premiers commissioned CSIRO to undertake an assessment of sustainable yields of surface and groundwater
systems within the MDB. The project set an international benchmark for rigorous and detailed basin-scale assessment of
the anticipated impacts of climate change, catchment development and increasing groundwater extraction on the
availability and use of water resources.
On 26 March 2008, the Council of Australian Governments (COAG) agreed to expand the CSIRO assessments of
sustainable yield so that, for the first time, Australia would have a comprehensive scientific assessment of water yield in
all major water systems across the country. This would allow a consistent analytical framework for water policy decisions
across the nation. The Northern Australia Sustainable Yields Project, together with allied projects for Tasmania and
south-west Western Australia, will provide a nation-wide expansion of the assessments.
The CSIRO Northern Australia Sustainable Yields Project is providing critical information on current and likely future
water availability. This information will help governments, industry and communities consider the environmental, social
and economic aspects of the sustainable use and management of the precious water assets of northern Australia.
The projects are the first rigorous attempt for the regions to estimate the impacts of catchment development, changing
groundwater extraction, climate variability and anticipated climate change on water resources at a whole-of-region scale,
explicitly considering the connectivity of surface and groundwater systems. To do this, we are undertaking the most
comprehensive hydrological modelling ever attempted for the region, using rainfall-runoff models, groundwater recharge
models, river system models and groundwater models, and considering all upstream-downstream and surface-
subsurface connections.
To deliver on the projects CSIRO is drawing on the scientific leadership and technical expertise of national and state
government agencies in Queensland, Tasmania, the Northern Territory and Western Australia, as well as Australia’s
leading industry consultants. The projects are dependent on the cooperative participation of over 50 government and
private sector organisations. The projects have established a comprehensive but efficient process of internal and
external quality assurance on all the work performed and all the results delivered, including advice from senior academic,
industry and government experts.
The projects are led by the Water for a Healthy Country Flagship, a CSIRO-led research initiative established to deliver
the science required for sustainable management of water resources in Australia. By building the capacity and capability
required to deliver on this ambitious goal, the Flagship is ideally positioned to accept the challenge presented by this
complex integrative project.
CSIRO has given the Sustainable Yields Projects its highest priority. It is in that context that I am very pleased and proud
to commend this report to the Australian Government.
Dr Tom Hatton
Director, Water for a Healthy Country
National Research Flagships
CSIRO
iv Water in the Roper region August 2009 © CSIRO 2009
Contributors to the Northern Australia Sustainable
Yields Project
Project director Tom Hatton
Sustainable Yields coordination Mac Kirby
Project Leader Richard Cresswell
Project Support Andrea Davis, Malcolm Hodgen, Sue Jackson, Helen Beringen, Justin Story, Siobhan Duffy, Therese
McGillion, Jeff Camkin
Data Management Mick Hartcher
Climate Tim McVicar, Randall Donohue, Janice Bathols, Francis Chiew, Dewi Kirono, Lingtao Li, Steve
Marvanek, David Post, Nick Potter, Ian Smith, Tom Van Neil, Wenju Cai
New South Wales Department of Water and Energy: Jin Teng
Catchment Yield Cuan Petheram, Paul Rustomji, Jamie Vleeshouwer, Donna Hughes, Jean-Michel Perraud, Ang Yang,
Lu Zhang
Sinclair Knight Merz: Brad Neal, Amanda Bell, Werner Hennecke, Damon Grace, Derek Goodin, Rory
Nathan, David Stephens, Nicola Logan, Sarah Gosling, Zuzanna Graszkiewicz
Queensland Department of Environment and Resource Management: Alex Loy, Greg Hausler, Sarah
Giles, David Li, Amanda Casey
Groundwater Glenn Harrington, Russell Crosbie, Phil Davies, James McCallum, Warrick Dawes, Matthew Lenahan,
David Rassam
Sinclair Knight Merz: Rick Evans, Roger Cranswick, Eliza Wiltshire
Jolly Consulting: Peter Jolly
Environmental Hydrology Associates: Peter Evans, Jerome Arunakumaren, Wesley Burrows, Judith
Raue
Northern Territory Department of Natural Resources, Environment, The Arts and Sport: Anthony
Knapton, Lynton Fritz, Steven Tickell
Queensland Department of Environment and Resource Management: Linda Foster, Ralph DeVoil
Environment Dave McJannet, Anne Henderson, Joe McMahon, Jim Wallace
Reporting Susan Cuddy, Becky Schmidt, Heinz Buettikofer, Elissa Churchward, Alex Dyce, Simon Gallant, Chris
Maguire, Frances Marston, Linda Merrin, Ben Wurcker
dmwcreative: Maureen Wicks, David Wicks
CSIRO unless otherwise indicated; Team Leaders underlined

© CSIRO 2009 August 2009 Water in the Roper region ▪ v
Table of contents
RO-1 Water availability and demand in the Roper region ........................................................ 61 RO-1.1 Regional summary .........................................................................................................................................................62 RO-1.2 Water resource assessment ..........................................................................................................................................63 RO-1.3 Changes to flow regime at environmental assets ..........................................................................................................64 RO-1.4 Seasonality of water resources ......................................................................................................................................64 RO-1.5 Surface–groundwater interaction ...................................................................................................................................65 RO-1.6 Water storage options ....................................................................................................................................................67 RO-1.7 Data gaps.......................................................................................................................................................................68 RO-1.8 Knowledge gaps.............................................................................................................................................................68 RO-1.9 References.....................................................................................................................................................................69
RO-2 Contextual information for the Roper region..................................................................... 70 RO-2.1 Overview of the region ...................................................................................................................................................71 RO-2.2 Data availability ..............................................................................................................................................................79 RO-2.3 Hydrogeology .................................................................................................................................................................82 RO-2.4 Legislation, water plans and other arrangements ..........................................................................................................89 RO-2.5 References.....................................................................................................................................................................92
RO-3 Water balance results for the Roper region....................................................................... 93 RO-3.1 Climate ...........................................................................................................................................................................93 RO-3.2 WAVES potential diffuse recharge estimations............................................................................................................100 RO-3.3 Conceptual groundwater models .................................................................................................................................103 RO-3.4 Groundwater modelling results ....................................................................................................................................105 RO-3.5 Rainfall-runoff modelling results...................................................................................................................................107 RO-3.6 River system water balance .........................................................................................................................................118 RO-3.7 Changes to flow regimes at environmental assets.......................................................................................................119 RO-3.8 References...................................................................................................................................................................120

vi ▪ Water in the Roper region August 2009 © CSIRO 2009
Tables
Table RO-1. Estimated groundwater contribution (baseflow) to streamflow, modelled diffuse recharge and groundwater extraction for the Roper region under historical climate .....................................................................................................................................63 Table RO-2. List of Wetlands of National Significance located within the Roper region ...................................................................76 Table RO-3. Mean annual (water year), wet season and dry season rainfall and areal potential evapotranspiration averaged over the Roper region under historical climate and Scenario C ................................................................................................................97 Table RO-4. Recharge scaling factors in the Roper region under scenarios A, B and C ................................................................100 Table RO-5. Summary results under 45 Scenario C variants (numbers show percentage change in mean annual rainfall and recharge under Scenario C relative to Scenario A) .........................................................................................................................102 Table RO-6. Summary results under the 45 Scenario C simulations for the modelling subcatchments in the Roper region (numbers show percentage change in mean annual rainfall and modelled runoff under Scenario C relative to Scenario A) .........................113 Table RO-7. Water balance over the entire Roper region under Scenario A and under scenarios B and C relative to Scenario A115
Figures
Figure RO-1. Major rivers, towns and location of environmental assets selected for assessment of changes to hydrological regime in the Roper region ............................................................................................................................................................................61 Figure RO-2. Hydrogeology of the Roper region (map provided by the Northern Territory Department of Natural Resources, Environment, the Arts and Sport).......................................................................................................................................................66 Figure RO-3. Modelled mean monthly groundwater discharge in the Roper River at gauges G9030176 and G9030013................67 Figure RO-4. Relationship between flow at gauging stations G9030013 and G9030250 on the Roper River ..................................67 Figure RO-5. Surface geology of the Roper region overlaid on a relative relief surface ...................................................................72 Figure RO-6. Historical (a) annual and (b) mean monthly rainfall averaged over the Roper region. The low-frequency smoothed line in (a) indicates longer term variability..........................................................................................................................................73 Figure RO-7. Map of current vegetation types across the Roper region (source DEWR, 2005) .......................................................74 Figure RO-8. Map of dominant land uses of the Roper region (after BRS, 2002) .............................................................................75 Figure RO-9. False colour satellite image of the Limmen Bight (Port Roper) Tidal Wetlands System (derived from ACRES, 2000). Clouds may be visible in image .........................................................................................................................................................77 Figure RO-10. False colour satellite image of the Mataranka Thermal Pools (derived from ACRES, 2000). Clouds may be visible in image .................................................................................................................................................................................................78 Figure RO-11. Location of surface water gauging stations overlaid on a relative relief surface showing the proportion of gauges with flow above maximum gauged stage height across the Roper region. Productive aquifer layer includes key dolostone, limestone and Cretaceous sandstone formations..............................................................................................................................80 Figure RO-12. Current groundwater monitoring bores in the Roper region.......................................................................................81 Figure RO-13. Location of groundwater bores in the Roper region (map provided by the Northern Territory Department of Natural Resources, Environment, The Arts and Sport) ..................................................................................................................................82 Figure RO-14. Location of the Roper region in relation to the Daly, Wiso and Georgina basins (map provided by the Northern Territory Department of Natural Resources, Environment, The Arts and Sport) ...............................................................................84 Figure RO-15. Schematic of the recharge/discharge cycle that applies in the Roper region ............................................................85 Figure RO-16. Observed groundwater levels in bores in the (a) Cretaceous Sandstone at Angurugu, (b) Tindall Limestone near Mataranka and (c) Proterozoic carbonates near Beswick .................................................................................................................86 Figure RO-17. Groundwater salinity distribution for all bores drilled in the Roper region..................................................................88 Figure RO-18. (a) Historical annual rainfall and (b) its divergence from the long-term mean; and (c) historical annual areal potential evapotranspiration and (d) its divergence from the long-term mean averaged over the Roper region. The low-frequency smoothed line in (a) indicates longer term variability..........................................................................................................................................94 Figure RO-19. Historical mean monthly (a) rainfall and (b) areal potential evapotranspiration and their temporal variation (range and ± one standard deviation) averaged over the Roper region .......................................................................................................94 Figure RO-20. Spatial distribution of historical mean annual (water year), wet season and dry season rainfall and areal potential evapotranspiration (potential evaporation) and their difference (rainfall less areal potential evapotranspiration) across the Roper region .................................................................................................................................................................................................95 Figure RO-21. Spatial distribution of (a) historical and (b) recent mean annual rainfall; and (c) their relative percent difference and (d) the statistical significance of these differences across the Roper region. (Note that historical in this case is the 66-year period 1930 to 1996).....................................................................................................................................................................................96 Figure RO-22. Mean monthly (a) rainfall and (b) areal potential evapotranspiration across the Roper region under historical climate and Scenario C. (C range is the range in potential evapotranspiration pooled from all global climate model outputs from all three emission scenarios – the lower and upper limits in C range are therefore not the same as scenarios Cdry and Cwet) ...................97 Figure RO-23. Spatial distribution of mean annual (water year), wet season and dry season rainfall across the Roper region under historical climate and Scenario C.......................................................................................................................................................98 Figure RO-24. Spatial distribution of mean annual (water year), wet season and dry season areal potential evapotranspiration across the Roper region under historical climate and Scenario C.....................................................................................................99
© CSIRO 2009 August 2009 Water in the Roper region ▪ vii
Figure RO-25. Spatial distribution of historical mean recharge rate and recharge scaling factors across the Roper region for scenarios A, B and C. The hatched region on the historical recharge map identifies where unweathered bedrock outcrops occur.........................................................................................................................................................................................................101 Figure RO-26. Percentage change in mean annual recharge under the 45 Scenario C variants (15 global climate models and three global warming scenarios) relative to Scenario A ............................................................................................................................102 Figure RO-27. Schematic of hydrogeological cross-section showing groundwater discharge to the Mainoru River.......................103 Figure RO-28. Schematic of hydrogeological cross-section showing groundwater discharge to the Roper River..........................104 Figure RO-29. Schematic of hydrogeological cross-section showing groundwater discharge that provides the dry season flow for Wonga Creek ...................................................................................................................................................................................104 Figure RO-30. Estimated annual (water year) recharge for the Roper region.................................................................................105 Figure RO-31. Impact of hypothetical scenarios in an unconfined aquifer on stream depletion......................................................106 Figure RO-32. Map of the modelling subcatchments, calibration catchments and calibration gauging stations used for the Roper region with inset highlighting (in red) the extent of the calibration catchments. Notes: (i) gauge G8240002 is in the Arafura region while gauges G9070132 and G9080133 are in the South-west Gulf region; and (ii) the area of the rainfall-runoff catchments is slightly different from the Australian Water Resources Council boundary as it is based on a more recent version of the digital elevation model................................................................................................................................................................................107 Figure RO-33. Modelled and observed monthly runoff and daily flow exceedance curve for each calibration catchment in the Roper region. (Red text denotes gauges located outside the region; blue text denotes gauges used to predict streamflow only) ...........109 Figure RO-34. Spatial distribution of mean annual (a) rainfall and (b) modelled runoff across the Roper region under Scenario A.........................................................................................................................................................................................................110 Figure RO-35. Annual (a) rainfall and (b) modelled runoff in the Roper region under Scenario A ..................................................111 Figure RO-36. Minimum, maximum and A range monthly (a) rainfall and (b) modelled runoff; and mean, median and A range monthly (c) rainfall and (d) modelled runoff in the Roper region under Scenario A (A range is the 25th to 75th percentile monthly rainfall or runoff)...............................................................................................................................................................................111 Figure RO-37. Spatial distribution of mean annual (a) rainfall and (b) modelled runoff across the Roper region under Scenario B.........................................................................................................................................................................................................112 Figure RO-38. Percentage change in mean annual modelled runoff under the 45 Scenario C variants (15 global climate models and three global warming scenarios) relative to Scenario A............................................................................................................113 Figure RO-39. Spatial distribution of mean annual rainfall and modelled runoff across the Roper region under Scenario A and under Scenario C relative to Scenario A..........................................................................................................................................114 Figure RO-40. Mean monthly (a) rainfall and (b) modelled runoff in the Roper region under scenarios A and C (C range is based on the consideration of each rainfall and runoff percentile separately – the lower and upper limits in C range are therefore not the same as scenarios Cdry and Cwet) .................................................................................................................................................115 Figure RO-41. Daily flow exceedance curves for (a) rainfall and (b) modelled runoff in the Roper region under scenarios A, B and C (C range is based on the consideration of each rainfall and runoff percentile separately – the lower and upper limits in C range are therefore not the same as scenarios Cdry and Cwet) ...............................................................................................................116 Figure RO-42. Level of confidence in the modelling of runoff for (a) mid- to high flow events and (b) monthly dry season flow events for the modelling subcatchments of the Roper region. 1 is the highest level of confidence, 5 is the lowest........................117 Figure RO-43. Map of streamflow reporting nodes (gauging stations, environmental sites, dummy nodes and storage inflows) in the Roper region. (No storage inflows are reported for this region).................................................................................................118

viii ▪ Water in the Roper region August 2009 © CSIRO 2009
Abbreviations and acronyms
Abbreviation or acronym
Description
AHD Australian Height Datum
AMTD Adopted Middle Thread Distance (the distance along a river upstream from its outlet)
APET Areal potential evapotranspiration
AR4 The fourth assessment report of the Intergovernmental Panel on Climate Change
ARI Average recurrence interval – the statistical length of time that might be expected to pass before a similar condition is repeated
AWRC Australian Water Resources Council
BFI Baseflow index – the ratio of baseflow volume to total flow volume over a specified period, commonly assumed to be the amount of groundwater input to stream flow
BRS Bureau of Rural Sciences, Department of Agriculture, Fisheries and Forestry
CLW CSIRO Division of Land and Water
CMAR CSIRO Division of Marine and Atmospheric Research
CMB Chloride mass balance
CO2 Carbon dioxide
COAG Council of Australian Governments
CSIRO Commonwealth Scientific and Industrial Research Organisation
DEM Digital elevation model
DERM (Queensland) Department of Environment and Resource Management
DEWHA Department of the Environment, Water, Heritage and the Arts, Australian Government
DNRM Previous incantation of DERM
DNRW Previous incantation of DERM
DTW Depth to watertable
E Extraction
E/B Extraction to baseflow ratio
E/R Extraction to recharge ratio
Ef Future groundwater extraction
EC Electrical conductivity, a measure of salinity. 1 EC (S/cm) ≈ 0.6 mg/L TDS
ET Evapotranspiration
FDC Flow duration curve
GAB Great Artesian Basin
GCM Global climate model, also known as general circulation model
GDA Geographic datum of Australia
GDE Groundwater-dependent ecosystem
GRCI Groundwater resource condition indicator
IQQM Integrated Quantity and Quality Model – a river systems model
MAR Managed aquifer recharge
MDB Murray-Darling Basin
MGSH Maximum gauged stage height
MSLP Mean sea level pressure
NAILSMA Northern Australia Indigenous Land and Sea Management Alliance
NAS Network attached storage
NALWT Northern Australia Land and Water Taskforce (http://www.nalwt.gov.au/)
NAWFA Northern Australia Water Futures Assessment (http://www.environment.gov.au/nawfa/)
NRETA Previous incantation of NRETAS
NRETAS Northern Territory Department of Natural Resources, Environment, the Arts and Sport
NSE Nash-Sutcliffe Efficiency coefficient used to assess the predictive power of hydrological models. Values range from -∞ to +1, where +1 is a perfect match to observations. Analogous to the R2 coefficient of determination
PET Potential evapotranspiration
R Recharge
RAM Random access memory
RSF Recharge scaling factor
SAN Storage area network

© CSIRO 2009 August 2009 Water in the Roper region ▪ ix
Abbreviation or acronym
Description
SILO Enhanced meteorological datasets (http://www.bom.gov.au/silo/index.shtml)
SRN Streamflow reporting node
TDS Total Dissolved Solids (mg/L ≈ 1.7 EC)
TRaCK Tropical Rivers and Coastal Knowledge Research Hub
WRON Water Resources Observation Network
Units of measurement
Measurement units Description
ML Megalitres, 1,000,000 litres
GL Gigalitres, 1,000,000,000 litres
TL Teralitres, 1,000,000,000,000 litres
Cumecs Cubic metres per second; m3/sec; equivalent to 1,000 litres per second
1 Sydney Harbour ~500 GL
1 Lake Argyle 10,380 GL
x ▪ Water in the Roper region August 2009 © CSIRO 2009
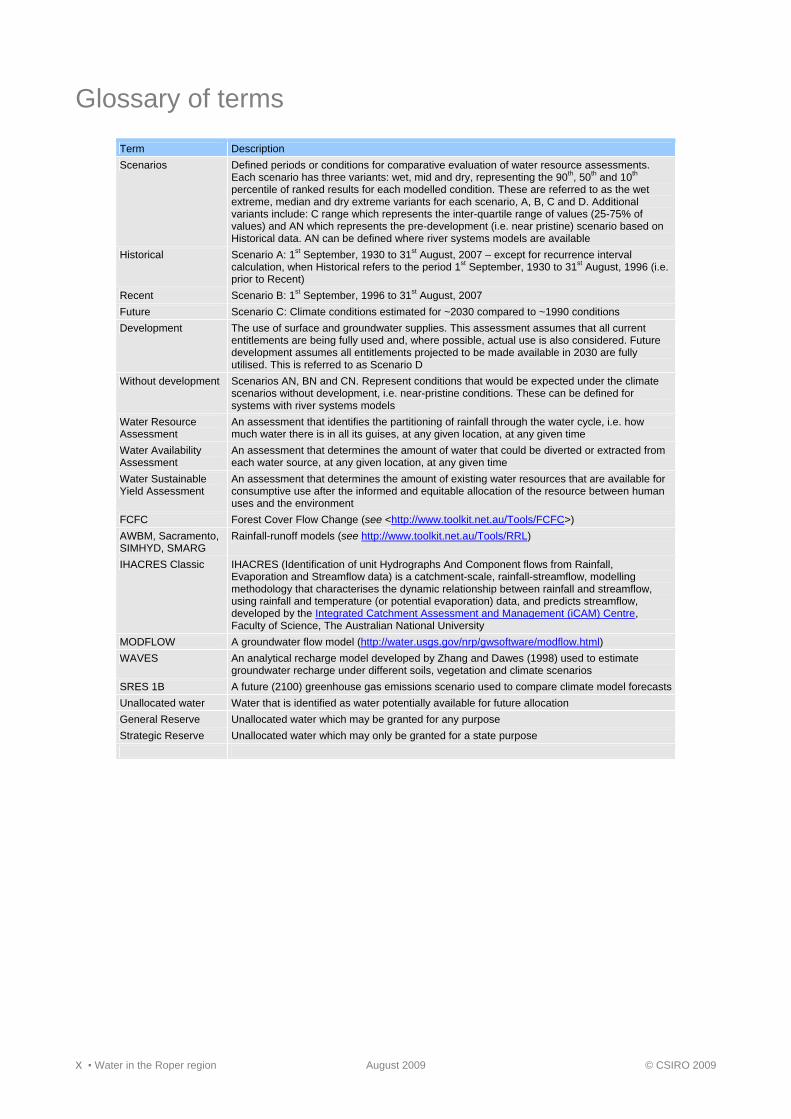
Glossary of terms
Term Description
Scenarios Defined periods or conditions for comparative evaluation of water resource assessments. Each scenario has three variants: wet, mid and dry, representing the 90th, 50th and 10th percentile of ranked results for each modelled condition. These are referred to as the wet extreme, median and dry extreme variants for each scenario, A, B, C and D. Additional variants include: C range which represents the inter-quartile range of values (25-75% of values) and AN which represents the pre-development (i.e. near pristine) scenario based on Historical data. AN can be defined where river systems models are available
Historical Scenario A: 1st September, 1930 to 31st August, 2007 – except for recurrence interval calculation, when Historical refers to the period 1st September, 1930 to 31st August, 1996 (i.e. prior to Recent)
Recent Scenario B: 1st September, 1996 to 31st August, 2007
Future Scenario C: Climate conditions estimated for ~2030 compared to ~1990 conditions
Development The use of surface and groundwater supplies. This assessment assumes that all current entitlements are being fully used and, where possible, actual use is also considered. Future development assumes all entitlements projected to be made available in 2030 are fully utilised. This is referred to as Scenario D
Without development Scenarios AN, BN and CN. Represent conditions that would be expected under the climate scenarios without development, i.e. near-pristine conditions. These can be defined for systems with river systems models
Water Resource Assessment
An assessment that identifies the partitioning of rainfall through the water cycle, i.e. how much water there is in all its guises, at any given location, at any given time
Water Availability Assessment
An assessment that determines the amount of water that could be diverted or extracted from each water source, at any given location, at any given time
Water Sustainable Yield Assessment
An assessment that determines the amount of existing water resources that are available for consumptive use after the informed and equitable allocation of the resource between human uses and the environment
FCFC Forest Cover Flow Change (see <http://www.toolkit.net.au/Tools/FCFC>)
AWBM, Sacramento, SIMHYD, SMARG
Rainfall-runoff models (see http://www.toolkit.net.au/Tools/RRL)
IHACRES Classic IHACRES (Identification of unit Hydrographs And Component flows from Rainfall, Evaporation and Streamflow data) is a catchment-scale, rainfall-streamflow, modelling methodology that characterises the dynamic relationship between rainfall and streamflow, using rainfall and temperature (or potential evaporation) data, and predicts streamflow, developed by the Integrated Catchment Assessment and Management (iCAM) Centre, Faculty of Science, The Australian National University
MODFLOW A groundwater flow model (http://water.usgs.gov/nrp/gwsoftware/modflow.html)
WAVES An analytical recharge model developed by Zhang and Dawes (1998) used to estimate groundwater recharge under different soils, vegetation and climate scenarios
SRES 1B A future (2100) greenhouse gas emissions scenario used to compare climate model forecasts
Unallocated water Water that is identified as water potentially available for future allocation
General Reserve Unallocated water which may be granted for any purpose
Strategic Reserve Unallocated water which may only be granted for a state purpose
Water in the Roper region

© CSIRO 2009 August 2009 Water in the Roper region ▪ 61
RO
-1 W
ateravailab
ilityand
demand
inthe
Ro
perregion
RO-1 Water availability and demand in the Roper
region
The first part of this report (the Preamble, Chapter 1 and Chapter 2) reports at the division level, including division-wide
descriptions of climate and geology and methods which apply to all regions. Subsequent chapters report at the region
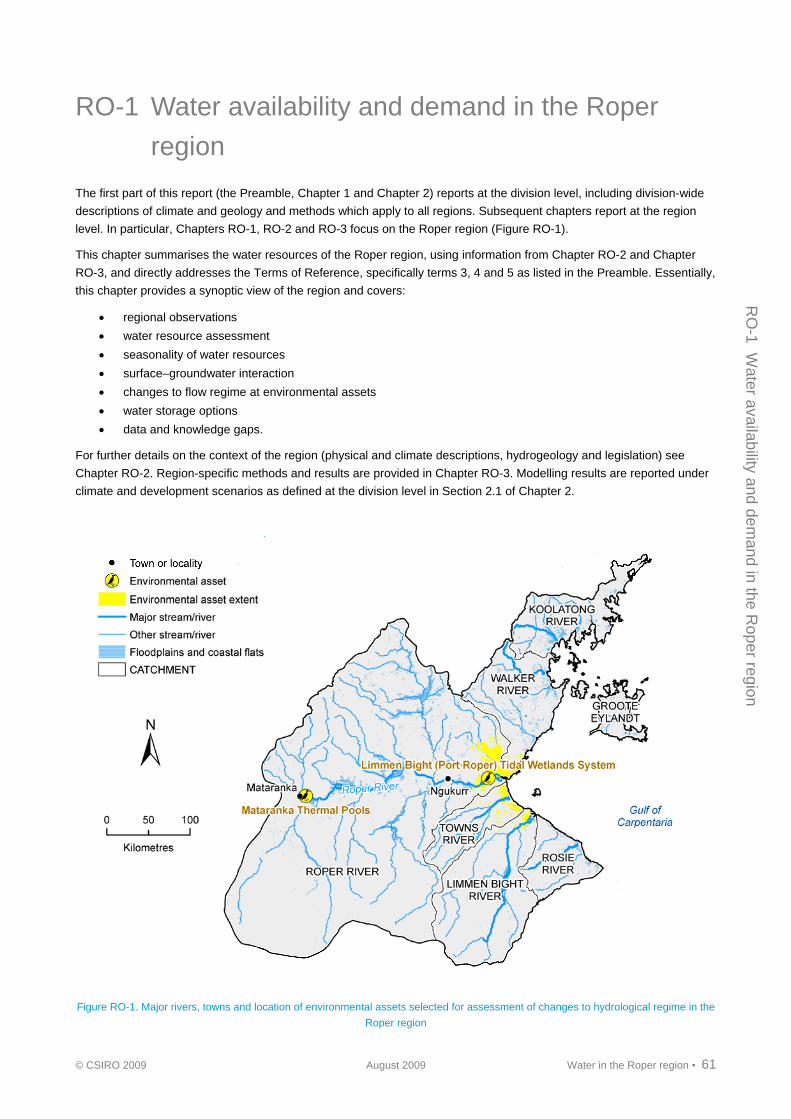
level. In particular, Chapters RO-1, RO-2 and RO-3 focus on the Roper region (Figure RO-1).
This chapter summarises the water resources of the Roper region, using information from Chapter RO-2 and Chapter
RO-3, and directly addresses the Terms of Reference, specifically terms 3, 4 and 5 as listed in the Preamble. Essentially,
this chapter provides a synoptic view of the region and covers:
regional observations
water resource assessment
seasonality of water resources
surface–groundwater interaction
changes to flow regime at environmental assets
water storage options
data and knowledge gaps.
For further details on the context of the region (physical and climate descriptions, hydrogeology and legislation) see
Chapter RO-2. Region-specific methods and results are provided in Chapter RO-3. Modelling results are reported under
climate and development scenarios as defined at the division level in Section 2.1 of Chapter 2.
Figure RO-1. Major rivers, towns and location of environmental assets selected for assessment of changes to hydrological regime in the
Roper region
62 ▪ Water in the Roper region August 2009 © CSIRO 2009
RO
-1
Wat
er a
vaila
bili
ty a
nd d
eman
d in
the
Rop
er r
egio
n
RO-1.1 Regional summary
These regional observations summarise key modelling results and other relevant water resource information about the
Roper region.
The Roper region has a high inter-annual variability of rainfall and hence also runoff and groundwater recharge, with
coefficients of variation of 0.25 and 0.67 for rainfall and runoff, respectively. These values reflect multiple years of
significantly below average or above average rainfall.
Mean annual rainfall for the region is 843 mm. Mean annual areal potential evapotranspiration (APET) is 1477 mm. The
mean annual runoff averaged over the modelled area of the Roper region is 112 mm, 8 percent of rainfall. Under the
historical climate the mean annual streamflow over the Roper region is estimated to be 14,394 GL.
There is a strong seasonality with 96 percent of rainfall falling between November and May. The region has a relatively
high rainfall intensity and hence rapid runoff and short lag between rainfall and runoff, with a slighting increasing amount
and intensity of rainfall over the historical (1930 to 2007) period. Rainfall and runoff generation both decline with distance
from the coast, with rainfall also showing a strong north-south gradient. Runoff has a stronger east–west gradient and
varies from 20 to 4 percent of rainfall across the region. Lower reaches are flood determined and dominated.
The Roper region has a recent (1996 to 2007) climate that is wetter than the historical mean by 10 to 40 percent, and
was wetter to the south and west. This resulted in a regionally averaged 54 percent increase in runoff compared to the
historical mean. Modelling suggests that the future (~2030) climate conditions will be similar to the historical record,
though drier than the recent past. Slightly wetter and drier conditions are expected under the wet extreme and dry
extreme future climates, respectively.
The major aquifers in the region are in the Tindall Limestone, Dook Creek Formation and Cretaceous sediments, and
these are the primary source of dry season (May to October) flow in the perennial rivers of the Roper region.
While groundwater use is not metered throughout the region, groundwater is sourced for both irrigation and mining
development. Groundwater in the Tindall Limestone aquifer is sourced for large-scale irrigated agricultural developments
in the Mataranka area, posing a significant risk to the ecology of the nearby Elsey National Park and the flow from the
iconic Mataranka Hot Springs. Groundwater extracted on Groote Eylandt for the GEMCO manganese mine may impact
on the perennial Angurugu and Emerald rivers.
The presence or absence of the Cretaceous sediments has a large impact on groundwater recharge rates to aquifers in
the Tindall Limestone and Dook Creek Formation and more work is required to understand this impact. Recharge to
aquifers in the Tindall Limestone and Dook Creek Formation via sinkholes and other preferential pathways such as
remnant tree root channels is important but has not yet been quantified. Perennial rivers are fed by groundwater
recharged from outside the Roper region. Similarly, groundwater recharged within the Roper region feeds perennial
rivers outside of the region.
Confidence in streamflow and groundwater flow estimates in this region is not of sufficient level to assess changes to
flow regime at environmental assets.

© CSIRO 2009 August 2009 Water in the Roper region ▪ 63
RO
-1 W
ateravailab
ilityand
demand
inthe
Ro
perregion
RO-1.2 Water resource assessment
RO-1.2.1 Under historical climate and current development
Mean annual rainfall for the Roper region is 843 mm, with a standard deviation of 163 mm. Maximum recorded rainfall
was 1477 mm in 2001; the lowest was 347 mm in 1952. Mean annual areal potential evapotranspiration (APET) is
1928 mm, with a relatively small variation (standard deviation of 29 mm). Highest APET occurred in 2005 (2040 mm);
lowest in 1945 (1783 mm). The mean annual runoff averaged over the Roper region is 112 mm, 13 percent of rainfall.
Rainfall is very seasonal, with 96 percent falling during the wet season (November to April), and runoff is highest in
February and March.
Licensed groundwater extraction in the Roper region currently amounts to 0.58 GL/year located around Mataranka.
However, there is also a number of existing horticulture developments operating without a groundwater extraction licence.
The actual rate of groundwater extraction is currently unknown.
Under a continued historical climate, mean annual groundwater recharge to watertable aquifers in the Roper region is
similar to the historical (1930 to 2007) mean rate. Therefore these mean groundwater levels and fluxes would be
maintained under historical climate and current development. Natural groundwater discharge plays a vital role in
providing water to maintain dry season flow to the iconic Mataranka Hot Springs and surface flows in the Roper River
and tributaries throughout the dry season (Table RO-1).
Table RO-1. Estimated groundwater contribution (baseflow) to streamflow, modelled diffuse recharge and groundwater extraction for the
Roper region under historical climate
Station River Station name Annual BFI *
Dry season BFI *
Dry season baseflow *
GL
G9030001 Elsey Ck Warloch Ponds 0.18 0.27 0.0
G9030013 Roper Elsey Homestead 0.25 0.69 41.2
G9030089 Waterhouse Rd Br 0.19 0.68 6.2
G9030090 Chambers Ck Wattle Hill 0.09 0.39 0.0
G9030176 Roper D/S Mataranka Homes 0.25 0.86 30.8
G9290006 Angurugu U/S Groote Eylandt Mission
0.53 0.81 10.8
Historical recharge ** Estimated groundwater extraction
GL/y
Entire Roper region 11,970 unknown
* BFI (baseflow index) and baseflow volume derived from gauged data.. ** Aggregated recharge from Zhang and Dawes (1998).
RO-1.2.2 Under recent climate and current development
The mean annual rainfall and runoff from 1996 to 2007 were 21 percent and 54 percent higher, respectively, than the
historical (1930 to 2007) mean values. Rainfall increases occurred across the entire region relative to the historical
pattern.
Under a continued recent climate, mean annual groundwater recharge to the watertable aquifers in the Roper region
would be significantly higher than the historical mean rate. When combined with current levels of groundwater
development, this means groundwater resource condition and dry season flows in the rivers could be better than what
has occurred historically.
Term of Reference 3a
Term of Reference 3a (i)
Term of Reference 3a (ii)

64 ▪ Water in the Roper region August 2009 © CSIRO 2009
RO
-1
Wat
er a
vaila
bili
ty a
nd d
eman
d in
the
Rop
er r
egio
n
RO-1.2.3 Under future climate and current development
Future (~2030) climate is expected to be similar to historical climate. Under the wet extreme, median and dry extreme
future climates, annual rainfall is 932, 843 and 765 mm, respectively. Corresponding APET values under these scenarios
are 1959, 2001 and 1996 mm, respectively.
Rainfall-runoff modelling with climate change projections from global climate models indicates that future runoff in the
Roper region is slightly more likely to decrease than increase. Rainfall-runoff modelling with climate change projections
from nine of the 15 GCMs suggests a decrease in mean annual runoff, while the other six of the GCMs suggest an
increase in mean annual runoff.
The median estimate is a -2 percent change to the mean annual runoff by 2030. The extreme estimates range from an
increase of 33 percent to a decrease of 18 percent in mean annual runoff.
Under future climate, mean annual groundwater recharge to the watertable aquifers in the Roper region is significantly
higher than the historical mean rate. The fact that recharge rates are higher when rainfall is similar to the historical value
reflects the importance of climate variables other than total rainfall in determining recharge. When combined with current
levels of groundwater development, the higher recharge rate means groundwater resource condition and dry season
flows in the rivers could be better than what has occurred historically.
RO-1.2.4 Under future climate and future development
Without detailed river and groundwater models for the region, it is difficult to predict the changes in water resource
condition that may occur under future climate and future development. However, any groundwater development that
occurs within several kilometres of the Roper River and its spring-fed tributaries will have a detrimental (though possibly
delayed) impact on dry season surface water flows in these watercourses.
RO-1.3 Changes to flow regime at environmental
assets
Section 1.3 of the division-level Chapter 1 describes how environmental assets were shortlisted for assessment by this
project. Two environmental assets were shortlisted for the Roper region: the Limmen Bight (Port Roper) Tidal Wetlands
System and the Mataranka Thermal Pools. These assets are characterised in Chapter RO-2.
In deciding whether it is feasible to report hydrological regime metrics for these shortlisted assets, it is important to
consider the confidence levels in modelled streamflow (as described in Section 2.2.6 of the division-level Chapter 2).
Confidence in results for low flows and high flows was calculated separately. Hydrological regime metrics (as defined in
Section 2.5 of the division-level Chapter 2) for either low flows or high flows are reported only where confidence levels
are sufficiently high. If confidence in the low flow or high flow is too low, metrics are not reported, and hence an important
gap in our knowledge is identified.
The confidence levels for both high flows and low flows for the Limmen Bight (Port Roper) Tidal Wetlands System are
ranked unreliable. These confidence levels are insufficient to allow hydrological regime metrics to be calculated or
changes to flow regime estimated.
The Mataranka Thermal Pools are fed by perennial groundwater springs in the upper reaches of the Roper River.
However, there is currently not enough confidence in existing groundwater models to report results under different
scenarios. In addition, the confidence levels for both high flows and low flows for the asset within the Roper region are
ranked unreliable (4 or 5) and therefore are insufficient to allow environmental flow metrics to be calculated.
RO-1.4 Seasonality of water resources
The rivers have a marked seasonal flow regime of high water levels during the wet season (November to April) and
decreased water flow and river stage towards the end of the dry season. Approximately 96 percent of rainfall and
Term of Reference 3a (iii)
Term of Reference 3a (iv)
Term of Reference 3b
Term of Reference 4

© CSIRO 2009 August 2009 Water in the Roper region ▪ 65
RO
-1 W
ateravailab
ilityand
demand
inthe
Ro
perregion
92 percent of runoff occurred during the wet season months under the historical and recent climates. Very similar
seasonal percentages (2 percent) of rainfall and runoff are projected to occur at 2030.
The Roper region experiences a relatively large amount of dry season flow (equivalent to 8 percent of total runoff on
average) under historical, recent and future climates.
RO-1.5 Surface–groundwater interaction
The following perennial rivers receive significant quantities of groundwater either flowing into or out of the Roper region:
The Roper River, Durabudboi River and Wonga Creek receive groundwater sourced (at least in part) from
recharge that occurs outside of the Roper region.
The Flora River (in the adjacent Daly region) and Goyder River receive groundwater sourced (at least in part)
from recharge that occurs within the Roper region.
Reaches of rivers where significant groundwater discharge is know to occur in the Roper region towards the end of the
dry season are show in Figure RO-2. The data used to compile this map represent flows (expressed as cumecs, i.e.
cubic metres per second) after a series of below average and above average wet seasons. These flows are sustained by
significant regional groundwater discharges from aquifers developed in karstic rocks and Cretaceous sediments. The
streams where dry season flow is sourced from karstic rocks are the Roper, Mainoru, Wilton, Koolatong, Walker and
Rosie rivers and Flying Fox Creek. The perennial streams where dry season flow is sourced from Cretaceous sediments
are the Durabudboi River and Wonga Creek on the mainland and the Angurugu, Emerald and Amagula rivers on Groote
Eylandt.
Term of Reference 4

66 ▪ Water in the Roper region August 2009 © CSIRO 2009
RO
-1
Wat
er a
vaila
bili
ty a
nd d
eman
d in
the
Rop
er r
egio
n
Figure RO-2. Hydrogeology of the Roper region (map provided by the Northern Territory Department of Natural Resources,
Environment, the Arts and Sport)
A detailed analysis of dry season flow near Mataranka established the sympathetic relationship between flow and
groundwater discharge from the Tindall Limestone (Jolly et al., 2004). The groundwater discharge component of flow at
gauges G9030176 and G9030013 was modelled using empirical relationships between rainfall and dry season flow. This
simple model simulated groundwater-fed flows for the period 1961 to 2004 (Figure RO-3) and illustrated the seasonal
variability of recharge and discharge of the system.

© CSIRO 2009 August 2009 Water in the Roper region ▪ 67
RO
-1 W
ateravailab
ilityand
demand
inthe
Ro
perregion
0
2
4
6
8
10
1961 1966 1971 1976 1981 1986 1991 1996 2001
Flo
w (
cum
ecs)
...
G9030176
G9030013
Figure RO-3. Modelled mean monthly groundwater discharge in the Roper River at gauges G9030176 and G9030013
Most of the spring-fed flow generated from the limestone is lost through evapotranspiration before the river reaches the
estuary (Jolly et al., 2004). The relationship between the flow at gauges G9030013 and G9030250 situated just above
the head of the estuary is shown on Figure RO-4 for the few times they have been gauged in the same week. The data
indicate that approximately 2 to 2.5 cumecs is lost between the two gauges due to evaporation and transpiration. This
loss equates to approximately 12 to 15 litres per second per kilometre, or is about two to three times the loss of other
rivers for which this process has been quantified further north. When flows at Mataranka drop below 2.5 cumecs – as
regularly occurred during the 1960s (Jolly et al., 2004) – no flow will reach the estuary.
0
0.5
1
1.5
2
2.5
0 0.5 1 1.5 2 2.5 3 3.5 4 4.5 5
Flow at G9030013 (cumecs) ….
Flo
w a
t G90
3025
0 (c
umec
s) …
.
Figure RO-4. Relationship between flow at gauging stations G9030013 and G9030250 on the Roper River
RO-1.6 Water storage options
RO-1.6.1 Surface water storages
There are currently no large surface water storages on the Roper River or its tributaries.
RO-1.6.2 Groundwater storages
Groundwater development in the Roper region is low and groundwater recharge rates (for the northern half of the region)
are high. Under current development managed aquifer recharge (MAR) would have limited applicability as storages in
the local carbonate aquifers (i.e., Tindall Limestone and Dook Creek Formation) are likely to be at full capacity towards
the end of the wet season when surface water is available for injection. Potential evaporation exceeds rainfall for most of
the year resulting in near year-round water-limited conditions. When water is not limited aquifers are expected to be at
full capacity. Therefore the only opportunity for MAR in the Roper region is if future development leads to groundwater
levels not fully recovering each wet season.
Term of Reference 5
68 ▪ Water in the Roper region August 2009 © CSIRO 2009
RO
-1
Wat
er a
vaila
bili
ty a
nd d
eman
d in
the
Rop
er r
egio
n
RO-1.7 Data gaps
There are only two weather stations in the region that have better than 80 percent record completeness, and none that
pass 90 percent. Interpolation of climate data, therefore, relies on the assumption that these are representative of the
region as a whole and that infilling of the temporal sequences used in SILO and other analyses is also representative.
In the Roper catchment, most of the stream gauges with reasonable quality data are located in the upper reaches and
there are few gauges of reasonable quality against which to calibrate the rainfall-runoff models. We therefore do not have
sufficient confidence in the streamflow estimations to report change in flow regime at environmental assets.
The aquifer in the karstic Dook Creek Formation is the source of dry season flow in perennial reaches of a number of
tributaries of the Roper River. Insufficient data exists for both the aquifer and the rivers to enable any models to be
developed. Given the mineral potential of this region, it is important to establish a representative network of gauging
stations and groundwater monitoring sites so that the impact of future mining developments will be able to be adequately
assessed.
RO-1.8 Knowledge gaps
Streamflow in the Roper region is complicated by the nature of the karstic terrain over which the streams flow. Defining
subcatchment boundaries is problematic as sinkholes and distributary channels in the upper reaches are difficult to
accurately delineate with the digital elevation model (DEM) used in this project (~125 m resolution). Higher resolution
DEMs and field mapping are required to verify surface features and establish if and how these features affect different
flow regimes.
The aquifer in the Tindall Limestone is the target for sourcing water for large-scale irrigated agricultural developments in
the Mataranka area. The development poses a significant risk to the ecology of the nearby Elsey National Park and the
flow from the iconic Mataranka Hot Springs. Given the complex nature of karst hydrogeology and the proximity of the
large-scale irrigated agricultural developments, detailed flow studies are required in order to develop an aquifer simulator
model to quantify the impacts of these developments.
Groundwater being extracted to dewater pits at the manganese mine operated by GEMCO on Groote Eylandt may be
having a significant impact on the perennial Angurugu and Emerald rivers. An aquifer simulator model needs to be
developed to quantify the current and future impacts mining operations will have on flow and hence the aquatic ecology
of these rivers.
The presence or absence of the Cretaceous sediments has a large impact on recharge to aquifers in the Tindall
Limestone and Dook Creek Formation. Recharge via sinkholes to aquifers in the Tindall Limestone and Dook Creek
Formation is important but has not yet been quantified. More work is required to evaluate recharge processes for both
the Tindall Limestone and Dook Creek Formation.
Flooding is an important factor that sustains many environmental assets and this occurs when the stream breaks out of
its banks (a level known as bankfull stage or discharge). However, bankfull discharge is not known for many streams, nor
is the dependence of area flooded on increasing stream depth, so it is difficult to predict when assets are inundated.
Further information about bankfull stage and discharge are needed for most environmental assets.
None of the environmental assets in this region have any site specific metrics by which to gauge the potential impact s of
future climate change and development scenarios. In the absence of site specific metrics a set of standard metrics
related to high and low flows have been utilised, however, the conversion of these metrics into environmental impacts
still requires development of quantitative relationships between flow and specific ecological entities (for example,
macrophyte populations, fish passage, faunal and floral habitats, etc.).
Many environmental assets depend not simply on duration above or below certain flow levels, but on triggers (e.g. for
reproduction or migration) set by the rate of change of flow. In addition, some environmental assets depend on the
frequency and duration of events that occur less than annually (i.e. once every 5, 10 or 20 years or more). Further
analysis is therefore required to look at how the timing, duration and rate of rise and fall in flow rates at critical times of
the season will vary under the various scenarios.
Term of Reference 1e
© CSIRO 2009 August 2009 Water in the Roper region ▪ 69
RO
-1 W
ateravailab
ilityand
demand
inthe
Ro
perregion
Dry season flows are poorly understood in this region therefore the ability to predict the potential impacts of the various
scenarios on low or zero flows at environmental assets is very limited. Improved monitoring of low streamflow conditions
is needed along with the development of hydrological models that combine surface and groundwater regimes. Further
monitoring of groundwater levels is also required so that the potential impacts of climate change and development
scenarios on groundwater dependant ecosystems can be better understood.
RO-1.9 References
Jolly P, Knapton A and Tickell S (2004) Water Availability from the Aquifer in the Tindall Limestone South of the Roper River Report. Department of Infrastructure, Planning and Environment, Darwin, Australia.
McJannet DL, Wallace JW, Henderson A and McMahon J (2009) High and low flow regime changes at environmental assets across northern Australia under future climate and development scenarios. A report to the Australian Government from the CSIRO Northern Australian Sustainable Yields Project. CSIRO Water for a Healthy Country Flagship, CSIRO, Australia. In prep.
Zhang L and Dawes W (1998) WAVES - An integrated energy and water balance model. Technical Report No. 31/98, CSIRO Land and Water.

70 ▪ Water in the Roper region August 2009 © CSIRO 2009
RO
-2
Con
text
ual i
nfor
mat
ion
for
the
Rop
er r
egio
n
RO-2 Contextual information for the Roper region
This chapter summarises the background information for the region, outlining existing knowledge of water resources and
prior and current investigations relevant to the water resources of the region. This chapter also outlines the current and
potential future legislation, water plans and other water resource management arrangements. This chapter is arranged
into four sections:
physical and climate descriptions
data availability
hydrogeology
legislation, water plans and other arrangements.

© CSIRO 2009 August 2009 Water in the Roper region ▪ 71
RO
-2 C
ontextualinformation
forthe
Ro
perregion
RO-2.1 Overview of the region
RO-2.1.1 Geography and geology
The Roper River starts as Roper Creek (also called Little Roper River) and becomes the Roper River downstream of
Waterhouse River junction near Mataranka. The Elsey Creek system drains the large Sturt Plateau region, which is
located in the south-west of the region. The Arnhem Land Plateau, rising up to 440 m, and the Wilton River Plateau are
located in the north of the region, and consist predominantly of Kombolgie sandstone. The middle section of Roper River
consists of a highly braided river channel. The Roper River flows generally in an easterly direction, although the geology
of the catchment influences the direction of the drainage systems. The normal tidal limit of the Roper River is at Roper
Bar Crossing (20 km upstream from Ngukurr, Figure RO-5). From this crossing, the Roper River traverses the alluvial
coastal plain eastward for 145 km before entering the Gulf of Carpentaria.
Surveys providing detailed land systems, land unit or soils mapping have been carried out for areas throughout the
Roper River catchment. Within the Roper region six major landforms are identified including plateau surfaces; plateau
escarpments; gorges and ridges associated with the dissected plateau and hills; plains; drainage lines, associated
floodplains and billabongs; salt pans and tidal flats.
The geological history of the area is complex. The McArthur Basin underlies the centre and east of the region. The
McArthur Basin succession comprises sandstone, shale, carbonate, and interbedded volcanic and intrusive igneous
rocks.
The connected Daly, Wiso and Georgina Groundwater Basins underlie the west of the region. The basins have strong
similarities in terms of their stratigraphy and architecture. The Wiso Basin underlies the south-west of the region. The
Palaeozoic platform succession generally is less than 300 m thick. The Daly Basin underlies the north-west of the region
and is a north-west-trending intracratonic sedimentary basin up to 700 m thick. It contains the lower Palaeozoic Daly
River Group, comprising, in ascending order, the marine Tindall Limestone, mixed peritidal Jinduckin Formation and
carbonate peritidal Oolloo Dolostone. The Tindall Limestone usually rests disconformably on the Lower Cambrian Antrim
Plateau Volcanics. The Georgina Basin contains a relatively thin stratigraphic succession, up to 450 m thick, deposited
on a tectonically quiescent platform. Deposition in the central region commenced with a marine transgression in the early
Middle Cambrian and may have extended into the Late Cambrian. The northern Georgina Basin is largely concealed
beneath Cretaceous sediments.
The Carpentaria Basin underlies most of the eastern coastal area of the region. It is a broad north–south trending
intracratonic basin. The Carpentaria Basin is the most northerly tectonic unit within the Great Artesian Basin (GAB).
During the Early Cretaceous, fluvial sandstone deposition was widespread in the GAB. In the Middle Cretaceous, a
widespread transgression brought coastal swamp conditions and then shallow marine conditions across the basin, with
the deposition of a thick mudstone succession. A major regression in the late Middle Cretaceous resulted in a return to
coastal swamp conditions.
The current drainage system probably came into existence in the Cretaceous when uplift in the north of the Northern
Territory resulted in a drainage divide between inland-draining streams to the south and streams draining to the sea in
the north.
The alluvial plains that cover an extensive area along the coastal eastern edge of the region are underlain by primarily
marine sediments that have been deposited in the last 10,000 years since the end of the ice age.

72 ▪ Water in the Roper region August 2009 © CSIRO 2009
RO
-2
Con
text
ual i
nfor
mat
ion
for
the
Rop
er r
egio
n
Figure RO-5. Surface geology of the Roper region overlaid on a relative relief surface
RO-2.1.2 Climate, vegetation and land use
The Roper region receives an average of 843 mm of rainfall over a water year (September to August), most of which
(805 mm) falls in the November to April wet season (Figure RO-6). Across the region there is a strong north–south
gradient in annual rainfall, ranging from 1357 mm in the north to 592 mm in the south. Over the first half of the historical
(1930 to 2007) period, annual rainfall has been relatively constant at around 750 mm. Conversely, the second half of the
period has seen an increase in mean rainfall to approximately 950 mm. The highest yearly rainfall received was
1477 mm in 2001, and the lowest was 347 mm in 1952.
Areal potential evapotranspiration (APET) is very high across the region, averaging 1928 mm over a water year, and
varies moderately across the seasons. APET generally remains higher than rainfall throughout the year resulting in year-
round water-limited conditions, to which the vegetation has adapted.

© CSIRO 2009 August 2009 Water in the Roper region ▪ 73
RO
-2 C
ontextualinformation
forthe
Ro
perregion
(a) (b)
0
400
800
1200
1600
30/ 31 50/ 51 70/ 71 90/ 91 06/ 0
Ann
ual r
ainf
all (
mm
) ,,,,
0
50
100
150
200
250
J F M A M J J A S O N D
Mon
thly
rai
nfal
l (m
m) ,,,
,,,
Figure RO-6. Historical (a) annual and (b) mean monthly rainfall averaged over the Roper region. The low-frequency smoothed line in
(a) indicates longer term variability
The dominant vegetation communities (Figure RO-7) are eucalypt woodlands with hummock grass or tussock grass
understorey (Connors et. al., 1996). However, the varied topography, particularly in the northwest is reflected in the
diversity of plant communities. The most widespread communities include:
In the southeast a low open woodland of Snappy Gum (Eucalyptus leucophloia) with Bloodwood (Corymbia terminalis),
Ironwood (Erythrophleum chlorostachys) over Curley Spinifex (Plectachne pungens) hummock grassland. Other
associations include Northern Box (E. tectifica) with White Grass (Sehima nervosum) and Golden Beard Grass
(Chrysopogon fallax).
Variable barked Bloodwood (Corymbia dichromophloia) and Stringybark (E. tetrodonta) also form low open woodland
with Darwin Woolly Butt (E. miniata). In some areas woodlands include Rusty Bloodwood (Corymbia ferruginea),
Lancewood (Acacia shirleyi). Coolibah (E. microtheca) occurs along some creeks and there are extensive paperbark
swamps (Melaleuca citrolens) (Kerle, 1996).
In the north west of the region woodland communities include stringy bark, Cypress Pine (Callitris intratropica) and Silver
Box (E. pruinosa) (Connors et. al., 1996). Northern cypress-pine has suffered where traditional Aboriginal fire regimes
have been changed (Woinarski et. al., In prep).
Vine thickets are scattered along the rivers through the sandstone country and contain relict species including, rushes
and reeds and the Fern (Lygodium microphyllum) as well as undescribed species of ferns (Morton et. al., 1995).
74 ▪ Water in the Roper region August 2009 © CSIRO 2009
RO
-2
Con
text
ual i
nfor
mat
ion
for
the
Rop
er r
egio
n
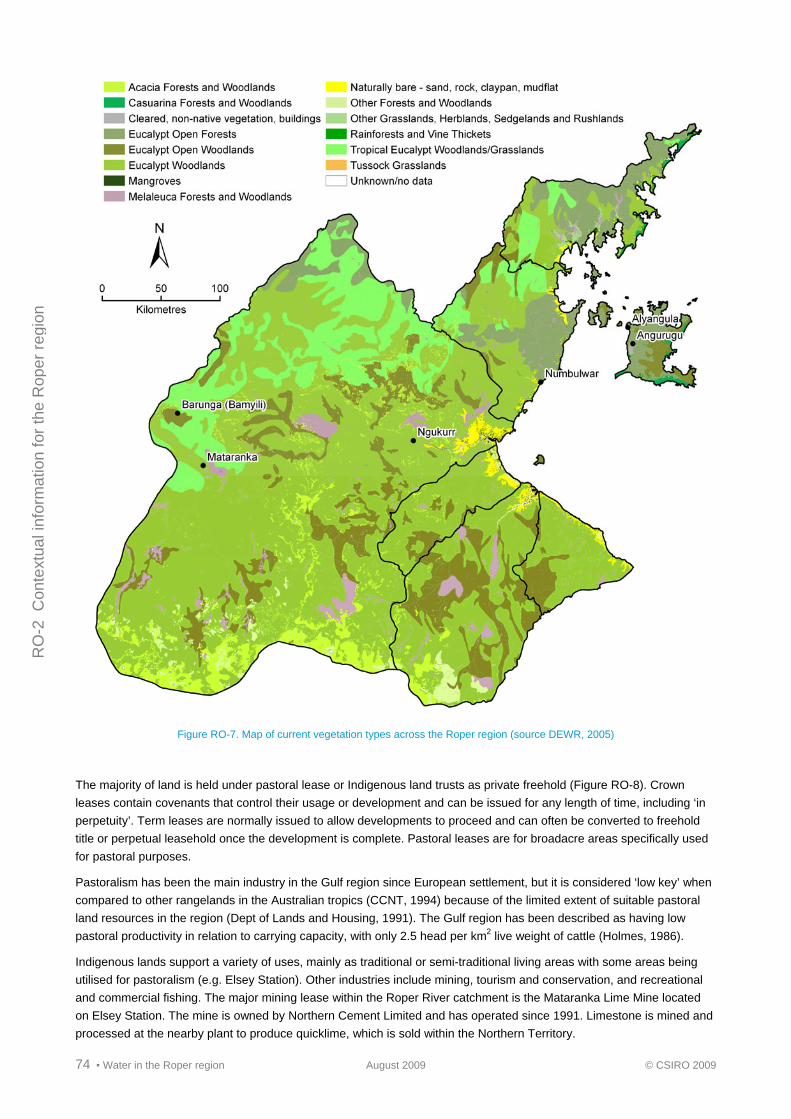
Figure RO-7. Map of current vegetation types across the Roper region (source DEWR, 2005)
The majority of land is held under pastoral lease or Indigenous land trusts as private freehold (Figure RO-8). Crown
leases contain covenants that control their usage or development and can be issued for any length of time, including ‘in
perpetuity’. Term leases are normally issued to allow developments to proceed and can often be converted to freehold
title or perpetual leasehold once the development is complete. Pastoral leases are for broadacre areas specifically used
for pastoral purposes.
Pastoralism has been the main industry in the Gulf region since European settlement, but it is considered ‘low key’ when
compared to other rangelands in the Australian tropics (CCNT, 1994) because of the limited extent of suitable pastoral
land resources in the region (Dept of Lands and Housing, 1991). The Gulf region has been described as having low
pastoral productivity in relation to carrying capacity, with only 2.5 head per km2 live weight of cattle (Holmes, 1986).
Indigenous lands support a variety of uses, mainly as traditional or semi-traditional living areas with some areas being
utilised for pastoralism (e.g. Elsey Station). Other industries include mining, tourism and conservation, and recreational
and commercial fishing. The major mining lease within the Roper River catchment is the Mataranka Lime Mine located
on Elsey Station. The mine is owned by Northern Cement Limited and has operated since 1991. Limestone is mined and
processed at the nearby plant to produce quicklime, which is sold within the Northern Territory.

© CSIRO 2009 August 2009 Water in the Roper region ▪ 75
RO
-2 C
ontextualinformation
forthe
Ro
perregion
The tourist industry is a small but significant part of the local economy and visitation to the region is highly seasonal with
most occurring during the May through October dry season (Dept of Lands and Housing, 1991). Primary attractions
include remote camping, river fishing, four wheel driving and access to the sea (Dept of Lands and Housing, 1991).
Station and outback tours, including game hunting, also are offered. Of the attractions, recreational barramundi fishing
(or freshwater fishing) is the primary tourist activity within the Roper River catchment (op cit.).
The fishing industry is very significant within the region. Prawning is the largest single fishery in the Gulf and accounted
for 96 percent of the value of the Gulf fisheries catch in 1990 (Dept of Lands and Housing, 1991). The prawn industry
operates up to 60 nautical miles offshore. An unloading facility on the Roper River is used to tranship prawns from the
Gulf. An aquaculture farm for prawns operated at Port Roper until 1995.
Figure RO-8. Map of dominant land uses of the Roper region (after BRS, 2002)
RO-2.1.3 Regional environmental asset description
Environmental assets were chosen from wetlands which are listed in the Directory of Important Wetlands in Australia
(Environment Australia, 2001). From this directory, environmental assets were shortlisted for assessing changes to the
hydrological regime under the climate and development scenarios. The selection of this shortlist was undertaken in

76 ▪ Water in the Roper region August 2009 © CSIRO 2009
RO
-2
Con
text
ual i
nfor
mat
ion
for
the
Rop
er r
egio
n
consultation with state governments and the Australian Government through direct discussions and through internal
reviews (see Section 1.3 in the division-level Chapter 1 for further detail).
All nationally, or internationally, important wetlands listed for the Roper region in the Directory of Important Wetlands in
Australia (Environment Australia, 2001) are detailed in Table RO-2, with asterisks identifying the two shortlisted assets:
Limmen Bight (Port Roper) Tidal Wetlands System and Mataranka Thermal Pools. The location of these shortlisted
wetlands is shown in Figure RO-1. There are no wetlands classified as Ramsar sites in this region. Wetlands may be
nationally or regionally significant depending on more locally specific criteria. All wetlands are important for a variety of
ecological reasons or because they bear historical significance or have high cultural value, particularly to Indigenous
people.
Table RO-2. List of Wetlands of National Significance located within the Roper region
Site code Name Area Ramsar site
ha
NT007* Limmen Bight (Port Roper) Tidal Wetlands System 185,000 No
NT003* Mataranka Thermal Pools <10 No
* Asterisk against the site code identifies those assets which are shortlisted for assessment of changes to flow regime.
The following section characterises these shortlisted wetlands and is based largely on the description of these assets as
outlined by (Environment Australia, 2001). Chapter ID-3 presents the assessment of those shortlisted assets, and reports
hydrological regime metrics for those assets which have sufficient confidence in the modelled streamflow to enable
analysis.

© CSIRO 2009 August 2009 Water in the Roper region ▪ 77
RO
-2 C
ontextualinformation
forthe
Ro
perregion
Limmen Bight (Port Roper) Tidal Wetlands System
The Limmen Bight (Port Roper) Tidal Wetland System (Figure RO-9) is a good example of a system of tidal wetlands
(intertidal mud flats, saline coastal flats and estuaries) with a high volume of freshwater inflow, typical of the Gulf of
Carpentaria coast. It is the second largest area of saline coastal flats in the Northern Territory. The site has an area of
185,000 ha and an elevation ranging between zero and 10 m above sea level (Environment Australia, 2001).
Figure RO-9. False colour satellite image of the Limmen Bight (Port Roper) Tidal Wetlands
System (derived from ACRES, 2000). Clouds may be visible in image
The site, especially the Port Roper mudflats, is among the most important coastal areas for shorebirds in the Northern
Territory. The maintenance of populations of commercially harvested Tiger Prawn in the Gulf is linked to their utilisation
of inshore seagrass areas in this area (Environment Australia, 2001). Dugong occur offshore of the whole site in the wet
season. Medium densities of Saltwater Crocodile occur in the Roper River estuary. Marine turtles use nest sites on
offshore islands associated with the site.
Much of the site is Indigenous land and Indigenous communities are located outside the site. Traditional use of the
wetlands is still practised. A sacred site occurs near Warrakunta Point. The near-coastal waters and estuaries support a
major commercial barramundi and salmon fishery; major harvest of crabs occurs at Port Roper; and aquaculture is
maintained near the Roper River (Environment Australia, 2001).

78 ▪ Water in the Roper region August 2009 © CSIRO 2009
RO
-2
Con
text
ual i
nfor
mat
ion
for
the
Rop
er r
egio
n
Mataranka Thermal Pools
The Mataranka Thermal Pools (Figure RO-10) are one of the best known examples of tropical springs and associated
permanent pools in the Northern Territory. The site is a popular tourist destination attracting more the 150,000 visitors
annually, which results in significant support for local businesses (Environment Australia, 2001). The site has an area of
less than 10 ha and an elevation of approximately 115 m above sea level (Environment Australia, 2001). The thermal
pools provide a permanent source of water in a seasonally dry environment.
The surrounding woodland includes a Livistona rigida palm community which has a restricted distribution in the Top End
Region (Wilson et al., 1990). The Little Red Flying-Fox roost in the area in large numbers, sometimes exceeding 200,000,
and often use the site as a maternity colony.
Figure RO-10. False colour satellite image of the Mataranka Thermal Pools (derived from ACRES,
2000). Clouds may be visible in image
© CSIRO 2009 August 2009 Water in the Roper region ▪ 79
RO
-2 C
ontextualinformation
forthe
Ro
perregion
RO-2.2 Data availability
RO-2.2.1 Climate
The rainfall-runoff modelling uses historical daily climate data (Scenario A) from the SILO database for the period
1 September 1930 to 31 August 2007 at 0.05 x 0.05 degree (~ 5 x 5 km) grid cells. Full details and characterisation of
the SILO database are provided at the division level in Section 2.1 of Chapter 2. Scenario B and Scenario C climate data
are rescaled versions of the Scenario A data; this is also discussed in Section 2.1 of Chapter 2.
RO-2.2.2 Surface water
Streamflow gauging stations are or have been located at 22 locations within the Roper region. Twelve of these gauging
stations either (i) are flood warning stations which measure stage height only; or (ii) have less than ten years of
measured data. Of the remaining ten stations, one recorded more than half of its total volume of flow during events that
exceed the maximum gauged stage height (MGSH). Figure RO-11 shows the spatial distribution of good quality data
(duration) and the percentage of flow above MGSH (this assessment was only undertaken on stations with ten years or
more of data).
In Figure RO-11 the productive aquifer layer for the Northern Territory includes key dolostone and limestone formations
and Cretaceous sandstone formations. Consequently these ‘productive’ aquifers exhibit a wide range of bore yields. The
location of gauging stations in the Roper is not representative of the broader region. Many gauging stations are located
within or downstream of productive aquifers (Figure RO-11). Hence the extrapolation of streamflow values recorded at
these gauges to the broader region can be misleading.
There are six gauging stations currently operating in the Roper region at density of one gauge for every 21,400 km2. For
the 13 regions the median number of current gauging stations per region is 12 and the median density of current gauging
stations per region is one gauge for every 9,700 km2. The Roper region has a low density of gauging stations relative to
other regions in northern Australia, and the density is considerably lower than the MDB average. The mean density of
current stream gauging stations across the entire MDB is one gauge for every 1,300 km2.

80 ▪ Water in the Roper region August 2009 © CSIRO 2009
RO
-2
Con
text
ual i
nfor
mat
ion
for
the
Rop
er r
egio
n
Figure RO-11. Location of surface water gauging stations overlaid on a relative relief surface showing the proportion of gauges with flow
above maximum gauged stage height across the Roper region. Productive aquifer layer includes key dolostone, limestone and
Cretaceous sandstone formations.
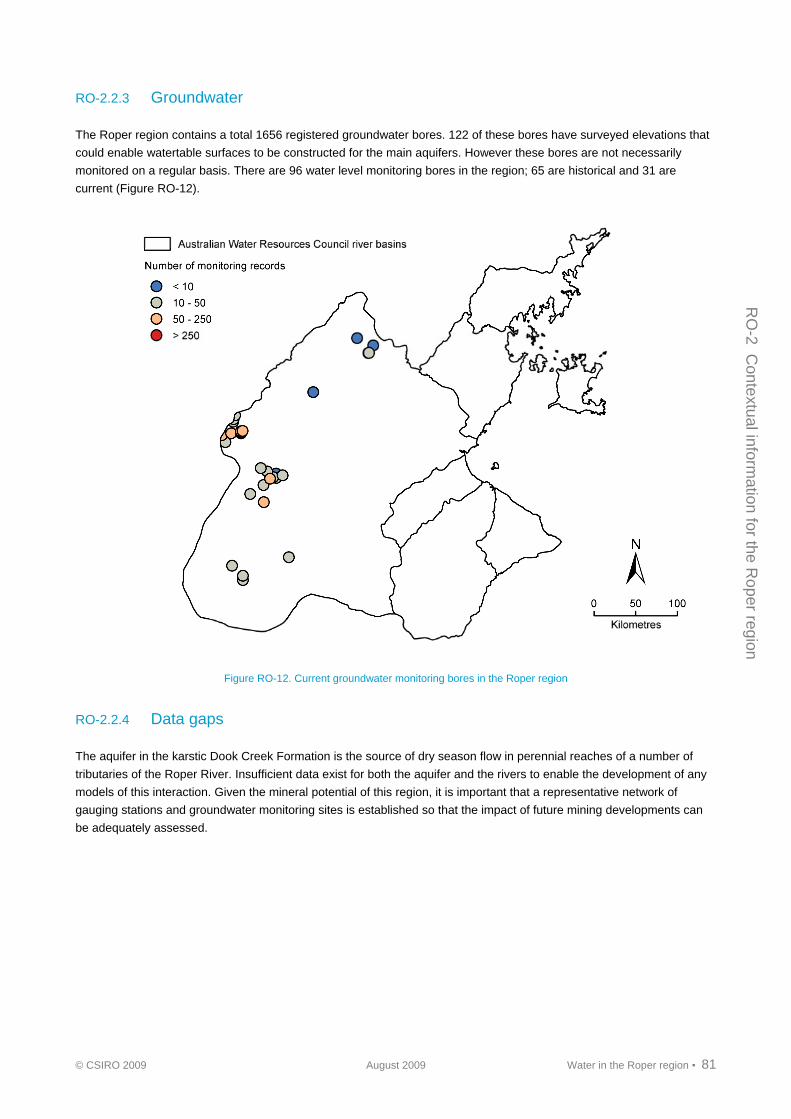
© CSIRO 2009 August 2009 Water in the Roper region ▪ 81
RO
-2 C
ontextualinformation
forthe
Ro
perregion
RO-2.2.3 Groundwater
The Roper region contains a total 1656 registered groundwater bores. 122 of these bores have surveyed elevations that
could enable watertable surfaces to be constructed for the main aquifers. However these bores are not necessarily
monitored on a regular basis. There are 96 water level monitoring bores in the region; 65 are historical and 31 are
current (Figure RO-12).
Figure RO-12. Current groundwater monitoring bores in the Roper region
RO-2.2.4 Data gaps
The aquifer in the karstic Dook Creek Formation is the source of dry season flow in perennial reaches of a number of
tributaries of the Roper River. Insufficient data exist for both the aquifer and the rivers to enable the development of any
models of this interaction. Given the mineral potential of this region, it is important that a representative network of
gauging stations and groundwater monitoring sites is established so that the impact of future mining developments can
be adequately assessed.

82 ▪ Water in the Roper region August 2009 © CSIRO 2009
RO
-2
Con
text
ual i
nfor
mat
ion
for
the
Rop
er r
egio
n
RO-2.3 Hydrogeology
This section describes the key sources of groundwater in the Roper region. The description is primarily based on reports
and water bore data held by the Northern Territory Government Department of Natural Resources, Environment, The
Arts and Sports (NRETAS). The distribution of water bores in the region in 2008 is shown in Figure RO-13.
Figure RO-13. Location of groundwater bores in the Roper region (map provided by the Northern Territory Department of Natural
Resources, Environment, The Arts and Sport)
RO-2.3.1 Aquifer types
There are three major aquifer types in the Roper region. These types are fractured rocks, karstic carbonate rocks and
Cretaceous sediments, all of which are briefly described below and their areal extent is shown in Figure RO-2.
Fractured rocks
A variety of Precambrian (older than 500 million years) rocks form the bedrock of the area. These are mainly
sedimentary but also include granite and volcanic rocks. Sandstone, siltstone and greywacke are the main sedimentary
rock types. In some areas they are flat-lying while in other areas they have been folded and faulted and show low grade
metamorphism.
In the Early Cambrian (500 million years ago) volcanic eruptions produced an extensive sheet of basalt flows, now
known as the Antrim Plateau Volcanics. These underlie the Daly, Wiso and Georgina basins.

© CSIRO 2009 August 2009 Water in the Roper region ▪ 83
RO
-2 C
ontextualinformation
forthe
Ro
perregion
Water is usually intersected in weathered fractured zones within the fractured rocks. Groundwater yields are controlled
by the degree of fracturing of these units and are likely to be greater in areas located along large-scale joints and fault
zones.
Karstic carbonate rock – Tindall Limestone, Jinduckin Formation and Proterozoic carbonates (includes the
Dook Creek Formation)
The major aquifers in the region occur within the carbonate rocks of the Daly and Georgina basins and the Dook Creek
Formation. These carbonate rocks are part of an extensive area of carbonate rocks that extend across a large part of the
Northern Territory and into Queensland (Figure RO-14). The Tindall Limestone and its equivalents (the Montejinni
Limestone in the Wiso Basin and the Gum Ridge Formation in the northern part of the Georgina Basin) host widespread
karstic aquifers. These aquifers have very high permeabilities due to an extensive network of interconnected solution
cavities. The Jinduckin Formation and its equivalent (the Anthony Lagoon Beds in the northern part of the Georgina
Basin) is mainly composed of siltstone. The formation contains thin, local aquifers in isolated limestone beds.
Lauritzen and Karp (1993) concluded that the Tindall Limestone karst aquifer developed before the Cretaceous period.
The permeability of the karst aquifer has been further enhanced since then by the movement of acidic groundwater from
the aquifer developed in the basal Cretaceous sandstone where it overlies the limestone. It is believed that the karst
aquifer in the Oolloo Dolostone developed in a similar way.
The Tindall Limestone karst aquifer is the main contributor to dry season flow in the Roper River. The Dook Creek
Formation contributes significant dry season flow to the upper reaches of the Wilton and Mainoru rivers and Flying Fox
Creek, all of which are tributaries of the Roper River. The Tindall Limestone is the aquifer of most interest to irrigators as
it occurs beneath land suitable for irrigation and can yield high flow rates (greater than 50 L/second per bore) from
relatively shallow depths.
Cretaceous sediments
The Cretaceous sediments form a mantle of lateritised claystone and sandstone covering much of the area. On Figure
RO-2 the sediments have only been mapped where it is expected that they form the major aquifer at that locality.
However they overlay the karstic rock aquifers over much of the region. The beds are sub-horizontal and may be divided
into an upper claystone and siltstone unit and a basal sandstone unit. Outcrop is generally sparse due to the soft nature
of the rock but in places silicification has altered them to porcellanite and quartzite.
In the Wiso and Georgina basins (Figure RO-14) the formation may be up to 75 m thick with the clayey upper unit
comprising 60 m of its thickness. The thickness of the sandy unit is variable and ranges from less than 5 m to up to 25 m
(cross-section in Figure RO-2). Where the upper claystone is thin and eroded, the potential recharge to the underlying
limestone aquifer is increased. In most places within the basins the sediments lie above the regional water level.
In the north-east the formation may be over 100 m thick with most of that thickness being permeable sandstone. The
Cretaceous sandstone aquifer contributes significant dry season flows to many rivers in the north-east of the region.

84 ▪ Water in the Roper region August 2009 © CSIRO 2009
RO
-2
Con
text
ual i
nfor
mat
ion
for
the
Rop
er r
egio
n
Figure RO-14. Location of the Roper region in relation to the Daly, Wiso and Georgina basins (map provided by the Northern Territory
Department of Natural Resources, Environment, The Arts and Sport)
RO-2.3.2 Inter-aquifer connection and leakage
The only aquifers in the region that may be in hydraulic connection are the fractured rock aquifers and the basal
sandstone of the Cretaceous sediments in some locations.
RO-2.3.3 Recharge, discharge and groundwater storage
Recharge occurs only in the wet season when rainfall intensity and duration is sufficient. Recharge leads to a rise in
groundwater levels. In the dry season the levels naturally fall as groundwater is either transpired or discharged to
wetlands and rivers where it evaporates or is discharged to the sea. The amount and rate at which the groundwater
levels rise and fall depends on the type, size and other physical properties of the aquifer as well as the amount of
recharge. The recharge/discharge cycle that applies in the Roper region is summarised in Figure RO-15.
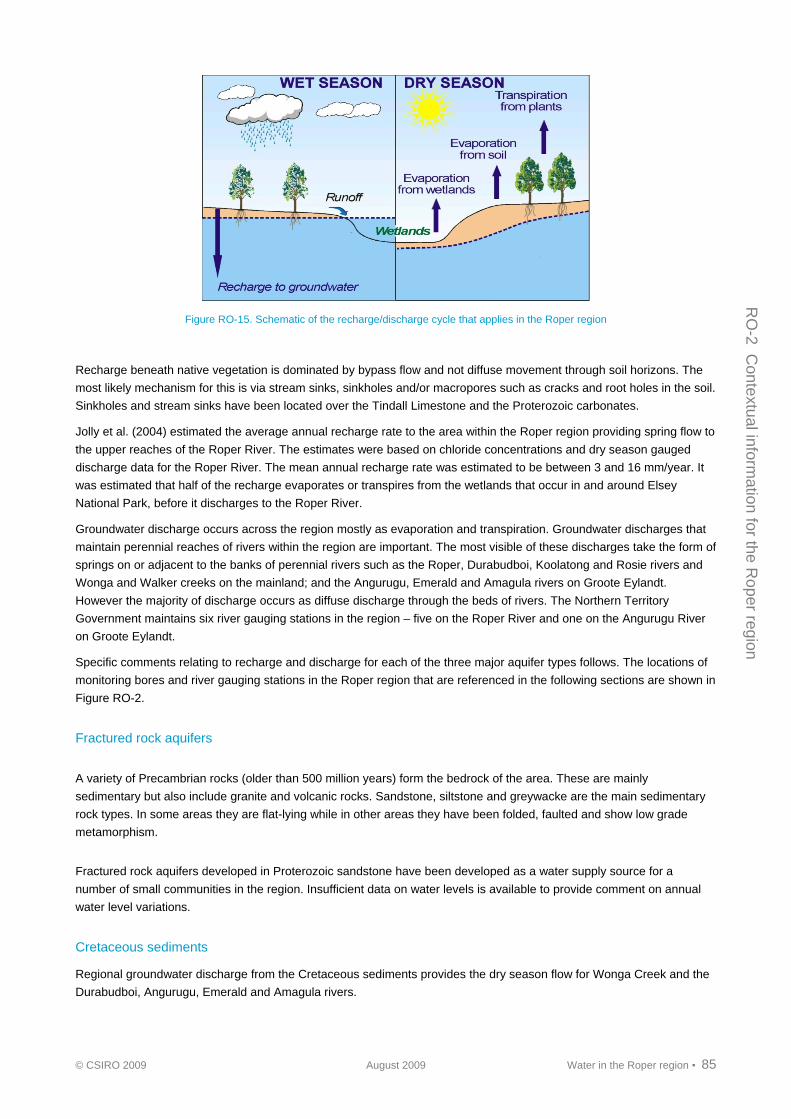
© CSIRO 2009 August 2009 Water in the Roper region ▪ 85
RO
-2 C
ontextualinformation
forthe
Ro
perregion
Figure RO-15. Schematic of the recharge/discharge cycle that applies in the Roper region
Recharge beneath native vegetation is dominated by bypass flow and not diffuse movement through soil horizons. The
most likely mechanism for this is via stream sinks, sinkholes and/or macropores such as cracks and root holes in the soil.
Sinkholes and stream sinks have been located over the Tindall Limestone and the Proterozoic carbonates.
Jolly et al. (2004) estimated the average annual recharge rate to the area within the Roper region providing spring flow to
the upper reaches of the Roper River. The estimates were based on chloride concentrations and dry season gauged
discharge data for the Roper River. The mean annual recharge rate was estimated to be between 3 and 16 mm/year. It
was estimated that half of the recharge evaporates or transpires from the wetlands that occur in and around Elsey
National Park, before it discharges to the Roper River.
Groundwater discharge occurs across the region mostly as evaporation and transpiration. Groundwater discharges that
maintain perennial reaches of rivers within the region are important. The most visible of these discharges take the form of
springs on or adjacent to the banks of perennial rivers such as the Roper, Durabudboi, Koolatong and Rosie rivers and
Wonga and Walker creeks on the mainland; and the Angurugu, Emerald and Amagula rivers on Groote Eylandt.
However the majority of discharge occurs as diffuse discharge through the beds of rivers. The Northern Territory
Government maintains six river gauging stations in the region – five on the Roper River and one on the Angurugu River
on Groote Eylandt.
Specific comments relating to recharge and discharge for each of the three major aquifer types follows. The locations of
monitoring bores and river gauging stations in the Roper region that are referenced in the following sections are shown in
Figure RO-2.
Fractured rock aquifers
A variety of Precambrian rocks (older than 500 million years) form the bedrock of the area. These are mainly
sedimentary but also include granite and volcanic rocks. Sandstone, siltstone and greywacke are the main sedimentary
rock types. In some areas they are flat-lying while in other areas they have been folded, faulted and show low grade
metamorphism.
Fractured rock aquifers developed in Proterozoic sandstone have been developed as a water supply source for a
number of small communities in the region. Insufficient data on water levels is available to provide comment on annual
water level variations.
Cretaceous sediments
Regional groundwater discharge from the Cretaceous sediments provides the dry season flow for Wonga Creek and the
Durabudboi, Angurugu, Emerald and Amagula rivers.

86 ▪ Water in the Roper region August 2009 © CSIRO 2009
RO
-2
Con
text
ual i
nfor
mat
ion
for
the
Rop
er r
egio
n
Changes in dry season streamflow rates occur in response to changes in the amount of rainfall that recharges the aquifer
during the preceding wet season. The changing recharge rate is reflected in the variation in water level measured in
monitoring bores intersecting the aquifer. Figure RO-16 plots time series groundwater level data for bore RN022220
which is located on Groote Eylandt. The data indicates that annual groundwater rises due to recharge during the wet
season vary from minimal during the 1989/90 wet season to 4.5 m in 1993/94 and 1998/99. Prowse et al. (1999)
demonstrated that periods of relatively low groundwater levels correspond to periods when streamflows are relatively
lower in the perennial rivers of Groote Eylandt; likewise higher groundwater levels correspond with higher flows.
(a)
0
5
10
151984 1989 1994 1998 2003
Gro
undw
ater
leve
l (m
bel
ow ...
grou
nd le
vel)…
.
(b)
1.8
2.0
2.2
2.4
2.6
2.82004 2005 2006 2007 2008 2009
Gro
undw
ater
leve
l (m
bel
ow ...
grou
nd le
ve) .
...
RN034038 Logger
RN034038 SWL
(c)
0
2
4
6
8
10
12
14
161984 1989 1994 1999 2004
Gro
undw
ater
leve
l (m
bel
ow ...
grou
nd le
vel)
....
RN029429
RN006326
Figure RO-16. Observed groundwater levels in bores in the (a) Cretaceous Sandstone at Angurugu, (b) Tindall Limestone near
Mataranka and (c) Proterozoic carbonates near Beswick
Tindall Limestone (and equivalents)
Regional groundwater discharges from the karst aquifer developed in the Tindall Limestone (and equivalents) provide
most of the dry season flow for the Roper River. The groundwater catchment of the Roper River extends into the
Georgina Basin for more than 400 km outside of the surface water catchment of the Roper River (Tickell, 2005).

© CSIRO 2009 August 2009 Water in the Roper region ▪ 87
RO
-2 C
ontextualinformation
forthe
Ro
perregion
The aquifer developed in the Tindall Limestone that lies beneath the Wiso Basin in the Roper River catchment also
provides a significant proportion of the flow in the Flora River which is located in the Daly region. In dry periods such as
the 1960s and early 1970s discharge from the Tindall Limestone into the Flora River was critical to maintaining the
perenniality of all of the Daly River.
As the Tindall Limestone aquifer underlies such a large area, its recharge rate can vary significantly due both to the areal
variability in rainfall and the presence or absence of Cretaceous sediments overlying it. Knapton (2006) modelled the
Tindall Limestone aquifer across those parts of the Daly, Wiso and Georgina basins that discharge either to the Daly
River or Roper River. The average annual recharge rate to the area within the Roper River catchment providing spring
flow to the upper reaches of the Roper River ranged from a low of less than 1 mm in the south to a high of 73 mm in the
vicinity of the Roper River.
Limited water level monitoring data exists for the Tindall Limestone in the Roper region. Data for monitoring bore
RN034038 located near the discharge zone of the aquifer are given in Figure RO-16.
Proterozoic carbonates
There are only limited data available for groundwater levels in the Proterozoic carbonates. The data shown in Figure RO-
16 for bore RN021689 located in an outlier of the Dook Creek Formation near Beswick indicates that significant recharge
occurred in 75 percent of wet seasons during the 20-year period when water levels were measured. In the remaining
25 percent of wet seasons minimal recharge appears to have occurred.
Groundwater discharge from the Dook Creek Formation provides the dry season flow for the Mainoru and Wilton Rivers
and Flying Fox Creek. The Dook Creek Formation is also the source of dry season flow in the Goyder River which flows
into the Arafura Swamp. (Williams et al., 2003) estimated a mean annual recharge rate of 90 mm/year (1884 to 1999) for
the area of the Dook Creek Formation that provides the source of dry season flows in the Goyder River.
RO-2.3.4 Groundwater quality
The quality of most groundwater from the fractured rock aquifers across the Roper region falls within acceptable drinking
water guidelines (ADWG, 2004). The only exception is groundwater beneath the internal floodouts of the Roper River, as
extensive concentration by evapotranspiration has resulted in very high salinities.
Groundwaters in the Tindall Limestone and Proterozoic carbonates (for locations see Figure RO-2) are slightly alkaline
on average but pH can range from 6.4 to 8. Calcium, magnesium and bicarbonate are the dominant ions, while salinity
(as electrical conductivity) is generally in the range 300 to 2000 µS/cm (Figure RO-17). However, beneath the diffuse
groundwater discharge zone in Elsey National Park groundwater salinity regularly exceeds 10,000 µS/cm. Calcium,
magnesium and bicarbonate concentrations are similar throughout the carbonate aquifers because these ions dissolve
relatively easily from the limestone and dolomite matrix and, once saturation with respect to these minerals is reached,
the ionic concentrations stabilise. Hardness is normally high and will cause scale build-up in water delivery infrastructure.
The Jinduckin Formation is known to contain the evaporite mineral anhydrite (calcium sulphate) and, to a lesser degree,
halite (sodium chloride). Accordingly, groundwater in this formation generally has calcium and sulphate as the dominant
ions. Salinity is mostly in the range 300 to 3000 µS/cm.
Groundwaters in the Cretaceous sediments are acidic with pH values of approximately 5. The salinity mostly ranges
between 50 and 100 µS/cm.
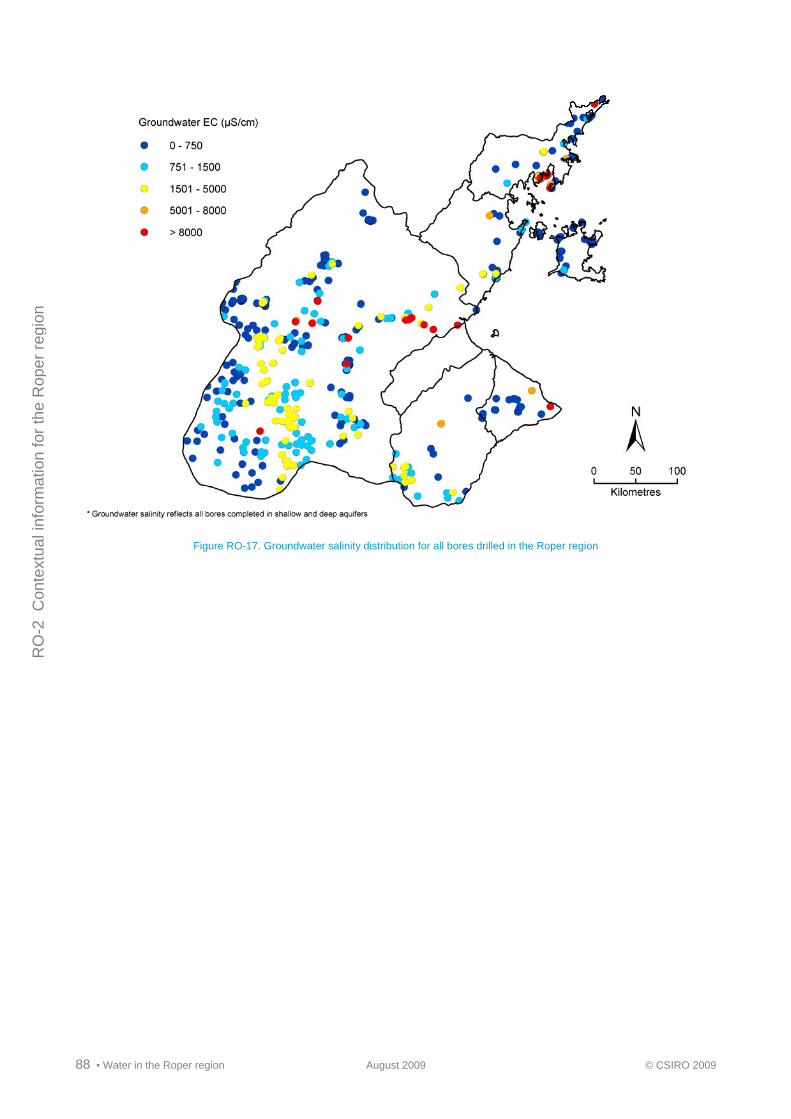
88 ▪ Water in the Roper region August 2009 © CSIRO 2009
RO
-2
Con
text
ual i
nfor
mat
ion
for
the
Rop
er r
egio
n
Figure RO-17. Groundwater salinity distribution for all bores drilled in the Roper region

© CSIRO 2009 August 2009 Water in the Roper region ▪ 89
RO
-2 C
ontextualinformation
forthe
Ro
perregion
RO-2.4 Legislation, water plans and other arrangements
RO-2.4.1 Legislated water use, entitlements and purpose
Unlike other states, the Northern Territory has no Integrated Catchment Management (ICM) framework in place.
Currently, the responsibility for river management lies predominantly with the Northern Territory government. The
Northern Territory Water Act 1992 has been the major legislative framework for managing rivers. The Water Act was
amended in 2000 in accordance with Council of Australian Governments (COAG) requirements for water reform. The Act
provides a process for the allocation of water resources to beneficial uses, including the environment, and to enable
trade in water licences. The legislative framework sets targets for cost recovery and pricing, institutional reform, water
allocation (including the development of regional water allocation plans) and trading, environment and water quality, and
public consultation and education. The Water Act 1992 restricts and controls the way in which water quality can be
affected. According to the Water Act 1992, the Crown owns all surface water and groundwater – a situation unique to
Australian water law (O’Donnell, 2002).
The water policy framework in the Northern Territory is not well developed and the legislation has no objects or principles
to guide the development of a water allocation plan. Sustainability is introduced through the concept of ‘beneficial use’.
‘Beneficial uses’, or preferred uses, are determined for natural waterways under the Act. The uses include: (i) protection
of aquatic ecosystem; (ii) recreation and aesthetics; (iii) raw water for drinking water supply; (iv) agricultural water supply;
and (v) industrial water supply. Beneficial uses have not been declared for waterways within the Roper River catchment.
Other Northern Territory legislation that has relevance to river management includes:
Aboriginal Sacred Sites Act 1989
Environmental Assessment Act 1982
Fisheries Act 1996
Heritage Conservation Act 1991
Mining Act 1990
Noxious Weeds Act 1994
Pastoral Land Act 1992
Planning Act 1999
Soil Conservation and Land Utilisation Act 1992
Waste Management and Pollution Control Act 1998.
Management plans currently in place include:
Elsey National Park Plan of Management (CCNT, 1995).
Within the Roper region there are several small towns and communities, of which Mataranka is the regional centre.
Others towns and communities include Barunga, Beswick (Wugular), Bulman, Daly Waters, Larrimah, Hodgson Downs,
Roper Bar, Ngukurr and Numbulwar on the mainland, and Angurugu, Umbakumba and Alyangula on Groote Eylandt.
The total population living within the region is probably less than 25,000.
Surface water entitlements amount to less than 500 ML/year, with the only substantive entitlement (340 ML/year) being
for the Yugul Mangi Community of Ngukurr. There are no urban or rural water restrictions on water use.
Currently, only two groundwater extraction licences have been issued in the Mataranka area, totalling 580 ML/year
<http://www.nt.gov.au/nreta/water/manage/register/pdf/GWRegister_Dec08.pdf>. A surface water extraction licence for
1900 ML has been issued to GEMCO to extract water from the Angurugu River. Most of this volume would be extracted
from the dry season groundwater fed flows.

90 ▪ Water in the Roper region August 2009 © CSIRO 2009
RO
-2
Con
text
ual i
nfor
mat
ion
for
the
Rop
er r
egio
n
Future
Currently there are applications for groundwater extraction licences in the Mataranka area for a further 13,923 ML/year.
A significant proportion of this amount is for irrigated agriculture that is already occurring without an extraction licence.
RO-2.4.2 Groundwater use and entitlements
Groundwater use figures for the Roper region were not calculated for the Australian Water Resources 2000 Assessment.
Small volume (less than 5 ML/year) groundwater users are not required to be licensed in accordance with a pending
exemption to section 47 of the Northern Territory Water Act 1992. Estimated use is based on 5 ML/year/property.
The largest user of groundwater in the region is the manganese mine located on Groote Eylandt which is run by GEMCO.
Water is sourced for this mine from the Cretaceous sediments and the Angurugu River which is sustained by
groundwater discharges from the basal sandstone of the Cretaceous sediments. While surface water extraction from the
Angurugu River is licensed and metered, groundwater extraction is neither licensed nor metered. Very large quantities of
groundwater are extracted to dewater the pits from which the manganese is extracted. Preliminary modelling undertaken
by Aquaterra (2001) suggests the impact of pit dewatering on the Angurugu River was immeasurable, but that baseflows
in the Emerald River could be influenced.
Irrigation near Mataranka is becoming an industry of increasing importance. Groundwater is extracted for irrigation from
the Tindall Limestone adjacent to Elsey National Park. Use is not yet licensed nor metered. The aquifer in this area is
subject to increasing stress from large irrigated agricultural developments that will have an as yet unknown impact on
springs that sustain dry season flows in the Roper River. The springs include the iconic Mataranka Hot Springs.
The fractured rock and carbonate aquifers usually provide reliable groundwater supplies of good quality for the pastoral
industry.
RO-2.4.3 Rivers and storages
There are currently no large surface water storages on the Roper River or its tributaries.
RO-2.4.4 Unallocated water
For water resources in the Northern Territory, where there has not been a detailed assessment of water availability
carried out as part of a water allocation plan, a contingent water allocation guideline applies. The guideline requires that
at least 80 percent of annual recharge to a groundwater system be allocated for environmental and other public benefit
outcomes. Consequently, groundwater will not be allocated in a manner that allows consumptive use to exceed
20 percent of annual recharge.
RO-2.4.5 Social and cultural considerations
Water resource assessments of West and East Arnhem Land by Zaar (2003) included a component on Indigenous
knowledge of water occurrence and significance, and encompass some of the area included in this region, including
Groote Island. A separate report containing Aboriginal knowledge collected during field trips was produced for both east
and west Arnhem Land (Zaar and Prowse, 1999; Zaar, 2003). The data consists largely of placenames and their location.
Some of these placenames, where appropriate, have been recorded on the Water Resource Map and are also included
in the GIS version of the map. Stories relating to water were also recorded e.g. the rainbow serpent which is associated
with billabongs and freshwater springs is responsible for the production of most water plants such as water lilies, algae
and palms, found growing near water (Zaar, 2003). The roar of waterfalls in the escarpment country is said to be the
sound of the serpent’s voice. The East Arnhem Land Study includes transcribed narratives describing the formation of
cultural water sites.

© CSIRO 2009 August 2009 Water in the Roper region ▪ 91
RO
-2 C
ontextualinformation
forthe
Ro
perregion
RO-2.4.6 Changed diversion and extraction regimes
The region is in a near-pristine state, with minimal changed diversion or extraction regimes.
RO-2.4.7 Changed land use
Minimal land use change, focussed around the town site of Mataranka, has occurred, or is expected to occur in the
region.
RO-2.4.8 Environmental constraints and implications of future development
The Mataranka Pools and part of the Roper River are listed on the Register of the National Estate for their natural values
(Australian Heritage Council). There is also heavy tourist use of the region. Impact by feral animals (particularly donkeys)
and weeds has become a management issue.

92 ▪ Water in the Roper region August 2009 © CSIRO 2009
RO
-2
Con
text
ual i
nfor
mat
ion
for
the
Rop
er r
egio
n
RO-2.5 References
ACRES (2000) ACRES Landsat 7 Mosaic of Australia, 1999-2000. Australian Centre for Remote Sensing. Australian Government - Geoscience Australia.
ADWG (2004) Australian drinking water guidelines. National Health and Medical Research Council.
Aquaterra (2001) GEMCO Mining Leases - Grotte Eylandt groundwater model. Fact Sheet. Aquaterra Consulting Pty Ltd.
BRS (2002) Land use of Australia, Version 3, 2001/2002. Australian Government - Bureau of Rural Sciences. Metadata at <http://adl.brs.gov.au/anrdl/php/full.php?fileidentifier=adl.brs.gov.au/findit/metadata_files_pa_luav3r9eg__00112a06.xml>
CCNT (1994) A conservation strategy for the Northern Territory. Conservation commission of the Northern Territory.
CCNT (1995) Elsey National Park Plan of Management. Conservation Commission of the Northern Territory.
Connors G, Oliver B, and Woinarski J (1996) Bioregions in the Northern Territory: Conservation Values, Reservations Status and Information Gaps. Final report to ANCA National Reserves System Cooperative Program (Project N607), Parks and Wildlife Commission of the Northern Territory, Palmerston, Northern Territory.
Department of Land and Housing (1991) Gulf region Land Use and development study, 1991.
DEWR (2005) Australia - Present Major Vegetation Groups - NVIS Stage 1, version 3. Australian Government Department of the Environment and Water Resources. <http://www.environment.gov.au/erin/nvis/mvg/index.html>.
Environment Australia (2001) A directory of important wetlands in Australia. Environment Australia, Canberra, Third Edition. Available at: <http://www.environment.gov.au/water/publications/environmental/wetlands/pubs/directory.pdf>.
Jolley P, Knapton A and Tickell SJ (2004) Water Availability from the Aquifer in the Tindall Limestone South of the Roper River Report. Darwin: Department of Infrastructure, Planning and Environment.
Holmes J (1986) The Pastoral Lands of the Northern Territory Gulf District: Resource Appraisal and Land Use Options. Report to the NT Department of Lands Uniquest.
Kerle JA (1996) Bioregions of the Northern Territory. Draft report Conservation Commission of Northern Territory, Palmerston, Northern Territory
Knapton (2006) Regional groundwater modelling of the Cambrian Limestone Aquifer System of the Wiso Basin, Georgina and Daly Basin. Department of Natural Resources, Environment and The Arts, Alice Springs, NT.
Lauritzen SE and Karp D (1993) Speleological assessment of karst acquifers developed within the Tindall Limestone, Katherine NT. Darwin: Northern Territory Power and Water Authority.
Morton SR, Short J and Barker RD (1995) Refugia for biological diversity in arid and semi-arid Australia. ACT Department of Environment, Sport and Tourism, Canberra, 171pp
O'Donnell M (2002) Briefing paper for the water rights project by the Lingiaria Foundation and ATSIC. Background briefing papers: Indigenous rights to waters, Broome, 95-105 pp.
Prowse G, Zaar U and Matthews I (1999) Water Resources of East Central Arnhem Land. 1:250000 Scale Map. Department of lands Planning and Environment, Darwin.
Tickell SJ (2005) Groundwater resources of the Tindall Limestone, Northern Territory. Department of Natural Resources, Environment and the Arts, Darwin.
Williams D, Chudleigh I and Jolly P (2003) Arafura Swamp Water Study Water Resources. Study Water Resources Technical Report: Department of Infrastructure, Planning and Environment.
Wilson BA, Brocklehurst PS, Clark MJ and Dickinson KJM (1990) Vegetation survey of the Northern Territory, Australia, 1990.Techincal Report No. 49: Conservation Commission of the Northern Territory
Woinarski J, Fensham R, Whitehead P and Fisher A with map production by Verhagen C (In prep) Biodiversity in the Australian Rangelands: a Review of Changes in Status and Threatening Processes. Draft report prepared as a resource document for Project 3: Developing an Adaptive Framework for Monitoring Biodiversity in Australia's Rangelands, of the National Land and Water Resources Audit, Theme 4 (Rangelands monitoring) by the Tropical Savannas Cooperative Research Centre, Darwin, Northern Territory
Zaar U (2003) Water Resources of West Arnhem Land: Aboriginal Knowledge. Report Number 36/2003D. Darwin, Department of Infrastructure, Planning and Environment, Conservation and Natural Resources Group.
Zaar U and Prowse G (1999) Water Resources of East Arnhem Land: Aboriginal Knowledge. Department of Lands, Planning and Environment, Natural Resources Division. Darwin.

© CSIRO 2009 August 2009 Water in the Roper region ▪ 93
RO
-3 W
aterbalance
resultsfor
theR
operregion
RO-3 Water balance results for the Roper region
This chapter describes modelling results and the assessment of the water resources undertaken by this project for the
Roper region. Detailed, quantified assessments are made where possible, and relevant, and confidence is estimated.
Modelling results are reported under climate and development scenarios as defined at the division level in Section 2.1 of
Chapter 2. This chapter is sub-divided into:
climate
recharge estimation
conceptual groundwater models
groundwater modelling results
rainfall-runoff modelling results
river system water balance
changes to flow regimes at environmental assets.
RO-3.1 Climate
RO-3.1.1 Historical climate
The Roper region receives an average of 843 mm of rainfall over the September to August water year (Figure RO-18),
most of which (805 mm) falls in the November to April wet season (Figure RO-19). Across the region there is a strong
north–south gradient in annual rainfall (Figure RO-20), ranging from 1357 mm in the north to 592 mm in the south. Over
the first half of the historical (1930 to 2007) period, annual rainfall was relatively constant at around 750 mm. Conversely,
in the second half of the period mean annual rainfall increased to approximately 950 mm. The highest yearly rainfall
received was 1477 mm in 2001, and the lowest was 347 mm in 1952.
Areal potential evapotranspiration (APET) is very high across the region, averaging 1928 mm over a water year (Figure
RO-18), and varies moderately across the seasons (Figure RO-19). APET generally remains higher than rainfall
hroughout the year resulting in year-round water-limited conditions.
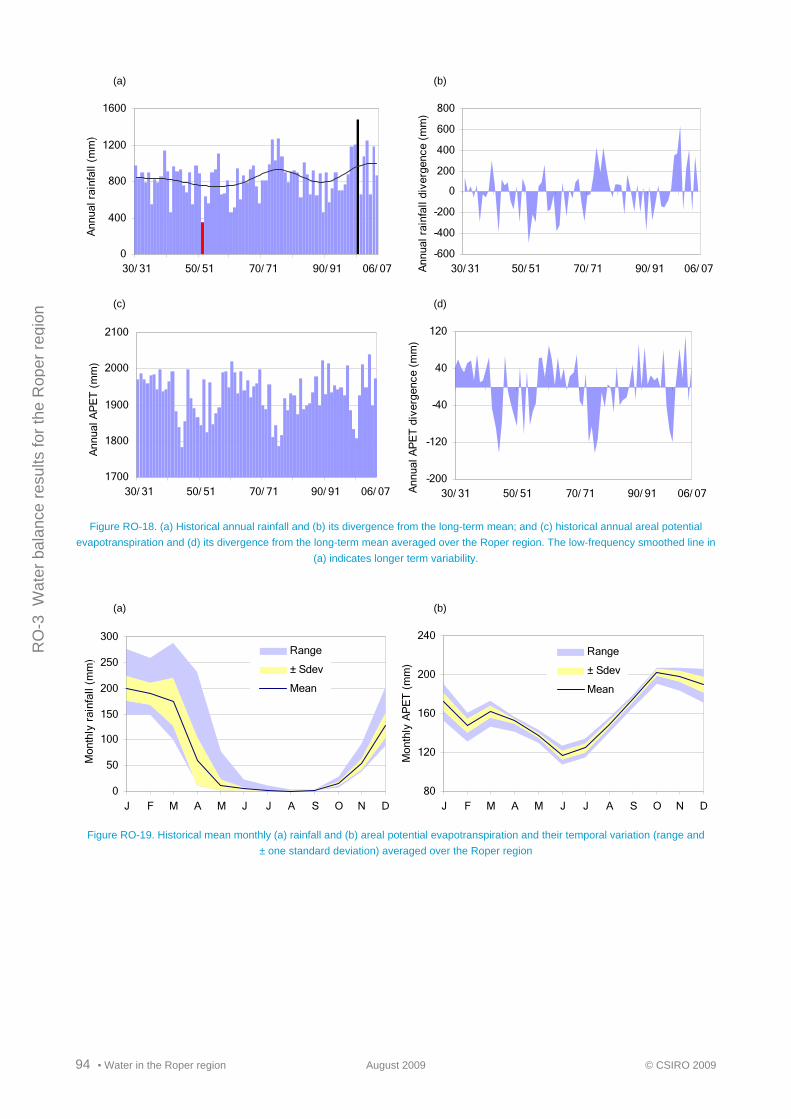
94 ▪ Water in the Roper region August 2009 © CSIRO 2009
RO
-3
Wat
er b
alan
ce r
esul
ts f
or th
e R
oper
reg
ion
(a) (b)
0
400
800
1200
1600
30/ 31 50/ 51 70/ 71 90/ 91 06/ 07
Ann
ual r
ainf
all (
mm
) ,,,,
-600
-400
-200
0
200
400
600
800
30/ 31 50/ 51 70/ 71 90/ 91 06/ 07Ann
ual r
ainf
all d
iver
genc
e (m
m)
,,,
,,,
(c) (d)
1700
1800
1900
2000
2100
30/ 31 50/ 51 70/ 71 90/ 91 06/ 07
Ann
ual A
PE
T (
mm
) ,,,
-200
-120
-40
40
120
30/ 31 50/ 51 70/ 71 90/ 91 06/ 07Ann
ual A
PE
T d
iver
genc
e (m
m)
,,,,,,
Figure RO-18. (a) Historical annual rainfall and (b) its divergence from the long-term mean; and (c) historical annual areal potential
evapotranspiration and (d) its divergence from the long-term mean averaged over the Roper region. The low-frequency smoothed line in
(a) indicates longer term variability.
(a) (b)
0
50
100
150
200
250
300
J F M A M J J A S O N D
Mon
thly
rai
nfal
l (m
m)
,,,
,,, Range
± Sdev
Mean
80
120
160
200
240
J F M A M J J A S O N D
Mon
thly
AP
ET
(m
m)
,,,,,, Range
± Sdev
Mean
Figure RO-19. Historical mean monthly (a) rainfall and (b) areal potential evapotranspiration and their temporal variation (range and
± one standard deviation) averaged over the Roper region
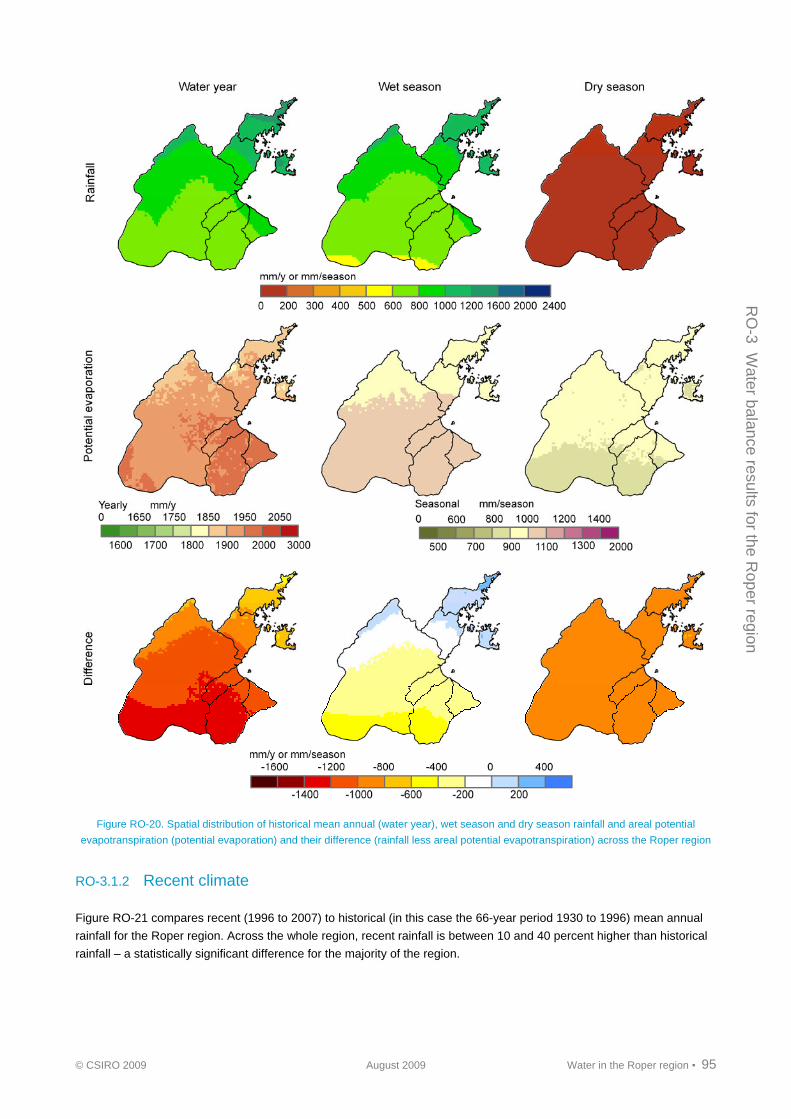
© CSIRO 2009 August 2009 Water in the Roper region ▪ 95
RO
-3 W
aterbalance
resultsfor
theR
operregion
Figure RO-20. Spatial distribution of historical mean annual (water year), wet season and dry season rainfall and areal potential
evapotranspiration (potential evaporation) and their difference (rainfall less areal potential evapotranspiration) across the Roper region
RO-3.1.2 Recent climate
Figure RO-21 compares recent (1996 to 2007) to historical (in this case the 66-year period 1930 to 1996) mean annual
rainfall for the Roper region. Across the whole region, recent rainfall is between 10 and 40 percent higher than historical
rainfall – a statistically significant difference for the majority of the region.

96 ▪ Water in the Roper region August 2009 © CSIRO 2009
RO
-3
Wat
er b
alan
ce r
esul
ts f
or th
e R
oper
reg
ion
(a) (b)
(c) (d)
Figure RO-21. Spatial distribution of (a) historical and (b) recent mean annual rainfall; and (c) their relative percent difference and (d) the
statistical significance of these differences across the Roper region. (Note that historical in this case is the 66-year period 1930 to 1996)
RO-3.1.3 Future climate
Under Scenario C annual rainfall varies between 765 and 932 mm (Table RO-3) compared to the historical mean of
843 mm. Similarly, APET ranges between 1959 and 2001 mm compared to the historical mean of 1928 mm.
A total of 45 variants of Scenario C were modelled (15 global climate models (GCMs) for each of the high, medium and
low global warming scenarios). Subsequently, results from a wet extreme, median and dry extreme variant are shown
(referred to as scenarios Cwet, Cmid and Cdry). Under Scenario Cwet annual rainfall and APET increase by 11 percent
and 2 percent, respectively. Under Scenario Cmid annual rainfall is the same as the historical mean and APET increases
by 4 percent. Under Scenario Cdry annual rainfall decreases by 9 percent and APET increases by 4 percent.
Under Scenario Cmid long-term monthly averages of rainfall and APET do not differ much from historical values (Figure
RO-22). Under Scenario Cmid rainfall lies well within the predicted range in values from all 45 Scenario C variants for all
months. The seasonality of rainfall is expected to change slightly only in that any changes in rainfall will occur in the wet
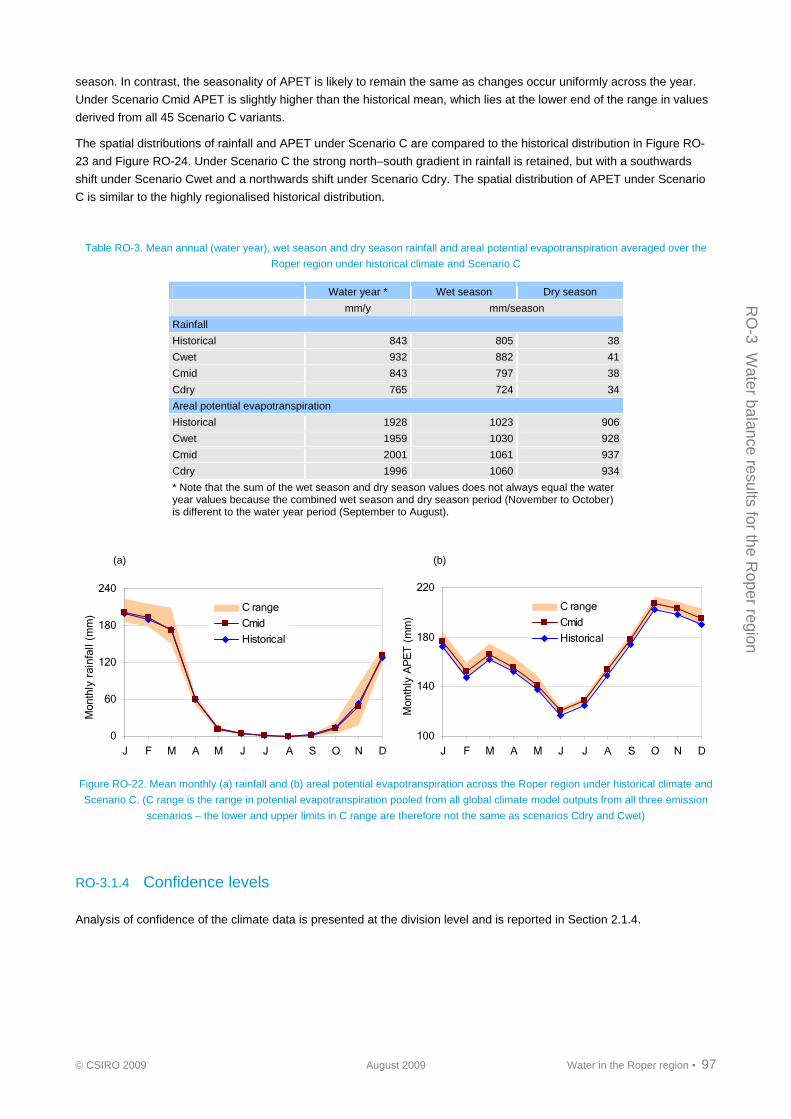
© CSIRO 2009 August 2009 Water in the Roper region ▪ 97
RO
-3 W
aterbalance
resultsfor
theR
operregion
season. In contrast, the seasonality of APET is likely to remain the same as changes occur uniformly across the year.
Under Scenario Cmid APET is slightly higher than the historical mean, which lies at the lower end of the range in values
derived from all 45 Scenario C variants.
The spatial distributions of rainfall and APET under Scenario C are compared to the historical distribution in Figure RO-
23 and Figure RO-24. Under Scenario C the strong north–south gradient in rainfall is retained, but with a southwards
shift under Scenario Cwet and a northwards shift under Scenario Cdry. The spatial distribution of APET under Scenario
C is similar to the highly regionalised historical distribution.
Table RO-3. Mean annual (water year), wet season and dry season rainfall and areal potential evapotranspiration averaged over the
Roper region under historical climate and Scenario C
Water year * Wet season Dry season
mm/y mm/season
Rainfall
Historical 843 805 38
Cwet 932 882 41
Cmid 843 797 38
Cdry 765 724 34
Areal potential evapotranspiration
Historical 1928 1023 906
Cwet 1959 1030 928
Cmid 2001 1061 937
Cdry 1996 1060 934
* Note that the sum of the wet season and dry season values does not always equal the water year values because the combined wet season and dry season period (November to October) is different to the water year period (September to August).
(a) (b)
0
60
120
180
240
J F M A M J J A S O N D
Mon
thly
rai
nfal
l (m
m) …
. C range
Cmid
Historical
100
140
180
220
J F M A M J J A S O N D
Mon
thly
AP
ET
(m
m) …
. C range
Cmid
Historical
Figure RO-22. Mean monthly (a) rainfall and (b) areal potential evapotranspiration across the Roper region under historical climate and
Scenario C. (C range is the range in potential evapotranspiration pooled from all global climate model outputs from all three emission
scenarios – the lower and upper limits in C range are therefore not the same as scenarios Cdry and Cwet)
RO-3.1.4 Confidence levels
Analysis of confidence of the climate data is presented at the division level and is reported in Section 2.1.4.
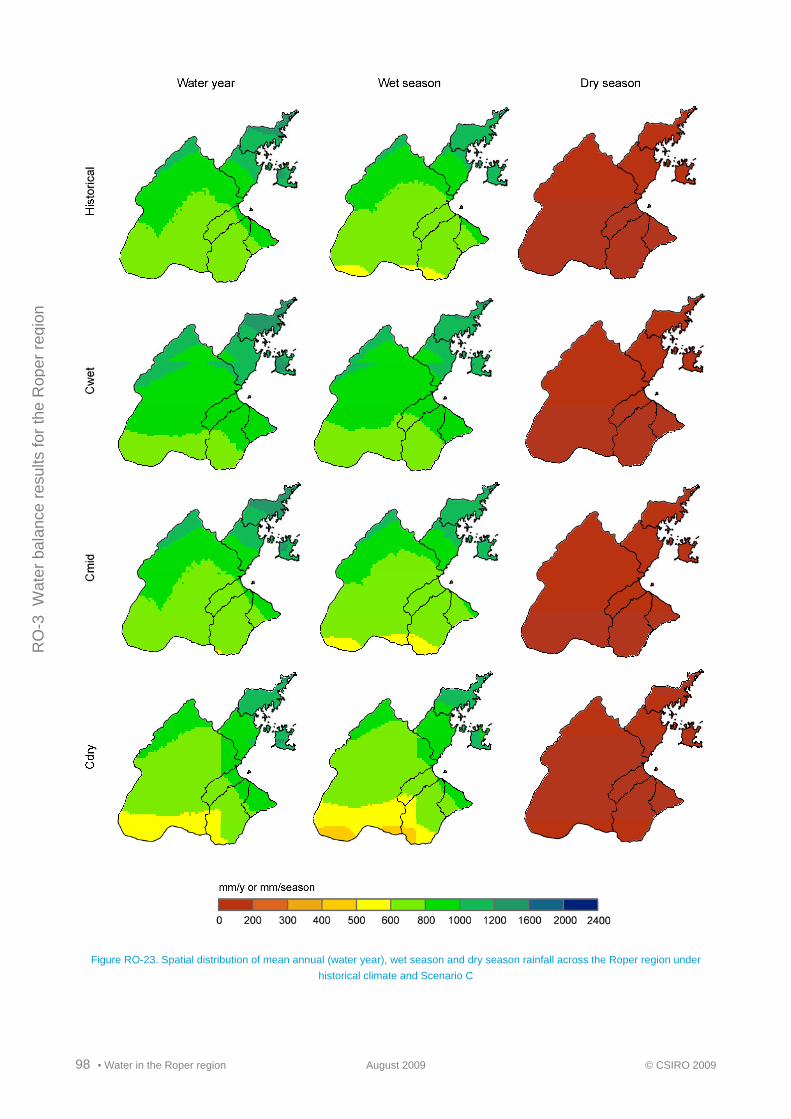
98 ▪ Water in the Roper region August 2009 © CSIRO 2009
RO
-3
Wat
er b
alan
ce r
esul
ts f
or th
e R
oper
reg
ion
Figure RO-23. Spatial distribution of mean annual (water year), wet season and dry season rainfall across the Roper region under
historical climate and Scenario C
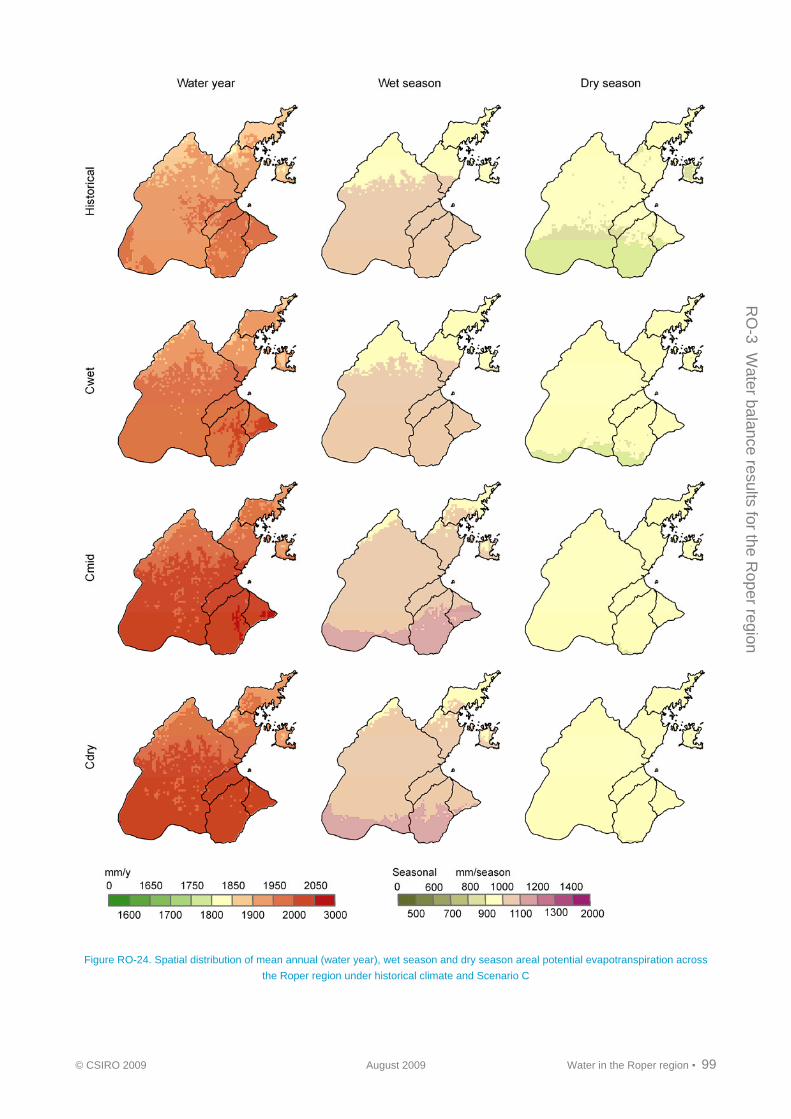
© CSIRO 2009 August 2009 Water in the Roper region ▪ 99
RO
-3 W
aterbalance
resultsfor
theR
operregion
Figure RO-24. Spatial distribution of mean annual (water year), wet season and dry season areal potential evapotranspiration across
the Roper region under historical climate and Scenario C

100 ▪ Water in the Roper region August 2009 © CSIRO 2009
RO
-3
Wat
er b
alan
ce r
esul
ts f
or th
e R
oper
reg
ion
RO-3.2 WAVES potential diffuse recharge estimations
The WAVES model (Zhang and Dawes, 1998) was used to estimate the change in groundwater recharge across the
Roper region under a range of different climate scenarios. WAVES is a vertical recharge flux model that can model plant
physiological feedbacks in response to increased CO2, as well as model the water balance of different soil, vegetation
and climate regimes. It was chosen for its balance in complexity between plant physiology and soil physics. It was also
used to assess recharge for the Murray-Darling Basin Sustainable Yields Project (Crosbie et al., 2008).
RO-3.2.1 Under historical climate
Under Scenario A the calculated recharge for the Roper region is greatest in the north and decreases progressively to
the south following the rainfall gradient. The historical record was assessed to establish any difference between wet and
dry periods of recharge. A 23-year period was used, which allows projections of recharge estimates to 2030 – in other
words, to estimate recharge in 2030 assuming future climate is similar to historical climate (Scenario A). Under a wet
historical climate (Scenario Awet) recharge increases 12 percent uniformly across the region. Under a median historical
climate (Scenario Amid) recharge decreases 3 percent. Under a dry historical climate (Scenario Adry) recharge
decreases 14 percent.
Where unweathered bedrock outcrops occur, confidence in the modelled results is reduced. The locations of these
outcrops in the Roper region are shown on the historical recharge map in Figure RO-25.
Table RO-4. Recharge scaling factors in the Roper region under scenarios A, B and C
Region Awet Amid Adry B Cwet Cmid Cdry
Roper 1.12 0.97 0.86 1.43 1.48 1.13 0.98
RO-3.2.2 Under recent climate
Under the recent (1996 to 2007) climate the Roper region has been wetter than the historical (1930 to 2007) average and
consequently the calculated recharge is 43 percent higher under Scenario B relative to Scenario A (Table RO-4). This
increase has not been uniform across the region with the greatest increase in the south of the region and some areas of
the east showing almost no change from the historical period (Figure RO-25). The non-linear relationship between
increase in rainfall and increase in recharge reflects the importance of climate variables other than total rainfall in
determining recharge (e.g. rainfall intensity and temperature).

© CSIRO 2009 August 2009 Water in the Roper region ▪ 101
RO
-3 W
aterbalance
resultsfor
theR
operregion
Figure RO-25. Spatial distribution of historical mean recharge rate and recharge scaling factors across the Roper region for scenarios A,
B and C. The hatched region on the historical recharge map identifies where unweathered bedrock outcrops occur
RO-3.2.3 Under future climate
Figure RO-26 shows the percentage change in mean annual recharge averaged over the Roper region under the 45
Scenario C variants (15 GCMs for each of the high, medium and low global warming scenarios) relative to Scenario A.

102 ▪ Water in the Roper region August 2009 © CSIRO 2009
RO
-3
Wat
er b
alan
ce r
esul
ts f
or th
e R
oper
reg
ion
The percentage change in the mean annual rainfall and recharge from the corresponding GCMs are also tabulated in
Table RO-5. In some scenarios the recharge is projected to increase despite a decrease in rainfall. This is because total
rainfall is not the only climate variable that has an influence over recharge. Daily rainfall intensity, temperature and CO2
concentration are also important drivers (see Section 2.3.3 in the division-level Chapter 2), and specific situations can
result in this counter-intuitive result. In particular, rainfall intensity is seen as a significant factor in this relationship.
-60
-40
-20
0
20
40
60
csiro m
ri
inm
cm iap
giss
_aom gf
dl ipsl
cnrm
ncar
_ccsm m
pi
miro
c
ncar
_pcm
miu
b
cccm
a_t4
7
cccm
a_t6
3
% c
hang
e in
mea
n an
nual
rec
harg
e ...
High global warming
Medium global warming
Low global warming
Figure RO-26. Percentage change in mean annual recharge under the 45 Scenario C variants (15 global climate models and three
global warming scenarios) relative to Scenario A
Table RO-5. Summary results under 45 Scenario C variants (numbers show percentage change in mean annual rainfall and recharge
under Scenario C relative to Scenario A)
High global warming Medium global warming Low global warming
GCM Rainfall Recharge GCM Rainfall Recharge GCM Rainfall Recharge
csiro -14% -11% csiro -10% -9% csiro -7% -6%
mri -5% -2% mri -4% -1% mri -3% -2%
inmcm 0% 6% inmcm 0% 3% inmcm 0% 2%
iap -2% 10% iap -1% 8% iap -1% 5%
giss_aom -3% 10% giss_aom -2% 6% giss_aom -1% 3%
gfdl -9% 14% gfdl -7% 10% gfdl -5% 7%
ipsl 0% 14% ipsl 0% 8% ipsl 0% 5%
cnrm 0% 18% cnrm 0% 13% cnrm 0% 9%
ncar_ccsm 5% 22% ncar_ccsm 4% 15% ncar_ccsm 3% 10%
mpi 1% 24% mpi 1% 17% mpi 1% 10%
miroc 5% 26% miroc 4% 20% miroc 3% 12%
ncar_pcm 9% 33% ncar_pcm 7% 24% ncar_pcm 5% 17%
miub 5% 35% miub 4% 26% miub 3% 17%
cccma_t47 11% 48% cccma_t47 9% 35% cccma_t47 6% 25%
cccma_t63 11% 50% cccma_t63 9% 38% cccma_t63 6% 25%
Under Scenario Cwet recharge increases 48 percent with the greatest increase in the north. Under Scenario Cmid
recharge increases 13 percent with the greatest increase in the north. Under Scenario Cdry recharge decreases 2
percent with increases in the west of the region and decreases in the north.
RO-3.2.4 Confidence levels
The estimation of recharge from (Zhang and Dawes, 1998) is only indicative of the actual recharge and has not been
validated with field measurements. A chloride mass balance has been conducted as an independent measure of
recharge. The results in the Roper region show that estimate of recharge under Scenario A using (Zhang and Dawes,

© CSIRO 2009 August 2009 Water in the Roper region ▪ 103
RO
-3 W
aterbalance
resultsfor
theR
operregion
1998) (95 mm/year) is greater than the best estimate using the chloride mass balance (72 mm/year) but it is within the
confidence limits of the chloride mass balance (7 to 168 mm/year).
RO-3.3 Conceptual groundwater models
RO-3.3.1 Fractured rocks
Relatively low annual rainfall and high potential evapotranspiration means that recharge to the groundwater is likely to
only occur after prolonged periods of intense rainfall in the wet season. Recharge is more effective through sandy soils
than black clay soils, the latter only permitting significant infiltration early in the wet season through cracks and
preferential pathways before the clays swell. Aquifers are also locally recharged through either small alluvial aquifers or
directly from the river when high flows or flooding occurs. The main groundwater discharge process is through
evapotranspiration. For rivers draining fractured rock aquifers in the region flows are reduced to disconnected semi-
permanent pools and then dry river beds as the dry season progresses.
RO-3.3.2 Karstic carbonate rocks
Processes occurring in karstic carbonate rocks are similar to those for the fractured rocks, except that groundwater flow
is primarily through solution cavities rather than fractures. The main groundwater discharge processes are through
evapotranspiration and spring discharge to rivers. River flows are maintained to varying degrees by the spring discharge.
Groundwater discharging from the Proterozoic carbonates maintains perennial flows in the Mainoru, Wilton, Koolatong,
Walker and Rosie rivers and Flying Fox Creek (Figure RO-2). A conceptual model for the interconnection between the
Proterozoic carbonate aquifer and the Mainoru River is shown in Figure RO-27 whereby groundwater discharge to the
river is focussed along a fault.
Figure RO-27. Schematic of hydrogeological cross-section showing groundwater discharge to the Mainoru River
Groundwater discharge from the Tindall Limestone maintains permanent flows in the Roper River. The generalised
regional groundwater flow directions are shown in Figure RO-14 (in Chapter RO-2). Interactions between the Tindall
Limestone and Roper River are generally controlled by solution cavities intersecting the river (Figure RO-28).

104 ▪ Water in the Roper region August 2009 © CSIRO 2009
RO
-3
Wat
er b
alan
ce r
esul
ts f
or th
e R
oper
reg
ion
Figure RO-28. Schematic of hydrogeological cross-section showing groundwater discharge to the Roper River
RO-3.3.3 Cretaceous sediments
Processes occurring in the Cretaceous sediments are similar to those for the fractured rocks. The main groundwater
discharge processes are through evapotranspiration and spring discharge to rivers. River flows are maintained to varying
degrees by the spring discharge.
Springs from the Cretaceous sediments mainly occur in the centre and east of the region. They occur where a layer of
porous and permeable sandstone overlies a low permeability rock such as shale or granite (Figure RO-29). Water stored
in the upper layer seeps out at the contact between the two rock types, generally in the form of a seepage zone or
swampy area. Examples of where this spring type occurs are the Durabudboi River and Wonga Creek on the mainland
and the Angurugu, Emerald and Amagula rivers on Groote Eylandt (Figure RO-2 in Chapter RO-1).
Figure RO-29. Schematic of hydrogeological cross-section showing groundwater discharge that provides the dry season flow for Wonga
Creek
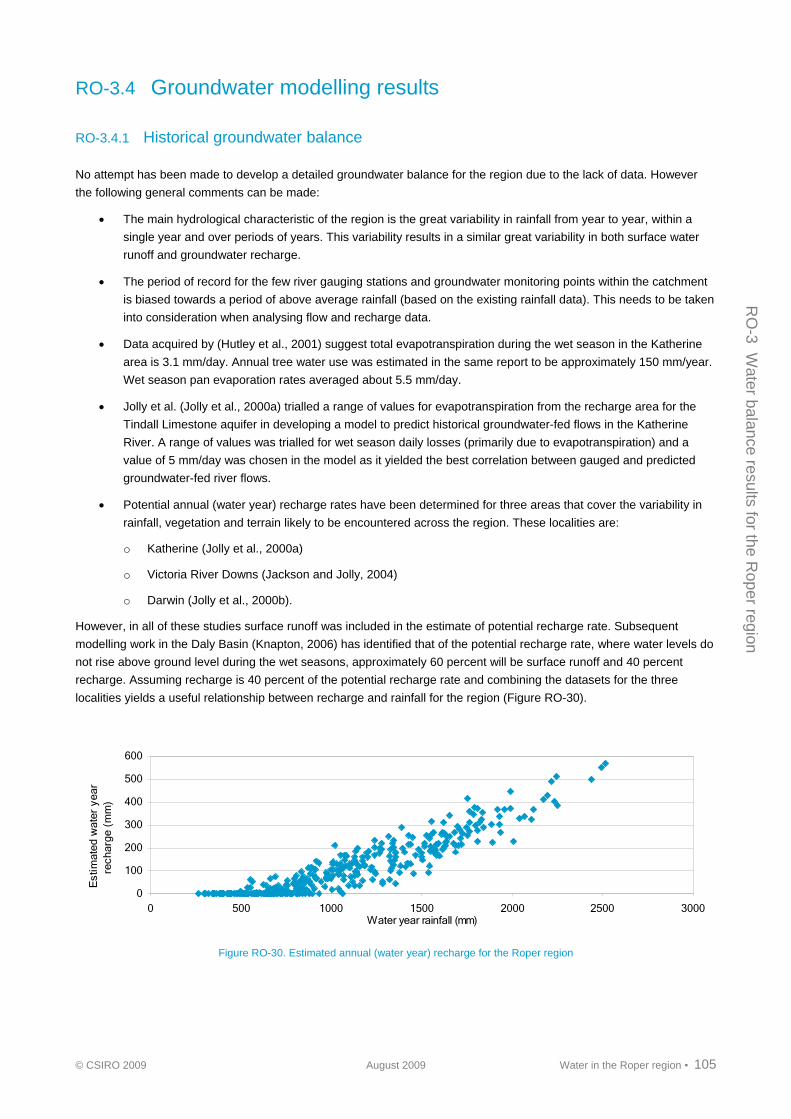
© CSIRO 2009 August 2009 Water in the Roper region ▪ 105
RO
-3 W
aterbalance
resultsfor
theR
operregion
RO-3.4 Groundwater modelling results
RO-3.4.1 Historical groundwater balance
No attempt has been made to develop a detailed groundwater balance for the region due to the lack of data. However
the following general comments can be made:
The main hydrological characteristic of the region is the great variability in rainfall from year to year, within a
single year and over periods of years. This variability results in a similar great variability in both surface water
runoff and groundwater recharge.
The period of record for the few river gauging stations and groundwater monitoring points within the catchment
is biased towards a period of above average rainfall (based on the existing rainfall data). This needs to be taken
into consideration when analysing flow and recharge data.
Data acquired by (Hutley et al., 2001) suggest total evapotranspiration during the wet season in the Katherine
area is 3.1 mm/day. Annual tree water use was estimated in the same report to be approximately 150 mm/year.
Wet season pan evaporation rates averaged about 5.5 mm/day.
Jolly et al. (Jolly et al., 2000a) trialled a range of values for evapotranspiration from the recharge area for the
Tindall Limestone aquifer in developing a model to predict historical groundwater-fed flows in the Katherine
River. A range of values was trialled for wet season daily losses (primarily due to evapotranspiration) and a
value of 5 mm/day was chosen in the model as it yielded the best correlation between gauged and predicted
groundwater-fed river flows.
Potential annual (water year) recharge rates have been determined for three areas that cover the variability in
rainfall, vegetation and terrain likely to be encountered across the region. These localities are:
o Katherine (Jolly et al., 2000a)
o Victoria River Downs (Jackson and Jolly, 2004)
o Darwin (Jolly et al., 2000b).
However, in all of these studies surface runoff was included in the estimate of potential recharge rate. Subsequent
modelling work in the Daly Basin (Knapton, 2006) has identified that of the potential recharge rate, where water levels do
not rise above ground level during the wet seasons, approximately 60 percent will be surface runoff and 40 percent
recharge. Assuming recharge is 40 percent of the potential recharge rate and combining the datasets for the three
localities yields a useful relationship between recharge and rainfall for the region (Figure RO-30).
0
100
200
300
400
500
600
0 500 1000 1500 2000 2500 3000Water year rainfall (mm)
Est
imat
ed w
ater
yea
r ...
re
char
ge (
mm
) ...
Figure RO-30. Estimated annual (water year) recharge for the Roper region

106 ▪ Water in the Roper region August 2009 © CSIRO 2009
RO
-3
Wat
er b
alan
ce r
esul
ts f
or th
e R
oper
reg
ion
RO-3.4.2 Surface–groundwater interaction
In this section, the impact of groundwater extractions on surface water yields is considered. The impact is to stream
depletion whereby pumped groundwater eventually is sourced from a nearby river. The distance between a groundwater
pump and a nearby river greatly affects the timing of its impacts on that river. Licensed groundwater extraction within the
Roper region is currently limited to two licences totalling only 0.58 GL/year. Hence, this section will focus on hypothetical
analyses that can be used for managing future groundwater developments. It is worth noting however, that the following
analysis assumes a homogeneous aquifer in which groundwater flow is distribyed throughout the porous limestone. It
does not account for groundwater flow through dissolution features (e.g., caves) and therefore may provide misleading
results for extraction close to the river.
Figure RO-31 shows results of stream depletion calculations for hypothetical scenarios in the unconfined carbonate
aquifers to provide some insight into the potential impacts of further groundwater development. The calculations assume
an aquifer transmissivity of 400 m2/day and specific yield of 0.2.
10
100
1000
10000
100000
0 0.2 0.4 0.6 0.8 1
Depletion ratio
Dis
tanc
e (m
)
Time=1 yr
Time=5 yr
Time=25 yr
Time=50 yr
Time=100 yr
Upper bound-1 yr
Lower bound-1 yr
Figure RO-31. Impact of hypothetical scenarios in an unconfined aquifer on stream depletion
Figure RO-31 can be used as a management tool in two different ways:
locating bores to minimise stream depletion. For example, if a proponent wanted to pump groundwater at
10,000 m3/day and was not allowed to deplete the river by more than 4,000 m3/day (i.e. depletion ratio = 0.4) on
any occasion during the next 25 years, the pumping bores would need to be located no closer than 5 km from
the river (see blue lines in Figure RO-31).
determining maximum groundwater pumping rates at specified distances from the stream. For example, if a
proponent wanted to pump groundwater from a bore located 3 km from a river and was not permitted to deplete
the river by more than 4000 m3/day on any occasion during the next 25 years, the corresponding depletion ratio
would be 0.6 (see green lines in Figure RO-31) and the maximum pumping rate is 4,000/0.6 = 6666 m3/day.
There is a great uncertainty in estimating representative aquifer parameters for this analysis. Upper and lower limits for
this uncertainty can be defined and hence an estimate corresponding to upper and lower bounds for impacts. The
example curves shown in Figure RO-31 represent the likely impacts (after 1 year) for a 100 percent uncertainty in aquifer
transmissivity.
Given the importance of carbonate aquifers in providing dry season flows to perennial rivers in the region, any new
groundwater developments should be located as far as possible from rivers to minimise the short-term (seasonal) impact,
which can potentially reduce flow during the dry season. By locating developments away from the river, the impacts
would be delayed, but the aquifer is depleted (rather than the river). However, the aquifer is likely to be recharged during
the wet season.
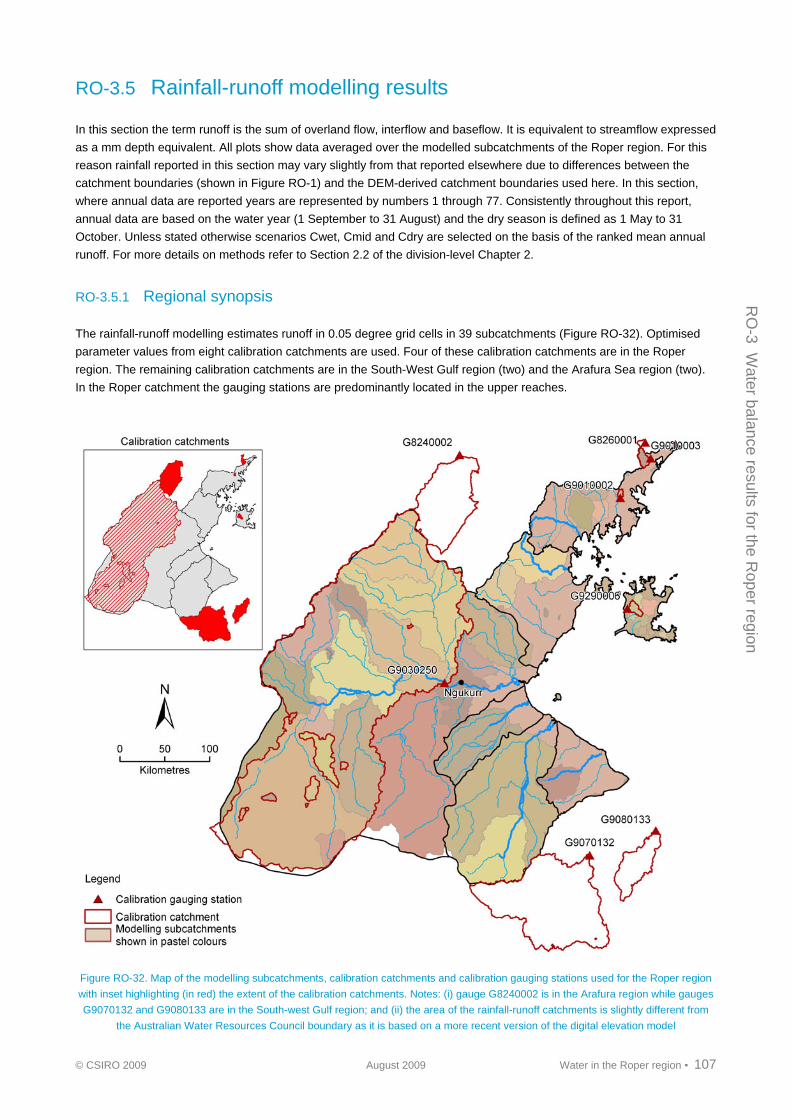
© CSIRO 2009 August 2009 Water in the Roper region ▪ 107
RO
-3 W
aterbalance
resultsfor
theR
operregion
RO-3.5 Rainfall-runoff modelling results
In this section the term runoff is the sum of overland flow, interflow and baseflow. It is equivalent to streamflow expressed
as a mm depth equivalent. All plots show data averaged over the modelled subcatchments of the Roper region. For this
reason rainfall reported in this section may vary slightly from that reported elsewhere due to differences between the
catchment boundaries (shown in Figure RO-1) and the DEM-derived catchment boundaries used here. In this section,
where annual data are reported years are represented by numbers 1 through 77. Consistently throughout this report,
annual data are based on the water year (1 September to 31 August) and the dry season is defined as 1 May to 31
October. Unless stated otherwise scenarios Cwet, Cmid and Cdry are selected on the basis of the ranked mean annual
runoff. For more details on methods refer to Section 2.2 of the division-level Chapter 2.
RO-3.5.1 Regional synopsis
The rainfall-runoff modelling estimates runoff in 0.05 degree grid cells in 39 subcatchments (Figure RO-32). Optimised
parameter values from eight calibration catchments are used. Four of these calibration catchments are in the Roper
region. The remaining calibration catchments are in the South-West Gulf region (two) and the Arafura Sea region (two).
In the Roper catchment the gauging stations are predominantly located in the upper reaches.
Figure RO-32. Map of the modelling subcatchments, calibration catchments and calibration gauging stations used for the Roper region
with inset highlighting (in red) the extent of the calibration catchments. Notes: (i) gauge G8240002 is in the Arafura region while gauges
G9070132 and G9080133 are in the South-west Gulf region; and (ii) the area of the rainfall-runoff catchments is slightly different from
the Australian Water Resources Council boundary as it is based on a more recent version of the digital elevation model

108 ▪ Water in the Roper region August 2009 © CSIRO 2009
RO
-3
Wat
er b
alan
ce r
esul
ts f
or th
e R
oper
reg
ion
RO-3.5.2 Model calibration
Figure RO-33 compares the modelled and observed monthly runoff and the modelled and observed daily flow duration
curves for the ten calibration catchments. Nash-Sutcliffe efficiency (NSE) values provide a quantitative measure of how
well simulated values match observed values. NSE values are described in more detail in Section 2.2.3 of the division-
level Chapter 2. On the monthly plots NSE is the monthly Nash-Sutcliffe efficiency value and NSE (dry season) is the dry
season monthly Nash-Sutcliffe efficiency value. On the daily flow exceedance plots, NSE is the daily flow exceedance
curve Nash-Sutcliffe efficiency value and NSE (50 to 100 percent) is the lower half of the daily flow exeedance curve
Nash-Sutcliffe efficiency value.
The results indicate that the ensemble calibration of the rainfall-runoff models Sacramento and IhacresClassic does not
reproduce the observed monthly runoff series (monthly NSE values generally greater than 0.6) and the daily flow
duration characteristic (NSE values generally greater than 0.85) well. However, it should be noted that the volumetric
constraint used in the model calibration also ensures that the total modelled runoff is within 5 percent of the total
observed runoff.
The calibration method places more importance on the simulation of high runoff, and therefore rainfall-runoff modelling of
the medium and high runoff is considerably better than the modelling of low runoff. It should be noted, however, that
while the relative difference between the observed and simulated low flow values may be large (which is what gives rise
to the low monthly dry season NSE values for example), the absolute difference between the observed and simulated
low flow values is generally small because both values are small. This is demonstrated by the relatively low NSE values
for the monthly dry season and lower half of the daily flow duration characteristic. Nevertheless, an optimisation to
reduce overall error variance can result in some underestimation of high runoff and overestimation of low runoff. This is
evident in some of the scatter plots comparing the modelled and observed monthly runoff and many of the daily flow
duration curves. For the majority of calibration catchments the disagreement between the modelled and observed daily
runoff characteristics is discernable for runoff that is exceeded less than 1 percent of the time. This is accentuated in the
plots because of the linear scale on the y-axis and normal probability scale on the x-axis. In any case, the volumetric
constraint used in the model calibration ensures that the total modelled runoff is always within 5 percent of the total
observed runoff. As indicated by the relatively low NSE values for the lower half of the daily flow exceedance curve and
monthly dry season there may be considerable disagreement between observed and modelled low flow values (i.e.
cease-to-flow).

© CSIRO 2009 August 2009 Water in the Roper region ▪ 109
RO
-3 W
aterbalance
resultsfor
theR
operregion
Figure RO-33. Modelled and observed monthly runoff and daily flow exceedance curve for each calibration catchment in the Roper
region. (Red text denotes gauges located outside the region; blue text denotes gauges used to predict streamflow only)
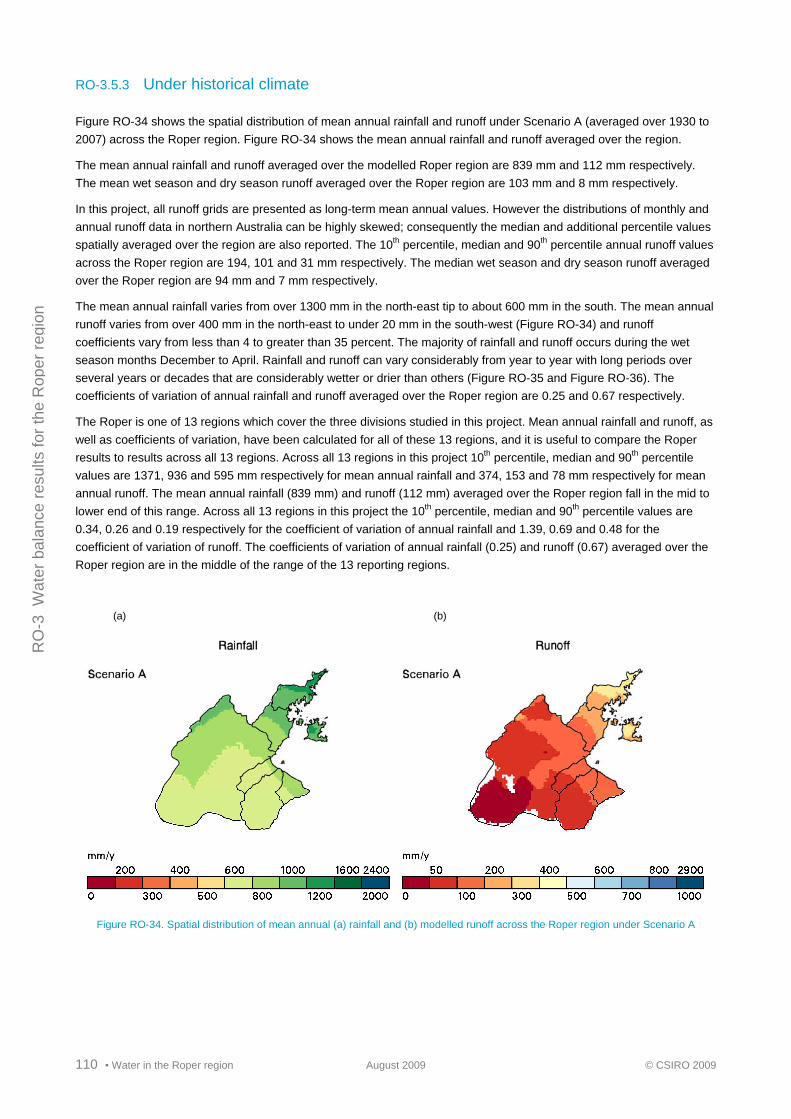
110 ▪ Water in the Roper region August 2009 © CSIRO 2009
RO
-3
Wat
er b
alan
ce r
esul
ts f
or th
e R
oper
reg
ion
RO-3.5.3 Under historical climate
Figure RO-34 shows the spatial distribution of mean annual rainfall and runoff under Scenario A (averaged over 1930 to
2007) across the Roper region. Figure RO-34 shows the mean annual rainfall and runoff averaged over the region.
The mean annual rainfall and runoff averaged over the modelled Roper region are 839 mm and 112 mm respectively.
The mean wet season and dry season runoff averaged over the Roper region are 103 mm and 8 mm respectively.
In this project, all runoff grids are presented as long-term mean annual values. However the distributions of monthly and
annual runoff data in northern Australia can be highly skewed; consequently the median and additional percentile values
spatially averaged over the region are also reported. The 10th percentile, median and 90th percentile annual runoff values
across the Roper region are 194, 101 and 31 mm respectively. The median wet season and dry season runoff averaged
over the Roper region are 94 mm and 7 mm respectively.
The mean annual rainfall varies from over 1300 mm in the north-east tip to about 600 mm in the south. The mean annual
runoff varies from over 400 mm in the north-east to under 20 mm in the south-west (Figure RO-34) and runoff
coefficients vary from less than 4 to greater than 35 percent. The majority of rainfall and runoff occurs during the wet
season months December to April. Rainfall and runoff can vary considerably from year to year with long periods over
several years or decades that are considerably wetter or drier than others (Figure RO-35 and Figure RO-36). The
coefficients of variation of annual rainfall and runoff averaged over the Roper region are 0.25 and 0.67 respectively.
The Roper is one of 13 regions which cover the three divisions studied in this project. Mean annual rainfall and runoff, as
well as coefficients of variation, have been calculated for all of these 13 regions, and it is useful to compare the Roper
results to results across all 13 regions. Across all 13 regions in this project 10th percentile, median and 90th percentile
values are 1371, 936 and 595 mm respectively for mean annual rainfall and 374, 153 and 78 mm respectively for mean
annual runoff. The mean annual rainfall (839 mm) and runoff (112 mm) averaged over the Roper region fall in the mid to
lower end of this range. Across all 13 regions in this project the 10th percentile, median and 90th percentile values are
0.34, 0.26 and 0.19 respectively for the coefficient of variation of annual rainfall and 1.39, 0.69 and 0.48 for the
coefficient of variation of runoff. The coefficients of variation of annual rainfall (0.25) and runoff (0.67) averaged over the
Roper region are in the middle of the range of the 13 reporting regions.
(a) (b)
Figure RO-34. Spatial distribution of mean annual (a) rainfall and (b) modelled runoff across the Roper region under Scenario A

© CSIRO 2009 August 2009 Water in the Roper region ▪ 111
RO
-3 W
aterbalance
resultsfor
theR
operregion
0
400
800
1200
1600
1 21 41 61 77
Water year
Ann
ual r
ainf
all (
mm
)...
0
100
200
300
400
1 21 41 61 77
Water year
Ann
ual r
unof
f (m
m) ..
.
Figure RO-35. Annual (a) rainfall and (b) modelled runoff in the Roper region under Scenario A
Figure RO-36(a,b) shows the minimum and maximum monthly rainfall and runoff and the range of values between the
25th and 75th percentile monthly rainfall and runoff. Figure RO-36(c,d) shows the mean and median monthly flows and
the range of values between the 25th and 75th percentile monthly rainfall and runoff. The large difference in the mean and
median wet season monthly runoff values indicates that the distribution of monthly runoff in the Roper region is highly
skewed.
(a) (b)
0
175
350
525
700
J F M A M J J A S O N D
Mon
thly
rai
nfal
l (m
m) ...
A Range
A Min
A Max
0
50
100
150
200
J F M A M J J A S O N D
Mon
thly
run
off (
mm
) ...
A Range
A Min
A Max
(c) (d)
0
70
140
210
280
J F M A M J J A S O N D
Mon
thly
rai
nfal
l (m
m) ...
A Range
A Mean
A Median
0
15
30
45
60
J F M A M J J A S O N D
Mon
thly
run
off (
mm
) ...
A Range
A Mean
A Median
Figure RO-36. Minimum, maximum and A range monthly (a) rainfall and (b) modelled runoff; and mean, median and A range monthly (c)
rainfall and (d) modelled runoff in the Roper region under Scenario A (A range is the 25th to 75th percentile monthly rainfall or runoff)
(a) (b)
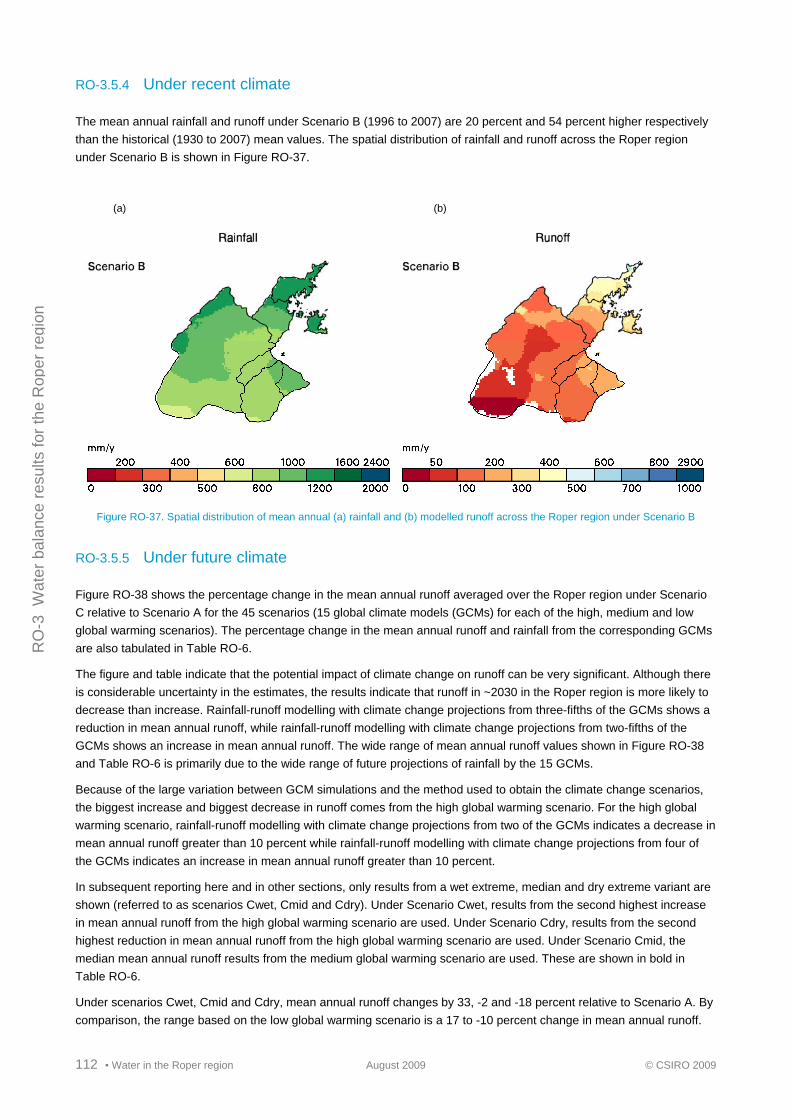
112 ▪ Water in the Roper region August 2009 © CSIRO 2009
RO
-3
Wat
er b
alan
ce r
esul
ts f
or th
e R
oper
reg
ion
RO-3.5.4 Under recent climate
The mean annual rainfall and runoff under Scenario B (1996 to 2007) are 20 percent and 54 percent higher respectively
than the historical (1930 to 2007) mean values. The spatial distribution of rainfall and runoff across the Roper region
under Scenario B is shown in Figure RO-37.
(a) (b)
Figure RO-37. Spatial distribution of mean annual (a) rainfall and (b) modelled runoff across the Roper region under Scenario B
RO-3.5.5 Under future climate
Figure RO-38 shows the percentage change in the mean annual runoff averaged over the Roper region under Scenario
C relative to Scenario A for the 45 scenarios (15 global climate models (GCMs) for each of the high, medium and low
global warming scenarios). The percentage change in the mean annual runoff and rainfall from the corresponding GCMs
are also tabulated in Table RO-6.
The figure and table indicate that the potential impact of climate change on runoff can be very significant. Although there
is considerable uncertainty in the estimates, the results indicate that runoff in ~2030 in the Roper region is more likely to
decrease than increase. Rainfall-runoff modelling with climate change projections from three-fifths of the GCMs shows a
reduction in mean annual runoff, while rainfall-runoff modelling with climate change projections from two-fifths of the
GCMs shows an increase in mean annual runoff. The wide range of mean annual runoff values shown in Figure RO-38
and Table RO-6 is primarily due to the wide range of future projections of rainfall by the 15 GCMs.
Because of the large variation between GCM simulations and the method used to obtain the climate change scenarios,
the biggest increase and biggest decrease in runoff comes from the high global warming scenario. For the high global
warming scenario, rainfall-runoff modelling with climate change projections from two of the GCMs indicates a decrease in
mean annual runoff greater than 10 percent while rainfall-runoff modelling with climate change projections from four of
the GCMs indicates an increase in mean annual runoff greater than 10 percent.
In subsequent reporting here and in other sections, only results from a wet extreme, median and dry extreme variant are
shown (referred to as scenarios Cwet, Cmid and Cdry). Under Scenario Cwet, results from the second highest increase
in mean annual runoff from the high global warming scenario are used. Under Scenario Cdry, results from the second
highest reduction in mean annual runoff from the high global warming scenario are used. Under Scenario Cmid, the
median mean annual runoff results from the medium global warming scenario are used. These are shown in bold in
Table RO-6.
Under scenarios Cwet, Cmid and Cdry, mean annual runoff changes by 33, -2 and -18 percent relative to Scenario A. By
comparison, the range based on the low global warming scenario is a 17 to -10 percent change in mean annual runoff.

© CSIRO 2009 August 2009 Water in the Roper region ▪ 113
RO
-3 W
aterbalance
resultsfor
theR
operregion
Figure RO-39 shows the mean annual runoff across the Roper region under scenarios A and C. The linear discontinuities
that are evident in Figure RO-39 are due to GCM grid cell boundaries.
-40
-20
0
20
40
csiro m
ri
giss
_aom gf
dl
inm
cmcn
rm ipsl
mpi ia
p
ncar
_ccsm
miro
cm
iub
ncar
_pcm
cccm
a_t4
7
cccm
a_t6
3
% c
hang
e in
mea
n an
nual
run
off ..
.
High global warming
Medium global warming
Low global warming
Figure RO-38. Percentage change in mean annual modelled runoff under the 45 Scenario C variants (15 global climate models and
three global warming scenarios) relative to Scenario A
Table RO-6. Summary results under the 45 Scenario C simulations for the modelling subcatchments in the Roper region (numbers show
percentage change in mean annual rainfall and modelled runoff under Scenario C relative to Scenario A)
High global warming Medium global warming Low global warming
GCM Rainfall Runoff GCM Rainfall Runoff GCM Rainfall Runoff
csiro -14% -29% csiro -11% -23% csiro -8% -17%
mri -6% -18% mri -5% -14% mri -3% -10%
giss_aom -4% -9% gfdl -7% -7% gfdl -5% -5%
gfdl -10% -9% giss_aom -3% -7% giss_aom -2% -5%
inmcm 0% -7% inmcm 0% -5% inmcm 0% -4%
cnrm 0% -5% cnrm 0% -4% cnrm 0% -3%
ipsl -1% -5% ipsl -1% -4% ipsl 0% -3%
mpi 0% -2% mpi 0% -2% mpi 0% -1%
iap -2% -1% iap -2% -1% iap -1% 0%
ncar_ccsm 5% 7% ncar_ccsm 4% 5% ncar_ccsm 3% 4%
miroc 4% 8% miroc 3% 6% miroc 2% 4%
miub 4% 14% miub 3% 11% miub 2% 7%
ncar_pcm 9% 16% ncar_pcm 7% 12% ncar_pcm 5% 8%
cccma_t47 11% 33% cccma_t47 8% 25% cccma_t47 6% 17%
cccma_t63 10% 35% cccma_t63 8% 26% cccma_t63 6% 18%

114 ▪ Water in the Roper region August 2009 © CSIRO 2009
RO
-3
Wat
er b
alan
ce r
esul
ts f
or th
e R
oper
reg
ion
Figure RO-39. Spatial distribution of mean annual rainfall and modelled runoff across the Roper region under Scenario A and under
Scenario C relative to Scenario A

© CSIRO 2009 August 2009 Water in the Roper region ▪ 115
RO
-3 W
aterbalance
resultsfor
theR
operregion
RO-3.5.6 Summary results for all scenarios
Table RO-7 shows the mean annual rainfall, runoff and actual evapotranspiration under Scenario A averaged over the
Roper region, and the percentage changes in the rainfall, runoff and actual evapotranspiration under scenarios B and C
relative to Scenario A. The Cwet, Cmid and Cdry results are based on the mean annual runoff, and the rainfall changes
shown in Table RO-7 are the changes in the mean annual value of the rainfall series used to obtain the runoff under
scenarios Cwet, Cmid and Cdry. The changes in mean annual rainfall do not necessarily translate directly to the changes
in mean annual runoff because of changes in seasonal and daily rainfall distributions and the relationship between
rainfall and runoff is non-linear. The latter factor usually results in small changes in rainfall to be amplified in runoff (Table
RO-6).
Figure RO-40 shows the mean monthly rainfall and runoff under scenarios A and C averaged over 1930 to 2007 for the
region. Figure RO-41 shows the daily rainfall and flow duration curves under scenarios A and C averaged over the region.
Figure RO-41 shows that the daily flow characteristic curve for Scenario B is greater than C range. In Figure RO-40 Cwet,
Cmid and Cdry are selected on a month-by-month basis, while in Figure RO-41 Cwet, Cmid and Cdry are selected for
every day of the daily flow exceedance curve.
Table RO-7. Water balance over the entire Roper region under Scenario A and under scenarios B and C relative to Scenario A
Scenario Rainfall Runoff Evapotranspiration
mm
A 839 112 727
percent change from Scenario A
B 21% 54% 16%
Cwet 11% 33% 7%
Cmid 0% -2% 0%
Cdry -6% -18% -4%
0
60
120
180
240
J F M A M J J A S O N D
Mea
n m
onth
ly r
ainf
all (
mm
) ..
. C range
Cmid
A
0
15
30
45
60
J F M A M J J A S O N D
Mea
n m
onth
ly r
unof
f (m
m)
...
C range
Cmid
A
Figure RO-40. Mean monthly (a) rainfall and (b) modelled runoff in the Roper region under scenarios A and C (C range is based on the
consideration of each rainfall and runoff percentile separately – the lower and upper limits in C range are therefore not the same as
scenarios Cdry and Cwet)
(a) (b)

116 ▪ Water in the Roper region August 2009 © CSIRO 2009
RO
-3
Wat
er b
alan
ce r
esul
ts f
or th
e R
oper
reg
ion
0
13
26
39
52
0% 25% 50% 75%Percent of time equalled or exceeded
Dai
ly r
ainf
all (
mm
) ..
. C rangeCmidBA
0
3
6
9
12
0% 25% 50% 75%Percent of time equalled or exceeded
Dai
ly r
unof
fl (m
m) ... C range
CmidBA
Figure RO-41. Daily flow exceedance curves for (a) rainfall and (b) modelled runoff in the Roper region under scenarios A, B and C (C
range is based on the consideration of each rainfall and runoff percentile separately – the lower and upper limits in C range are
therefore not the same as scenarios Cdry and Cwet)
RO-3.5.7 Confidence levels
The level of confidence of the runoff estimates for the Roper region is low because there are few catchments with high
quality gauging station data. NSE values for monthly runoff and daily flow duration curve characteristic are low relative to
other regions. This may be due to a combination of factors, including poor rainfall records in the region (Figure RO-5),
gauging stations may be sited in ‘open systems’ (i.e. flow may bypass the gauge), and variable quality streamflow
records due to the difficulty of operating and maintaining stations in remote areas. Low flow records from areas of
carbonate rock can be affected by the formation of Tufa dams. This appears to be the case at several stations within the
Roper (e.g. 9030176 and G9030013) and this further reduces the level of confidence in the dry season flow calibrations
at these sites.
The rainfall-runoff model verification analysis with data from 123 catchments from across all of northern Australia
indicates that the mean annual runoff for ungauged catchments are under estimated or over estimated, when using
optimised parameter values from a nearby catchment, by less than 20 percent in 40 percent of catchments and by less
than 50 percent in 80 percent of the catchments.
Transposing parameter sets in the Roper region is problematic because of the distances between donor and target
subcatchments and some areas of the Roper have complex surface–groundwater interactions. Consequently there is a
low level of confidence associated with predictions of runoff in ungauged subcatchments in the Roper region. No gauges
are sited on the coastal area of the Roper and parameter sets for these regions were donated from far away calibration
catchments. Extrapolating runoff values recorded at gauging stations to the broader Roper region is confounded by
problems of bias, with a disproportionate number of stations sited within or downstream of areas of productive aquifer
systems (Figure RO-7). There is also considerable uncertainty about catchment areas as there are distributary channels
and sinkholes in the upper reaches. Diagrams in (Petheram, 2009) illustrate which calibrated rainfall-runoff model
parameter sets are used to model streamflow in which ungauged subcatchments in the Roper region.
Figure RO-42 illustrates the level of confidence in modelling the mid to high runoff events (i.e. peak flows) and dry
season runoff (respectively) for the subcatchments of the Roper region. It should be noted that these maps of level of
confidence are not statistical confidence levels and are intended to only convey a broad reliability of prediction. Except in
three small calibration catchments in the north-west, there is a low level of confidence associated with gridded
predictions for mid to high and dry season runoff events in the Roper region. The level of confidence in streamflow
predictions will vary slightly from the level of confidence in runoff predictions shown below and as discussed in Section
2.2.6 of the division-level Chapter 2.
There is a high degree of confidence that dry season runoff in the Roper region is low because it is known that rainfall
and baseflow are low during the dry season. The map of level of confidence for dry season flow shown in Figure RO-42
provides a relative indication of how well dry season metrics, such as cease-to-flow, are simulated.
In summary the level of confidence in the long-term average monthly and annual results for the Roper region are low
relative to other regions in this study. As shown in Figure RO-42, in many areas of the Roper region localised studies will
(a) (b)

© CSIRO 2009 August 2009 Water in the Roper region ▪ 117
RO
-3 W
aterbalance
resultsfor
theR
operregion
require more detailed analysis than undertaken and reported here and would most likely require the site to be visited and
additional field measurements made.
Figure RO-42. Level of confidence in the modelling of runoff for (a) mid- to high flow events and (b) monthly dry season flow events for
the modelling subcatchments of the Roper region. 1 is the highest level of confidence, 5 is the lowest

118 ▪ Water in the Roper region August 2009 © CSIRO 2009
RO
-3
Wat
er b
alan
ce r
esul
ts f
or th
e R
oper
reg
ion
RO-3.6 River system water balance
The Roper region is comprised of seven AWRC river basins and has an area of 128,518 km2. Under the historical
climate the mean annual runoff across the region is 112 mm (Section RO-3.5.3), which equates to a mean annual
streamflow across the region of 14,394 GL.
No information on infrastructure, water demand, water management, sharing rules or future development were available,
and consequently there is no river modelling section to the Roper region report. Streamflow time series have been
generated for each streamflow reporting node (SRN) based on the upstream grid cell rainfall-runoff simulations, as
described in Section 2.2.5 of the division-level Chapter 2. The locations of these nodes are shown in Figure RO-43.
Summary streamflow statistics for each SRN are reported in (Petheram, 2009). In addition to the streamflow time series
generated by the rainfall-runoff model ensemble, a range of hydrological metrics computed using regression analysis are
also available for each SRN (as described in Section 2.2.7 of the division-level Chapter 2). The complete set of results
for the multiple regression analysis is reported in SKM (2009). The merit of each approach is discussed in Section 2.2.7
of the division-level Chapter 2.
Figure RO-43. Map of streamflow reporting nodes (gauging stations, environmental sites, dummy nodes and storage inflows) in the
Roper region. (No storage inflows are reported for this region)
© CSIRO 2009 August 2009 Water in the Roper region ▪ 119
RO
-3 W
aterbalance
resultsfor
theR
operregion
RO-3.7 Changes to flow regimes at environmental assets
Section 1.3 of the division-level Chapter 1 describes how environmental assets were shortlisted for assessment by this
project. Two environmental assets have been shortlisted in the Roper region: Limmen Bight (Port Roper) Tidal Wetlands
System and Mataranka Thermal Pools. The locations of these assets is shown in Figure RO-1 and the assets are
characterised in Chapter RO-2.
This section presents the assessment of these shortlisted assets and reports metrics for those assets which have
sufficient confidence in the modelled streamflow to enable analysis. Confidence in results for low flows and high flows
was calculated separately on a scale of 1 to 5, with 1 indicating results with the highest confidence (as described in
Section 2.2.6 of the division-level Chapter 2). Hydrological regime metrics (as defined in Section 2.5 of the division-level
Chapter 2) for either low flows or high flows are reported only where confidence levels are 1, 2 or 3. If confidence levels
in the low flows or high flows are ranked 4 or 5, results are not reported and are labelled NR (not reported).
Some of the assets in this region have multiple nodes at which streamflow modelling results are available. When
reporting hydrological regime metrics for such assets a single node was selected. The selected node was that with the
highest streamflow confidence level and the largest proportion of streamflow to the asset. Results for all nodes are
presented in (McJannet et al., 2009).
In the absence of site-specific metrics for the Roper region a set of standard metrics related to high and low flows have
been utilised. However the conversion of these metrics into environmental impacts still requires development of
quantitative relationships between flow and ecology.
RO-3.7.1 Standard metrics
Limmen Bight (Port Roper) Tidal Wetlands System
The surface water flow confidence levels for both high and low flows for this asset within the Roper region (see location
on Figure RO-9) are ranked unreliable (4 or 5); therefore model data are of insufficient quality to allow environmental flow
metrics to be calculated.
Mataranka Thermal Pools
The Mataranka Thermal Pools (see location on Figure RO-10) are fed by perennial groundwater springs in the upper
reaches of the Roper River however there is currently not enough confidence in existing groundwater models to report
and results for different scenarios. In addition, the surface water flow confidence levels for both high and low flows for the
asset within the Roper region are ranked unreliable (4 or 5); therefore model data are of insufficient quality to allow
environmental flow metrics to be calculated.
120 ▪ Water in the Roper region August 2009 © CSIRO 2009
RO
-3
Wat
er b
alan
ce r
esul
ts f
or th
e R
oper
reg
ion
RO-3.8 References
Crosbie RS, McCallum JL, Walker GR and Chiew FHS (2008) Diffuse groundwater recharge modelling across the Murray-Darling basin. A report to the Australian Government from the CSIRO Murray-Darling Basin Sustainable Yields Project. CSIRO, Australia. 108pp.
Hutley LB, O’Grady AP and Eamus D (2001) Monsoonal influences on evapotranspiration of savanna vegetation of northern Australia Oecologia (2001) 126:434–443. Springer-Verlag 2001
Jackson L and Jolly P (2004) Prediction of Springflows at G8110307 on the Wickham River for the Period 1885 to 2003. Natural Systems Division, Department of Infrastructure Planning and Environment, Report No. WRD04006. Darwin
Jolly P, George D, Jolly I and Spiers Z (2000a) Analysis of Groundwater Fed Flows for the Flora, Katherine, Douglas and Daly Rivers WRD00036, Natural Resources Division, Department of Lands, Planning and Environment, Report WRD00036
Jolly P, Sutcliffe E and Jolly I (2000b) Prediction of Springflows at GS 8150027 on Berry Creek for the Period 1870 to 1999. Report No. WRD00023, Department of Lands, Planning and Environment, Darwin
Knapton A (2006) Regional groundwater modelling of the Cambrian limestone aquifer system of the Wiso Basin, Georgina and Daly Basin. Report WRD06029. Department of Infrastructure, Planning and Environment. Darwin
McJannet DL, Wallace JW, Henderson A and McMahon J (2009) High and low flow regime changes at environmental assets across northern Australia under future climate and development scenarios. A report to the Australian Government from the CSIRO Northern Australian Sustainable Yields Project. CSIRO Water for a Healthy Country Flagship, CSIRO, Australia. In prep.
Petheram C, Rustomji P and Vleeshouwer J (2009) Rainfall-runoff modelling across northern Australia. A report to the Australian Government from the CSIRO Northern Australian Sustainable Yields Project. CSIRO Water for a Healthy Country Flagship, CSIRO, Australia. In prep.
SKM (2009) Regionalisation of hydrologic indices. Northern Australia sustainable yields. A report prepared by Sinclair Knight Merz for the CSIRO Northern Australia Sustainable Yields project. SKM, Melbourne. 183pp.
Zhang L and Dawes W (1998) WAVES - An integrated energy and water balance model. Technical Report No. 31/98, CSIRO Land and Water.


Web: www.csiro.au/flagships
For further information:
Water for a Healthy Country Flagship Project LeaderDr Richard CresswellPhone: 07 3214 2767Email: [email protected]: www.csiro.au/partnerships/NASY
Northern Australia Water Futures Assessment Department of the Environment, Water, Heritage and the Arts Phone: 02 6274 1111 Email: [email protected] Web: http://www.environment.gov.au/nawfa
About the project
The Northern Australia Sustainable Yields (NASY) Project has assessed the water resources of northern Australia. The project modelled and quantified, within the limits of available data, the changes to water resources under four scenarios: historical climate; recent climate; future climate considering current water use and future climate with potential future water demand. The project identified regions that may come under increased, or decreased, stress due to climate change and increased water use.
The assessments made in this project provide key information for further investigations carried out through the Australian Government’s Northern Australia Water Futures Assessment. This initiative aims to develop a knowledge base so that any development proceeds in an ecologically, culturally and economically sustainable way.
The NASY project was commissioned by the National Water Commission in consultation with the Australian Government Department of the Environment, Water, Heritage and the Arts. This followed a March 2008 agreement by the Council of Australian Governments to undertake comprehensive scientific assessments of water yield in all major water systems across the country and provide a consistent analytical framework for water policy decisions across the nation. CSIRO is also undertaking assessments in south-west Western Australia and Tasmania.
The NASY project was reviewed by a Steering Committee and a Technical Reference Panel. Both include representation from federal and state governments, as well as independent experts.