growth and sustainability in the 21st century
TRANSCRIPT
Global Development And Environment InstituteTufts University
Medford, MA 02155http://ase.tufts.edu/gdae
A GDAE Teaching Module on Social and Environmental Issues in Economics
By Jonathan M. Harris, Brian Roach, Pratistha Joshi Rajkarnikar, and Neva Goodwin
Growth and Sustainability in the Twenty-First Century

This reading is based on portions of Chapter 18 from: Macroeconomics in Context, Third Edition. Copyright Routledge, 2019. Copyright © 2019 Global Development And Environment Institute, Tufts University. Reproduced by permission. Copyright release is hereby granted for instructors to copy this module for instructional purposes. Students may also download the reading directly from https://ase.tufts.edu/gdae Comments and feedback from course use are welcomed: Global Development And Environment Institute Tufts University Somerville, MA 02144 http://ase.tufts.edu/gdae E-mail: [email protected]
NOTE – terms denoted in bold face are defined in the KEY TERMS AND CONCEPTS section at the end of the module.

GROWTH AND SUSTAINABILITY IN THE TWENTY-FIRST CENTURY
3
TABLE OF CONTENTS
1. INTRODUCTION ...................................................................................................... 4 2. MACROECONOMICS AND SUSTAINABILITY ................................................. 4 3. MAJOR ENVIRONMENTAL ISSUES ................................................................... 8 3.1 Global Production ............................................................................................................. 8 3.2 Non-renewable Resource Availability .............................................................................. 9 3.3 Renewable Resources ..................................................................................................... 10
Forests ......................................................................................................................... 11 Fisheries ...................................................................................................................... 11 Freshwater ................................................................................................................... 11 Soils ............................................................................................................................. 12 Biodiversity .................................................................................................................. 12
3.4 Pollution and Waste ........................................................................................................ 12
4. CLIMATE CHANGE .............................................................................................. 14 4.1 Climate Change Science, Data, and Impacts .................................................................. 14 4.2 The Economics of Climate Change ................................................................................ 16 4.3 Climate Change Policy ................................................................................................... 18
5. ECONOMIC GROWTH AND THE ENVIRONMENT ...................................... 21 5.1 The Environmental Kuznets Curve Hypothesis .............................................................. 21 5.2 Does Protecting the Environment Harm Employment and Economic Growth? ............ 23 5.3 Economic Perspectives on the Transition to a Sustainable Economy ............................ 25
6. POLICIES FOR SUSTAINABLE DEVELOPMENT .......................................... 28 6.1 Rethinking Employment and Production ........................................................................ 28 6.2 Rethinking Economic Incentives .................................................................................... 29
Green Taxes ................................................................................................................ 29 Eliminating Damaging Subsidies ................................................................................ 31
6.3 Green Keynesianism ........................................................................................................... 31
7. CONCLUDING THOUGHTS ................................................................................ 32 KEY TERMS AND CONCEPTS ................................................................................... 34 REFERENCES ................................................................................................................ 35 DISCUSSION QUESTIONS .......................................................................................... 39

GROWTH AND SUSTAINABILITY IN THE TWENTY-FIRST CENTURY
4
1. INTRODUCTION Over the last 50 years the size of the world economy, as measured by global GDP, has increased by a factor of five, even after adjusting for inflation. Global economic growth over this period has averaged about 3.3 percent real growth per year. Recent projections indicate that global economic growth will slow somewhat over the next 50 years, to between 2 and 3 percent, mainly due to slower population growth rates and longer life expectancies that reduce the share of the working-age population. But even with a 2 percent rate of real growth, the world economy would expand by a further factor of 2.7 over 50 years, and more than sevenfold over 100 years.1 While future economic expansion will surely increase human well-being in many ways, particularly for the nearly one billion people living in absolute poverty, it is important to address the question of whether such continued growth is environmentally sustainable. In this module we consider the relationship between the global macroeconomy and the environment. We explore whether environmental factors, including the availability of natural resources and the ability of ecosystems to assimilate wastes, pose a constraint to future economic growth. How do we assess potential tradeoffs between economic growth and environmental sustainability? How much future economic growth is actually desirable? And what policies are needed, nationally and internationally, to transition to a future that is both environmentally sustainable and allows all people to achieve high levels of well-being? 2. MACROECONOMICS AND SUSTAINABILITY
Debate over the ability of the earth’s resources to sustain human populations can be traced back to 1798, when the British scholar Thomas Malthus wrote An Essay on the Principle of Population. Malthus predicted that unchecked human population growth would eventually outpace the growth in agricultural production, leading to widespread food scarcity and a resulting population crash. Malthus’ prediction turned out to be inaccurate; technological advances during the Industrial Revolution contributed to a significant increase in food production in the 19th century. Similar dire predictions were common in the 1960s and 1970s. For example, Paul Ehrlich’s 1968 book The Population Bomb foretold massive famines in the 1970s and 1980s due to overpopulation. The Limits to Growth, published in 1972, used computer modeling to conclude that without significant changes humanity would suffer from a significant decline in population and economic output in the 21st century due to excessive pollution and resource depletion. Other analyses focused on the limited supply of oil as the factor that would cause a major economic decline.2 So far these predictions have also not come true. Economic growth, energy consumption, and food production have all outpaced population growth in recent decades, as shown in Figure 1. Higher per capita GDP, food and energy consumption, imply increased well-being. However, GDP fails to measure well-being in important ways. Similarly, the data in Figure 1 fail to show the unequal
1 World Bank’s World Development Indicators database; OECD, 2012; Manyika et al., 2015. 2 See, for example, Ruppert, 2009.

GROWTH AND SUSTAINABILITY IN THE TWENTY-FIRST CENTURY
5
distribution of many natural and economic resources, or the environmental impacts of increased economic activity. An increase in real GDP per capita might not produce an increase in average well-being if it is associated with greater inequality, pollution, and natural resource depletion.
Figure 1. Global Growth in Population, Food Production, Economic Production, and Energy Consumption, 1965-2016
Source: World Bank, World Development Indicators Database; BP, 2017. Notes: GWP is gross world product. Global food production index not available for 2015 and 2016.
One alternative indicator is the Genuine Progress Indicator (GPI). A 2013 analysis estimated both global GDP/capita and global GPI/ capita for the years 1950–2005. In real terms, GDP/capita increased by a factor of three during this period. Meanwhile, GPI/capita doubled from 1950 to the mid-1970s, but then essentially levelled off for the next 30 years.3 So while people are clearly, on average, better off economically than they were in the 1970s, it remains unclear whether human welfare has increased in recent decades when we consider a broader range of measures including pollution and natural resource degradation. The macroeconomy exists within a broader environmental context. Some economists, most notably Herman Daly, have emphasized that while the macroeconomy continually expands, the earth’s biosphere, which provides resources and assimilates wastes and pollution, does not grow. Daly writes:
[T]he economy is a subsystem of the finite biosphere that supports it. When the economy’s expansion encroaches too much on its surrounding ecosystem, we will begin to sacrifice natural capital (such as fish, minerals and fossil fuels) that is worth more than the man-made capital (such as roads, factories and appliances)
3 Kubiszewski et al., 2013.

GROWTH AND SUSTAINABILITY IN THE TWENTY-FIRST CENTURY
6
added by the growth. We will then have what I call uneconomic growth, producing “bads” faster than goods – making us poorer, not richer.4
A determination of whether growth is “economic” or “uneconomic” can potentially be made by comparing the value of lost natural capital to the value of additional produced capital. Green GDP attempts to do this by monetizing the loss of natural capital and deducting it from GDP. Estimating all environmental impacts in monetary terms, however, is likely infeasible, and depends upon numerous normative assumptions. Even if national accounting metrics such as the GPI and Green GDP are increasing, suggesting that increases in traditional economic production are more than offsetting the value of lost natural capital, this may be a short run phenomenon. It doesn’t necessarily mean that an economy can be considered ecologically sustainable in the long term. In addition, we need to consider what it means to be “sustainable.” Economists have different views on this. One economic perspective on sustainability, referred to as weak sustainability, assumes that natural capital and other types of capital (produced, human, or social) are substitutes. Thus, weak sustainability asserts that natural capital depreciation is justified as long as it is compensated for with adequate increases in other types of capital. So, for example, the destruction of a wetland in order to construct a new highway would be justified if the economic benefits of the highway exceeded the lost ecological value of the wetland. Strong sustainability takes the perspective that sustainability should be defined solely in terms of natural capital. Under strong sustainability, natural and other types of capital are not substitutes. Strong sustainability doesn’t mean that natural capital can never be degraded, but it requires that any degradation of a particular type of natural capital (such as the cutting of a forest for timber) be compensated for with appropriate natural capital restoration (such as replanting trees or restoring a wetland). Strong sustainability isn’t necessarily “better” than weak sustainability, but it changes the metrics we would use to determine whether an economy is sustainable. For weak sustainability, we could use a metric such as the GPI or Green GPI which allows a direct comparison of natural capital with other types of capital, measured in monetary units. But if our objective was to pursue strong sustainability, we would use satellite accounts that assess the levels of various types of natural capital, such as a forest account, a greenhouse gas emissions account, etc. One variant of strong sustainability would seek to maintain the overall aggregate value of natural capital in a society. This would require a metric that would allow different types of natural capital to be compared, which could use monetary values, but could also be non-monetary, based on the biological productivity of different ecosystems or the views of scientific experts.5 Another variant of strong sustainability would seek to maintain the levels of individual types of natural capital, such as total forest cover, fish stock biomass, air quality, etc. This suggests using physical metrics, such as the volume of timber or the concentration of air pollutants, to measure progress toward sustainability.
4 Daly, 2005, p. 100. 5 See, for example, Kelemen et al., 2016.

GROWTH AND SUSTAINABILITY IN THE TWENTY-FIRST CENTURY
7
Any attempt to monitor sustainability efforts should recognize that the biosphere is ultimately finite, as indicated in the Daly quote above. Yet another perspective on sustainability considers whether the overall scale of human environmental impacts is within the carrying capacity of the planet. This approach measures the human ecological footprint, which estimates the amount of biologically productive land that is required, both to supply the natural resources a society uses and to assimilate the waste and pollution that results from economic activity. This is then compared with the amount of productive land available to the society, to determine whether impacts are within sustainable levels. Measuring some environmental impacts in land area units (acres or hectares) is rather straightforward, such as the amount of land needed to grow crops or provide forestry products. Converting other impacts to a land area measure is less obvious. For example, carbon emissions are quantified in the ecological footprint measure as the land area of vegetation that would be needed to absorb a given amount of carbon.6 While the ecological footprint is subject to methodological critiques,7 it provides a comprehensive measure to determine whether a nation, or all of humanity, is within ecologically sustainable limits. The global ecological footprint over time is presented in Figure 2. As only one earth is available to provide resources and assimilate wastes, we see that humanity reached a situation of “overshoot” starting around 1970. Currently, human impacts are exceeding the carrying capacity of the earth by more than 60 percent.
Figure 2. Global Ecological Footprint, by Impact Type, 1965-2013
Source: Global Footprint Network Public Data Set, https://www.footprintnetwork.org/resources/ data/.
6 See Lin et al., 2016, for a description of the ecological footprint calculations. 7 See, for example, Giampietro and Saltelli, 2014.

GROWTH AND SUSTAINABILITY IN THE TWENTY-FIRST CENTURY
8
Disaggregating the impacts, we observe that about 60 percent of humanity’s ecological footprint is attributed to its carbon emissions. In order to bring the global system back to overall sustainability, carbon emissions would need to decline by 70 percent or more (as suggested by many scientists) to bring the total human ecological footprint back below the “one earth” level.8 Other human impacts on the environment, such as agriculture, forestry, and fisheries, while not so dramatic in absolute scale, may not be effectively captured simply by looking at the total land use required. In order to evaluate specific human impacts on the global environment, in the next section we turn to a discussion of several major environmental issues. 3. MAJOR ENVIRONMENTAL ISSUES A number of environmental issues are closely related to macroeconomic growth and well-being at the national and international level. In this section we summarize the data and the policy challenges for four major environmental issues: 1. Global population 2. Non-renewable resource availability 3. Renewable resources 4. Pollution and wastes Then in the next section we focus on the central global issue of climate change. 3.1 Global Production Economic and technological growth since the Industrial Revolution has fostered a dramatic increase in world population. Global population was approximately 1 billion in 1800, doubled to 2 billion by 1930 and reached 3 billion in 1960. Over the next 40 years it doubled again, reaching 6 billion by 2000. As of 2018 it had reached 7.6 billion. Human population growth contributes to many environmental pressures—a larger total population creates a greater demand for food production, and also translates to higher rates of resource depletion and more waste generation for a given level of technology. As mentioned previously, intensification of food production so far has kept pace with population growth. The expanded scale of agricultural production, however, has led to significant costs in terms of land degradation, pollution from fertilizers and pesticides, and overtaxing of water supplies. Although population growth rates have declined from 2.1 percent annually in the 1960s to approximately 1 percent today, the human population is still increasing by about 80 million people per year, equivalent to the population of Germany. The United Nations’ global population projection published in 2017 indicates that the global population will increase to nearly 10 billion by 2050, and to more than 11 billion in 2100, according to their “medium-variant” projection (see Figure 3). The vast majority of population growth is expected to occur in developing countries, particularly in Africa.
8 See, for example, Fischer, 2009.

GROWTH AND SUSTAINABILITY IN THE TWENTY-FIRST CENTURY
9
Figure 3 shows, however, that there is considerable uncertainty in projecting population during the 21st century. Under the UN’s high-variant projection, the global population reaches more than 16 billion by 2100. Under the low-variant projection, the global population peaks at 8.8 billion around 2050, and by 2100 is lower than it is today. The differences across variants are due to different assumptions about how quickly and how far fertility rates will decline during the 21st century. Declining population growth rates can be attributed to numerous factors including the widespread availability of birth control, higher costs associated with raising children, and, perhaps most importantly, a focus on educating girls. When women are educated and have employment opportunities, the opportunity cost of having children rises, leading to lower fertility rates (i.e., the average number of children per woman). Obviously, humanity’s environmental impacts will be quite different in 2100 if only 7 billion humans are on the planet as opposed to 16 billion. Thus, the potential for a sustainable future may hinge upon what will happen to fertility rates around the world in the coming decades. Historical evidence generally suggests that the United Nations has underestimated how quickly fertility rates have fallen. One assumption that has been questioned for the medium-variant estimate in Figure 3 is that fertility rates will increase slightly for many developed nations, although so far this has not occurred. An independent projection that places greater emphasis on the potential for education to lower fertility rates concludes that the human population will peak at around 9.4 billion in 2070 and then steadily decline.9 Figure 3. United Nations Global Population Projections, 2020-2100
Source: United Nations, World Population Prospects 2017. 3.2 Non-renewable Resource Availability
Depletion of important natural resources has typically accompanied economic growth. Non-renewable resources are those resources that do not regenerate through natural processes, at least 9 Duncan and Wilson, 2004; Worstall, 2017; IIASA, 2014.

GROWTH AND SUSTAINABILITY IN THE TWENTY-FIRST CENTURY
10
on a human time scale, such as oil, coal, and mineral ores. While the global physical stock of a non-renewable resource is a fixed quantity, known reserves fluctuate as some resources are extracted while new reserves are discovered. Also, changes in technology and prices can determine whether particular reserves are economically viable to exploit. Global stocks of key mineral resources, such as aluminum and copper, are for the most part not close to exhaustion, but as high-quality reserves are depleted recovery of lower-quality reserves tends to involve higher energy and environmental costs.10 The environmental impacts of mining include pollution of rivers and lakes from mine runoff and air pollution from the processing of mineral ores. There are also significant social impacts, especially in developing countries, where poorer and indigenous communities may be devastated by these activities. Factors that could contribute to the risk of disruptions in the supply of important minerals include the depletion of some physical stocks, the limited availability of substitutes, limits on the known possibilities for recycling, and overdependence on supplies from politically unstable countries. According to a 2015 analysis, the minerals with the greatest risk of global supply disruption include rare earth elements (mainly used in electronics), antimony (used in batteries and flame retardants), and bismuth (used in fuses and cosmetics).11 Global reserves of oil and natural gas are sufficient for over 50 years of supply at current consumption rates; and coal reserves for more than 100 years of supply. Despite increasing consumption rates, known reserves of fossil fuels have actually been increasing in recent decades due to new discoveries and expanded recovery technologies. For example, known global oil reserves at the end of 2016 were about 50 percent higher than they were in the mid-1990s.12 Thus, the evidence indicates that we will not exhaust the physical stock of fossil fuels in the foreseeable future. While the availability of fossil fuels does not appear to be a constraint on economic development, their environmental impacts are extensive. The extraction of fossil fuels can cause significant local environmental damage, particularly as production shifts toward “unconventional” sources of oil and gas obtained through hydraulic fracturing or “fracking.” The burning of fossil fuels has led to severe health damages from pollution in rapidly developing countries such as India and China as well as in coal-dependent areas such as Eastern Europe. An even greater concern is the impact of fossil fuel emissions on climate change. We will consider both of these impacts in this module. 3.3 Renewable Resources Renewable resources such as forests, fisheries, freshwater, and soil are regenerated over time through natural and biological processes. If renewable resources are used by humans at rates below the natural rate of regeneration, then sustained availability is possible. Excessive rates of use, however, can lead to depletion or degradation of renewable resources. For example, overfishing can rapidly deplete fish stocks, possibly causing their complete collapse. We will briefly consider 10 Tanquintic-Misa, 2012. 11 British Geological Survey, 2015. 12 Ritchie, 2017; BP, 2017.
GROWTH AND SUSTAINABILITY IN THE TWENTY-FIRST CENTURY
11
the status of five types of renewable resources: forests, fisheries, freshwater, soils, and biodiversity. Forests Forests cover 31 percent of the world’s land area. Forests provide us with numerous benefits including air purification, flood prevention, soil stabilization, and climate regulation. The global rate of deforestation has slowed since the 1990s, with annual net forest loss (area deforested minus area planted) declining from 0.18 percent of the total global forest area annually to 0.08 percent, but remains significant especially for tropical forests. Forest trends differ dramatically in different regions of the world. In Europe and North America, forests are expanding. Forest area is also increasing in Asia, primarily due to recent replanting efforts in China. But significant deforestation is occurring in Latin America (including the Amazon Forest in Brazil) and Africa, although at lower rates than during the 1990s.13 Fisheries Global fish consumption is at record levels, putting pressure on the health of many of the world’s fisheries. The United Nations classifies fish stocks into three categories: underfished, fully fished, or overfished. The share of the world’s fisheries classified as overfished has increased from less than 10 percent in the 1970s to more than 30 percent today. Another 60 percent of fish stocks are considered fully fished, indicating that sustainable harvest increases are possible on only about 10 percent of global fisheries.14 Increasing scarcity of most wild-caught fish has generated incentives to expand aquaculture (fish farming). But there are also adverse ecological impacts from aquaculture, especially with the farming of saltwater species, such as shrimp and salmon. Five pounds of wild-caught fish are used as feedstock in the production of each pound of farmed salmon, while shrimp farming has led to widespread destruction of coastal mangrove forests. Freshwater While freshwater is continually renewed through natural processes, only a limited amount is available for human use at one time. Global water use increased by more than a factor of five during the 20th century, with further increases projected for the future, especially in developing countries. The availability of freshwater varies significantly across the world—while water is abundant in some areas, it is quite scarce in others. About a billion people currently suffer from water scarcity— a number that is expected to increase due to supply depletion and climate change, which will reduce water availability further in many water scarce regions.15 Many countries are becoming increasingly dependent upon groundwater, which is essentially a non-renewable resource with a limited supply. India extracts more groundwater than any other country (more than the next two countries, China and the U.S., combined), which has led to a national crisis as water tables fall in overexploited aquifers, leading to water shortages and increased contamination. In most places in the world groundwater is essentially unregulated, and
13 FAO, 2016; UNEP, 2012. 14 FAO, 2016. 15 UNEP, 2008; UN Water, http://www.unwater.org/water-facts/scarcity/.

GROWTH AND SUSTAINABILITY IN THE TWENTY-FIRST CENTURY
12
farmers and other water users can extract all they want at low cost and little regard for environmental consequences. Agriculture is responsible for about 70 percent of global freshwater demand. In 2017 the World Economic Forum ranked the global water crisis as the world’s third most significant risk, behind only weapons of mass destruction and extreme weather events.16 Soils Soil resources are in decline in much of the world, especially in the nearly 40% of the Earth’s land area that is devoted to agriculture. According to the Food and Agriculture Organization of the United Nations (FAO), about a third of the world’s soil has already been degraded. If population growth and current agricultural practices continue, the global amount of arable and productive land per person in 2050 will be only about a quarter of the level it was in 1960. Organic and regenerative agricultural techniques are needed to rebuild soils, including storing carbon in soils to reduce the impacts of climate change. Biodiversity Finally, we consider the status of the world’s biodiversity, meaning the abundance and variety of wild plant and animal species. Virtually all human environmental impacts—pollution, deforestation, agriculture, overfishing, climate change—are contributing to what many researchers conclude to be an ongoing extinction crisis on the same scale as previous mass extinctions, such as the one that killed off the dinosaurs 65 million years ago. According to the United Nations,
“up to two-thirds of species in some taxa are now threatened with extinction.”17 The most significant threats to vertebrate species are, in order: agriculture/aquaculture, logging, and urban development. In the future these threats are likely to be overtaken by climate change. According to one analysis in the prestigious scientific journal Nature, under a mid-range scenario 15–37 percent of all species would be “committed to extinction” by 2050.18 3.4 Pollution and Waste Damage from pollution is not reflected in traditional national accounting measures, even though it clearly reduces welfare. A 2017 study presented a comprehensive analysis of the global health and economic costs of air, water, and soil pollution. The summary of the report indicates that:
Diseases caused by pollution were responsible for an estimated 9 million premature deaths in 2015–16% of all deaths worldwide—three times more deaths than from AIDS, tuberculosis, and malaria combined and 15 times more than from all wars and other forms of violence.... Pollution disproportionately kills the poor and the vulnerable. Nearly 92% of pollution-related deaths occur in low-income and middle-income countries and, in countries at every income level, disease caused by pollution is most prevalent among minorities and the marginalised.19
16 Biswas and Hartley, 2017; Khokhar, 2017; WEF, 2017. 17 UNEP, 2012, p. 134. 18 Thomas et al., 2004. 19 Landrigan et al., 2017.

GROWTH AND SUSTAINABILITY IN THE TWENTY-FIRST CENTURY
13
Of the 9 million deaths attributed to pollution, 6 million were linked to air pollution, 1.8 million to water pollution, and 0.8 million to workplace-related pollution. The global economic damages from pollution-related disease were estimated to be US$4.6 trillion annually, or more than 6 percent of global economic output. Efforts to reduce pollution levels have generally been found to be cost-effective, and pollution in developed countries has generally declined in recent decades. For example, policies to reduce air pollution in the United States since the 1970s are estimated to have returned about $30 in benefits for every dollar spent.20 Aggregate emissions of the most common air pollutants in the U.S. have declined by 73 percent since the 1970s.21 Meanwhile, pollution in developing countries has typically increased. As we see in Figure 4, air pollution levels in most major cities in developing nations exceed the World Health Organization’s recommended level of 20 micrograms per cubic meter (μg/m3) of particulate matter (PM10), composed of suspended particles of dust, ash, and other harmful material.
Figure 4. Average Particulate Matter Concentration, Selected Major Cities
Source: World Health Organization, Ambient Air Quality Database.
Notes: Particulate matter concentrations in μg/m3; data vary by city, between 2012 and 2015.
In addition to pollution, economic production and consumption generates a significant amount of physical waste—over a billion tons per year. In general, as economic production and urbanization increases, a society produces more solid waste. People in wealthier countries produce at least twice as much waste per person, on average, as those in middle- and lower-income countries. A 2013
20 Ibid. 21 U.S. EPA.

GROWTH AND SUSTAINABILITY IN THE TWENTY-FIRST CENTURY
14
paper concluded that global generation of solid waste will increase by a factor of three by 2100, primarily due to population growth and income gains in developing countries.22 Toxic waste produced in developed countries is frequently exported for disposal in developing countries. A particular concern is the production and export of e-wastes, which often contain toxic chemicals such as mercury, lead, and arsenic, and are often disposed of in unregulated conditions that cause significant environmental consequences and human health risks.23 Rapid future development will mean that pollution and waste management problems, both domestic and trade related, are likely to grow, despite efforts to control them with environmental regulations.
4. CLIMATE CHANGE The resource and environmental issues discussed above all pose serious problems. But perhaps the primary environmental challenge of the twenty-first century is global climate change. Global climate change combines issues of resource use and environmental impact, and is strongly related to economic growth.
4.1 Climate Change Science, Data, and Impacts The vast majority of scientists have concluded that human activity is changing the planet’s climate.24 Emissions of various greenhouse gases, particularly carbon dioxide (CO2) and methane from the extraction and burning of fossil fuels, trap heat near the earth’s surface, leading not only to a general warming trend but to sea-level rise, ecological disruption, and an increase in severe weather events, such as hurricanes, floods, and droughts. Climate change is expected to impact poor countries most heavily, as they tend to be located in tropical regions already exposed to severe weather events and also lack the financial and technological resources to adapt and respond to climate change. Climate change threatens to increase food insecurity, with the number of people at risk of hunger projected to increase by 10 percent to 20 percent by 2050. In a 2018 study, the World Bank estimated that climate change will cause the migration of over 100 million people in developing countries over the coming decades due to droughts, crop failures, and rising seas. According to one study, climate change “could fundamentally redraw the map of the planet, and where and how humans and other species can live.”25 Global emissions of carbon dioxide have generally been increasing in recent decades, as shown in Figure 5. The wealthier OECD nations comprised the majority of global emissions up to 2003, but by 2016 the non-OECD nations emitted over 60 percent of the world’s carbon dioxide. China is currently the world’s top emitter of carbon dioxide, followed by the United States, India, and Russia. One piece of potentially encouraging news is that global carbon emissions were relatively 22 Hoornweg and Bhada-Tata, 2012; Hoornweg et al., 2013. 23 Ajibo, 2016.;Vidal, 2013a. 24 See, for example, https://climate.nasa.gov/scientific-consensus/. 25 Vidal, 2013b; Harvey, 2018; Fankhauser and Stern, 2016.

GROWTH AND SUSTAINABILITY IN THE TWENTY-FIRST CENTURY
15
stable from 2013 to 2016 even as the global economy expanded. This suggested a possible “decoupling” of the link between emissions increases and economic growth as a result of expanded use of renewable energy sources and energy efficiency. In 2017, however, global emissions rose again by 1.4 percent, driven by strong growth in the demand for energy.26
Figure 5. Global Carbon Dioxide Emissions, 1965-2016, OECD and Non-OECD Countries
Source: BP, 2017. While developing countries emit more total carbon than developed countries, it is important to realize that emissions per capita are still much higher in richer nations. For example, annual CO2 emissions per person are about 16 tons in the United States, 10 tons in Japan, 7.5 tons in China, 1.7 tons in India, and 0.5 tons in Ghana.27 At the 2009 United Nations climate change meeting in Copenhagen participating countries set a target of limiting the eventual global temperature increase, relative to pre-industrial levels, to no more than 2° Celsius (3.6°F). In order to achieve this target, it is estimated that global CO2 emissions will need to fall by about 70 percent by 2050, with further declines after that. The 2°C target was reaffirmed at the 2015 climate change meeting in Paris, along with a commitment to pursue “efforts to limit the temperature increase to 1.5°C above pre-industrial levels, recognizing that this would significantly reduce the risks and impacts of climate change.”28 So far the global temperature has already increased about 1°C since pre-industrial times. But even if we stop emitting greenhouse gases immediately, the world is still committed to further warming and other adverse impacts. One problem is that greenhouse gases persist for decades or even centuries in the earth’s atmosphere. In addition, there is a lag between the time a gas is emitted 26 Mooney, 2018. 27 Data for 2014 from the World Bank, World Development Indicators. 28 Reuters, 2017; United Nations, 2015, p. 3.

GROWTH AND SUSTAINABILITY IN THE TWENTY-FIRST CENTURY
16
and the time when its effects are fully realized. Thus, even if annual emissions of greenhouse gases were immediately stabilized at current levels, the concentration of these gases in the atmosphere would continue to rise, with effects such as sea-level rise continuing for centuries. Dramatically reducing, or eliminating, carbon emission will require a transformation of how humans obtain energy. Currently the world economy obtains over 85 percent of its energy from fossil fuels, roughly equally split between coal, oil, and natural gas.29 The U.S. Energy Information Administration forecasts that under its “reference scenario” the world will still rely on fossil fuels for about threequarters of its energy in 205030—clearly a path that would make the 2° target unattainable. Economic analysis has an important role to play in estimating the damages associated with climate change, and determining the cost, the benefits, and the feasibility of actions, such as investment in renewable energy and energy efficiency, intended to reduce its impacts. We consider these economic analyses next. 4.2 The Economics of Climate Change Carbon dioxide emissions are an example of a negative externality. When externalities are present unregulated markets will not allocate resources efficiently because those involved in market transactions do not bear the costs. The solution to this problem, according to economic theory, is to introduce a tax or other market policy (such as a system of tradable pollution permits) so that current consumers and producers pay for the full social cost of their choices, including those that impact future generations. This tax, reflecting the social damages from emitting CO2 (normally one ton), is referred to as the social cost of carbon. As far back as the 1990s economists have widely recommended instituting carbon pricing as a policy response to climate change.31 Economists have had differing estimates of the value of the social cost of carbon, however, leading to different recommendations for policy action. Early economic analyses of climate change generally recommended limited policy action based on a social cost of carbon of around $10 per ton of CO2.32 Applied to transportation, a social cost of carbon of $10 per ton of CO2 translates to a tax on gasoline of about 10 cents per gallon. As the demand for gasoline is relatively inelastic, a 10 cent/gallon tax would only reduce the quantity demanded by perhaps about 1 or 2 percent. There would be similarly small effects in other areas of energy use such as heating and cooling. A major economic analysis in 2006, funded by the British government, concluded that much more dramatic action was justified. The Stern Review of the Economics of Climate Change, written by former World Bank economist Nicholas Stern, estimated a social cost of carbon of $85 per ton of CO2. One of the differences between this and most previous analyses was the use of a lower social
29 BP, 2017. 30 U.S. EIA, 2017. 31 See https://en.wikipedia.org/wiki/Economists%27_Statement_on_Climate_Change. 32 Tol, 2008.
GROWTH AND SUSTAINABILITY IN THE TWENTY-FIRST CENTURY
17
discount rate to weigh future costs and benefits (see Box 1). This approach placed a higher value on avoiding future damages, leading to stronger policy recommendations. BOX 1: DISCOUNTING THE FUTURE In economic theory, future costs and benefits are evaluated with a technique called discounting. The discount rate is defined as the annual percentage by which impacts are reduced compared to the current year. The further into the future an impact occurs, the more it will be discounted. The choice of a discount rate is a critical component of an economic analysis of climate change. A relatively low discount rate of 1 percent would devalue impacts 50 years in the future by only 40 percent, while a high discount rate of 5 percent would reduce the estimated economic value of impacts by more than 90 percent over 50 years. So a low discount rate would tend to support significant present investments in mitigating climate change because the avoided damages are valued relatively highly. A high discount rate, on the other hand, would justify little action today, as the perceived future benefits would be negligible. Most economic analyses use a discount rate higher than 3 percent, based on market conditions including, for example, the rate of return on government bonds. But in the Stern Review of the Economics of Climate Change, a discount rate of only 1.4 percent was chosen. This choice was based on the principle that each generation’s well-being should be valued about equally. Economists using a higher discount rate implicitly allocate a lower value to the well-being of future generations when issues such as climate change damages are evaluated. The deliberate choice of a lower rate represents the principle of social discounting—that evaluation of future well-being should be based on a principle of equity between generations, rather than of a market conditions today. The Stern Review estimated the damages from climate change in the twenty-first century to be between 5 percent and 20 percent of global GDP, while the most severe effects of climate change could be avoided at a cost of approximately 1 percent of GDP. Thus, the report concludes that the benefits of immediate action to minimize climate change significantly exceed the costs, and that ignoring climate change will eventually damage economic growth.
Our actions over the coming few decades could create risks of major disruption to economic and social activity, later in this century and in the next, on a scale similar to those associated with the great wars and the economic depression of the first half of the twentieth century. And it will be difficult or impossible to reverse these changes. Tackling climate change is the pro-growth strategy for the longer term, and it can be done in a way that does not cap the aspirations for growth of rich or poor countries.33
33 Stern, 2007, Executive Summary, p. 2.

GROWTH AND SUSTAINABILITY IN THE TWENTY-FIRST CENTURY
18
The Stern Review initiated a vigorous debate among economists about the appropriate discount rate, social cost of carbon, and climate policies. A 2015 survey of economists working on the topic found a strong trend towards favoring more aggressive policy actions (see Box 2). BOX 2: ECONOMISTS’ VIEWS ON CLIMATE CHANGE A 2015 study collected the views of 365 economists who have published articles on climate change economics in peer-reviewed academic journals. The results revealed that economists are much more concerned about the impacts of climate change than the American public. For example, half of the surveyed economists indicated that “immediate and drastic action is necessary” compared to just 23 percent of the American public. The vast majority of economists feel that climate change will have significant negative effects on the economy. 78% responded that climate change would be “extremely likely” or “likely” to have a negative impact on the growth rate of the global economy. A similar percentage (77%) indicated that the United States should commit to reducing its greenhouse gas emissions regardless of the actions of other countries. The survey also asked opinions about the social cost of carbon used by the U.S. government at the time, $37 per ton of CO2. Over 50 percent thought the value should be higher, 18 percent thought it was somewhat accurate, and only 8 percent thought it should be lower (some respondents expressed no opinion). The study concludes:
that the [economic] models used to calculate the social cost of carbon are likely under- estimating climate damages. There is clear consensus among economic experts that climate
change poses major risks to the economy and that significant policy responses will be needed to avoid large economic damages. Source: Howard and Sylvan, 2015. 4.3 Climate Change Policy As mentioned above, economists tend to favor responding to the negative externalities associated with climate change by instituting market-based policies. The two most prominent proposals are carbon taxes and a system of tradable permits. A carbon tax would charge large emitters of CO2, such as electricity producers, gasoline refineries, and factories, a per-ton fee, effectively “internalizing” the externality. The individual emitters would choose their pollution level by comparing the tax against the cost of actions to reduce emissions. In other words, as long as it was cheaper to reduce emissions than pay the tax, companies would reduce their emissions. The tax would then, to some extent, get passed on to consumers in terms of higher prices. Revenues raised by such a tax could be used to fund the transition to renewable energy. Rather than an overall tax increase, carbon taxes could be offset by lowering other taxes, such as income

GROWTH AND SUSTAINABILITY IN THE TWENTY-FIRST CENTURY
19
or social insurance taxes, as part of a revenue-neutral tax shift. A carbon tax would encourage reduction of fossil-fuel based energy use, as well as investment in renewable technologies (which would mostly avoid taxation). The most serious disadvantage to a carbon tax is that it would fall more heavily on lower-income households. The U.S. Bureau of Labor Statistics reports that households in the lowest income decile allocate 9 percent of their spending on utilities and 4 percent on gasoline, while households in the highest income decile only spend about half as much, as a percent of income, on these products.34 There are, however, several ways to respond to this, the most straightforward being a direct rebate of some of the tax revenues for those most in need. With a system of tradable carbon permits, the government would require large CO2 emitters to obtain permits for each ton they desired to emit, with the permits either auctioned to the highest bidders or freely distributed according to some criterion, such as historical emissions. Permits could then be traded among firms, with firms holding unneeded permits offering those for sale to other companies that find they need additional permits, with the permit price freely set by the market. Permits would create many of the same incentives as taxes—encouraging businesses and consumers to shift away from fossil fuels, fostering investment in renewable energy, and even raising government revenue if the permits are auctioned. The main advantage of permits is that the government effectively controls the overall level of emissions. With a tax, the effect on emissions is indirect, depending on the behavioral response by businesses and consumers. In other words, the greater the elasticity of demand for the products taxed, the more emissions would decline. With a permit system, uncertainty about the resulting emissions level is removed, which is particularly important in achieving emissions targets. On the other hand, a permit system creates uncertainty about the permit price, which may make it difficult for firms and households to determine whether energy efficiency investments will prove worthwhile. With a carbon tax, such long-term investment planning is more clear. Both carbon taxes and permit systems have been used by a number of countries. Carbon taxes have been implemented in India, Japan, South Africa, Quebec and British Columbia (Canada), and Costa Rica, among other places. The most extensive permit system is the European Union’s Emissions Trading System, which has been in place since 2005. The system covers about 11,000 power stations and manufacturing plants, covering nearly half of all greenhouse gas emissions in the EU.35 The price of permits in the EU system has varied significantly, ranging from more than €30/ton to less than €1/ton, depending on economic conditions and the allocation of permits. California has also instituted a carbon trading system, and has partnered with Canadian provinces to expand the system. In 2017 China initiated a nationwide carbon permit system, effectively doubling the proportion of the world’s carbon that is subject to pricing.36 Since climate change is a global problem, international cooperation is critical in mounting an adequate response. The first international treaty to address climate change, the 1997 Kyoto Protocol, specified emissions targets only for richer nations, with penalties enforced on those that 34 Data from the Consumer Expenditure Survey, for 2016. 35 European Commission, 2016. 36 Roberts, 2017. https://treaties.un.org/pages/ViewDetails.aspx?src=TREATY&mtdsg_no=XXVII-7 d&chapter=27&lang=en.

GROWTH AND SUSTAINABILITY IN THE TWENTY-FIRST CENTURY
20
failed to meet their targets. When the treaty expired in 2012, some countries achieved their targets while others did not (the United States never ratified the treaty), but no penalties were ever enforced. In order to bring nearly all nations into the process, the 2015 Paris Climate Agreement let each country set their own targets on a voluntary basis, without enforceable penalties. It is left to each country what national policies they will enact in order to meet their targets, whether these policies be taxes, permits, or other regulations. As of 2018, 195 nations are signatories to the treaty (the United States is still officially a signatory even though it announced its intention to withdrawal in 2017).37 Each country’s targets, referred to as their National Determined Contribution (NDC), are supposed to be re-evaluated every five years, with the goal of making the targets successively more stringent. An independent assessment of each country’s NDC finds that very few (7 out of 31 countries assessed) are sufficient to achieve the treaty’s objective of limiting warming to no more than 2°C above pre-industrial levels.38 An overall evaluation of the Paris Climate Agreement is shown in Figure 6. We see that without the treaty, existing national policies would have resulted in global emissions continuing to rise until at least the middle of the 21st century, and a temperature increase of 3.1 to 3.7°C, relative to pre-industrial levels, by 2100. The Paris NDCs collectively reduce the expected temperature increase to 2.6 to 3.2°C—still failing to meet the goal of limiting warming and allowing global emissions to increase for at least a couple of decades. In order to achieve the 2°C target, emissions need to begin declining essentially immediately, and rapidly falling to close to zero by the end of the century. In order to achieve the more ambitious 1.5°C target, emissions need to actually become negative by the end of the century. A crucial set of policies to fill the gap between current reductions plans and a 2°C or 1.5°C target is carbon sequestration in forests, soils, and wetlands (as noted above). This would involve modified techniques for agricultural production and forestry. This important area has only just begun to receive attention in national policy and international negotiations.* While the Paris Climate Agreement can be viewed as a success in that it has resulted in nearly all nations committing to regulate their emissions, and a reduction in the expected degree of warming, clearly more policy progress on climate change is needed. This same mixture of progress and further challenges is evident in the other environmental areas addressed in section 3 of this module. Rather than being specific and separate issues, the demands related to achieving global sustainability appear to require a transformation of current methods of production and economic growth. We therefore will next explore the linkages between the environment and macroeconomic growth. In particular, is economic growth compatible with environmental sustainability? Once
37 United Nations Treaty Collection, https://treaties.un.org/pages/ViewDetails.aspx?src=TREATY&mtdsg_no=XXVII-7-d&chapter=27&lang=en. 38 Climate Action Tracker, http://climateactiontracker.org/countries.html. *An evaluation of numerous policy solutions including emissions reduction and carbon sequestration can be found at http://www.drawdown.org/.

GROWTH AND SUSTAINABILITY IN THE TWENTY-FIRST CENTURY
21
again, we will see that the data can tell a mixed story, and that there are multiple economic perspectives on the issue.
Figure 6. Global Greenhouse Gas Emissions Under Alternative Scenarios
Source: Climate Action Tracker, http://climateactiontracker.org/global.html. Note: Emissions data include carbon dioxide and other greenhouse gases converted to carbon dioxide
equivalents. 5. ECONOMIC GROWTH AND THE ENVIRONMENT This section will consider three topics that explore the relationship between economic growth and the environment: 1. How does economic growth tend to affect environmental quality? 2. Does protecting the environment harm employment and economic growth? 3. How have economists envisioned the transition to a sustainable economy? 5.1 The Environmental Kuznets Curve Hypothesis Some researchers have suggested that, in the long run, economic development reduces per capita environmental damages. The logic behind this assertion is that sufficient wealth and technology allow countries to adopt clean production methods and move to a service-based economy. Further, environmental quality is generally considered a “normal good,” meaning that people will demand more of it as they become wealthier.

GROWTH AND SUSTAINABILITY IN THE TWENTY-FIRST CENTURY
22
The environmental Kuznets curve (EKC) hypothesis posits an inverted U-shaped relationship between economic development and environmental damages.† It states that environmental damage per capita increases in the early stages of economic development as a country transitions away from an agricultural-based economy to an economy with more manufacturing, energy use, transportation network, etc. Eventually, however, damages reach a maximum and then diminishes as a country attains even higher levels of income, allowing it to invest in cleaner production methods. If the evidence supports this hypothesis, it would imply that policies that foster macroeconomic growth will eventually promote a cleaner environment as well. Does this principle really work? The EKC relationship does seem to hold for some pollutants. Figure 7 shows the findings of a study that estimated the relationship between the average particulate matter (PM10) concentration in a country and a country’s per capita income. We see that at very low levels of income the expected PM10 concentration tends to rise quickly as a country develops economically. But the PM10 concentration peaks when a country reaches an average income of around US$1,300 per person. Air pollution levels then fall steadily with further economic advancement. As noted earlier in the module, the World Health Organization has recommended that PM10 levels be below 20μg/m3. On average, countries achieve this standard when income per person rises above US$17,000 per person. Evidence supporting the EKC hypothesis has also been found for municipal solid waste and other air pollutants such as sulfur dioxide and carbon monoxide.39
Figure 7. Environmental Kuznets Curve for Particulate Matter
Source: Mazurek, 2011. 39 Ichinose et al., 2015; Georgiev and Mihaylov, 2015. † This hypothesis was not devised by Simon Kuznets but is similar to his hypothesis that inequality first increases, then decreases with growing national wealth.

GROWTH AND SUSTAINABILITY IN THE TWENTY-FIRST CENTURY
23
However, the EKC relationship does not appear to hold for all environmental problems. Perhaps most importantly, CO2 emissions show a positive relationship with average income, as shown in Figure 8. A simple statistical test to fit an inverted-U curve through the data in Figure 8 finds that there is no turning point—per-capita CO2 emissions continue to rise as GDP/capita increases. A more sophisticated analysis in 2015 reached a similar conclusion, that “rising income is associated with an increase in [CO2] emissions. No income turning points are found for the observed sample of countries.” Thus, promoting economic growth does not appear to be an effective means to address the issue of global climate change. The relationship between economic growth and the environment is, in reality, more complex than implied by the EKC hypothesis. As a 2014 paper concludes:
it would be misleading to follow the policy of polluting first and cleaning later as espoused by proponents of EKC. It does not make much sense to “do nothing” and wait for the magic-wand of economic growth to cure environmental problems. Proactive policies and measures are required to mitigate the problem.40
Figure 8. Relationship between Carbon Dioxide Emissions and GDP per Capita, 2014
Source: World Bank, World Development Indicators database. 5.2 Does Protecting the Environment Harm Employment and Economic Growth? Policies that increase environmental protections are sometimes criticized for causing decreases in employment or harming economic growth. What is the evidence on this subject? 40 Akpan and Abang, 2014, p. 16.
GROWTH AND SUSTAINABILITY IN THE TWENTY-FIRST CENTURY
24
Several research studies have explored the relationship between employment and environmental regulation. The overall conclusion is that while increased environmental spending leads to the loss of certain jobs, it creates other jobs. These effects may cancel out or actually result in a net gain of jobs. For example, a 2008 analysis of the U.S. economy tested the notion that environmental protection results in job losses. The study estimated the impact of environmental spending and regulation on employment in various industries and found that:
contrary to conventional wisdom, [environmental protection (EP)], economic growth, and jobs creation are complementary and compatible: Investments in EP create jobs and displace jobs, but the net effect on employment is positive.41
A 2009 review of the literature on the relationship between environmental policies and employment reached the conclusion that strong environmental policies will change the distribution of jobs in society but have little effect on the overall level of employment.42 Focused on Europe, the study found that well-designed environmental policies can sometimes result in net job gains. For example, the additional revenue from higher environmental taxes could be used to reduce the taxes on labor, thus reducing the cost of hiring workers and leading to higher overall employment. A similar conclusion was reached by a 2016 analysis which estimated the employment impacts of various potential policies to reduce carbon emissions in the United States. For each policy analyzed, the authors’ model predicted that job losses in “dirty” sectors such as coal mining were essentially offset by job gains in cleaner sectors such as renewable energy. They concluded that the “overall effects on unemployment should not be a substantial factor in the evaluation of environmental policy” because the net effects are likely to be quite small.43 According to a 2012 paper, public investments on clean energy sources in the U.S. create about three times as many jobs as similar spending on fossil fuel energy sources. The reasons are that clean energy sources tend to be more labor intensive, and the money invested is more likely to be spent domestically as opposed to funding imports. Worldwide, renewable energy sources employed nearly 10 million people in 2016—more than one million each in solar photovoltaics, liquid biofuels, and wind energy. More than half of these jobs are in low- and middle-income countries, mainly China and India. Solar and wind technologies have advanced rapidly, making these sources economically competitive with fossil fuels for new power installation.44 Another criticism of environmental protection based on the results of some studies is that environmental regulations reduce GDP growth rates. For example, a comprehensive analysis of the Clean Air Act in the United States estimated that GNP in 1990 was about 1 percent lower than it would have been without the policy. The aggregate macroeconomic loss from the Act over the period 1973–1990 was estimated to be about $1 trillion. Analysis of the economic impact of major environmental regulations in Europe suggests an aggregate economic loss of about 0.2 percent of GDP.45
41 Bezdek, et al., 2008. 42 Rayment, et al., 2009. 43 Hafstead and Williams, 2016. 44 Pollin, 2012; IRENA, 2017; U.S. Energy Information Administration, 2017. 45 Commission of the European Communities, 2004.
GROWTH AND SUSTAINABILITY IN THE TWENTY-FIRST CENTURY
25
But these macroeconomic costs must be assessed against the benefits of the regulations. When an estimate of the Clean Air Act benefits was made, it was found that the central estimate of the 1973–1990 benefits was $22 trillion, or a benefit cost ratio of 22:1. So while there appears to be a slight negative impact of environmental regulation on economic growth as traditionally measured, we need a more complete analysis to determine its effect on social welfare. GDP was never intended to measure social welfare, and economists have developed alternative national accounting approaches to supplement or replace GDP. These alternatives may present a better framework for fully assessing the impacts of environmental regulations on social welfare. 5.3 Economic Perspectives on the Transition to a Sustainable Economy We have just seen that protecting the environment does not necessarily reduce employment and that its economic benefits can significantly outweigh its costs. We now consider a broader question: Is continued macroeconomic growth compatible with a sustainable national or global economy? Some economists studying this topic believe that, at least for the foreseeable future, further economic growth is acceptable or desirable as we transition to a more sustainable economy. Other economists, who believe that we have already exceeded the planet’s carrying capacity, advocate for a transition to a “no growth” economy, perhaps requiring a period of de-growth during that transition. Among those economists favoring “better” growth rather than no growth is Nicholas Stern, whom we discussed above. While Stern believes significant policy changes are required to address climate change, he argues that “...the economic opportunities of the transition to the low or zero carbon economy are real and very attractive: it is a story of sustainable growth.”46 Another proponent of this perspective is the United Nations. The UN’s Green Economy Initiative, launched in 2008, seeks to promote an economy that “results in improved human well-being and social equity, while significantly reducing environmental risks and ecological scarcities.” The Initiative proposed an annual investment of 2 percent of global GDP over 2010–2050 to fund sustainable technologies and practices. The UN developed a macroeconomic model to estimate the short-term and long-term effects of this investment, relative to a business-as-usual (BAU) scenario. Their results found that while in the first few years the additional investment reduced global GDP/capita by about one percent, by 2030 global GDP/ capita would be 2 percent higher in the Green Economy scenario. And by 2050, global GDP/capita would be 14 percent higher as a result of sustainable investments.47 Further, the Green Economy scenario resulted in dramatic reductions in environmental impacts. Relative to the BAU scenario, by 2050 global energy demand is reduced by 40 percent, water demand is reduced by 22 percent, total forested land increases by 21 percent, and the global ecological footprint is reduced by 48 percent.
46 Fankhauser and Stern, 2016, p. 22. 47 UNEP, 2011, https://www.unenvironment.org/explore-topics/green-economy/why-does-greeneconomy- matter/what-inclusive-green-economy.

GROWTH AND SUSTAINABILITY IN THE TWENTY-FIRST CENTURY
26
Economist Robert Pollin, in his 2015 book Greening the Global Economy, also advocates for an investment of 1.5 percent of global GDP in renewable energy and energy efficiency to fund a transition to a sustainable, low-carbon economy. His analysis concludes that green investments expand employment and economic growth, as jobs in renewable energy and energy efficiency tend to be more labor intensive than jobs in the fossil fuel sector, as shown in Figure 9. In each country, investments in green energy result in higher job creation, yielding 75–135 percent more jobs per dollar than fossil fuel investments. To assist displaced fossil fuel industry workers, Pollin argues for job retraining programs and policies promoting full employment.48
Figure 9. Jobs Generated by Investing One Million Dollars in Clean Energy versus Fossil Fuel Production, Selected Countries
Source: Pollin, 2015. Analyses such as Pollin’s book and the UN’s Green Economy Initiative suggest that not only is sustainability compatible with economic growth, green investments can actually increase rates of economic growth. But other economists argue that continual economic growth is incompatible with long-term sustainability. As we saw earlier in the module, economist Herman Daly has noted that indefinite expansion of the macroeconomy within a finite biosphere is physically impossible. Since the 1970s Daly has advocated for a transition to a steady-state economy in which population and the stock of physical capital is held constant. A steady-state economy would not hold human well-being constant, as things such as technology, information, fairness, and wisdom could continue to improve. Also, activities that do not involve resource consumption, and are environmentally neutral or environmentally friendly, could
48 Pollin, 2015.

GROWTH AND SUSTAINABILITY IN THE TWENTY-FIRST CENTURY
27
continue to grow. Such activities could include services, arts, communication, and education. But Daly maintains that consumption levels should be kept “sufficient” but not extravagant. After basic needs are met and reasonable levels of consumption achieved, the concept of a steady-state economy implies that economic development should be increasingly oriented toward these kinds of inherently “sustainable” activities. Thus, Daly distinguishes between growth and development—the steady-state economy “develops but does not grow, just as the planet earth, of which it is a subsystem, develops without growing.”49 A similar viewpoint is espoused in Tim Jackson’s book Prosperity Without Growth. Jackson calls for an ecological macroeconomics which maintains economic stability without a reliance on traditional growth. He proposes that three macroeconomic interventions are necessary to transition to a sustainable economy:
1. A structural transition toward service-based activities. Like Daly, Jackson advocates for a shift of economic activity away from resource-intensive goods toward “dematerialized” services such as education and the arts. 2. Investment in ecological assets. Jackson notes that the definition of a “productive” investment would need to change under ecological macroeconomics. Ecological investments may provide lower financial returns, as traditionally measured, but can provide greater social value due to increases in resource efficiency and the enhancement of ecological functions. 3. A working time policy to maintain employment levels. Given that in a no-growth scenario total hours worked would likely fall, Jackson proposes that working hours per week (or per job) decline to prevent unemployment, leaving people more leisure time. Labor productivity could continue to increase due to improvements in technology, potentially further reducing working hours per week.50
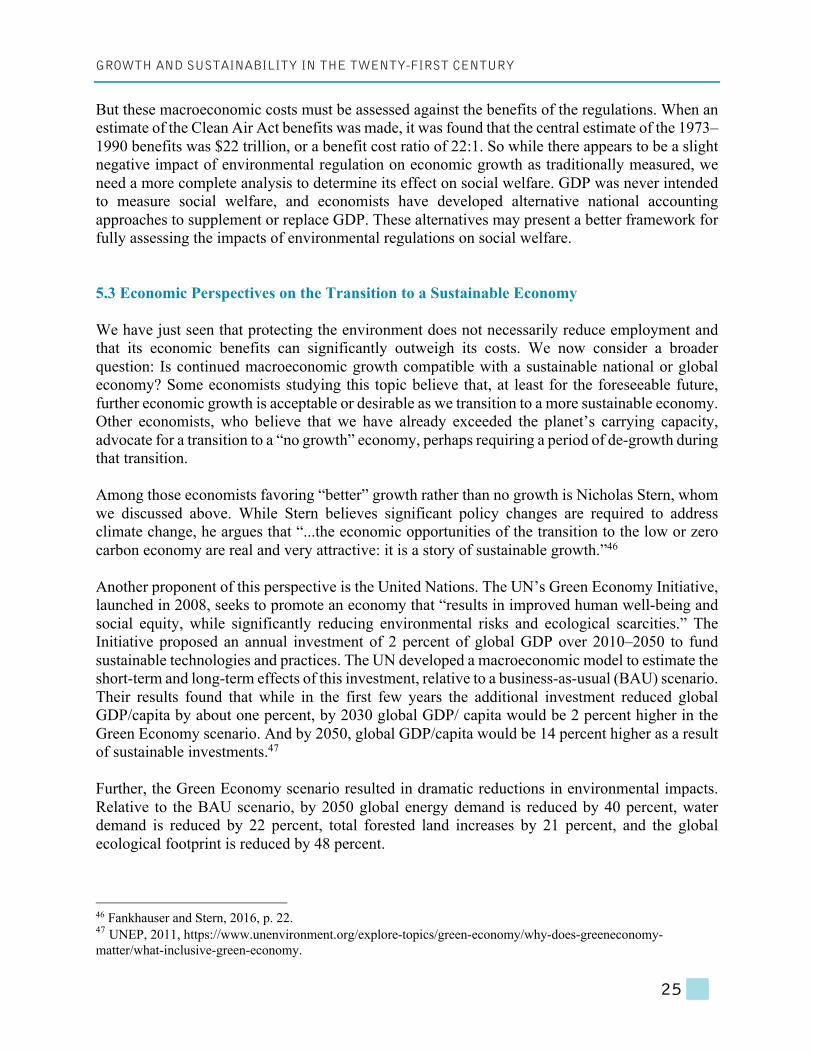
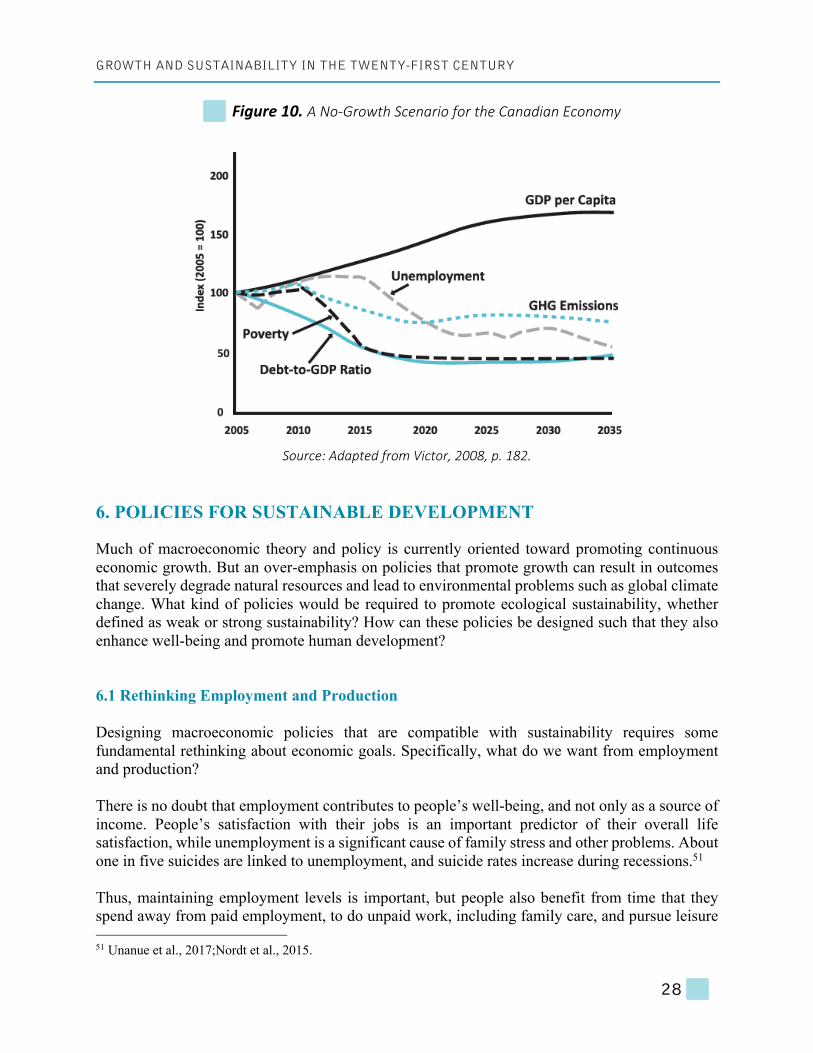
Peter Victor, a Canadian economist, has developed a macroeconomic simulation model to explore how a national economy would perform during a transition to a sustainable, low- or zero-growth future. Figure 10 shows Victor’s model applied to the Canadian economy. In this scenario the Canadian government is assumed to introduce a tax on greenhouse gas (GHG) emissions, creating incentives to switch from high GHG energy sources to low-carbon sources, making energy in general more expensive (at least in the short term) and encouraging conservation and efficiency. The revenues from the GHG tax are used to reduce other taxes, so that the net effect on government revenues is zero. The model shows that GDP per capita stabilizes after 2025, and GHG emissions decrease by 22 percent by 2035. Poverty levels as well as unemployment decrease significantly, and fiscal balance is reached, with a steady decrease in the debt to GDP ratio. A shorter working week allows for full employment, with less growth in material consumption but more spending on health care and education.
49 Daly, 1973, p. 330. 50 Jackson, 2011.
GROWTH AND SUSTAINABILITY IN THE TWENTY-FIRST CENTURY
28
Figure 10. A No-Growth Scenario for the Canadian Economy
Source: Adapted from Victor, 2008, p. 182.
6. POLICIES FOR SUSTAINABLE DEVELOPMENT Much of macroeconomic theory and policy is currently oriented toward promoting continuous economic growth. But an over-emphasis on policies that promote growth can result in outcomes that severely degrade natural resources and lead to environmental problems such as global climate change. What kind of policies would be required to promote ecological sustainability, whether defined as weak or strong sustainability? How can these policies be designed such that they also enhance well-being and promote human development? 6.1 Rethinking Employment and Production Designing macroeconomic policies that are compatible with sustainability requires some fundamental rethinking about economic goals. Specifically, what do we want from employment and production? There is no doubt that employment contributes to people’s well-being, and not only as a source of income. People’s satisfaction with their jobs is an important predictor of their overall life satisfaction, while unemployment is a significant cause of family stress and other problems. About one in five suicides are linked to unemployment, and suicide rates increase during recessions.51 Thus, maintaining employment levels is important, but people also benefit from time that they spend away from paid employment, to do unpaid work, including family care, and pursue leisure 51 Unanue et al., 2017;Nordt et al., 2015.

GROWTH AND SUSTAINABILITY IN THE TWENTY-FIRST CENTURY
29
activities. As we saw in the previous section, working time policies have been proposed to maintain employment levels, while providing workers with more time for leisure and other activities. Several European countries have instituted labor policies that mandate comparatively short working weeks for most employees. France instituted a maximum 35-hour working week in 2000, and most German workers also have a standard 35-hour working week. In 2018, workers in Germany’s largest labor union won the right to work a 28-hour working week for up to two years.52 Research suggests that policies mandating shorter working weeks are not necessarily effective at reducing unemployment rates. But two positive effects have been identified. First, people working shorter weeks tend to be more productive per hour. Based on a sample of OECD countries, GDP per hour worked declines as the hours worked per worker increases. Second, shorter working weeks tend to be correlated with lower greenhouse gas emissions. According to one study, policies to reduce annual work hours by 0.5 percent per year could mitigate one-quarter to one-half of future global warming.53 Traditional macroeconomic models also assume that more production is always preferable. These models may focus only on the level of output, Y, and say nothing about the composition of output. From a sustainability perspective, however, the composition of output makes a very big difference. Some things that we produce require relatively little use of material and energy inputs. Eating locally-grown produce, taking a bike ride with friends, or engaging in educational and cultural activities, for example, puts little stress on the natural environment. Other activities, such as heating and furnishing a very large house, driving an SUV, or maintaining a perfect lawn using chemical fertilizer, have more negative impacts. Shifting away from producing goods and services that are most damaging to ecological systems and toward producing goods and services that are less destructive—or even environmentally beneficial—could allow an economy to maintain consumption, investment, and employment in a less environmentally damaging way. Rethinking employment and production for a sustainable economy means that traditional macroeconomic indicators, such as the unemployment rate and GDP growth rate, are no longer sufficient. We would want to measure employment quality, not just quantity. The OECD has developed a framework for assessing job quality in a country by considering three dimensions: earnings, labor market security, and the quality of the working environment.54 And of course we would want to adjust GDP to account for resource degradation and pollution. 6.2 Rethinking Economic Incentives Green Taxes Fiscal policy affects economic behavior by setting taxes that discourage certain actions and subsidies that encourage other choices. Taxes have traditionally been placed on income and profits, an approach which is criticized by some economists for creating a disincentive for employment and entrepreneurism, and consequently reduces economic growth. An alternative is to shift 52 Huggler, 2018. 53 Estev.o et al., 2008; Anonymous, 2013; Rosnick, 2013. http://www.oecd.org/statistics/jobquality.htm. 54 OECD, Job Quality, http://www.oecd.org/statistics/job-quality.htm.

GROWTH AND SUSTAINABILITY IN THE TWENTY-FIRST CENTURY
30
taxation away from income and profits in favor of higher taxes on negative externalities such as pollution. “Green” taxes make it more expensive to undertake activities that deplete important natural resources or contribute to environmental degradation. They discourage energy- and material-intensive economic activities, while favoring the provision of services and labor-intensive industries. One example of a green tax, as discussed above, is a tax on carbon emissions, favoring renewables and efficiency over carbon-based fuels. All countries have implemented environmentally-based taxes to some extent. As shown in Figure 11, environmental taxes in industrial countries can range from less than 3 percent of total tax revenues (in the United States) to around 10 percent. A shift toward higher reliance on environmental taxes does not seem to be occurring, with the OECD average remaining around 6 percent of all tax revenues since the mid-1990s.55
Figure 11. Environmental Taxes, as a Percent of Total Tax Revenues, Selected Countries, 2015
Source: OECD, OECD.Stat, “Environmentally related tax revenue.”
Green taxes are strongly supported by economic theory as a means of internalizing negative externalities. When a negative externality such as pollution exists, an unregulated market will result in an inefficient allocation. Because all taxes, in addition to raising revenue, discourage the “taxed” activity, it is economically and socially desirable to discourage “bads” such as environmental pollution and natural resource depletion by placing taxes on them, rather than on positive economic activities like investment and the earning of income.
55 OECD Statistics Database (OECD.Stat), Environmentally related tax revenue.

GROWTH AND SUSTAINABILITY IN THE TWENTY-FIRST CENTURY
31
Two common objections to green taxes frequently arise. First, it is likely that green taxes would fall disproportionately on lower-income households. But as noted earlier with respect to carbon taxes, a rebate or credit to these households could be implemented to avoid making green taxes regressive. The other criticism is that green taxes are politically unpopular—no one wants higher taxes. Increases in green taxes can be offset, however, by reductions in other taxes (such as income taxes) so that the tax burden on a typical household remains unchanged. Also, households and businesses would have the option to lower the amount of green taxes they pay by undertaking energy conservation measures and other environmentally friendly practices, which is not the case with income or business taxes. Eliminating Damaging Subsidies While subsidies for renewable energy can encourage a transition to a more sustainable economy, many current subsidies actually increase environmental damages. Agricultural and energy subsidies that encourage the overuse of energy, fertilizer, pesticides, and irrigation water could be reduced or eliminated. This would reduce government expenditures, and the money saved could be used to lower taxes or to promote more sustainable agricultural systems that rely on the recycling of nutrients, crop diversification, the use of natural pest controls, and minimizing the use of artificial chemicals and fertilizer. Such systems also tend to be more labor-intensive, so they also have the potential to boost employment. The fossil fuel industry receives the largest share of perverse subsidies. According to a 2017 journal article, fossil fuel subsidies amount to about 6.5 percent of global GDP. This not only includes direct payments by governments to fossil fuel companies, but also the implicit subsidy when negative externalities are not included in market prices. This mispricing of goods and services effectively permits producers to transfer the costs of environmental damage onto society. A broader estimate of the global environmental externalities imposed on society from economic activity is about 11 percent of global GDP. These damages are expected to increase to 18 percent of world GDP in 2050.56 6.3 Green Keynesianism Keynesian economics focuses on using monetary and fiscal policy to spur aggregate demand during economic downturns. In response to the global financial crisis of 2007–2008, some economists proposed implementing Keynesian macroeconomic policies to both promote an economic recovery and meet sustainability objectives. In fact, stimulus packages passed in several countries in response to the crisis included significant public investment in green projects. For example, over 10 percent of the 2009 stimulus package passed in the U.S. (the American Recovery and Reinvestment Act) was directed toward investment in energy efficiency, renewable energy, and other green spending. Green stimulus government spending in China was even higher, at over US$200 billion.57
56 Coady et al., 2017; UNEP Finance Initiative and PRI, 2011. 57 Tienhaara, 2018; http://www.wri.org/resources/charts-graphs/green-stimulus-spending-country.

GROWTH AND SUSTAINABILITY IN THE TWENTY-FIRST CENTURY
32
Some critics have argued that there is a contradiction between the “green Keynesian” goals of economic growth and environmental protection.58 But it is possible to direct policies towards different kinds of growth. Instead of just thinking of consumption (C), investment (I), and government spending (G), we can divide each of these terms into environmentally harmful and environmentally positive activities. Thus, it should be possible to achieve growth in employment and well-being while reducing throughput—the flow of inputs into the economy and outputs of wastes and pollution. According to one “green Keynesian” analysis:
we can distinguish between those macroeconomic aggregates that should be strictly limited—resource-intensive consumption and investment, and energy-intensive infrastructure—and those that can expand over time without negative environmental consequences. The latter would include large areas of health, education, cultural activity, and resource- and energy-conserving investment ... there is plenty of scope for growth in economic activity concentrated in these categories, without growth in resource throughput, and with a significant decline in the most damaging throughput, that of carbon-intensive fuels.59
7. CONCLUDING THOUGHTS Throughout the twentieth century, the main objective of macroeconomics was steady, strong economic growth. Considering the social and environmental challenges that we face in the twenty-first century, macroeconomics will need to adapt to new realities. Employment, price stability, and GDP growth will continue to be issues of great importance—not as ends in themselves, however, but as the means to the broader goals of human development and sustainability. Keeping ultimate well-being goals in mind, macroeconomics must look beyond the experience of the past and ask new questions. A fundamental question confronting macroeconomics in the twenty-first century is how the majority of people in the world, currently at relatively low standards of living, can improve their well-being. The issues of “human development” involve a combination of traditional economic growth and new approaches that are more oriented toward dealing with problems of poverty, inequality, and ecological sustainability. Economic analysis needs to take into account the need for technologies that can provide energy, food, and other materials for human consumption in ways that are ecologically sound, and that help to remedy past damages. The transition to a more sustainable economy will have economic costs, but also significant benefits, such as increased employment and improved quality of life. If the true goal of economics is to enhance well-being, then we need to realize that the economic goals and policies of the future may differ significantly from those of the past. This was recognized by John Maynard Keynes nearly a century ago. Even during the Great Depression in the 1930s, Keynes looked into the future and imagined a world of relative affluence, where humanity’s
58 Blackwater, 2012. 59 Harris, 2013.

GROWTH AND SUSTAINABILITY IN THE TWENTY-FIRST CENTURY
33
“economic problem may be solved,” creating little need for traditional economics, and where people will instead be able to focus on how to live “wisely and agreeably and well.” (See Box 3.) A macroeconomics of sustainability is possible. Policies are available to address all the major environmental problems discussed in this module. These will need to be combined with our earlier analyses of issues concerning national income, fiscal and monetary policy, unemployment and inflation, and economic development. This effort can generate a new macroeconomics capable of responding to the challenges of our current era. BOX 3: ECONOMIC POSSIBILITIES FOR OUR GRANDCHILDREN Looking beyond the dire conditions during the Great Depression, John Maynard Keynes imagined what the world, and economics, might be like 100 years into the future (in 2030). Considering what would be the “economic possibilities for our grandchildren”, Keynes’ main conclusion was that as people’s needs and goals changed with further affluence, so should economics. Writing in 1930, Keynes suggested that:
a point may soon be reached, much sooner perhaps than we are all of us aware of, when [basic] needs are satisfied in the sense that we prefer to devote our further energies to non- economic purposes.... I draw the conclusion that, assuming no important wars and no important increase in population, the economic problem may be solved, or be at least within sight of solution, within a hundred years. This means that the economic problem is not— if we look into the future—the permanent problem of the human race.
Thus, for the first time since his creation man will be faced with his real, his permanent problem—how to use his freedom from pressing economic cares, how to occupy the leisure, which science and compound interest will have won for him, to live wisely and agreeably and well. When the accumulation of wealth is no longer of high social importance, there will be great changes in the code of morals.... The love of money as a possession—as distinguished from the love of money as a means to the enjoyments and realities of life—will be recognized for what it is, a somewhat disgusting morbidity, one of those semi-criminal, semi-pathological propensities which one hands over with a shudder to the specialists in mental disease. All kinds of social customs and economic practices, affecting the distribution of wealth and of economic rewards and penalties, which we now maintain at all costs, however distasteful and unjust they may be in themselves, because they are tremendously useful in promoting the accumulation of capital, we shall then be free, at last, to discard. Of course there will still be many people with intense, unsatisfied purposiveness who will blindly pursue wealth—unless they can find some plausible substitute. But the rest of us will no longer be under any obligation to applaud and encourage them. Source: Keynes, 2009 (original publication 1930).

GROWTH AND SUSTAINABILITY IN THE TWENTY-FIRST CENTURY
34
KEY TERMS AND CONCEPTS ecological footprint: a measure of the human impact on the environment, measured as the land area required to supply a society’s resources and assimilate its wastes and pollution environmental Kuznets curve (EKC) hypothesis: the theory that as a country develops economically environmental damages per capita initially increase, then peak and eventually decrease non-renewable resources: resources that do not regenerate through natural processes, at least on a human time scale, such as oil, coal, and mineral ores renewable resources: resources that are regenerated over time through natural and biological processes, such as forests, fisheries, and freshwater social cost of carbon: a monetary estimate of the discounted long-term damages from emitting a ton of CO2 in a given year social discount rate: a discount rate that reflects social rather than market valuation of future costs and benefits; usually lower than the market discount rate steady-state economy: an economy in which population and the stock of physical capital is held constant. A steady-state economy would not hold human well-being constant, as things such as technology, information, fairness, and wisdom could continue to improve. strong sustainability: an analytical perspective suggesting that natural capital depreciation is justified only if it is compensated for with adequate restoration of other natural capital throughput: the flow of raw materials and energy through the economy, leading to outputs of waste weak sustainability: an analytical perspective suggesting that natural capital depreciation is justified as long as it is compensated for with adequate increases in other types of capital

GROWTH AND SUSTAINABILITY IN THE TWENTY-FIRST CENTURY
35
REFERENCES
Ajibo, Kenneth I. 2016. “Transboundary Hazardous Wastes and Environmental Justice.” Environmental Law Review, 18(4):267–83.
Akpan, Usenobong F., and Dominic E. Abang. 2014. “Environmental Quality and Economic Growth: A Panel Analysis of the ‘U’ in Kuznets.” MPRA Paper, University Library of Munich, Germany, February 2014.
Anonymous. 2013. “Get a Life.” The Economist, September 24. BP. 2017. Statistical Review of World Energy. June 2017. Bezdek, Roger H., Robert M. Wendling, and Paula DiPerna. 2008. “Environmental Protection,
the Economy, and Jobs: National and Regional Analyses.” Journal of Environmental Management 86: 63–79.
Biswas, Asit K., and Kris Hartley. 2017. “From Evidence to Policy in India’s Groundwater Crisis.” The Diplomat, July 22, 2017.
Blackwater, Bill. 2012. “The Contradictions of Environmental Keynesianism.” Climate & Capitalism, June 14, 2012. http://climateandcapitalism.com/2012/06/14/the- contradictions-of-environmental-keynesianism/.
British Geological Survey. 2015. Risk List 2015. http://www.bgs.ac.uk/mineralsuk/statistics/risklist.html.
Coady, David, Ian Parry, Louis Sears, and Baoping Shang. 2017. “How Large Are Global Fossil Fuel Subsidies?” World Development, 91:11–27.
Commission of the European Communities. 2004. The EU Economy: 2004 Review. ECFIN (2004) REP 50455-EN. Brussels.
Daly, Herman. 2005. “Economics in a Full World.” Scientific American, September 2005: 100– 107.
Daly, Herman. 1973. “The Steady-State Economy: Toward a Political Economy of Biophysical Equilibrium and Moral Growth.” In Toward a Steady-State Economy (Herman Daly, ed.), Freeman, San Francisco.
Duncan, Ron, and Chris Wilson. 2004. “Global Population Projections: Is the UN Getting it Wrong?” Working Papers in Economics and Econometrics No. 438, Australian National University, February 2004.
Estevão, Marcello, Filipa S., and Barbara Petrongolo. 2008. “The 35-Hour Workweek in France: Straightjacket or Welfare Improvement?” Economic Policy, 23(55):417–63.
European Commission. 2016. The EU Emissions Trading System (EU ETS). Factsheet. https://ec.europa.eu/clima/sites/clima/files/factsheet_ets_en.pdf.
Fankhauser, Samuel, and Nicholas Stern. 2016. “Climate Change, Development, Poverty and Economics.” Grantham Research Institute on Climate Change and the Environment, May 2016.
Fischer, Douglas. 2009. “Even Deep Cuts in Greenhouse Gas Emissions Will Not Stop Global Warming.” Scientific American, April 14, 2009.
Food and Agriculture Organization of the United Nations (FAO). 2015. “Global Forest Resources Assessment 2015: How Are the World’s Forests Changing? Second Edition.” Rome.
Food and Agriculture Organization of the United Nations (FAO). 2016. “The State of the World Fisheries and Aquaculture 2016.” Rome.
Giampietro, Mario, and Andrea Saltelli. 2014. “Footprints to Nowhere.” Ecological Indicators,

GROWTH AND SUSTAINABILITY IN THE TWENTY-FIRST CENTURY
36
46:610–21. Georgiev, Emil, and Emil Mihaylov. 2015. “Economic Growth and the Environment:
Reassessing the Environmental Kuznets Curve for Air Pollution Emissions in OECD Countries.” Letters in Spatial and Resource Sciences, 8(1):29–47.
Hafstead, Marc A.C., and Roberton C. Williams III. 2016. “Unemployment and Environmental Regulation in General Equilibrium.” Resources for the Future, Discussion Paper 15–11, Washington, DC, May 2016.
Harris, Jonathan. 2013. “Green Keynesianism: Beyond Standard Growth Paradigms.” In Building a Green Economy: Perspectives from Ecological Economics (Robert B. Richardson, editor). Michigan State University Press, East Lansing, MI.
Harvey, Fiona. 2018. “Climate Change Soon to Cause Movement of 140m People, World Bank Warns.” The Guardian, March 19, 2018.
Hoornweg, Daniel, and Perinaz Bhada-Tata. 2012. “What a Waste: A Global Review of Solid Waste Management.” World Bank, Urban Development Series Knowledge Papers, No. 15, March 2012.
Hoornweg, Daniel, Perinaz Bhada-Tata, and Chris Kennedy. 2013. “Environment: Waste Production Must Peak this Century.” Nature 502(7473).
Howard, Peter, and Derek Sylvan. 2015. Expert Consensus on the Economics of Climate Change. Institute for Policy Integrity, New York University School of Law. December 2015.
Huggler, Justin. 2018. “German Workers Win the Right to 28-Hour Working Week.” The Telegraph, February 7, 2018.
Ichinose, Daisuke, Masashi Yamamoto, and Yuichiro Yoshida. 2015. “The Decoupling of Affluence and Waste Discharge under Spatial Correlation: Do Richer Communities Discharge More Waste?” Environment and Development Economics, 20:161–84.
International Institute for Applied Systems Analysis. 2014. “World Population Likely to Peak by 2070.” October 23, 2014. http://www.iiasa.ac.at/web/home/about/news/20141023-population-9billion.html.
International Renewable Energy Agency (IRENA). 2017. Renewable Energy and Jobs, Annual Review 2017.
Jackson, Tim. 2011. Prosperity Without Growth: Economics for a Finite Planet. Routledge, London.
Kelemen, E., M. Garc.a-Llorente, G. Pataki, B. Mart.n-L.pez, and E. G.mez-Baggethun. 2016. “Non-monetary Techniques for the Valuation of Ecosystem Service.” In OpenNESS Ecosystem Services Reference Book (M. Potschin and K. Jax, eds). http://www.openness-project.eu/library/reference-book.
Keynes, John Maynard Keynes. 2009. “Economic Possibilities for Our Grandchildren.” In Essays in Persuasion. Classic House Books, New York [original publication 1930].
Khokhar, Tariq. 2017. “Chart: Globally, 70% of Freshwater Is Used for Agriculture.” The World Bank, The Data Blog, March 22, 2017. https://blogs.worldbank.org/opendata/chart-globally-70-freshwater-used-agriculture.
Kubiszewski, Ida, Robert Costanza, Carol Franco, Philip Lawn, John Talberth, Tim Jackson, and Camille Aylmer. 2013. “Beyond GDP: Measuring and Achieving Global Genuine Progress.” Ecological Economics, 93:57–68.
Landrigan, Philip J. and 46 other authors. 2017. “The Lancet Commission on Pollution and

GROWTH AND SUSTAINABILITY IN THE TWENTY-FIRST CENTURY
37
Health.” The Lancet 391:462–512. Lin, D., L. Hanscom, J. Martindill, M. Borucke, L. Cohen, A. Galli, E. Lazarus, G. Zokai, K. Iha,
D. Eaton, and M. Wackernagel. 2016. “Working Guidebook to the National Footprint Accounts: 2016 Edition.” Global Footprint Network, Oakland.
Manyika, James, Jonathan Woetzel, Richard Dobbs, Jaana Remes, Eric Labaye, and Andrew Jordan. 2012. “Global Growth: Can Productivity Save the Day in an Aging World?” McKinsey Global Institute.
Mazurek, Jiri. 2011. “Environmental Kuznets Curve: A Tie between Environmental Quality and Economic Prosperity.” E+M Ekonomie a Management, 14(4):22–31.
Mooney, Chris. 2018. “Last Year Dashed Hopes for a Climate Change Turnaround.” The Washington Post, March 21, 2018.
Mooney, Chris. 2017a. “We Only Have a 5 Percent Chance of Avoiding ‘Dangerous’ Global Warming, a Study Finds.” The Washington Post, July 31, 2017.
Mooney, Chris. 2017b. “New Climate Change Calculations Could Buy the Earth Some Time – If They’re Right.” The Washington Post, September 18, 2018.
Nordt, Carlos, Ingeborg Warnke, Erich Seifritz, and Wolfram Kawohl. 2015. “Modelling Suicide and Unemployment: A Longitudinal Analysis Covering 63 Countries, 2000–11.” The Lancet, 2(3):239–45.
Organisation for Economic Co-operation and Development (OECD). 2012. Looking to 2060: Long-Term Global Growth Prospects.” OECD Economic Policy Papers, No. 03.
Pollin, Robert. 2015. Greening the Global Economy. The MIT Press, Cambridge, MA. Pollin, Robert. 2012. “Getting Real on Jobs and the Environment: Pipelines, Fracking, or Clean
Energy?” New Labor Forum 21(3): 84–87. Rayment, Matt, Elke Pirgmaier, Griet De Ceuster, Friedrich Hinterberger, Onno Kuik, Henry
Leveson Gower, Christine Polzin, and Adarsh Varma. 2009. “The Economic Benefits of Environmental Policy.” Report ENV.G.1/FRA/2006/007, Institute for Environmental Studies, Vrije University, The Netherlands. November 2009.
Reuters (staff). 2017. “Global Energy CO2 Emissions Could Be Cut by 70 Percent by 2050: IRENA.” Reuters, March 20, 2017. https://www.reuters.com/article/us-energy-carbon/globalenergy- co2-emissions-could-be-cut-by-70-percent-by-2050-irena-idUSKBN16R0IY.
Ritchie, Hannah. 2017. “How Long Before We Run Out of Fossil Fuels?” Our World in Data, August 8, 2017. https://ourworldindata.org/how-long-before-we-run-out-of-fossil-fuels.
Roberts, David. 2017. “40 Countries Are Making Polluters Pay for Carbon Pollution. Guess Who’s Not.” Vox, June 15, 2017. https://www.vox.com/energy-and environment/2017/6/15/15796202/map-carbon-pricing-across-the-globe.
Rosnick, David. 2013. “Reduced Work Hours as a Means of Slowing Climate Change.” Center for Economic and Policy Research, February 2013.
Ruppert, Michael C. 2009. Confronting Collapse: The Crisis of Energy and Money in a Post Peak Oil World. Chelsea Green Publishing, White River Junction, Vermont.
Stern, Nicholas. 2007. Stern Review: The Economics of Climate Change. Cambridge University Press. http://webarchive.nationalarchives.gov.uk/+/http://www.hm-treasury.gov.uk/sternreview_index.htm
Tanquintic-Misa, Esther. 2012. “Global Mining to Get Costly as Quality Mineral Reserves Decline.” Nasdaq.com, April 19, 2012.
Thomas, Chris D., Alison Cameron, Rhys E. Green, Michel Bakkenes, Linda J. Beaumont,

GROWTH AND SUSTAINABILITY IN THE TWENTY-FIRST CENTURY
38
Yvonne C. Collingham, Barend F. N. Erasmus, Marinez Ferreira de Siqueira, Alan Grainger, Lee Hannah, Lesley Hughes, Brian Huntley, Albert S. van Jaarsveld, Guy F. Midgley, Lera Miles, Miguel A. Ortega-Huerta, A. Townsend Peterson, Oliver L. Phillips, and Stephen E. William. 2004. “Extinction Risk from Climate Change,” Nature 427:145–48.
Tienhaara, Kyla. 2018. Green Keynesianism and the Global Financial Crisis. Routledge, London. Tol, Richard. 2008. “The Social Cost of Carbon: Trends, Outliers, and Catastrophes.”
Economics: The Open-Access, Open-Assessment E-Journal, vol. 2, 2008–25. Unanue, Wenceslao, Marcos E. G.mez, Diego Cortez, Juan C. Oyanedel, and Andr.s Mendiburo-
Seguel. 2017. “Revisiting the Link between Job Satisfaction and Life Satisfaction: The Role of Basic Psychological Needs.” Frontiers in Psychology, 8:1–17.
United Nations. 2017. “World Population Prospects, Volume 1.” Department of Economic and Social Affairs, Population Division, New York.
United Nations. 2015. Paris Agreement. http://unfccc.int/files/essential_background/convention/application/pdf/english_paris_agreement.pdf.
United Nations Environment Programme (UNEP). 2012. Global Environmental Outlook 5: Environment for the Future We Want.
United Nations Environment Programme (UNEP). 2011. Towards a Green Economy: Pathways to Sustainable Development and Poverty Eradication, A Synthesis for Policymakers.
United Nations Environment Programme (UNEP). 2008. Vital Water Graphics: An Overview of the State of the World’s Fresh and Marine Waters, Second Edition. Nairobi, Kenya.
United Nations Environment Programme (UNEP) Finance Initiative and Principles for Responsible Investment (PRI). 2011. Universal Ownership: Why Environmental Externalities Matter to Institutional Investors.
U.S. Energy Information Administration (EIA). 2017. International Energy Outlook 2017. Washington, DC.
U.S. Environmental Protection Agency. 2017. Our Nation’s Air: Status and Trends Through 2016. Washington, DC.
Victor, Peter. 2008. Managing Without Growth: Slower by Design, Not Disaster. Edward Elgar, Northampton, MA.
Vidal, John. 2013a. “Toxic ‘e-waste’ Dumped in Poor Nations, says United Nations.” The Guardian, December 14, 2013.
Vidal, John. 2013b. “Climate Change Will Hit Poor Countries Hardest, Study Shows.” The Guardian, September 27, 2013.
World Economic Forum (WEF). 2017. The Global Risks Report 2017, 12th Edition. Geneva. Worstall, Tim. 2017. “The Problematic Assumption in the UN’s 9.8 Billion People Projection.”
Forbes, June 22, 2017.
GROWTH AND SUSTAINABILITY IN THE TWENTY-FIRST CENTURY
39
DISCUSSION QUESTIONS 1. Explain the concepts of “economic” and “uneconomic” growth. Do you think that there is a danger that global growth is becoming “uneconomic”? 2. How would you define sustainability? Can you think of some examples in which the “weak” and “strong” versions of sustainability might imply different economic or environmental polices? 3. What are some recent trends in global population? Do you think that future population growth is likely to pose major problems, and what factors will affect the future course of population growth? 4. Which resource and environmental problems, other than climate change, do you think are the most pressing? What kinds of policies might be appropriate in responding to these problems? 5. How do you think we should evaluate the economic impacts of climate change? What kinds of economic analysis are involved, and what accounts for the differences in various evaluations of the issue? 6. What do you think should be done by the United States and other countries in response to global climate change? Can you think of specific policies that would reduce carbon emissions without resulting in significant economic disruption? 7. What is the principle of the Environmental Kuznets Curve (EKC)? In what areas does it seem applicable, and in what ways could it be inaccurate or misleading? What are some policy implications that can be drawn from an analysis of the evidence reading the EKC? 8. The promotion of economic growth is often seen as a major policy goal. What do you think is the feasibility of a model that stresses alternative goals such as ecological sustainability and well-being? How would you compare the Green Economy and steady-state economy concepts? 9. What specific economic incentives and policies would you recommend for promoting sustainability? Have you heard of any policy examples from the news recently that you think were good ideas? 10. Can you identify areas in which “green Keynesian” economic growth would be desirable, and areas in which economic growth is more destructive to the environment? In what ways would a “green” economy look different from our current economy? 11. How can we reconcile the need for global economic development with the problems of environmental limits? In what ways will established models of economic development have to be modified to deal with new realities? 12. Do you agree with Keynes’s belief that industrialized countries can reach a point where needs will be “satisfied in the sense that we prefer to devote our further energies to non-economic

GROWTH AND SUSTAINABILITY IN THE TWENTY-FIRST CENTURY
40
purposes”? Do you think that we are any closer to this point than in 1930, when Keynes wrote his essay? Do you see any evidence that this is starting to occur?