green jobs for displaced manufacturing, construction and
TRANSCRIPT

Final Report
Green Jobs for Displaced Manufacturing, Construction and Construction-Related Service Workers
Prepared by
Dr. Eric Thompson, Associate Professor Dr. Scott M. Fuess, Jr., Professor
Jared McEntaffer, Graduate Research Assistant Hanna Hartman, Graduate Research Assistant
University of Nebraska-Lincoln
Prepared for the Northern Plains and Rocky Mountain Consortium
May 31, 2011
Bureau of Business Research
Department of Economics
College of Business Administration
University of Nebraska—Lincoln
Dr. Eric Thompson, Director
www.bbr.unl.edu
‘‘This workforce solution was funded by a grant awarded by the U.S. Department of Labor’s Employment and
Training Administration. The solution was created by the grantee and does not necessarily reflect the official
position of the U.S. Department of Labor. The Department of Labor makes no guarantees, warranties, or
assurances of any kind, express or implied, with respect to such information, including any information on linked
sites and including, but not limited to, accuracy of the information or its completeness, timeliness, usefulness,
adequacy, continued availability, or ownership. This solution is copyrighted by the institution that created it.
Internal use by an organization and/or personal use by an individual for non-commercial purposes is permissible.
All other uses require the prior authorization of the copyright owner.
A Bureau of Business Research Report From the University of Nebraska—Lincoln

i
Executive Summary
Green Jobs for Displaced
Manufacturing, Construction and Construction-Related Service Workers
The recent “Great Recession” impacted all parts of the country and the economy. But,
selected industries and regions were especially hard-hit, as is true in many recessions. In terms of
regions, the western and mountain regions of the United States, the industrial Midwest and the
state of Florida were impacted most. Among industries, the manufacturing industry was hard hit,
as is typically the case during recession. For example, in the State of Nebraska, net jobs losses in
the manufacturing industry accounted for 9,400 (33%) of the total 28,300 net job loss between
December 2007 and December 2009. But, one unusual aspect of the Great Recession was the
collapse of the housing sector. This lead to substantial job losses in construction and in portions
of the service sector closely tied to the housing market such as finance, real estate, legal service,
architecture and engineering. We note that construction accounted for another 4,200 (15%) of the
28,300 net job loss in Nebraska between December 2007 and December 2009.
Given these patterns, the University of Nebraska-Lincoln Bureau of Business Research
(BBR) conducted a special study for the Northern Plains and Rocky Mountain Consortium,
which is composed of the Departments of Labor in the states of Iowa, Nebraska, South Dakota,
Montana, Utah, and Wyoming. This study examines re-employment opportunities in green
occupations for displaced workers in the construction, manufacturing, and construction-related
services industries. The first part of the research examines the potential “match” in theory
between green occupations and the occupations of displaced manufacturing, construction, and
construction-related service workers in each consortium state. The second part of the research
examines the actual re-employment patterns for a set of displaced workers around the nation
ii
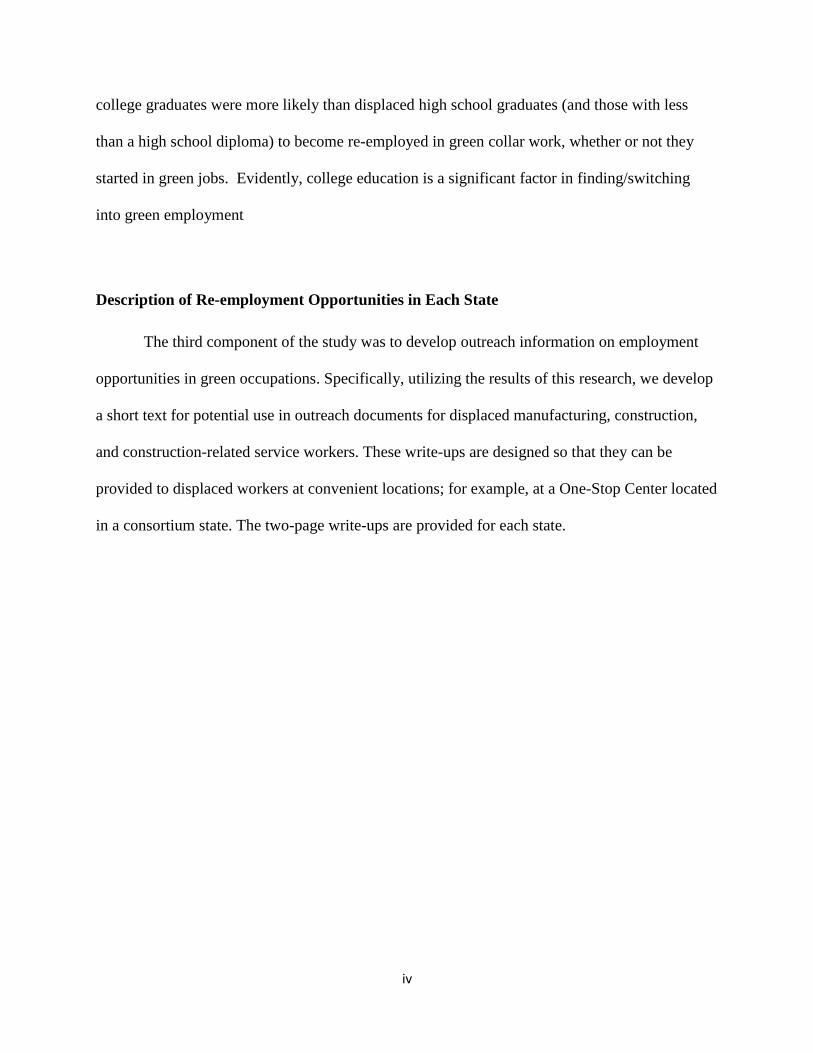
identified by the Current Population Survey of the U.S. Department of Labor. In the third task,
we develop a brief synopsis regarding re-employment opportunities in green occupations for
each state. These synopses could be distributed to displaced workers. All three sections of the
research project are summarized below.
Potential Match among Occupations
The first section of the study addresses the following question: can green occupations be
expected to provide re-employment opportunities for displaced manufacturing, construction, and
construction-related service workers? To answer this question: the research team developed an
occupational profile of displaced workers in each state, and compared that profile with a list of
green occupations. The profile was estimated by examining job losses in individual industries
within construction, manufacturing, and finance in each state as well as job losses in the real
estate, legal services, and architecture and engineering industries. Those job losses by industry
were combined with staffing patterns for each industry from the National Industry-Occupation
Employment Matrix to predict job losses by occupation in each state. The research team then
examined the “match” between these high-displacement occupations in each state and 51 green
occupations. These green occupations had been identified in a separate survey of business by
consortium member states. A “match” was determined to occur whenever high displacement
occupations and green occupations were “related occupations,” as identified by Occupational
Information Network (O*Net) system of the U.S. Department of Labor. The finding was that
approximately 40% of the high displacement construction occupations were related to one of the
51 green occupations in consortium states, as were approximately 35% of high displacement
manufacturing occupations. However, few of the high displacement occupations from the

iii
finance, real estate, law, or architecture and engineering industries were found to be related to the
green occupations.
Observed Match among Occupations: Factors Influencing the Probability of a Match
The second approach in the research was to examine actual re-employment patterns
among displaced workers, including how worker attributes influence the probability of re-
employment within green occupations. To identify re-employment patterns, we utilized data
from two January 2010 surveys: (1) the Current Population Survey (CPS) and (2) the Displaced
Workers Survey (DWS). The January 2010 CPS and the supplemental DWS enable us to
identify the former occupations of specific individuals displaced in the last three years, as well as
the current occupation of individuals who had found new employment by the time of the January
2010 survey. We then examined which attributes influence the probability of re-employment in a
green occupation. In this case, we utilized a national definition of green occupations identified by
the U.S. Department of Labor. This analysis found that displaced workers from manufacturing,
construction and construction-related industries all had as high or a higher likelihood of re-
employment in a green occupation than displaced workers from other industries. There were four
other principal findings. First, displaced men with family attachments were more likely than
single men without children to become re- employed in green occupations. Whether or not they
started in a green job in the first place, men with family obligations were noticeably more likely
to find green jobs. Evidently these obligations encouraged flexibility in their job search
behavior. Second, regardless of marital or parental status, women were not more likely to end up
in green jobs than men. Third, workers displaced from construction jobs were more likely than
job losers from manufacturing to regain employment in green collar work. Fourth, displaced
iv
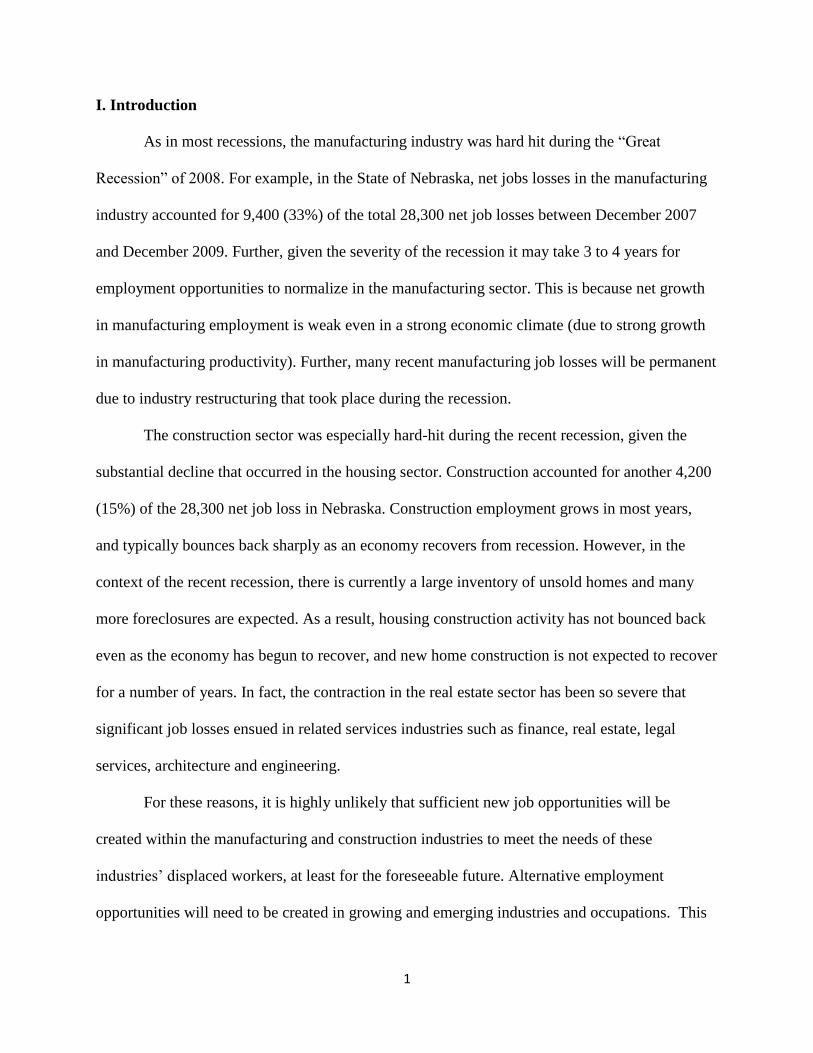
college graduates were more likely than displaced high school graduates (and those with less
than a high school diploma) to become re-employed in green collar work, whether or not they
started in green jobs. Evidently, college education is a significant factor in finding/switching
into green employment
Description of Re-employment Opportunities in Each State
The third component of the study was to develop outreach information on employment
opportunities in green occupations. Specifically, utilizing the results of this research, we develop
a short text for potential use in outreach documents for displaced manufacturing, construction,
and construction-related service workers. These write-ups are designed so that they can be
provided to displaced workers at convenient locations; for example, at a One-Stop Center located
in a consortium state. The two-page write-ups are provided for each state.

v
Table of Contents
Executive Summary i
I. Introduction 1
II. Potential Match among Occupations 3
III. Observed Match among Occupations: Factors Influencing the Probability of a Match …. 21
Green Occupations ……23
Displaced Workers Who Found New Jobs: Displaced from Any Industry 24
Displaced Workers Who Found New Jobs: Displaced from Selected Industries
of Interest 34
Displaced Workers – Job Finders and Failures: Displaced from Any Industry 40
Displaced Workers – Job Finders and Failures: Displaced from Selected
Industries of Interest 46
Summary of Findings 50
IV. Summary ……52
Opportunities for Employment in Green Occupations in Iowa 54
Opportunities for Employment in Green Occupations in Montana 56
Opportunities for Employment in Green Occupations in Nebraska 58
Opportunities for Employment in Green Occupations in South Dakota 60
Opportunities for Employment in Green Occupations in Utah 62
Opportunities for Employment in Green Occupations in Wyoming 64
Appendix 1 List of 51 Green Occupations for Consortium States 66

vi
List of Tables
Table II.1: Construction and Manufacturing Industries with Especially Severe Job Loss 5
Table II.2: Employment Loss Rates by State by Industry 7
Table II.3: Employment Loss by State by Industry 8
Table II.4a: Occupations with Largest Projected Losses within the Construction Industry 10
Table II.4b: Occupations with Largest Projected Losses within the Manufacturing Industry 12
Table II.4c: Occupations with Largest Projected Losses within Construction-Related Service
Industries 15
Table II.5: Occupations with Largest Projected Job Loss That Match One or More Green
Occupations 17
Table II.6: Green Occupations for Displaced Manufacturing, Construction, and Construction-
Related Service Industry Workers 19
Table III.1 Displaced Workers Who Found Jobs: Descriptive Statistics 25
Table III.2: Probability of being Employed in a Green Occupation (Currently Employed, All
Industries) 30
Table III.3 Displaced Workers from Selected Industries Who Found Jobs:
Descriptive Statistics 36
Table III.4: Probability of Being Employed in a Green Occupation (Currently Employed)
(Originally Employed in Construction, Manufacturing, or Related Services) 40

vii
Table III.5:Displaced Workers, Job Finders and Failures: Descriptive Statistics 42
Table III.6: Probability of Being Employed in a Green Occupation (Currently Employed or
Unemployed, All Industries) 44
Table III.7: Displaced Workers from Selected Industries, Job Finders and Failures:
Descriptive Statistics 47
Table III.8: Probability of Being Employed in a Green Occupation (Currently Employed or
Unemployed)(Originally Employed in Construction, Manufacturing, Related Services) 49
1
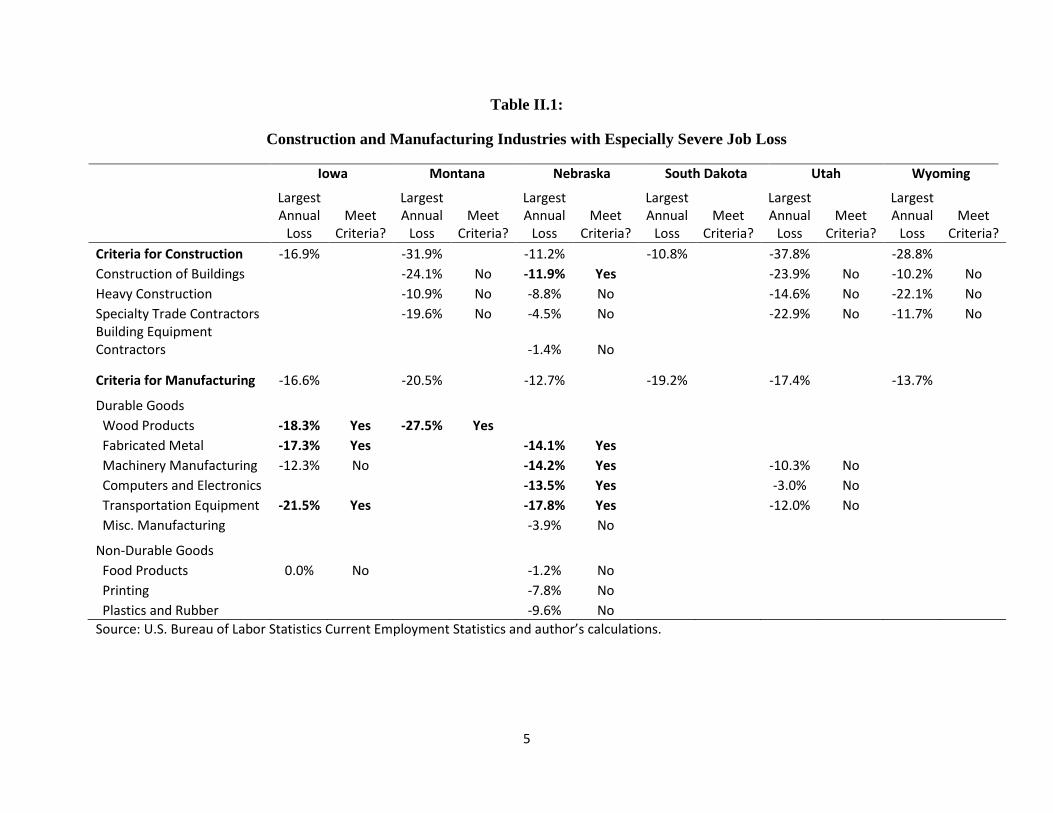
I. Introduction
As in most recessions, the manufacturing industry was hard hit during the “Great
Recession” of 2008. For example, in the State of Nebraska, net jobs losses in the manufacturing
industry accounted for 9,400 (33%) of the total 28,300 net job losses between December 2007
and December 2009. Further, given the severity of the recession it may take 3 to 4 years for
employment opportunities to normalize in the manufacturing sector. This is because net growth
in manufacturing employment is weak even in a strong economic climate (due to strong growth
in manufacturing productivity). Further, many recent manufacturing job losses will be permanent
due to industry restructuring that took place during the recession.
The construction sector was especially hard-hit during the recent recession, given the
substantial decline that occurred in the housing sector. Construction accounted for another 4,200
(15%) of the 28,300 net job loss in Nebraska. Construction employment grows in most years,
and typically bounces back sharply as an economy recovers from recession. However, in the
context of the recent recession, there is currently a large inventory of unsold homes and many
more foreclosures are expected. As a result, housing construction activity has not bounced back
even as the economy has begun to recover, and new home construction is not expected to recover
for a number of years. In fact, the contraction in the real estate sector has been so severe that
significant job losses ensued in related services industries such as finance, real estate, legal
services, architecture and engineering.
For these reasons, it is highly unlikely that sufficient new job opportunities will be
created within the manufacturing and construction industries to meet the needs of these
industries’ displaced workers, at least for the foreseeable future. Alternative employment
opportunities will need to be created in growing and emerging industries and occupations. This

2
study examines the potential for displaced manufacturing, construction, and construction-related
service workers to find re-employment opportunities within one such alternative: green
occupations.
The research specifically evaluates opportunities in the six consortium states but also
examines the issue at the national level. The first part of the analysis examines the potential
match between green occupations and hard-hit manufacturing, construction, and construction-
related service occupations in the six consortium states, utilizing a list of green occupations
specifically identified for the consortium states. The second part of the analysis examines the
actual re-employment rates of displaced workers into green occupations, and how worker
attributes influence the probability of re-employment in a green collar job. This part of the
research examines workers nationwide utilizing a national definition of green occupations
developed by the U.S. Department of Labor. In the third section, we develop a short document
for each consortium state to explain the re-employment opportunities in green occupations for
displaced manufacturing, construction, and construction-related service industry workers.

3
II: Potential Match among Occupations
This chapter examines the potential match between displaced workers from hard-hit
industries and green occupations. The approach is to determine if there is a match in theory
between green occupations and the occupations of displaced manufacturing, construction, and
construction-related service workers. The first step in this process is to identify the specific
manufacturing, construction, and construction-related service industry occupations which lost the
most employment during the recent recession. These hard-hit occupations then can be compared
with green occupations. Specifically, for each consortium state, we identify the hardest hit
occupations in the manufacturing, construction, and construction-related services industries
using of an industry-occupation employment matrix. This matrix contains an occupation profile
of workers in each industry in each state. By applying this matrix to estimates of job loss in each
manufacturing, construction, and construction-related service industry, we develop an estimate
of job loss by occupation for each state.
The analysis begins by assessing whether there are particular segments of the
manufacturing or construction industry in each state that experienced especially heavy job losses
during the recent recession. This information is critical in assessing the occupation mix of
displaced workers. In particular, if an industry experienced heavy job losses, then the key
occupations within that industry also would experience severe job losses.
We identified hard-hit industries within manufacturing and construction by comparing
industry growth rates with the aggregate growth rate for manufacturing and construction. In
particular, we were interested in identifying manufacturing industries with a job loss rate that
was more than one standard deviation above the aggregate job loss rate for manufacturing
overall. This was our criteria for identifying a hard-hit manufacturing industry. Comparisons

4
would be made for the year with largest percentage job loss in the 2007 to 2009 period. A similar
approach would be used to identify hard-hit construction industries.1
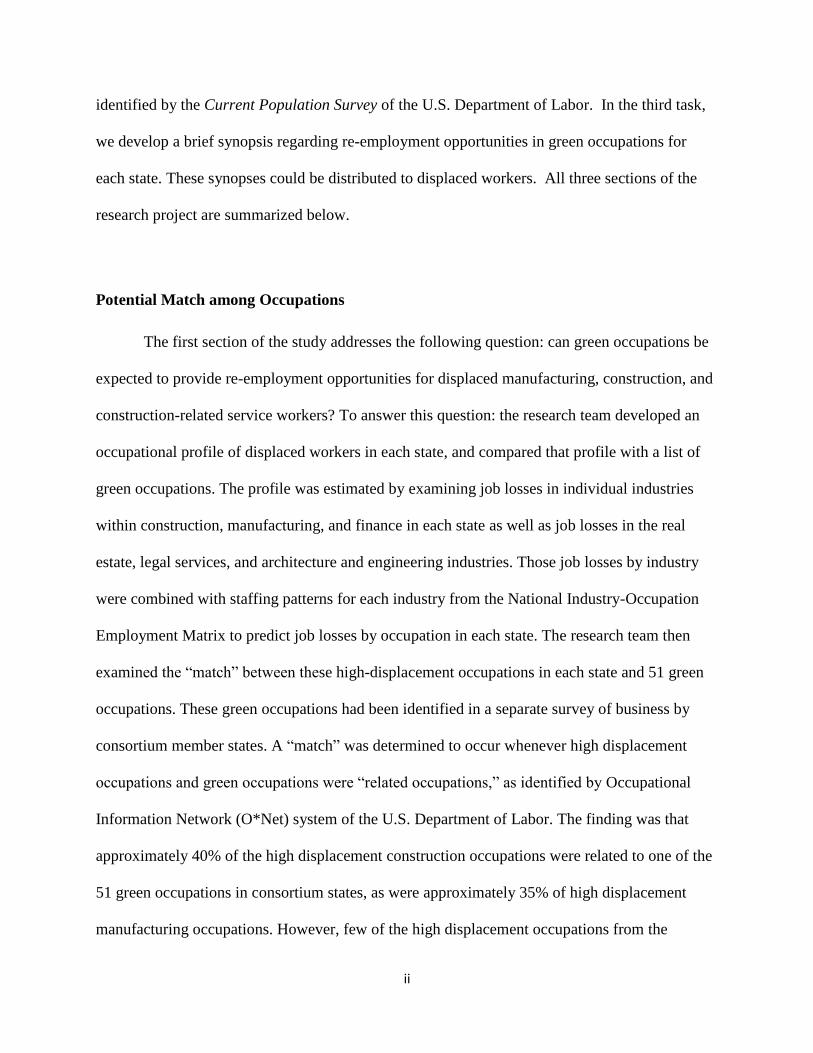
Table II.1 shows the criteria for each industry in each state, and whether each detailed
construction and manufacturing industry meets the criteria. Analysis focuses only on those
construction and manufacturing industries in each state with enough employment and
establishments to be reported in the Current Employment Statistics of the Bureau of Labor
Statistics, U.S. Department of Labor. This data is not available for a significant number of
smaller industries. However, our approach is still preferable given that there would be limited
value in a separate occupation analysis of small manufacturing industries with limited
employment.
The number of individual industries reported, and the results vary significantly by state.
However, two primary patterns are evident. First, construction job losses were much more severe
in the rocky mountain states than in the northern plains states. This is consistent with the notion
that rocky mountain and other western states were more involved in the national construction
boom and bust than plains states. Second, most hard-hit manufacturing industries were durable
goods manufacturers. This is typical in recessions.
1 It was unnecessary to perform this analysis for the construction-related service industries. As will be seen later,
there were only 3 detailed industries within finance, and no detailed industries within real estate, legal services, and architecture and engineering.
5
Table II.1:
Construction and Manufacturing Industries with Especially Severe Job Loss
Iowa Montana Nebraska South Dakota Utah Wyoming
Largest Annual
Loss Meet
Criteria?
Largest Annual
Loss Meet
Criteria?
Largest Annual
Loss Meet
Criteria?
Largest Annual
Loss Meet
Criteria?
Largest Annual
Loss Meet
Criteria?
Largest Annual
Loss Meet
Criteria?
Criteria for Construction -16.9%
-31.9%
-11.2%
-10.8%
-37.8%
-28.8% Construction of Buildings
-24.1% No -11.9% Yes
-23.9% No -10.2% No
Heavy Construction
-10.9% No -8.8% No
-14.6% No -22.1% No
Specialty Trade Contractors
-19.6% No -4.5% No
-22.9% No -11.7% No Building Equipment Contractors
-1.4% No
Criteria for Manufacturing -16.6%
-20.5%
-12.7%
-19.2%
-17.4%
-13.7%
Durable Goods Wood Products -18.3% Yes -27.5% Yes
Fabricated Metal -17.3% Yes
-14.1% Yes Machinery Manufacturing -12.3% No
-14.2% Yes
-10.3% No
Computers and Electronics
-13.5% Yes
-3.0% No Transportation Equipment -21.5% Yes
-17.8% Yes
-12.0% No
Misc. Manufacturing
-3.9% No Non-Durable Goods
Food Products 0.0% No
-1.2% No Printing
-7.8% No
Plastics and Rubber -9.6% No
Source: U.S. Bureau of Labor Statistics Current Employment Statistics and author’s calculations.

6
Looking at state specific results, several Iowa manufacturing industries met the criteria of
a hard-hit industry. The durable goods industries of wood products, fabricated metal, and
transportation equipment met the criteria. There were similar findings in Nebraska. In Nebraska,
durable goods industries such as fabricated metals, machinery, computers and electronics and
transportation equipment were hard-hit while non-durable industries such as food products were
not hard-hit. Construction of buildings was the only specific construction industries which met
the criteria for being a hard-hit industry. No specific construction industries met the criteria in
Montana. Little information was available for individual construction and manufacturing
industries in Wyoming, and no information was available in South Dakota. Information on
specific industries was available in Utah; however, job losses in Utah were consistent across
individual construction and manufacturing industries. No industries were especially hard-hit.
Information in Table II.1 is used to inform estimates of displacement within individual
construction and manufacturing industries. In particular, industries that met the criteria for
identification as hard-hit hit were assumed to lose employment at their own, industry specific
rate. All other construction and manufacturing industries were assumed to shed jobs at the same
rate. Job losses rates were calculated based on the percentage decline in employment between
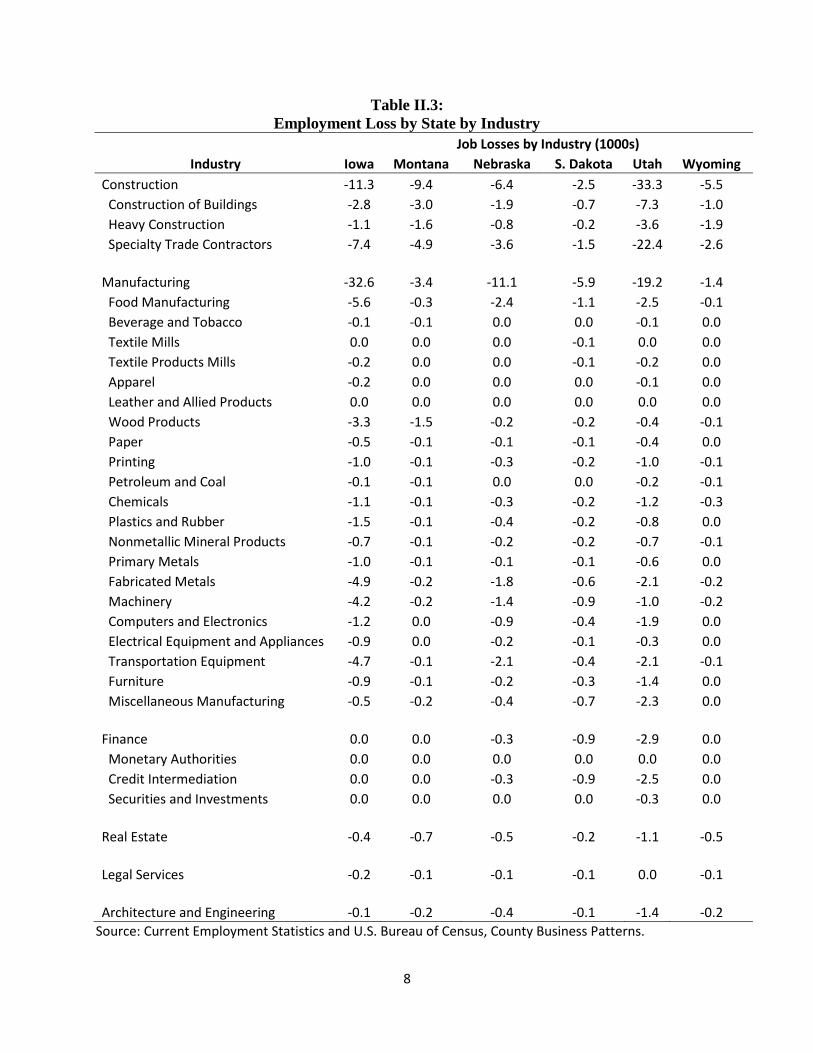
December 2007 and December 2009. Table II.2 shows the rate of decline for each specific
manufacturing, construction, and construction-related service industry in each consortium state.
Percentage losses were applied to Current Employment Survey estimates of employment in each
industry in each state as of December 2007. The result was an estimate of the total number of job
losses in each industry in each state, as shown in Table II.3. Note that when employment levels
were not provided by the Current Employment Survey, the level was estimated based on data
from the March 2008 County Business Patterns data from the U.S. Department of Commerce.

7
Table II.2:
Employment Loss Rates by State by Industry
Industry Iowa Montana Nebraska South
Dakota Utah Wyoming
Construction -15.8% -30.4% -13.0% -11.1% -33.4% -20.1%
Construction of Buildings -15.8% -30.4% -17.6% -11.1% -33.4% -20.1%
Heavy Construction -15.8% -30.4% -11.7% -11.1% -33.4% -20.1%
Specialty Trade Contractors -15.8% -30.4% -11.7% -11.1% -33.4% -20.1%
Manufacturing -14.1% -16.5% -10.8% -14.0% -14.7% -13.6%
Food Manufacturing -11.0% -11.6% -7.1% -14.0% -14.7% -13.6%
Beverage and Tobacco -11.0% -11.6% -7.1% -14.0% -14.7% -13.6%
Textile Mills -11.0% -11.6% -7.1% -14.0% -14.7% -13.6%
Textile Products Mills -11.0% -11.6% -7.1% -14.0% -14.7% -13.6%
Apparel -11.0% -11.6% -7.1% -14.0% -14.7% -13.6%
Leather and Allied Products -11.0% -11.6% -7.1% -14.0% -14.7% -13.6%
Wood Products -27.5% -35.7% -7.1% -14.0% -14.7% -13.6%
Paper -11.0% -11.6% -7.1% -14.0% -14.7% -13.6%
Printing -11.0% -11.6% -7.1% -14.0% -14.7% -13.6%
Petroleum and Coal -11.0% -11.6% -7.1% -14.0% -14.7% -13.6%
Chemicals -11.0% -11.6% -7.1% -14.0% -14.7% -13.6%
Plastics and Rubber -11.0% -11.6% -7.1% -14.0% -14.7% -13.6%
Nonmetallic Mineral Products -11.0% -11.6% -7.1% -14.0% -14.7% -13.6%
Primary Metals -11.0% -11.6% -7.1% -14.0% -14.7% -13.6%
Fabricated Metals -22.9% -11.6% -20.5% -14.0% -14.7% -13.6%
Machinery -11.0% -11.6% -13.7% -14.0% -14.7% -13.6%
Computers and Electronics -11.0% -11.6% -17.0% -14.0% -14.7% -13.6% Electrical Equipment and Appliances -11.0% -11.6% -7.1% -14.0% -14.7% -13.6%
Transportation Equipment -25.4% -11.6% -22.6% -14.0% -14.7% -13.6%
Furniture -11.0% -11.6% -7.1% -14.0% -14.7% -13.6%
Miscellaneous Manufacturing -11.0% -11.6% -7.1% -14.0% -14.7% -13.6%
Finance 3.7% 3.1% -1.1% -4.2% -7.0% 0.0%
Monetary Authorities 3.7% 3.1% -1.1% -4.2% -7.0% 0.0%
Credit Intermediation 3.7% 3.1% -1.1% -4.2% -7.0% 0.0%
Securities and Investments 3.7% 3.1% -1.1% -4.2% -7.0% 0.0%
Real Estate -2.9% -11.3% -5.3% -4.2% -8.4% -11.4%
Legal Services -2.1% -4.1% -0.9% -4.3% 10.5% -6.3%
Architecture and Engineering -2.1% -4.1% -6.2% -4.3% -10.4% -6.9%
Source: U.S. Bureau of Labor Statistics Current Employment Statistics and author’s calculations.
8
Table II.3:
Employment Loss by State by Industry
Job Losses by Industry (1000s)
Industry Iowa Montana Nebraska S. Dakota Utah Wyoming
Construction -11.3 -9.4 -6.4 -2.5 -33.3 -5.5
Construction of Buildings -2.8 -3.0 -1.9 -0.7 -7.3 -1.0
Heavy Construction -1.1 -1.6 -0.8 -0.2 -3.6 -1.9
Specialty Trade Contractors -7.4 -4.9 -3.6 -1.5 -22.4 -2.6
Manufacturing -32.6 -3.4 -11.1 -5.9 -19.2 -1.4
Food Manufacturing -5.6 -0.3 -2.4 -1.1 -2.5 -0.1
Beverage and Tobacco -0.1 -0.1 0.0 0.0 -0.1 0.0
Textile Mills 0.0 0.0 0.0 -0.1 0.0 0.0
Textile Products Mills -0.2 0.0 0.0 -0.1 -0.2 0.0
Apparel -0.2 0.0 0.0 0.0 -0.1 0.0
Leather and Allied Products 0.0 0.0 0.0 0.0 0.0 0.0
Wood Products -3.3 -1.5 -0.2 -0.2 -0.4 -0.1
Paper -0.5 -0.1 -0.1 -0.1 -0.4 0.0
Printing -1.0 -0.1 -0.3 -0.2 -1.0 -0.1
Petroleum and Coal -0.1 -0.1 0.0 0.0 -0.2 -0.1
Chemicals -1.1 -0.1 -0.3 -0.2 -1.2 -0.3
Plastics and Rubber -1.5 -0.1 -0.4 -0.2 -0.8 0.0
Nonmetallic Mineral Products -0.7 -0.1 -0.2 -0.2 -0.7 -0.1
Primary Metals -1.0 -0.1 -0.1 -0.1 -0.6 0.0
Fabricated Metals -4.9 -0.2 -1.8 -0.6 -2.1 -0.2
Machinery -4.2 -0.2 -1.4 -0.9 -1.0 -0.2
Computers and Electronics -1.2 0.0 -0.9 -0.4 -1.9 0.0
Electrical Equipment and Appliances -0.9 0.0 -0.2 -0.1 -0.3 0.0
Transportation Equipment -4.7 -0.1 -2.1 -0.4 -2.1 -0.1
Furniture -0.9 -0.1 -0.2 -0.3 -1.4 0.0
Miscellaneous Manufacturing -0.5 -0.2 -0.4 -0.7 -2.3 0.0
Finance 0.0 0.0 -0.3 -0.9 -2.9 0.0
Monetary Authorities 0.0 0.0 0.0 0.0 0.0 0.0
Credit Intermediation 0.0 0.0 -0.3 -0.9 -2.5 0.0
Securities and Investments 0.0 0.0 0.0 0.0 -0.3 0.0
Real Estate -0.4 -0.7 -0.5 -0.2 -1.1 -0.5
Legal Services -0.2 -0.1 -0.1 -0.1 0.0 -0.1
Architecture and Engineering -0.1 -0.2 -0.4 -0.1 -1.4 -0.2
Source: Current Employment Statistics and U.S. Bureau of Census, County Business Patterns.

9
Industry job losses would imply estimates of occupation job losses, depending on the
types of occupations found in each industry. We utilized the National Industry-Occupation
Employment Matrix that is developed by the Bureau of Labor Statistics, U.S. Department of
Labor to estimate the occupation job losses associated with the industry job losses reported in
Table II.3. Occupation job losses were summed for all industries listed in Table II.3. Table II.4a
shows all occupations which accounted for at least 2% of all job losses in the construction
industry in each state. Table II.4c shows all occupations which accounted for at least 2% of all
job losses in construction-related service industries. Table II.4b shows all occupations which
accounted for at least 1% of job losses in the manufacturing industry in each state. Occupations
common to manufacturing such as production workers are presented in much greater detail in the
SOC coding system, and therefore, it is much less likely that any one occupation would account
for 2% or more of employment. Therefore, a 1% criterion was adopted instead.
Results in Table II4a through II.4c show a large number of hard-hit occupations in the
construction, manufacturing, and construction-related services industries. One notable feature of
the results is the relative consistency of the hard-hit occupations across states. This in part
reflects the reality that some functions are common to most types of industries. For example,
most industries require managers, bookkeepers, and office clerks.
There also were occupations common within construction, or within manufacturing, or
within construction-related services. Looking at Table II4a, construction managers (11-9021)
were a hard-hit occupation in all states, as were secretaries and administrative assistants (43-
6014). Further, in the construction industry the same hard-hit trade occupations were found in
most states. Carpenters (47-2031), cement masons and concrete finishers (47-2051), operating
engineers (47-2073), electricians (47-2111), painters (47-2141), plumbers, pipefitters and

10
steamfitters (47-2152), and HVAC (49-9021) were hard-hit occupations in all consortium states.
This occurred because the underlying structure of the construction industry was consistent across
states. This can be seen with a quick review of Tables II.2 and II.3. Within each state, there was
typically a common rate of job loss across the construction industries; and in most states, there
was a similar employment structure, with around half to two-thirds of the job losses in the
specialty trades.
Table II.4a
Occupations with the Largest Projected Losses within the Construction Industry
Hard-Hit Occupations within Construction
Industry SOC Code Iowa Montana Nebraska
South Dakota Utah Wyoming
General and Operations Managers 11-1021
X Construction Managers 11-9021 X X X X X X
Bookkeeping, Accounting and Auditing Clerks 43-3031 X
X X
Secretaries and Administrative Assistants 43-6014 X X X X X X
General Office Clerks 43-9061 X X X X X X
First-line Supervisors of Construction Trades 47-1011 X X X X X X
Carpenters 47-2031 X X X X X X
Cement Masons and Concrete Finishers 47-2051 X X X X X X
Construction Laborers 47-2061 X X X X X X
Operating Engineers and Other Construction Equipment Operators 47-2073 X X X X X X
Electricians 47-2111 X X X X X X
Painters Construction and Maintenance 47-2141 X X X X X X
Plumbers, Pipefitters and Steamfitters 47-2152 X X X X X X
Heating, Air Conditioning and Refrigeration Mechanics and Installers 49-9021 X X X X X X
Heavy and Tractor-Trailer Truck Drivers 53-3032 X

11
A number of occupations also are common to most or all manufacturing industries and
therefore were identified for all states in Table II.4b. Most or all manufacturing industries rely on
occupations such as industrial machinery mechanics (49-9041), general maintenance and repair
workers (49-4071), team assemblers (51-2022), machinists (51-4041), welders, cutters, solderers,
and brazers (51-4121), inspectors, testers, sorters, samplers, and weighers (51-9061), packaging
and filling machine operators and tenders (51-9111), or helpers for production workers (51-
9198). Most or all manufacturers also employ engineers (17-2112 or 17-2141), require a sales
staff to work with wholesalers (41-4012) or utilize truck drivers (53-3032 or 53-7051).
However, there is also a great deal of variety within manufacturing. In particular, results
reflect the types of industries that lost the most employment in each state and the unique
occupational make-up within those industries. For example, wood products accounted for nearly
half of the manufacturing job loss in Montana from December 2007 to December 2009 (see
Table II.3) and we observe a number of sawmill occupations among the hardest-hit occupations
in Montana. Food production occupations such as meat cutters and trimmers (51-3022) and
slaughters and meatpackers (51-3023) were among the hard-hit occupations in states such as
Iowa, Nebraska, South Dakota, and Utah. These state had significant job losses in food
processing industries. .Woodworking occupations (51-7041 and 51-7042) were hard-hit in
Montana, a state with a significant share of job losses in the wood products industry. At the same
time, Wyoming was the only state with a significant share of its job losses in the petroleum and
coal industry, and several related occupations appear in Table II.4b (51-9011, 51-8093 and 51-
9023).

12
Table II.4b
Occupations with the Largest Projected Losses within the Manufacturing Industry
Hard-Hit Occupations within Manufacturing
Industry SOC Code Iowa Montana Nebraska
South Dakota Utah Wyoming
General and Operations Managers 11-1021 X X X X X X
Industrial Production Managers 11-3051 X
X X
Industrial Engineers 17-2112 X
X X X Mechanical Engineers 17-2141 X
X X
Sales Representatives, Wholesale and Manufacturing 41-4012 X X X X X X
Bookkeeping, Accounting and Auditing Clerks 43-3031 X X
X X X
Customer Service Representatives 43-4051
X Shipping Receiving and Traffic
Clerks 43-5071 X X X X X X
General Office Clerks 43-9061 X X X X X X
Boilermakers 47-2011
X Industrial Machinery Mechanics 49-9041 X X X X X X
General Maintenance and Repair Workers 49-9071 X X X X X X
Helpers - Installation, Maintenance and Repair Workers 49-9098 X X X X X
First-line Supervisors of Production and Operations Workers 51-1011 X X X X X X
Electric and Electronic Equipment Assemblers 51-2022 X X X X X
Structural Metal Fabricators and Fitters 51-2041 X
X X X
Team Assemblers 51-2092 X X X X X X
All Other Assemblers and Fabricators 51-2099 X X X X X
Meat, Poultry, and Fish Cutters and Trimmers 51-3022 X
X X X
Slaughters and Meatpackers 51-3023 X
X X Food Batchmakers 51-3092
X X
Computer Controlled Machine Tool Operator Metal and Plastic 51-4011 X
X X
Cutting, Punching, and Press Machine Setters, Operators and Tenders Metal and Plastic 51-4031 X
X X X X
Machinists 51-4041 X X X X X X

13
Table II.4b (Continued)
Occupations with the Largest Projected Losses within the Manufacturing Industry
Hard-Hit Occupations within Manufacturing
Industry SOC Code Iowa Montana Nebraska
South Dakota Utah Wyoming
Welders, Cutters, Solderers and Brazers 51-4121 X X X X X X
Printing Press Operator 51-5112
X X
Fabric and Apparel Patternmakers 51-6092
X Sawing Machine Setters,
Operators, and Tenders Wood 51-7041
X Woodworking Machine Setters,
Operators, and Tenders 51-7042 X X Petroleum Pump Systems
Operator and Refinery Operations Gaugers 51-8093
X
Chemical Equipment Operators and Tenders 51-9011
X
Mixing and Blending Machine Operators and Tenders 51-9023
X
Inspectors, Testers, Sorters, Samplers, and Weighers 51-9061 X X X X X X
Packaging and Filling Machine Operators and Tenders 51-9111 X X X X X X
Helpers - Production Workers 51-9198 X X X X X X
Production Workers All Other 51-9199 X X X X X X
Heavy and Tractor-Trailer Truck Drivers 53-3032 X X
X X X
Industrial Truck and Tractor Operators 53-7051 X X X X X X
Laborers and Freight Stock and Material Movers Hand 53-7062 X X X X X X
Machine Feeders and Offbearers 53-7063
X Packers and Packagers Hand 53-7064 X X X X X X
There also was significant variety in the hard-hit occupations within the construction-
related services industries, as seen in Table II.4c. As was seen in Table II.2, the finance industry
only lost employment in Nebraska, South Dakota, and Utah. As a result, finance occupations
such as loan officers (13-2072) tellers (43-3071), customer services representatives (43-4051),

14
and loan interviews and clerks (43-4131) were only identified as hard-hit in these states in Table
II.4c. Similarly, lawyers (23-1011) were identified as hard-hit in every state except Utah, since
Utah was the only state without net job losses for the legal services industry. Common
occupations in the real estate and architecture and engineering industries were identified as hard-
hit in most states since these industries lost jobs in every state. Examples of hard-hit occupations
include real estate agents (41-9022) and civil engineers (17-2051)
Thinking about Tables II.4a, through II.4c, the question arises: which of these hard hit
occupations are matched with green occupations? This question is answered in Table II.5. The
table shows which hard-hit occupations were matched with a consortium state green occupation.
These green occupations were defined as those occupations with at least 15% of the workforce
involved in green activities. Each consortium state conducted a survey of businesses and asked
about the number of workers involved in green activities. Specifically, the survey inquired how
many employees “produce a product or service that improves energy efficiency, expands the use
of renewable energy, or supports environmental sustainability.”
The consortium developed a region-wide estimate of the share of workers in each
occupation which are involved in green activities. We identified 61 occupations from the
consortium list with at least 15% of employment in green activities and where data on total
employment in that occupation was available (from the U.S. Department of Labor) for at least 4
states. Unfortunately, this data was not available for all states. Given such missing data, our
research team conducted further analysis utilizing estimates of green employment by occupation
from three consortium states where we had access to state-specific results (Iowa, Nebraska, and
Utah). As a result of that further analysis, we narrowed the original list of 61 occupations to 51
occupations. The list of 51 occupations is provided in Appendix 1.

15
Table II.4c
Occupations with the Largest Projected Losses within
Construction-Related Service Industries
Hard-Hit Occupations within Construction-Related Services
Industry SOC Code Iowa Montana Nebraska S. Dakota Utah Wyoming
General and Operations Managers 11-1021
X Financial Managers 11-3031
X X
Property Real Estate and Community Association Managers 11-9141 X X X
X X
Loan Officers 13-2072
X X X Civil Engineers 17-2051
X X
X X
Lawyers 23-1011 X X X X
X
Paralegals and Legal Assistants 23-2011 X
X
Janitors and Cleaners except Maids and Housekeepers 37-2011 X X X
X
Counter and Rental Clerks 41-2021 X X X
X
Securities Commodities and Financial Services Sales Agents 41-3031
X X
Real Estate Agents 41-9022 X X X
X
First-line Supervisors of Office and Administrative Support Workers 43-1011
X X X
Bill and Account Collectors 43-3011
X Bookkeeping, Accounting and
Auditing Clerks 43-3031 X X X X X X
Tellers 43-3071
X X X
Customer Service Representatives 43-4051
X X X Loan Interviewers and Clerks 43-4131
X X
Receptionists and Information Clerks 43-4171 X
Executive Secretaries and Administrative Assistants 43-6011 X X X
X X
Legal Secretaries 43-6012 X
X
Secretaries and Administrative Assistants, Except Legal, Medical and Executive 43-6014 X X X
X X
Office Clerks General 43-9061 X X X X X X
Maintenance and Repair Workers General 49-9071 X X X X X X
16
The research team then compared the list of hard-hit occupations from Tables II.4a
through II.4c with these 51 green occupations for consortium states. The comparison was meant
to determine if each hard-hit occupation was “matched” to one of the 51 green occupations. Such
a match could occur in one of two ways. First, some of the hard-hit occupations identified in
Tables II.4a through II.4c were themselves on the list of 51 green occupations identified in the
consortium state survey. These hard-hit occupations also were green occupations. While jobs are
lost in older manufacturing industries, these same occupations could be gaining jobs in green
industries. The second type of match could occur when a hard-hit occupation from a
manufacturing, construction, or construction-related service industry was related to a green
occupation. In other words, if there is a substantial possibility that a manufacturing, construction,
or related services worker could switch into a green occupation due to similar skills and other job
characteristics. For each of the 51 green occupations, we gathered the names of occupations
declared to be “related occupations” by the U.S. Department of Labor as part of its O*Net
system. We identified a “match” between a green occupation and a hard-hit occupation when
that hard-hit occupation was listed as a related occupation by O*Net for one or more of the 51
green occupations.
Table II.5 lists the hard-hit occupations from Tables II.4a through 4c that had a match
with one or more of the 51 green occupations identified by the consortium. Such a match was
identified for around 35% and 40% of manufacturing and construction workers, respectively. In
other words, we found substantial evidence that displaced construction and manufacturing
industry workers have potential to find a new job in a green occupation. However, only 2 of the
hard-hit construction-related services occupations were found to have match with one of the 51
green occupations.

17
Table II.5
Occupations with Largest Projected Job Loss That Match One or More Green Occupations
Hard-Hit Occupations That Match a Green Occupation
Industry Name SOC Code Iowa Montana Nebraska
South Dakota Utah Wyoming
Within Construction Industry Construction Managers 11-9021 X X X X X X
First-line Supervisors of Construction Trades 47-1011 X X X X X X
Operating Engineers and Other Construction Equipment Operators 47-2073 X X X X X X
Electricians 47-2111 X X X X X X
Heating, Air Conditioning and Refrigeration Mechanics and Installers 49-9021 X X X X X X
Heavy and Tractor-Trailer Truck Drivers 53-3032
X
Within Manufacturing Industry Mechanical Engineers 17-2141 X
X X
Helpers - Installation, Maintenance and Repair Workers 49-9098 X X X X X
First-line Supervisors of Production and Operations Workers 51-1011 X X X X X X
Electric and Electronic Equipment Assemblers 51-2022 X X X X X
Structural Metal Fabricators and Fitters 51-2041 X
X X X
Computer Controlled Machine Tool Operator Metal and Plastic 51-4011 X
X X
Cutting, Punching, and Press Machine Setters, Operators and Tenders Metal and Plastic 51-4031 X
X X X X
Welders, Cutters, Solderers and Brazers 51-4121 X X X X X X

18
Table II.5 (Continued)
Occupations with Largest Projected Job Loss That Match One or More Green Occupations
Hard-Hit Occupations That Match a Green Occupation
Industry Name SOC Code Iowa Montana Nebraska
S. Dakota Utah Wyoming
Woodworking Machine Setters, Operators, and Tenders 51-7042 X X
Petroleum Pump Systems Operator and Refinery Operations Gaugers 51-8093
X
Chemical Equipment Operators and Tenders 51-9011
X
Production Workers All Other 51-9199 X X X X X X
Heavy and Tractor-Trailer Truck Drivers 53-3032 X X
X X X
Laborers and Freight Stock and Material Movers Hand 53-7062 X X X X X X
Packers and Packagers Hand 53-7064 X X X X X X
Within Construction-Related Services Industries Property Real Estate and
Community Association Managers 11-9141 X X X
X X
Civil Engineers 17-2051 X X X X
Another natural question is: what are these matched green occupations? This issue is
addressed in Table II.6, which shows the green occupations which were matched with at least 1
hard-hit occupation from the construction, manufacturing, or construction-related services
industry. The number of occupations is larger than in Table II.5 since some hard-hit occupations
are matched with more than one green occupation. As is evident in Table II.6, there are
opportunities in a variety of professional and skilled trade occupations. Displaced workers from
these industries may look for re-employment opportunities in these green occupations. In fact, in
the summary chapter for this report we provide a brief write-up for each state listing the potential
matched green occupations for displaced manufacturing, construction, or related services
workers. However, before that, in the next chapter we discuss how the characteristics of

19
displaced workers from across the nation influence their ability to gain re-employment in green
occupations. Given this focus on workers nationwide, the next chapter utilizes a national
definition of green occupations developed by the U.S. Department of Labor.
Table II.6
Green Occupations for Displaced
Manufacturing, Construction, and Construction-Related Service Industry Workers
Matched Green Occupations
Industry Name SOC Code Iowa Montana Nebraska
South Dakota Utah Wyoming
Within Construction Industry Construction Managers 11-9021 X X X X X X
Electricians 47-2111 X X X X X X
Hazardous Materials Removal Workers 47-4041
X
Earth Drillers, Except Oil and Gas 47-5021 X X X X X X
Bicycle Repairers 49-3091 X X X X X X
Heating, Air Conditioning and Refrigeration Mechanics and Installers 49-9021 X X X X X X
Home Appliance Repairers 49-9031 X X X X X X
Within Manufacturing Industry Natural Sciences Managers 11-9121 X X X X X X
Architects 17-1011 X
X X Environmental Science and
Protection Technicians, Including Health 19-4091
X
Pesticide Handlers, Sprayers, and Applicators, Vegetation 37-3012
X
Tree Trimmers and Pruners 37-3013 X X X X X X
Farmworkers and Laborers, Crop, Nursery, and Greenhouse 45-2092 X X X X X
Floor Layers, Except Carpet, Wood, and Hard Tiles 47-2042 X X X X X X
Electricians 47-2111 X X X X X Glaziers 47-2120 X X X X X X

20
Table II.6 (Continued)
Green Occupations for Displaced
Manufacturing, Construction, and Construction-Related Service Industry Workers
Matched Green Occupations
Industry Name SOC Code Iowa Montana Nebraska
S. Dakota Utah Wyoming
Helpers - Electricians 47-3031 X X X X X X
Hazardous Material Removal Workers 47-4041 X X
X X X
Riggers 49-9096 X X X X X X
Coil Winders, Tapers, and Finishers 51-2021 X
X X X X
Structural Metal Fabricators and Fitters 51-2041 X X X X X X
Molding, Coremaking, and Casting Machine Setters, Operators, and Tenders, Metal and Plastic 51-4072 X X X X X X
Water and Liquid Waste Treatment Plant and System Operators 51-8031
X
Separating, Filtering, Clarifying, Precipitating, and Still Machine Setters, Operators, and Tenders 51-9012 X
X X X X
Production Workers All Other 51-9199 X X X X X X
Within Construction-Related Services Industries Construction Managers 11-9021 X X X
X X
Architects 17-1011
X X
X X
Civil Engineers 17-2051
X X
X X
Health and Safety Engineers, Except Mining Safety Engineers and Inspectors 17-2111 X X X X

21
III. Observed Match among Occupations: Factors Influencing the Probability of a Match
This section looks for evidence of occupation switching – especially switching into green
occupations – in the wake of the Great Recession of 2008. We begin by investigating whether
displaced persons were able to find new employment in green occupations. Then we narrow the
focus to examine the experiences of persons displaced from industries hit especially hard by the
Great Recession, namely, manufacturing, construction, and services related to construction; the
“related service” industries include (1) architecture & engineering, (2) finance, (3) real estate,
and (4) legal services. How likely were persons displaced from these “recession” industries to
find re-employment in green jobs?
To identify occupation switching behavior, we employed data from two January 2010
surveys: (1) the Current Population Survey (CPS) and (2) the Displaced Workers Survey
(DWS). The CPS is a monthly survey of households conducted by the Bureau of Census for the
Bureau of Labor Statistics (BLS). According to the BLS web site (www.bls.gov/cps) this
monthly survey of the population provides a comprehensive body of data on persons in and out
of the labor force, as well as comprehensive data on employment, hours of work, earnings,
unemployment, and other demographic and labor force characteristics. The CPS asks
respondents many detailed questions about their personal characteristics, labor force status, and
thus for each month provides researchers with rich data on labor market performance.
Every other January the CPS is supplemented by a survey known as the Displaced
Workers Survey (DWS). This survey focuses specifically on the circumstances and
characteristics of job losers (see www.bls.gov/cps/lfcharacteristics.htm for details). Displaced
workers are defined as persons aged 20 years of age and older who lost or left jobs because (1)
their plant or company closed or moved, (2) there was insufficient work for them to do, or (3)
their position or shift was abolished. The most recent DWS was conducted in January 2010,
22
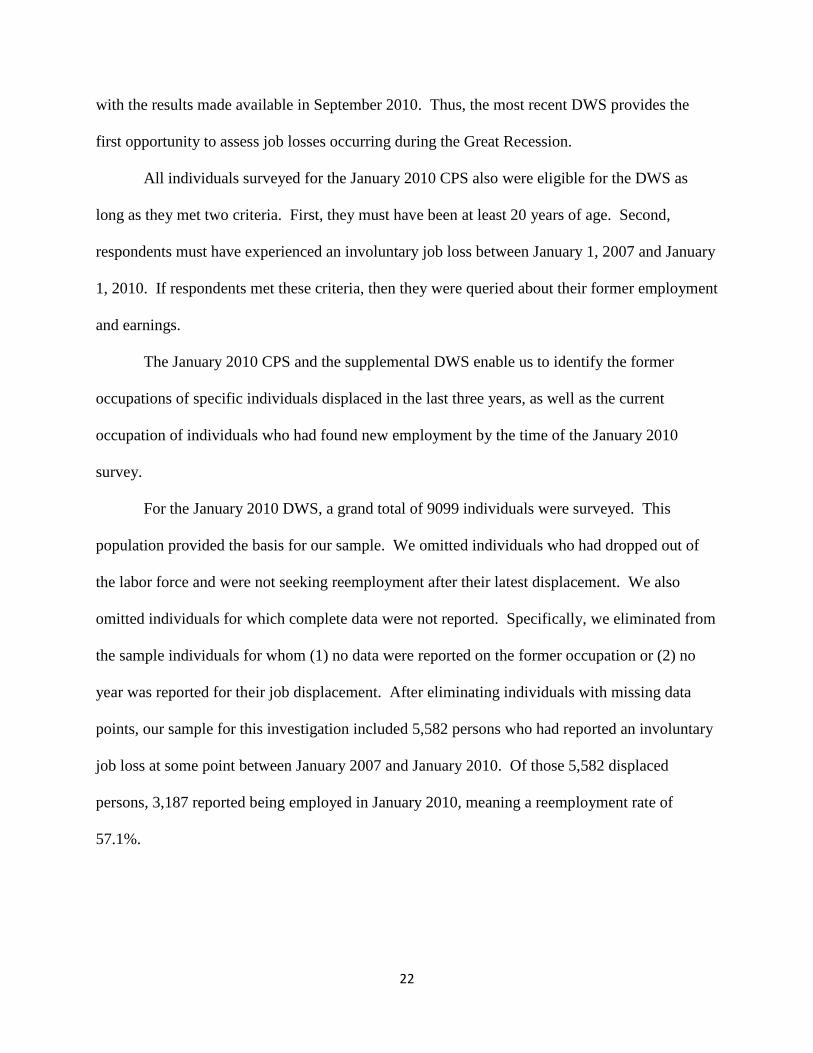
with the results made available in September 2010. Thus, the most recent DWS provides the
first opportunity to assess job losses occurring during the Great Recession.
All individuals surveyed for the January 2010 CPS also were eligible for the DWS as
long as they met two criteria. First, they must have been at least 20 years of age. Second,
respondents must have experienced an involuntary job loss between January 1, 2007 and January
1, 2010. If respondents met these criteria, then they were queried about their former employment
and earnings.
The January 2010 CPS and the supplemental DWS enable us to identify the former
occupations of specific individuals displaced in the last three years, as well as the current
occupation of individuals who had found new employment by the time of the January 2010
survey.
For the January 2010 DWS, a grand total of 9099 individuals were surveyed. This
population provided the basis for our sample. We omitted individuals who had dropped out of
the labor force and were not seeking reemployment after their latest displacement. We also
omitted individuals for which complete data were not reported. Specifically, we eliminated from
the sample individuals for whom (1) no data were reported on the former occupation or (2) no
year was reported for their job displacement. After eliminating individuals with missing data
points, our sample for this investigation included 5,582 persons who had reported an involuntary
job loss at some point between January 2007 and January 2010. Of those 5,582 displaced
persons, 3,187 reported being employed in January 2010, meaning a reemployment rate of
57.1%.

23
Green Occupations
To proceed we also had to specify what exactly constitutes “green” employment. To
identify “green” occupations objectively, we relied on the Occupational Information Network
(O*Net) classification system developed by the U.S. Department of Labor. O*Net is the Federal
Government’s effort to analyze occupational structure and to provide a national occupational
classification system (O*Net succeeded the Dictionary of Occupational Titles, for details see
www.bls.gov/oco/oco2007.htm).
According to O*Net, the “green” economy involves economic activity related to (1)
reducing the use of fossil fuels, (2) decreasing pollution and greenhouse gas emissions, (3)
increasing the efficiency of energy usage, (4) recycling materials, or (5) developing and adopting
renewable sources of energy (see www.onetcenter.org/green.html?p=2).
Because of green economy activities there may be increased demand for existing
occupations, which O*Net classifies as “Green Increased Demand Occupations.” In other
words, the work context may become green but the tasks performed are not altered. Examples of
such occupations include construction carpenters, engine and other machine assemblers, and
industrial safety and health engineers.
Green activities also might require changes to the work or worker requirements of an
existing occupation, which O*Net classifies as “Green Enhanced Skills Occupations.” Put
another way, the nature of the work remains the same but some task, skill, knowledge, or
credential is altered by green activity. Examples of these enhanced skills occupations include
civil engineers and electrical engineers, landscape architects, plumbers, roofers, sheet metal
workers, heating and air conditioning mechanics and installers.

24
Finally, green activities may create new occupations altogether, which according to
O*Net are “Green New and Emerging Occupations.” Such occupations may be newly formed or
spring from some previously existing occupation. These new occupations would include fuel
cell engineers and wind energy engineers, weatherization installers and technicians, recycling
and reclamation workers, and biomass plant technicians.
The O*Net web site reports a total of 217 occupations as green, out of 965 occupations
overall. Because O*Net is the only nationally recognized system for identifying green
occupations, we used the O*Net system to classify occupations.
Displaced Workers Who Found New Jobs: Displaced from Any Industry
Descriptive Statistics. For the January 2010 DWS, there are 5,582 workers who reported
an involuntary job loss between January 1, 2007 and January 1, 2010 and for whom complete
records are available. Of those job losers, 3,187 were re-employed again at the time of the
January 2010 DWS. Descriptive statistics for these 3,187 job finders are presented in Table
III.1.
The detailed CPS/DWS survey data allow us to control for much demographic
information. For example, the average age of a displaced worker is 40.5 years. Most job losers
(83%) were displaced from full-time jobs (35 or more hours/week). More than 36% of these
displaced workers became re-employed in green occupations. Only 8% of the displaced workers
moved to obtain re-employment.
Not only can we identify a person’s gender, we can also identify marital status and
whether or not the respondent had any children. Focusing on these particular demographic
characteristics, the majority of the sample is male (60.2%). Most of those surveyed are married
(55.5%). Roughly two-fifths of the sample had any children (39.8%). The most common group

25
Table III.1
Displaced Workers Who Found Jobs: Descriptive Statistics
Number Mean Std. Dev.
Working in Green Occupation 1,158 .3634 .4810
Worked > 35hrs/wk in old job 2,646 .8302 .3755
Moved for Job 269 .0844 .2780
Single male no children 670 .2102 .4075
Single male with children 84 .0264 .1602
Married male no children 473 .1484 .3556
Married male with children 693 .2174 .4126
Single woman no children 484 .1519 .3589
Single woman with children 179 .0562 .2303
Married woman no children 291 .0913 .2881
Married woman with children 313 .0982 .2976
Age 40.5526 12.1094
Any Children 1,269 .3982 .4896
Less than High School 265 .0832 .2762
HS Grad or GED 942 .2956 .4564
Some College 651 .2043 .4032
Associate Degree 392 .1230 .3285
Bachelor Degree 670 .2102 .4075
Master Degree 200 .0628 .2426
Professional Degree 45 .0141 .1180
Doctoral Degree 22 .0069 .0828
Construction 422 .1324 .3390
Manufacturing 508 .1594 .3661
Finance 143 .0449 .2071
Real Estate 50 .0157 .1243
Architects & Engineers 53 .0166 .1279
Legal Services 49 .0154 .1231
Nebraska 43 .0135 .1154
Montana 42 .0132 .1141
Iowa 52 .0163 .1267
South Dakota 56 .0176 .1314
Utah 42 .0132 .1141
Wyoming 52 .0163 .1267
Observations 3,187

26
is married men with children (693 observations) followed very closely by single men without
children (670 observations). Among females, the most common group is single women without
children (484 observations) followed by married women with children (313 observations).
Education is an important aspect of a person’s human capital and determinant of
employment. We are able to identify the highest level of educational attainment for the
individuals in our sample. When it comes to schooling, Table 1 shows that there is a plurality of
high school graduates in the sample (30.0%), followed by bachelor’s degree college graduates
(21.0%), people with some college but no degree (20.4%), and associate’s degree community
college graduates (12.3%). It is more common to observe someone with less than a high school
diploma (8.3%) than a master’s degree (6.3%), professional degree (1.4%), or doctoral degree
(0.7%).
Landing in a green occupation may be influenced by where one had worked originally.
Fortunately, the survey data allow us to identify the previous industry and occupations of every
individual in the sample. Of the displaced workers, nearly 15.9% had lost jobs from the
manufacturing sector, while 13.2% were displaced from construction. Only 4.5% of the job
losers were from the financial industry and 1.6% from real estate. Turning to notable service
industries, 1.7% of job losers were from the architectural/engineering sector, 1.5% from the legal
services sector.
Finally, we are able to identify and control for a respondent’s state of residence and the
year in which displacement occurred. Controlling for the state of residence allows us to account
for the heterogeneity of the national the labor market and control for varying unemployment
rates across states. Of the 3,187 displaced workers/eventual job finders, 287 (9.0%) were from

27
the consortium states of Iowa, Montana, Nebraska, South Dakota, Utah, and Wyoming.
Controlling for the year of layoff also allows us to capture any relevant time trend.
The descriptive statistics indicate that 36.3% of the job losers/finders ended up in green
occupations. What factors might have affected the likelihood of ending up in a green job?
Estimation Method. To begin, consider a simple linear representation:
( ) , i = 1, . . . , n,
where in this case Y is a binary variable equal to 1 if individual i (of the n individuals in the
sample) was employed in a green occupation at the time of the DWS survey, equal to 0
otherwise; Xi is a matrix (k x n) of explanatory variables associated with person i; β is a vector (k
x 1) of parameters we need to estimate; and εi is a disturbance term. Of course, by estimating β
we would identify which factors affect the likelihood of landing in a green occupation;
moreover, we would identify the magnitude of the impacts.
What sorts of variables can help explain whether or not a person lands in a green
occupation? We included in our analysis those variables listed in Table III.1, to control for a
person’s age and past work situation, educational background, family situation, and control
variables that include fixed effects for the state of residence and the year of job displacement.
In our analysis we do not assume a normally distributed random error. In fact, we
assume that the error term, though random across observations, is not random within geographic
areas. It is well known that labor market conditions vary from state to state. As such, the εi
terms are subject to heteroskedasticity, that is, non-constant variance from state to state.
Fortunately, this statistical problem can be circumvented, allowing us to obtain efficient

28
estimates of β. Specifically, we followed the technique described by Greene (2008, p. 188) to
control for heteroskedasticity.2
To estimate the impact of the explanatory variables (X) on the likelihood of finding a
green job (Y), the appropriate statistical method is to estimate a probit model, a non-linear
maximum likelihood estimation technique. This technique estimates values for the β vector that
maximize the likelihood of observing the outcomes in our survey data.
As explained above, we are interested in the probability of green employment given an
individual’s personal characteristics and employment history:
( ) ( ) ( ),
where ( ) represents the standard normal distribution. The coefficients of interest are jointly
normally distributed. Given this distribution we can specify a log likelihood function as follows:
( ) ∑ ( ( ))
∑ ( )
,
where the objective is to choose values for β that maximize ln L, that is, values for the
parameters to maximize the likelihood of obtaining the survey observations. Differentiating the
log likelihood function with respect to β to maximize the function leads us to the parameter
estimates.
Using the probit estimation method outlined above, we can estimate a baseline
probability that an individual would have been employed in a green occupation at the time of the
CPS/DWS survey in January 2010. This baseline probability is the value generated with the
probit coefficient estimates when X is set equal to .
As is well known to statisticians, the coefficient estimates for β do not represent the
marginal effects of the explanatory variables. In the probit framework, it is customary to
2 Greene, William H., 2008. Econometric Analysis, 6
th edition. Upper Saddle River, New Jersey: Prentice Hall.

29
evaluate marginal effects using the mean values of all the explanatory variables. For example, in
the case of a continuous explanatory variable, such as age, the marginal impact of the variable
can be calculated as follows:
( ) ( )
(
) ,
where ( ) represents the probability density function evaluated at the mean values of the
independent variables. However, in the case of discrete variables (like 0-1 indicator variables),
the marginal impact can be calculated as follows:
( ) [ [ ,
where signifies the 0-1 dummy variable for which we would like to obtain the marginal
impact. In other words, to determine the marginal impact of some indicator variable, such as
having a bachelor’s degree from college, hold the other variables fixed at their respective means
and then find the probability of being employed in a green occupation when one has a college
degree and also when one does not; we then take the difference between these two scenarios to
gauge the marginal effect of having earned a bachelor’s degree. A cautionary note, multiple
effects cannot be calculated simultaneously. Each marginal effect is calculated while holding the
other variables fixed at their mean values. Thus, it would be incorrect merely to sum the
coefficients on multiple variables in order to determine the probability of being employed in a
green occupation for any desired set of initial conditions.
Results. Using the probit estimation method, we are able to calculate the probability that
an employed person (at survey time) who reported a job loss between January 1, 2007 and
January 1, 2010 had been reemployed in a green occupation. Using the probit coefficient
estimates, we were able to compute the marginal impact of each explanatory variable, which are
presented in Table III.2 below, in the column headed “Model (1)”.

30
Table III.2
Probability of being Employed in a Green Occupation
(Currently Employed, All Industries)
Model (1)a Model (2)b Explanatory Variable End Green P-value End Green P-value Worked > 35hrs / wk 0.0228 (0.311) -0.0317
* (0.093)
Moved for Job 0.0103 (0.763) -0.0217 (0.598)
Single male with children -0.0721 (0.139) -0.0327 (0.523)
Married male no children 0.0479 (0.149) -0.0250 (0.456)
Married male with children 0.0843**
(0.020) 0.0183 (0.605)
Single woman no children -0.1688***
(0.000) -0.1185***
(0.000)
Single woman with children -0.2462***
(0.000) -0.1359***
(0.000)
Married woman no children -0.2254***
(0.000) -0.1168***
(0.000)
Married woman with children -0.1839***
(0.000) -0.0985***
(0.000)
Age 0.0170***
(0.010) 0.0048 (0.378)
Age2 -0.0002
** (0.012) -0.0001 (0.380)
Less than High School 0.0262 (0.478) -0.0164 (0.690)
Some College 0.0152 (0.605) 0.0405 (0.247)
Associate Degree 0.0439 (0.184) 0.0173 (0.596)
Bachelor Degree 0.0938***
(0.001) 0.0786**
(0.038)
Master Degree 0.0816* (0.081) 0.0574 (0.278)
Professional Degree 0.0650 (0.557) -0.1061* (0.077)
Doctoral Degree 0.3598**
(0.016) 0.2429 (0.239)
Construction 0.2814***
(0.000) 0.1536**
(0.031)
Manufacturing 0.1877***
(0.000) 0.1237***
(0.002)
Finance 0.0935 (0.101) 0.0900* (0.097)
Real Estate 0.0187 (0.683) 0.0750* (0.078)
Architects & Engineers 0.3706***
(0.000) 0.3717**
(0.037)
Legal Services 0.1579 (0.106) 0.0300 (0.764) Baseline probability (at means) .344 .178
Controls
State Fixed Effects Yes Yes
Year of job loss Yes Yes
Walt test (χ2 df=24) 921.66 (0.000) 170.63 (0.000) N 3,187 1,921
Marginal effects; p-values in parentheses for discrete change of dummy variable from 0 to 1 * p < .1, ** p < .05, *** p < .01 aProbability that an employed person (at survey time) who reported a job loss between January 1, 2007 and January 1, 2010
had been re-employed in a green occupation. bSame as Model (1), but only includes individuals who did not start in a green occupation.

31
To interpret the results presented in Table III.2, consider the following. The “baseline
probability” figure (.344) means that holding all variables fixed at their means, someone
previously employed had 34.4% probability of being employed in a green occupation at the time
of the 2010 DWS survey, given that the individual was employed at the time of the survey.
Holding all variables fixed at their means, someone previously employed in the construction
industry had a 62.54% probability (.344 + .2814) of being employed in a green occupation, given
that they were employed. And someone previously employed in manufacturing had a 53.17%
probability (.344 + .1877) of being employed in a green occupation, given that they were
employed. Finally, someone displaced from work in the architectural/engineering sector had a
71.46% probability (.344 + .3706) of being re-employed in a green-collar job.
Having been displaced from a full-time job had no significant impact on the likelihood
of ending up in a green occupation. Likewise, moving to find work does not influence the
likelihood of landing in a green job (see Table III.2).
To gauge the impact of age on the probability of finding a green job, we used both Age
and Age2, a quadratic formulation which allows the impact of age to vary between younger and
older persons. According to our probit estimates, age increases the likelihood of landing in a
green-collar job, but at a decreasing rate. In fact, for a person exhibiting the mean age of 40.55
years, the marginal impact of age is roughly zero. In other words, older displaced workers were
not more likely than their younger counterparts to be re-employed in a green occupation.
Gender and family circumstances affect the probability of being re-employed in a green
occupation. Compared to single displaced men without children (the base group), married
displaced men with children are much more likely (8.4% more likely) to wind up in green work.
If being married with children signals family responsibilities, then displaced men with those

32
responsibilities are more likely to become re-employed in green work than their unmarried,
childless counterparts. Perhaps significant family responsibilities make displaced men less picky
in their job search behavior, so that they are more willing to accept green types of work.
Compared to single men without children, women are less likely to be re-employed in
green jobs, regardless of their marital or parental status.
Educational background also affects the likelihood of a displaced worker finding re-
employment in a green job (see Table III.2). Compared to high school graduates (the base
group), a bachelor’s degree college graduate is much more likely (9.4% more likely) to become
re-employed in a green job. The same holds true for holders of master’s or doctoral degrees.
In contrast to college alumni, community college graduates are not more likely than high
school graduates to land in a green job. Likewise, the re-employment prospects of (1) persons
with some college experience (but no degree) and (2) persons without even a high school
diploma are no different than those of high school graduates. Also note, for persons with a
professional degree – that is, persons with advanced training for a specific profession – the
probability of green re-employment is no different than for a high school graduate.
Putting the education effects in some perspective, having earned a 4-year college degree
(or higher) instead of a high school diploma means a displaced worker is more likely to be re-
employed in a green job. The only exception to this finding, perhaps not surprisingly, is for
persons with professional degrees, who are trained to practice in a very specific profession. In
contrast, having earned a 2-year community college degree instead of a high school diploma
does not mean one is more likely to be re-situated in green work. Of course, our model cannot
identify whether it is because college education (1) makes someone more willing to pursue
green-collar work or (2) prepares one with “greener” job skills. Nevertheless, it is the case that

33
displaced college graduates who were subsequently re-employed were more likely to wind up in
green-collar work than other displaced workers.
So far our analysis has focused on the national sample of 3,187 persons displaced from
work who subsequently became re-employed. But many of those persons may have been
displaced from green jobs in the first place. What about persons displaced from non-green jobs,
hereafter referred to as “brown” jobs? Focusing only on persons displaced from brown jobs who
subsequently became re-employed – which is a group of 1,921 persons – what is the likelihood
of their being re-employed in green-collar work? Using the probit estimation method for this
restricted sample, we computed the marginal impact of each explanatory variable, presented in
Table III.2 below in the column headed “Model (2)”.
Now the baseline figure (.178) means that holding all variables fixed at their means,
someone displaced from a brown job had only a 17.8% probability of being employed in a green
job, given that the individual was employed at the time of the DWS survey. Evaluating the
explanatory variables at their means, someone previously employed in a brown construction job
had a 33.16% probability (.178 + .1536) of being re-employed in a green job, given that they
were employed. A person dislodged from a brown manufacturing occupation had only a 30.17%
probability (.178 + .1237) of being employed in a green occupation, given that they were
employed. Finally, someone thrown out of a brown job in the architectural/engineering sector
had a 54.97% probability (.178 + .3717) of landing in a green-collar job.
Now focusing only on those displaced from brown-collar jobs, having worked full-time
means one is somewhat less likely to land in a green occupation. It is still the case that moving
to find work does not influence the likelihood of landing in a green job (see Table III.2, Model
(2)). Compared to single men without children, it is still the case that women are less likely to be

34
re-employed in green work, regardless of their marital or parental status.
Regarding education, the findings are familiar. Having earned a 4-year college degree
instead of a high school diploma means someone displaced from a brown job is more likely to
become re-employed in a green job. Again there is an exception for persons with professional
degrees. It is still the case that having earned a 2-year community college degree instead of a
high school diploma does not mean one is more likely to be re-situated in green work. Focusing
only on those displaced from brown occupations, it remains true that displaced college graduates
are more likely to wind up in green-collar work than other displaced workers, including
community college graduates.
Displaced Workers Who Found New Jobs: Displaced from Selected Industries of Interest
Descriptive Statistics. So far our analysis has focused on persons in the 2010 DWS
survey who were displaced from work some time since 2007 and subsequently re-employed in
2010. Those persons could have been displaced from any industrial sector. But the Great
Recession clobbered some industries particularly, like construction and manufacturing. Also
hard hit were services related to building – services like finance, real estate, legal services, and
architectural/engineering services. What would be the findings if we narrowed our focus to
persons displaced from these particularly hard hit sectors? Would these job losers be more or
less likely to be finders of green jobs?
In the 2010 DWS there are 1,225 workers displaced from construction, manufacturing, or
related services who were re-employed again at the time of the survey. Descriptive statistics for
these 1,225 job finders are presented in Table III.3 below. Only 36.3% of displaced workers
were subsequently re-employed in green occupations (see Table III.1). In contrast, a majority of

35
job losers from construction, manufacturing, and related services was re-employed in green-
collar work, albeit a slim majority of 50.9% (see Table III.3). Along with this difference
between displaced workers in general and those displaced from the selected “clobbered”
industries, there are some differences in demographic and educational characteristics.
The group displaced from selected industries is overwhelmingly male (73.9%) notably
more male than the at-large sample. A familiar finding, most of this particular group is married
(59.9%) with two-fifths of the sample (41.6% to be exact) having any children. As before, the
most common group is married men with children (338 observations) followed closely by single
men without children (287 observations). Also as before, among women the most common
group is single females without children (123 observations) followed by married females with
children (91 observations).
In other respects this targeted sample is similar to the broader, at-large sample. For
example, of the 1,225 displaced workers/eventual job finders in this targeted sample, 113 (9.2%)
were from the consortium states of Iowa, Montana, Nebraska, South Dakota, Utah, and
Wyoming. This 9.2% share is nearly identical with the 9.0% share for the at-large sample.
When it comes to schooling, Table III.3 shows that it is still the case that there is a
plurality of high school graduates in the sample (33.3%), followed by bachelor’s degree college
graduates (20.0%), and people with some college but no degree (18.8%). The share of the
sample with less than a high school diploma (10.6%) is nearly identical to the share with an
associate’s degree from community college (10.5%). In a sample focused exclusively on
displacement from construction, manufacturing, and related services, it is still uncommon to
observe someone with a master’s degree (4.9%), professional degree (1.4%), or doctoral degree
(0.4%).

36
Table III.3
Displaced Workers from Selected Industries Who Found Jobs: Descriptive Statistics
Number Mean Std. Dev.
Working in Green Occupation 624 .5094 .5001
Worked > 35hrs / wk 1,113 .9086 .2883
Moved for Job 115 .0939 .2918
Single male no children 287 .2343 .4237
Single male with children 43 .0351 .1841
Married male no children 237 .1935 .3952
Married male with children 338 .2759 .4472
Single woman no children 123 .1004 .3007
Single woman with children 38 .0310 .1734
Married woman no children 68 .0555 .2291
Married woman with children 91 .0743 .2623
Age 40.4865 11.6495
Any Children 510 .4163 .4932
Less than High School 130 .1061 .3081
HS Grad or GED 409 .3339 .4718
Some College 230 .1878 .3907
Associate Degree 129 .1053 .3071
Bachelor Degree 245 .2000 .4002
Master Degree 60 .0490 .2159
Professional Degree 17 .0139 .1170
Doctoral Degree 5 .0041 .0638
Construction 422 .3445 .4754
Manufacturing 508 .4147 .4929
Finance 143 .1167 .3212
Real Estate 50 .0408 .1979
Architects & Engineers 53 .0433 .2035
Legal Services 49 .0400 .1960
Nebraska 14 .0114 .1063
Montana 15 .0122 .1100
Iowa 20 .0163 .1268
South Dakota 28 .0229 .1495
Utah 21 .0171 .1299
Wyoming 15 .0122 .1100
Observations 1,225

37
The descriptive statistics indicate that 50.9% of this group of job losers/finders ended up
in green occupations. What factors affected the likelihood of ending up in a green job? To
address this question, we again estimate a probit model.
Results. Using the probit estimation method, we are able to calculate the probability that
an employed person (at survey time) who reported a job loss between January 1, 2007 and
January 1, 2010 from one of the industries of interest had been reemployed in a green
occupation. Using the probit coefficient estimates, we were able to compute the marginal impact
of each explanatory variable, which are presented in Table III.4 below, in the column headed
“Model (1)”.
To interpret the results presented in Table III.4, consider the following. Recall that the
“baseline probability” figure (.512) means that holding all variables fixed at their means,
someone previously employed had 51.2% probability of being employed in a green occupation at
the time of the 2010 DWS survey, given that the individual was employed at the time of the
survey and was displaced from construction, manufacturing, or one of the related service sectors.
Holding all variables fixed at their means, someone with a college degree had 58.45% (.512 +
.0725) probability of being re-employed in a green collar job.
As for the at-large sample, having been displaced from a full-time job had no significant
impact on the likelihood of ending up in a green occupation. Likewise, moving to find work
does not influence the likelihood of landing in a green job. Unlike the at-large case, age has no
significant impact either (see Table III.4).
The impacts of gender and family circumstances are familiar. Compared to single
displaced men without children (the base group), married displaced men with children are more
likely (11.1% more likely) to wind up in green work. Once again, if being married with children

38
Table III.4
Probability of Being Employed in a Green Occupation
(Currently Employed)
(Originally Employed in Construction, Manufacturing, or Related Services)
Model (1)a
Model (2)b
End Green P-value End Green P-value
Worked > 35hrs / wk -0.0738 (0.257) -0.1001 (0.270)
Moved for Job 0.0393 (0.622) -0.0415 (0.753)
Single male with children -0.1361 (0.102) -0.0379 (0.808)
Married male no children 0.0669 (0.263) 0.1016 (0.341)
Married male with children 0.1105* (0.055) 0.0512 (0.608)
Single woman no children -0.0836 (0.278) -0.0744 (0.395)
Single woman with children -0.2131**
(0.035) -0.1644 (0.152)
Married woman no children -0.1854* (0.052) -0.0345 (0.791)
Married woman with children -0.2226***
(0.002) -0.1514* (0.067)
Age 0.0077 (0.514) -0.0004 (0.983)
Age Squared -0.0001 (0.516) -0.0001 (0.769)
Less than High School 0.0125 (0.849) -0.0181 (0.866)
Some College -0.0043 (0.933) 0.0609 (0.529)
Associate Degree 0.0338 (0.554) -0.0080 (0.950)
Bachelor Degree 0.0725* (0.069) 0.0709 (0.434)
Master Degree 0.1486* (0.063) 0.0483 (0.736)
Professional Degree 0.3506**
(0.011) 0.6052***
(0.000)
Doctoral Degreec …………omitted…………
Construction 0.0998***
(0.005) 0.0008 (0.991)
Finance -0.1178**
(0.046) -0.0403 (0.527)
Real Estate -0.2183***
(0.000) -0.0951 (0.166)
Architects & Engineers 0.1689**
(0.050) 0.1792 (0.454)
Legal Services -0.1078 (0.302) -0.1325 (0.249) Legal Services -0.1294 (0.295) -0.1325 (0.249) Baseline probability (at means) .512 .295
Controls
State Fixed Effects Yes Yes
Year of job loss Yes Yes
Walt test (χ2 df=22) 293.81 (0.000) 74.79 (0.000)
N 1,225 430
Marginal effects; p-values in parentheses for discrete change of dummy variable from 0 to 1 * p < .1, ** p < .05, *** p < .01 aProbability that an employed person (at survey time) who reported a job loss between January 1, 2007 and January 1, 2010
had been re-employed in a green occupation. bSame as Model (1), but only includes individuals who did not start in a green occupation. cThe “doctoral” variable must be dropped due to problems arising because there are so few observations.

39
signals family responsibilities for a man, then displaced men with those responsibilities are more
likely to become re-employed in green work than their unmarried, childless counterparts. This
finding again supports the conjecture that significant family responsibilities make displaced men
less picky in their job search behavior, so that they are more willing to accept green types of
work. Also as before, compared to single men without children, women are less likely to be re-
employed in green jobs, regardless of their marital or parental status.
The effects of educational background on the likelihood of finding re-employment in a
green job are also familiar (see Table III.4). Compared to high school graduates (the base
group), a bachelor’s degree college graduate is more likely (7.3% more likely) to become re-
employed in a green job. The results are even more striking for those few holders of master’s or
professional degrees.
Concentrating exclusively on persons displaced from construction, manufacturing, and
related services industries, we again find that unlike 4-year college graduates, community college
graduates are not more likely than high school graduates to land in a green job. Also as before,
the re-employment prospects of (1) persons with some college experience (but no degree) and (2)
persons without even a high school diploma are no different than those of high school graduates.
Once again we find that having earned a 4-year college degree (or higher) instead of a
high school diploma means a displaced worker who is re-employed is more likely to be re-
employed in a green job. In contrast, having earned a 2-year community college degree instead
of a high school diploma does not mean one is more likely to be re-situated in green work.
Although our analysis does not identify why it is the case, it is nevertheless true that college
graduates who are re-employed are more likely to wind up in green-collar work than other
displaced workers.

40
Compared to job losers from manufacturing, displaced construction workers were
significantly more likely (10% more likely) to be re-employed in green collar work; persons
displaced from the architectural/engineering sector were even more likely (16.9% more likely) to
land in green occupations. But if a worker was dislodged from the financial sector or the real
estate sector, (s)he was less likely than someone from manufacturing to become re-employed in
green work.
So far our analysis has focused on the national sample of 1,225 persons displaced from
work in construction, manufacturing, or related services who subsequently became re-employed.
But many of those persons could have been displaced from green collar work in the first place.
What about persons displaced from brown jobs? Focusing only on persons displaced from
brown jobs in the sectors of interest who subsequently became re-employed – which is a group
of 430 persons – what is the likelihood of their being re-employed in green-collar work? Using
the probit estimation method for this restricted sample, we computed the marginal impact of each
explanatory variable, presented in Table III.4 below, in the column headed “Model (2)”.
For this group displaced from brown jobs, the baseline figure (.295) means that holding
all variables fixed at their means, someone displaced from a brown job had a 29.5% probability
of being employed in a green job, given that the individual was employed at the time of the DWS
survey. For this comparatively small group of displaced workers, the marginal effects of the
explanatory variables are largely insignificant.
Displaced Workers – Job Finders and Failures: Displaced from Any Industry
Descriptive Statistics. In the analysis above we focused on displaced workers who
subsequently became re-employed. But what if we consider the entire sample, both the job

41
finders and the failures, that is, the entire sample of 5,582 displaced workers? Would any of our
findings change? Descriptive statistics for the entire sample of 5,582 displaced workers are
presented in Table III.5 below.
Now that the sample is expanded to include both successful and unsuccessful job finders,
we see that only 20.8% of displaced workers found work in green occupations. Many of the
demographic characteristics are similar, however. For example, the sample is mostly male
(62.6%) and mostly married (52.5%), with nearly two-fifths of the sample (37.7%) having any
children. But now that the sample is expanded to include both successful and unsuccessful job
finders, some of the demographics change. Now the most common group is single men with no
children (1,357) followed by married men with children (1,103) and married men without
children (849). For females, it is still the case that the most common group is single women
without children (773), only now the next most common group is married women with no
children (501). The expanded sample is different in other respects too. Of the 5,582 displaced
workers in the entire sample, only 7.4% were from the consortium states (meaning consortium
state individuals are slightly over-represented among the successful job finders).
When it comes to schooling, expanding the sample also makes a difference. Table III.5
shows that it is still the case that high school graduates are observed most commonly (33.5%),
only now the next largest group is the one with some college (20.1%), followed by bachelor’s
degree college graduates (17.9%). The share of the sample with less than a high school diploma
(10.9%) is now larger (somewhat) than the share with an associate’s degree from community
college (10.5%). Once failed job searchers are included the sample, it is less common to observe
someone with a master’s degree (share falls to 5.4%), professional degree (share falls to 1.0%),
or doctoral degree (share falls to 0.5%). So once failed job searchers are included in the sample,

42
Table III.5
Displaced Workers, Job Finders and Failures: Descriptive Statistics
Number Mean Std. Dev.
End Green 1,158 .2075 .4055
Worked > 35hrs / wk 4,726 .8466 .3604
Moved for Job 376 .0674 .2507
Single male no children 1,357 .2431 .4290
Single male with children 186 .0333 .1795
Married male no children 849 .1521 .3591
Married male with children 1,103 .1976 .3982
Single woman no children 773 .1385 .3454
Single woman with children 335 .0600 .2375
Married woman no children 501 .0898 .2859
Married woman with children 478 .0856 .2798
Age 41.2872 12.3452
Any Children 2,102 .3766 .4846
Less than High School 610 .1093 .3120
HS Grad or GED 1,872 .3354 .4722
Some College 1,124 .2014 .4011
Associate Degree 588 .1053 .3070
Bachelor Degree 1,001 .1793 .3837
Master Degree 302 .0541 .2262
Professional Degree 57 .0102 .1005
Doctoral Degree 28 .0050 .0707
Construction 866 .1551 .3621
Manufacturing 997 .1786 .3831
Finance 214 .0383 .1920
Real Estate 82 .0147 .1203
Architects & Engineers 85 .0152 .1225
Legal Services 75 .0134 .1151
Nebraska 62 .0111 .1048
Montana 53 .0095 .0970
Iowa 80 .0143 .1189
South Dakota 73 .01308 .1136
Utah 66 .01182 .1081
Wyoming 78 .0140 .1174
Observations 5,582

43
the share of highly educated people falls. A sign that higher education is helpful in a successful
job search?
The descriptive statistics indicate that 20.8% of the entire group of displaced workers
became re-employed in green occupations. What factors affected the likelihood of ending up in
a green job? To address this question, we again estimate a probit model. Using the probit
coefficient estimates, we were able to compute the marginal impact of each explanatory variable,
presented below in Table III.6, in the column headed “Model (1)”.
Start with the “baseline probability” figure (.177), which means that holding all variables
fixed at their means, a displaced worker had 17.7% probability of being employed in a green
occupation at the time of the 2010 DWS survey. Holding all variables fixed at their means,
someone dislodged from a construction job had a 29.94% probability (.177 + .1224) of being
employed in a green occupation. Someone ejected from a manufacturing job had a 25.52%
probability (.177 + .0782) of being employed in green collar work. Finally, someone displaced
from work in the architectural/engineering sector had a 36.08% probability (.177 + .1838) of
being re-employed in a green-collar job.
Having been displaced from a full-time job had no significant impact on the likelihood of
ending up in a green occupation, but moving to search for work had a positive impact on the
likelihood of landing in a green job (see Table III.6).
To gauge the impact of age on the probability of finding a green job, we again used both
Age and Age2. Once again, we find that age increases the likelihood of landing in a green-collar
job, but at a decreasing rate. In fact, for a person exhibiting the mean age of 41.29 years, the
marginal impact of age is slightly negative. In other words, older displaced workers were less
likely than their younger counterparts to be re-employed in green collar work.

44
Table III.6
Probability of Being Employed in a Green Occupation
(Currently Employed or Unemployed, All Industries)
Model (1)a P-value Model (2)b P-value End Green End Green Worked > 35hrs / wk -0.0249 (0.162) -0.0348
** (0.014)
Moved for Job 0.0472**
(0.031) 0.0190 (0.523)
Single male with children -0.0251 (0.318) -0.0132 (0.647)
Married male no children 0.0767***
(0.000) 0.0018 (0.914)
Married male with children 0.1119***
(0.000) 0.0386* (0.070)
Single woman no children -0.0565***
(0.000) -0.0470***
(0.000)
Single woman with children -0.1232***
(0.000) -0.0707***
(0.000)
Married woman no children -0.0956***
(0.000) -0.0484**
(0.031)
Married woman with children -0.0685***
(0.000) -0.0353**
(0.021)
Age 0.0077**
(0.043) 0.0020 (0.532)
Age Squared -0.0001**
(0.015) -0.0000 (0.350)
Less than High School -0.0119 (0.627) -0.0259 (0.214)
Some College 0.0276* (0.096) 0.0290 (0.174)
Associate Degree 0.0623**
(0.020) 0.0249 (0.296)
Bachelor Degree 0.1070***
(0.000) 0.0697**
(0.022)
Master Degree 0.1174***
(0.000) 0.0649* (0.062)
Professional Degree 0.1286 (0.161) -0.0424 (0.370)
Doctoral Degree 0.4295***
(0.001) 0.2626 (0.143)
Construction 0.1224***
(0.000) 0.0651 (0.103)
Manufacturing 0.0782***
(0.000) 0.0405* (0.056)
Finance 0.0648* (0.068) 0.0483 (0.143)
Real Estate -0.0071 (0.848) 0.0370 (0.234)
Architects & Engineers 0.1838***
(0.000) 0.0901 (0.282)
Legal Services 0.1014 (0.210) 0.0291 (0.644) Baseline probability (at means) .177 .0965
Controls
State Fixed Effects Yes Yes
Year of job loss Yes Yes
Walt test (χ2 df=24) 2804.57 (0.000) 300.11 (0.000) N 5,582 3,249
Marginal effects; p-values in parentheses for discrete change of dummy variable from 0 to 1 * p < .1, ** p < .05, *** p < .01 aProbability that a displaced person is employed in a green occupation at survey time.
bSame as Model (1), but only includes individuals who did not start in a green occupation.

45
Gender and family circumstances affect the probability of being re-employed in a green
occupation. Compared to single displaced men without children (the base group), married men –
with or without children – are significantly more likely to wind up in green work. Once again
we find that men with family responsibilities are more likely to become re-employed in green
work than their unmarried, childless counterparts. Again, it appears that significant family
responsibilities make displaced men less picky in their job search behavior, so that they are more
willing to accept green types of work. In another familiar finding, compared to single men
without children, women are less likely to be re-employed in green jobs, regardless of their
marital or parental status.
Educational background still affects the likelihood of a displaced worker finding re-
employment in a green job (see Table III.6). Compared to the holder of a high school diploma,
the holder of a bachelor’s degree is much more likely (10.7% more likely) to become re-
employed in a green job; likewise, the holder of a master’s degree is more likely to land in green
work (11.7% more likely), as is the holder of a doctoral degree (43.0% more likely).
Once the sample is expanded to include both successful and unsuccessful job finders, it
can be seen that the holder of a community college associate’s degree is now more likely to find
green collar work than a high school graduate (6.2% more likely); even someone with only some
college experience is more likely to find green work than a high school graduate (albeit, only
2.8% more likely). In contrast, the re-employment prospects of someone without a high school
diploma are no different than those of high school graduates.
Putting these education impacts in perspective, having earned a 4-year college degree (or
higher) instead of a high school diploma means a displaced worker is more likely to be re-
employed in a green job. Further, having earned a 2-year community college degree instead of a

46
high school diploma means a displaced worker is more likely to find a green collar job. So
having some education beyond high school makes it more likely for a displaced worker to land in
a green occupation.
What about workers who were displaced from brown jobs, a group of 3,249 persons?
Using the probit estimation method for this restricted sample, we computed the marginal impact
of each explanatory variable, shown below in Table III.6 in the column headed “Model (2)”.
The findings are similar to those for the entire sample. Having earned a 4-year college
degree – or a master’s degree – instead of a high school diploma means someone displaced from
a brown job is more likely to land in a green occupation. Only now the community college
effect goes away. A displaced community college graduate is not more likely than a displaced
high school graduate to make the jump from brown work to green work. Evidently community
college graduates landing in green jobs tended to start in green jobs in the first place.
Displaced Workers – Job Finders and Failures: Displaced from Selected Industries of
Interest
Descriptive Statistics. To close our analysis we now consider displaced workers – both
job finders and failures – who were thrown of construction or manufacturing jobs, or jobs from
related service industries. How are the findings affected by concentrating only on these
clobbered industries? Would these displaced workers be more or less likely to be finders of
green jobs? In the 2010 DWS there are 2,319 workers displaced from construction,
manufacturing, or related services. Descriptive statistics for these persons are below in Table
III.7. The demographics are familiar by now. This group is mostly male and mostly married,
with nearly two-fifths having children.

47
Table III.7
Displaced Workers from Selected Industries, Job Finders and Failures:
Descriptive Statistics
Number Mean Std. Dev.
End Green 624 .2691 .4436
Worked > 35hrs / wk 2,127 .9172 .2756
Moved for Job 170 .0733 .2607
Single male no children 634 .2734 .4458
Single male with children 97 .0418 .2002
Married male no children 450 .1940 .3956
Married male with children 558 .2406 .4276
Single woman no children 207 .0893 .2852
Single woman with children 78 .0336 .1803
Married woman no children 143 .0617 .2406
Married woman with children 152 .0655 .2475
Age 41.6861 11.9420
Any Children 885 .3816 .4859
Less than High School 309 .1332 .3399
HS Grad or GED 865 .3730 .4837
Some College 430 .1854 .3887
Associate Degree 214 .0923 .2895
Bachelor Degree 372 .1604 .3671
Master Degree 99 .0427 .2022
Professional Degree 24 .0103 .1012
Doctoral Degree 6 .0026 .0508
Construction 866 .3734 .4838
Manufacturing 997 .4299 .4952
Finance 214 .0923 .2895
Real Estate 82 .0354 .1847
Architects & Engineers 85 .0367 .1880
Legal Services 75 .0323 .1769
Nebraska 25 .0108 .1033
Montana 22 .0095 .0970
Iowa 29 .0125 .1112
South Dakota 39 .0168 .1286
Utah 32 .0138 .1167
Wyoming 24 .0103 .1012
Observations 2,319

48
As for the at-large sample, the group displaced from the selected industries was most
represented by high school graduates (37.3%) and those with some college (18.5%), followed by
bachelor’s degree holders (16.0%). Among job losers from the clobbered industries, it is
noticeably more common to observe someone with less than a high school diploma (13.3%) than
with a community college associate’s degree (9.2%). Advanced degrees are comparatively rare.
The descriptive statistics indicate that 26.9% of this group of displaced workers ended up
in green occupations. What factors affected the likelihood of ending up in a green job? Once
again, we estimate a probit model.
Results. Using the probit estimation method, we are able to calculate the probability that
a person displaced from one of the industries of interest had been reemployed in a green
occupation. Using the probit coefficient estimates, we were able to compute the marginal impact
of each explanatory variable, shown below in Table III.8 in the column headed “Model (1)”.
The impacts on men of family circumstances are consistent. Compared to single
displaced men without children (the base group), married men – with or without children – are
more likely to land in green jobs. As seen throughout this report, displaced men with family
responsibilities are more likely to become re-employed in green work than their single
counterparts.
The effects of educational background are habitual (see Table III.8). Compared to a
displaced high school graduate, a displaced bachelor’s degree college graduate is significantly
more likely (13.1% more likely) to become re-employed in a green job. Again, the results are
even more striking for those few holders of master’s or professional degrees. Also notice again,
when the sample includes both successful and unsuccessful job finders, a dislodged community
college graduate is more likely than a high school graduate (7.1% more likely) to

49
Table III.8
Probability of Being Employed in a Green Occupation
(Currently Employed or Unemployed)
(Originally Employed in Construction, Manufacturing, Related Services)
Model (1)a P-value Model (2)b P-value End Green End Green Worked > 35hrs / wk -0.1154
** (0.025) -0.0972
* (0.080)
Moved for Job 0.0954* (0.059) 0.0289 (0.714)
Single male with children -0.0222 (0.577) 0.0324 (0.702)
Married male no children 0.1369***
(0.003) 0.1024* (0.089)
Married male with children 0.1707***
(0.000) 0.0765 (0.110)
Single woman no children 0.0334 (0.401) 0.0215 (0.668)
Single woman with children -0.0817 (0.133) -0.0603 (0.263)
Married woman no children -0.0338 (0.508) 0.0368 (0.638)
Married woman with children -0.0744**
(0.022) -0.0327 (0.334)
Age 0.0006 (0.925) -0.0029 (0.774)
Age Squared -0.0001 (0.494) -0.0000 (0.847)
Less than High School -0.0111 (0.795) -0.0143 (0.765)
Some College 0.0361 (0.243) 0.0212 (0.667)
Associate Degree 0.0706* (0.061) 0.0102 (0.886)
Bachelor Degree 0.1314***
(0.000) 0.0692 (0.271)
Master Degree 0.2250***
(0.000) 0.0670 (0.399)
Professional Degree 0.3529* (0.053) 0.0578 (0.836)
Doctoral Degreec 0.6741
*** (0.000) omitted
Construction 0.0460* (0.053) -0.0023 (0.955)
Finance -0.0458 (0.198) -0.0051 (0.886)
Real Estate -0.1120***
(0.000) -0.0235 (0.554)
Architects & Engineers 0.0695 (0.148) 0.0257 (0.785)
Legal Services -0.0462 (0.591) -0.0340 (0.620)
Baseline probability (at means) .239 .132 Controls
State Fixed Effects Yes Yes Year of Job Loss Yes Yes
Walt test (χ2 df=23) 728.43 (0.000) Walt test (χ2 df=22) 188.97 (0.000)
N 2319 806 Marginal effects; p-values in parentheses for discrete change of dummy variable from 0 to 1 * p < .1, ** p < .05, *** p < .01 aProbability that a displaced person is employed in a green occupation at survey time. bSame as Model (1), but only includes individuals who did not start in a green occupation. cThe “doctoral” variable must be dropped due to problems arising because there are so few observations.
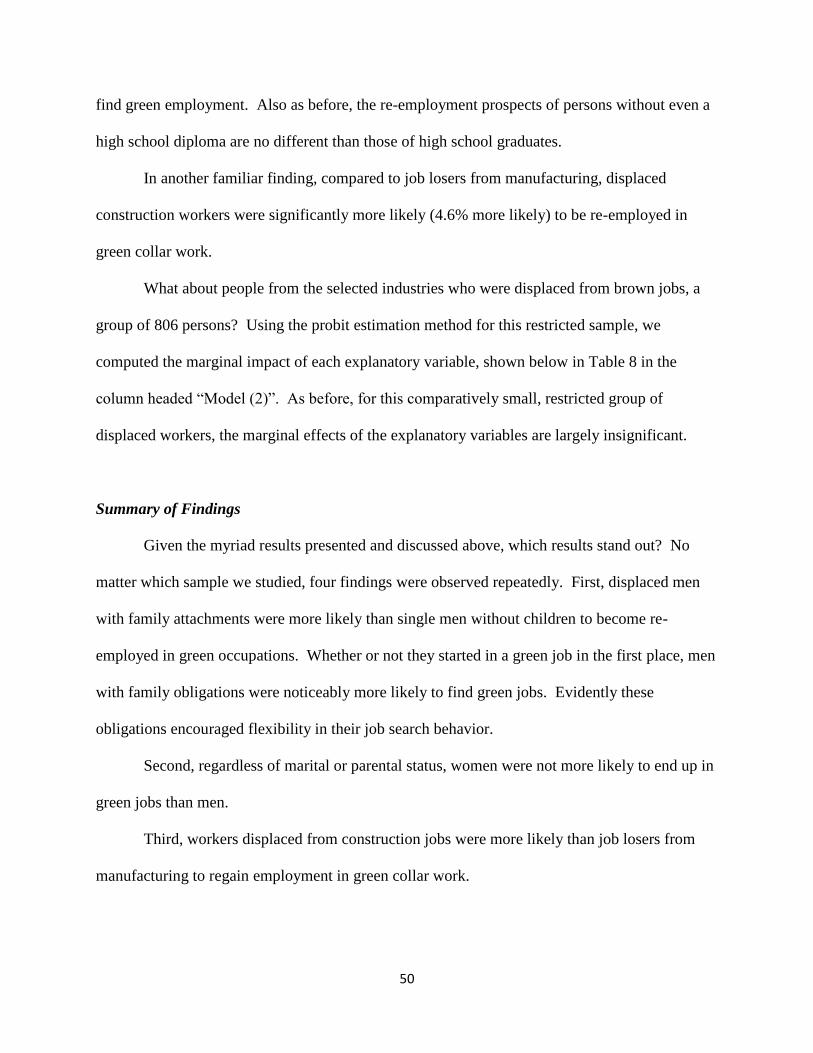
50
find green employment. Also as before, the re-employment prospects of persons without even a
high school diploma are no different than those of high school graduates.
In another familiar finding, compared to job losers from manufacturing, displaced
construction workers were significantly more likely (4.6% more likely) to be re-employed in
green collar work.
What about people from the selected industries who were displaced from brown jobs, a
group of 806 persons? Using the probit estimation method for this restricted sample, we
computed the marginal impact of each explanatory variable, shown below in Table 8 in the
column headed “Model (2)”. As before, for this comparatively small, restricted group of
displaced workers, the marginal effects of the explanatory variables are largely insignificant.
Summary of Findings
Given the myriad results presented and discussed above, which results stand out? No
matter which sample we studied, four findings were observed repeatedly. First, displaced men
with family attachments were more likely than single men without children to become re-
employed in green occupations. Whether or not they started in a green job in the first place, men
with family obligations were noticeably more likely to find green jobs. Evidently these
obligations encouraged flexibility in their job search behavior.
Second, regardless of marital or parental status, women were not more likely to end up in
green jobs than men.
Third, workers displaced from construction jobs were more likely than job losers from
manufacturing to regain employment in green collar work.
51
Fourth, displaced college graduates were more likely than displaced high school
graduates (and those with less than a high school diploma) to become re-employed in green
collar work, whether or not they started in green jobs. Evidently, college education is a
significant factor in finding/switching into green employment
When the sample of displaced workers included both successful and unsuccessful job
finders, it is even the case that community college graduates were more likely than high school
graduates to land green jobs, but not to switch into green jobs from brown jobs in the first place.
Again, it appears that education beyond high school is a key factor in obtaining green
employment.

52
IV. Summary
This report examined the potential opportunities for displaced manufacturing,
construction and construction-related service industry workers in green industry occupations.
The goal was to examine the potential for the emerging green economy to re-employ these
displaced workers. We began by estimating job losses within particular manufacturing,
construction, and construction-related industries in each consortium state. We then estimated an
occupation profile of displaced workers implied by these industry job losses, and whether these
high-displacement occupations were well matched to a list of green occupations. These green
occupations had been identified for consortium states by a survey of businesses conducted by
consortium partners in each state. Based on that analysis, we predicted that green occupations
were better suited for displaced construction and manufacturing workers than for displaced
workers from construction-related services industries. We identified dozens of potentially
matched green occupations in each state.
The second approach in the research was to empirically identify how the skills and
attributes of workers influenced the probability of re-employment within a green occupation. To
identify this re-employment behavior, we employed data from two January 2010 surveys: (1) the
Current Population Survey (CPS) and (2) the Displaced Workers Survey (DWS). The January
2010 CPS and the supplemental DWS enable us to identify the former occupations of specific
individuals displaced in the last three years, as well as the current occupation of individuals who
had found new employment by the time of the January 2010 survey. We then examined which
attributes influenced the probability of re-employment in a green occupation. In this case, we
utilized a national definition of green occupations identified by the U.S. Department of Labor.
This analysis found that displaced workers from the manufacturing, construction, and

53
construction-related services industries all had as high or a higher likelihood of re-employment
in a green collar job than workers displaced from other industries. There were four other
principal findings. First, displaced men with family attachments were more likely than single
men without children to become re- employed in green occupations. Whether or not they started
in a green job in the first place, men with family obligations were noticeably more likely to find
green collar jobs. Evidently these obligations encouraged flexibility in their job search behavior.
Second, regardless of marital or parental status, women were not more likely to end up in green
jobs than men. Third, workers displaced from construction jobs were more likely than job losers
from manufacturing to regain employment in green collar work. Fourth, displaced college
graduates were more likely than displaced high school graduates (and those with less than a high
school diploma) to become re-employed in green collar work, whether or not they started in
green jobs. Evidently, college education is a significant factor in finding/switching into green
employment
Utilizing the results of this research, we also developed a short document for each
consortium state to explain the re-employment opportunities in green occupations for displaced
manufacturing, construction, and construction-related service industry workers. These write-ups
are designed so that they can be provided to displaced workers at convenient locations; for
example, at a One-Stop Center located in a consortium state. The two-page write-ups are
provided for each state in the pages that follow.
54
Opportunities for Employment in Green Occupations in Iowa
The state of Iowa has sustained heavy job losses in manufacturing, construction, and
construction-related services industries (real estate, legal services, and architects and engineers)
in recent years. While a recovery is underway in the manufacturing industry, many jobs may not
return. Iowans need new opportunities in growing sectors of the economy. This flier examines
opportunities in one potential growing sector: green occupations. Green occupations contain a
significant number of workers who “produce a product or service that improves energy
efficiency, expands the use of renewable energy, or supports environmental sustainability.”
Comparisons between the skills and requirements of occupations suggest that jobs in
green occupations might be especially well-suited for displaced construction and manufacturing
workers. However, analysis of actual job changing behavior by displaced workers finds that
displaced manufacturing, construction, and construction-related services workers are all well-
suited to find a new job in a green occupation. Workers in these industries are more likely to find
new jobs in a green occupation than workers in other industries.
Researchers also found that displaced workers with a college degree or a Masters’ degree
are more likely to find a new job in a green occupation than other workers. However, there was
no difference in the likelihood of finding a new green job between workers with high school
degree, an associate’s degree or several years of college.
The Table on the next page shows the green occupations potentially suited for Iowa’s
displaced manufacturing, construction, and construction-related services industry workers.

55
Potential Matched Green Occupations for Iowa
Architects
Bicycle Repairers
Coil Winders, Tapers, and Finishers
Construction Managers
Earth Drillers, Except Oil and Gas
Electricians
Farmworkers and Laborers, Crop, Nursery, and Greenhouse
Floor Layers, Except Carpet, Wood, and Hard Tiles
Glaziers
Hazardous Material Removal Workers
Hazardous Materials Removal Workers
Heating, Air Conditioning and Refrigeration Mechanics and Installers
Helpers – Electricians
Home Appliance Repairers
Molding, Coremaking, and Casting Machine Setters, Operators, and Tenders, Metal and Plastic
Natural Sciences Managers
Production Workers All Other
Riggers
Separating, Filtering, Clarifying, Precipitating, and Still Machine Setters, Operators, and Tenders
Structural Metal Fabricators and Fitters
Tree Trimmers and Pruners

56
Opportunities for Employment in Green Occupations in Montana
The state of Montana has sustained heavy job losses in manufacturing, construction, and
construction-related services industries (real estate, legal services, and architects and engineers)
in recent years. While a recovery is underway in the manufacturing industry, many jobs may not
return. Montanans need new opportunities in growing sectors of the economy. This flier
examines opportunities in one potential growing sector: green occupations. Green occupations
contain a significant number of workers who “produce a product or service that improves energy
efficiency, expands the use of renewable energy, or supports environmental sustainability.”
Comparisons between the skills and requirements of occupations suggest that jobs in
green occupations might be especially well-suited for displaced construction and manufacturing
workers. However, analysis of actual job changing behavior by displaced workers finds that
displaced manufacturing, construction, and construction-related services workers are all well-
suited to find a new job in a green occupation. Workers in these industries are more likely to find
new jobs in a green occupation than workers in other industries.
Researchers also found that displaced workers with a college degree or a Masters’ degree
were are likely to find a new job in a green occupation than other workers. However, there was
no difference in the likelihood of finding a new green job between workers with high school
degree, an associate’s degree or several years of college.
The Table on the next page shows the green occupations potentially suited for Montana’s
displaced manufacturing, construction, and construction-related services industry workers.

57
Potential Matched Green Occupations for Montana
Architects
Bicycle Repairers
Civil Engineers
Coil Winders, Tapers, and Finishers
Construction Managers
Earth Drillers, Except Oil and Gas
Electricians
Farmworkers and Laborers, Crop, Nursery, and Greenhouse
Floor Layers, Except Carpet, Wood, and Hard Tiles
Glaziers
Hazardous Material Removal Workers
Heating, Air Conditioning and Refrigeration Mechanics and Installers
Helpers – Electricians
Home Appliance Repairers
Molding, Coremaking, and Casting Machine Setters, Operators, and Tenders, Metal and Plastic
Natural Sciences Managers
Production Workers All Other
Riggers
Structural Metal Fabricators and Fitters
Tree Trimmers and Pruners

58
Opportunities for Employment in Green Occupations in Nebraska
The state of Nebraska has sustained heavy job losses in manufacturing, construction, and
construction-related services industries (finance, real estate, legal services, and architects and
engineers) in recent years. While a recovery is underway in the manufacturing industry, many
jobs may not return. Nebraskans need new opportunities in growing sectors of the economy. This
flier examines opportunities in one potential growing sector: green occupations. Green
occupations contain a significant number of workers who “produce a product or service that
improves energy efficiency, expands the use of renewable energy, or supports environmental
sustainability.”
Comparisons between the skills and requirements of occupations suggest that jobs in
green occupations might be especially well-suited for displaced construction and manufacturing
workers. However, analysis of actual job changing behavior by displaced workers finds that
displaced manufacturing, construction, and construction-related services workers are all well-
suited to find a new job in a green occupation. Workers in these industries are more likely to find
new jobs in a green occupation than workers in other industries.
Researchers also found that displaced workers with a college degree or a Masters’ degree
are more likely to find a new job in a green occupation than other workers. However, there was
no difference in the likelihood of finding a new green job between workers with high school
degree, an associate’s degree or several years of college.
The Table on the next page shows the green occupations potentially suited for Nebraska’s
displaced manufacturing, construction, and construction-related services industry workers.
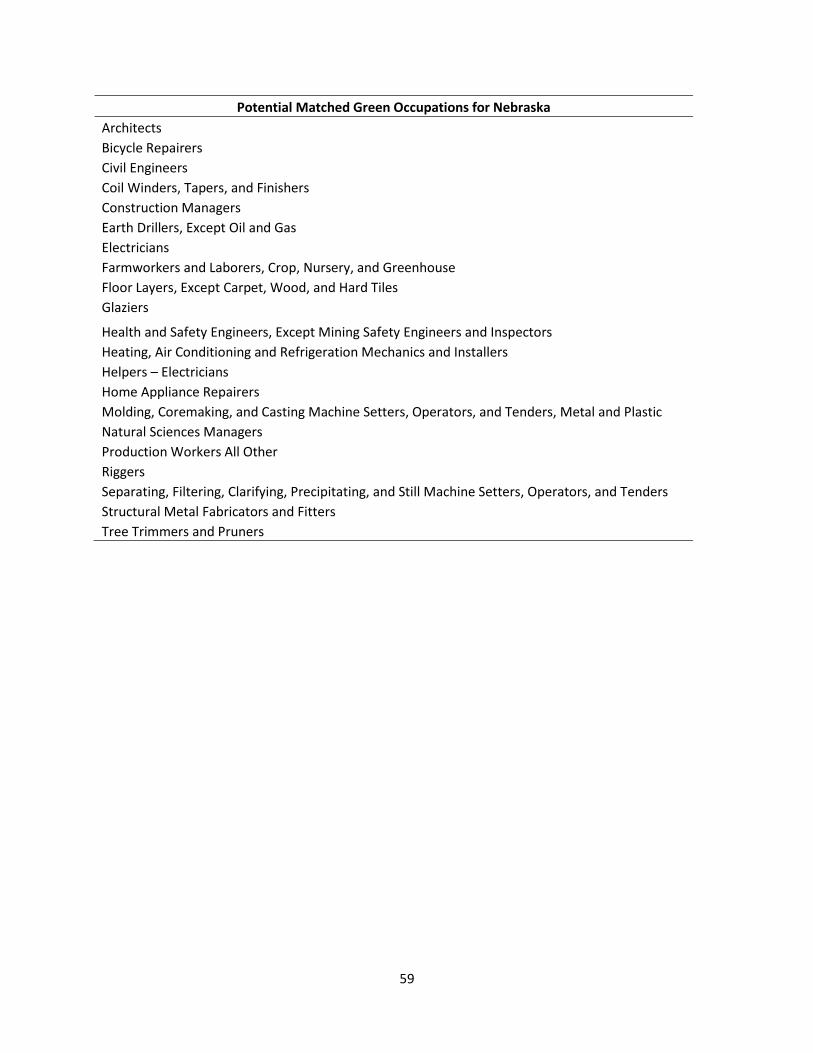
59
Potential Matched Green Occupations for Nebraska
Architects
Bicycle Repairers
Civil Engineers
Coil Winders, Tapers, and Finishers
Construction Managers
Earth Drillers, Except Oil and Gas
Electricians
Farmworkers and Laborers, Crop, Nursery, and Greenhouse
Floor Layers, Except Carpet, Wood, and Hard Tiles
Glaziers
Health and Safety Engineers, Except Mining Safety Engineers and Inspectors
Heating, Air Conditioning and Refrigeration Mechanics and Installers
Helpers – Electricians
Home Appliance Repairers
Molding, Coremaking, and Casting Machine Setters, Operators, and Tenders, Metal and Plastic
Natural Sciences Managers
Production Workers All Other
Riggers
Separating, Filtering, Clarifying, Precipitating, and Still Machine Setters, Operators, and Tenders
Structural Metal Fabricators and Fitters
Tree Trimmers and Pruners

60
Opportunities for Employment in Green Occupations in South Dakota
The state of South Dakota has sustained heavy job losses in manufacturing, construction,
and construction-related services industries (finance, real estate, legal services, and architects and
engineers) in recent years. While a recovery is underway in the manufacturing industry, many
jobs may not return. South Dakotans need new opportunities in growing sectors of the economy.
This flier examines opportunities in one potential growing sector: green occupations. Green
occupations contain a significant number of workers who “produce a product or service that
improves energy efficiency, expands the use of renewable energy, or supports environmental
sustainability.”
Comparisons between the skills and requirements of occupations suggest that jobs in
green occupations might be especially well-suited for displaced construction and manufacturing
workers. However, analysis of actual job changing behavior by displaced workers finds that
displaced manufacturing, construction, and construction-related services workers are all well-
suited to find a new job in a green occupation. Workers in these industries are more likely to find
new jobs in a green occupation than workers in other industries.
Researchers also found that displaced workers with a college degree or a Masters’ degree
are more likely to find a new job in a green occupation than other workers. However, there was
no difference in the likelihood of finding a new green job between workers with high school
degree, an associate’s degree or several years of college.
The Table on the next page shows the green occupations potentially suited for South
Dakota’s displaced manufacturing, construction, and construction-related services industry
workers.

61
Potential Matched Green Occupations for South Dakota
Architects
Bicycle Repairers
Coil Winders, Tapers, and Finishers
Construction Managers
Earth Drillers, Except Oil and Gas
Electricians
Farmworkers and Laborers, Crop, Nursery, and Greenhouse
Floor Layers, Except Carpet, Wood, and Hard Tiles
Glaziers
Hazardous Material Removal Workers
Heating, Air Condtioning and Refridgeration Mechanics and Installers
Helpers – Electricians
Home Appliance Repairers
Molding, Coremaking, and Casting Machine Setters, Operators, and Tenders, Metal and Plastic
Natural Sciences Managers
Production Workers All Other
Riggers
Separating, Filtering, Clarifying, Precipitating, and Still Machine Setters, Operators, and Tenders
Structural Metal Fabricators and Fitters
Tree Trimmers and Pruners

62
Opportunities for Employment in Green Occupations in Utah
The state of Utah has sustained heavy job losses in manufacturing, construction, and
construction-related services industries (finance, real estate, and architects and engineers) in
recent years. While a recovery is underway in the manufacturing industry, many jobs may not
return. Utah residents need new opportunities in growing sectors of the economy. This flier
examines opportunities in one potential growing sector: green occupations. Green occupations
contain a significant number of workers who “produce a product or service that improves energy
efficiency, expands the use of renewable energy, or supports environmental sustainability.”
Comparisons between the skills and requirements of occupations suggest that jobs in
green occupations might be especially well-suited for displaced construction and manufacturing
workers. However, analysis of actual job changing behavior by displaced workers finds that
displaced manufacturing, construction, and construction-related services workers are all well-
suited to find a new job in a green occupation. Workers in these industries are more likely to find
new jobs in a green occupation than workers in other industries.
Researchers also found that displaced workers with a college degree or a Masters’ degree
are more likely to find a new job in a green occupation than other workers. However, there was
no difference in the likelihood of finding a new green job between workers with high school
degree, an associate’s degree or several years of college.
The Table on the next page shows the green occupations potentially suited for Utah’s
displaced manufacturing, construction, and construction-related services industry workers.

63
Potential Matched Green Occupations for Utah
Architects
Bicycle Repairers
Civil Engineers
Coil Winders, Tapers, and Finishers
Construction Managers
Earth Drillers, Except Oil and Gas
Electricians
Farmworkers and Laborers, Crop, Nursery, and Greenhouse
Floor Layers, Except Carpet, Wood, and Hard Tiles
Glaziers
Hazardous Material Removal Workers
Health and Safety Engineers, Except Mining Safety Engineers and Inspectors
Heating, Air Conditioning and Refrigeration Mechanics and Installers
Helpers – Electricians
Home Appliance Repairers
Molding, Coremaking, and Casting Machine Setters, Operators, and Tenders, Metal and Plastic
Natural Sciences Managers
Production Workers All Other
Riggers
Separating, Filtering, Clarifying, Precipitating, and Still Machine Setters, Operators, and Tenders
Structural Metal Fabricators and Fitters
Tree Trimmers and Pruners

64
Opportunities for Employment in Green Occupations in Wyoming
The state of Wyoming has sustained heavy job losses in manufacturing, construction, and
construction-related services industries (real estate, legal services, and architects and engineers)
in recent years. While a recovery is underway in the manufacturing industry, many jobs may not
return. Wyoming residents need new opportunities in growing sectors of the economy. This flier
examines opportunities in one potential growing sector: green occupations. Green occupations
contain a significant number of workers who “produce a product or service that improves energy
efficiency, expands the use of renewable energy, or supports environmental sustainability.”
Comparisons between the skills and requirements of occupations suggest that jobs in
green occupations might be especially well-suited for displaced construction and manufacturing
workers. However, analysis of actual job changing behavior by displaced workers finds that
displaced manufacturing, construction, and construction-related services workers are all well-
suited to find a new job in a green occupation. Workers in these industries are more likely to find
new jobs in a green occupation than workers in other industries.
Researchers also found that displaced workers with a college degree or a Masters’ degree
are more likely to find a new job in a green occupation than other workers. However, there was
no difference in the likelihood of finding a new green job between workers with high school
degree, an associate’s degree or several years of college.
The Table on the next page shows the green occupations potentially suited for
Wyoming’s displaced manufacturing, construction, and construction-related services industry
workers.

65
Potential Matched Green Occupations for Wyoming
Architects
Bicycle Repairers
Civil Engineers
Coil Winders, Tapers, and Finishers
Construction Managers
Earth Drillers, Except Oil and Gas
Electricians
Environmental Science and Protection Technicians, Including Health
Floor Layers, Except Carpet, Wood, and Hard Tiles
Glaziers
Hazardous Material Removal Workers
Health and Safety Engineers, Except Mining Safety Engineers and Inspectors
Heating, Air Conditioning and Refrigeration Mechanics and Installers
Helpers – Electricians
Home Appliance Repairers
Molding, Coremaking, and Casting Machine Setters, Operators, and Tenders, Metal and Plastic
Natural Sciences Managers
Pesticide Handlers, Sprayers, and Applicators, Vegetation
Production Workers All Other
Riggers
Separating, Filtering, Clarifying, Precipitating, and Still Machine Setters, Operators, and Tenders
Structural Metal Fabricators and Fitters
Tree Trimmers and Pruners
Water and Liquid Waste Treatment Plant and System Operators

66
Appendix 1
List of 51 Green Occupations for Consortium States
Industry SOC Code
Construction Managers 11-9021
Natural Sciences Managers 11-9121
Architects, Except Landscape and Naval 17-1011
Landscape Architects 17-1012
Civil Engineers 17-2051
Environmental Engineers 17-2081
Health and Safety Engineers, Except Mining Safety Engineers and Inspectors 17-2111
Engineers, All Other 17-2199
Environmental Engineering Technicians 17-3025
Soil and Plant Scientists 19-1013
Zoologists and Wildlife Biologists 19-1023
Conservation Scientists 19-1031
Foresters 19-1032
Environmental Scientists and Specialists, Including Health 19-2041
Hydrologists 19-2043
Environmental Science and Protection Technicians, Including Health 19-4091
Forest and Conservation Technicians 19-4093
Forest and Conservation Technicians 27-1021
Fish and Game Wardens 33-3031
Cooks, All Other 35-2019
Pesticide Handlers, Sprayers, and Applicators, Vegetation 37-3012
Tree Trimmers and Pruners 37-3013
Sales and Related Workers, All Other 41-9099
First-Line Supervisors/Managers of Farming, Fishing, and Forestry Workers 45-1011
Farmworkers and Laborers, Crop, Nursery, and Greenhouse 45-2092
Floor Layers, Except Carpet, Wood, and Hard Tiles 47-2042
Electricians 47-2111
Glaziers 47-2121
Insulation Workers, Floor, Ceiling, and Wall 47-2131
Insulation Workers, Mechanical 47-2132
Helpers – Electricians 47-3031
Hazardous Material Removal Workers 47-4041
Septic Tank Servicers and Sewer Pipe Cleaners 47-4071
Construction and Related Workers, All Other 47-4099
Earth Drillers, Except Oil and Gas 47-5021
Roustabouts, Oil and Gas 47-5071
Heating, Air Conditioning, and Refrigeration Mechanics and Installers 49-9021

67
Appendix 1 (Continued)
List of 51 Green Occupations for Consortium States
Industry SOC Code
Bicycle Repairers 49-3091
Home Appliance Repairers 49-9031
Riggers 49-9096
Installation, Maintenance, and Repair Workers, All Other 49-9099
Coil Winders, Tapers, and Finishers 51-2021
Structural Metal Fabricators and Fitters 51-2041
Molding, Coremaking, and Casting Machine Setters, Operators, and Tenders, Metal 51-4072
Upholsterers 51-6093
Water and Liquid Waste Treatment Plant and System Operators 51-8031
Plant and System Operators, All Other 51-8099
Separating, Filtering, Clarifying, Precipitating, and Still Machine Setters, Ope 51-9012
Crushing, Grinding, and Polishing Machine Setters, Operators, and Tenders 51-9021
Production Workers, All Other 51-9199
Refuse and Recyclable Material Collectors 53-7081