manufacturing: an economic driver for jobs and …
TRANSCRIPT
MANUFACTURING: AN ECONOMIC DRIVER FOR JOBS
AND FLORIDA’S FUTURE
August 2011
Florida TaxWatch Center for Competitive Florida
MANUFACTURING: AN ECONOMIC DRIVER FOR JOBS AND FLORIDA’S FUTURE Table of Contents
Executive Summary i
Introduction 1
Section 1: Examining Florida’s Manufacturing Sector 2 Section 1.A: Manufacturing is Responsible for a Significant Amount of Employment in Florida 3 Section 1.B: Wages are Higher in Florida’s Manufacturing Sector 4 Section 1.C: Manufacturing Sector Personal Income has Remained Stable During the Recession 6 Section 1.D: Manufacturing is a High Value-Added Economic Sector 11 Section 1.E: Additional Benefits 13 Section 1: Conclusion 14
Section 2: Florida is Lagging Behind Other Southern States in Manufacturing Capital Expenditures 15 Section 2 Conclusion 17
Section 3: Why Florida is Less Attractive to Manufacturing-Related Capital Expenditures and Investments 18 Section 3 Conclusion 19
Section 4: Potential Benefits of Growing Manufacturing Sector 20
Section 5: Florida TaxWatch Recommendations 22
List of Figures and Tables
Figure 1: Distribution of Non-Farm, Non-Government Jobs in Florida 2
Figure 2: Florida Private Sector Average Annual Wages in $000 4
Figure 3: Ratio of Select Manufacturing Sector Wages to Average Florida Wage 5
Figure 4: State-Wide Total Personal Income from Select Sectors in Florida 6
Figure 5: Florida’s Highest Sectors for Personal Income are: State & Local Government, and Health Care & Social Assistance
7
Figure 6: Personal Income from Manufacturing Remains Relatively Steady 8
Figure 7: Ratio of Manufacturing Income to Total Farm & Farm Proprietors Income 9
Figure 8: Coefficient of Variation in Florida Personal Income by Sector 10
Figure 9: Personal Income in Florida from Durable & Non-Durable Manufacturing Sectors 11
Figure 10: Capital Expenditures and Value-Added per Production Worker 12
Figure 11: Wages per Hour Worked Compared to Value Added Per Production Worker 12
Figure 12: 2008 Manufacturing Capital Expenditures for Southern States 14Figure 13: 2008: Florida has Lowest Per Capita Manufacturing Capital Expenditures of Select Southern States 16Figure 14: Per Capita Capital Expenditures on Manufacturing Decrease from 2008 to 2009 17
Figure 15: Cumulative Economic Impact on Florida of 1,000 new Manufacturing Jobs Created in Miami 21
Table 1: Manufacturing Jobs by Florida MSA 3
Table 2: First Year Economic Impact on Florida of 1,000 New Manufacturing Jobs 21
i
Executive Summary
he manufacturing sector plays an important role in Florida’s economy. Manufacturing is
a significant provider of high-wage and high value-added jobs in the state; however, Florida
is lagging behind in manufacturing investment due to significant, identifiable barriers.
Florida’s manufacturing sector accounts for approximately 5 percent of “non-farm, non-
government” employment in the state. The average annual wages paid in Florida’s
manufacturing sector are higher than the state average annual private sector wage. Furthermore,
manufacturing has the smallest volatility in personal income streams of all other sectors in
Florida – including military, federal civilian, and other government categories – and industries
that provide steady income to Florida residents help smooth out tax receipts and provide stability
to the state’s economy, even during recessionary periods. It is also a capital-intensive sector (i.e.,
high capital expenditures, which means higher value-added per worker), is key to Florida’s
exports, is a driver of research and development, and has the biggest multiplier of all industries
in Florida
However, Florida is losing to competitor states in capital investment in manufacturing, as it has
the lowest per capita capital expenditures on manufacturing among the 12 southern states. Low
capital investment in manufacturing in Florida results partially from the state taxing capital
formation through sales taxes on machinery and equipment, and through Tangible Personal
Property taxes. Also, Florida’s economic development incentive programs, specifically the
Qualified Target Industries (QTI) and Capital Investment Tax Credit (CITC), are not well-
targeted toward manufacturing and are ineffective at attracting many manufacturing industries.
To estimate the economic benefits of growing the manufacturing sector in Florida, an estimate of
value per added manufacturing job in Florida was obtained using a well-respected econometric
model. The model shows that if 1,000 manufacturing jobs were created in Miami-Dade County
annually from 2012 to 2021, an additional cumulative 24,213 jobs would be added in Florida by
2021. In the first year alone, a total economic impact of $570 million to Florida’s economy
should be realized through personal consumption expenditures, gross private domestic
investment, change in private inventories, exports and imports of goods and services, and
government consumption and investment.
Florida has a great opportunity to increase the state’s manufacturing sector, which will attract
capital, create high-wage jobs, increase productivity, and enhance economic stability for the
state. Florida’s political and economic leaders must take active steps to make Florida more
attractive to manufacturers. Ways in which to achieve this are to incentivize capital investment
by modifying the current QTI and CITC programs to positively affect the manufacturing sector,
reduce penalties for accumulating productive capital in Florida by lowering and eliminating taxes
on inputs to manufacturing, and to continue to improve Florida’s infrastructure with investments,
such as the forthcoming deepening of the Port of Miami.
T
1
Introduction
or decades, people have thought of Florida’s economy in terms of NASA space shuttles,
citrus groves, and endless beachfronts. Yet, as we move into an increasingly global
economy, we must envision a new direction for Florida’s economy in which manufacturing plays
an important part. In fact, the manufacturing sector already plays a key role in Florida’s
economy; however, more focus on this unique sector is needed for it to continue to grow and
drive Florida’s economic growth.
According to existing economic data, Florida’s manufacturing sector is a significant employer
that provides high-wage and high-value added jobs, and is more stable than most other economic
sectors. However, Florida lags behind other southern states in
manufacturing investment per capita and is losing an important
opportunity for economic growth through manufacturing related capital
formation and job creation due to significant, identifiable barriers to
growing this vital sector.
This Florida TaxWatch Research Report examines Florida’s
manufacturing sector to reveal its importance to the state’s economy,
identifies barriers to growth of the sector, and recommends changes to the
state’s economic development policy to ensure that manufacturing remains to be a driving force
for Florida’s economic growth in the 21st Century.
F
Manufacturing is the 6th largest distinct “non-farm, non-
government” employment sector in Florida, accounting for
approximately 5 percent of “non-farm, non-government”
employment. The average annual wages paid in Florida’s
manufacturing sector are higher than the state average
annual private sector wage.
2
Section 1: Examining Florida’s Manufacturing Sector
n examination of economic data reveals that Florida’s manufacturing sector creates a
significant amount of employment in the state (Section 1.A); has high wage jobs (Section
1.B); provides income stability (Section 1.C); is a high value-added economic sector for Florida
(Section 1.D); and has other economic advantages for Florida.
Section 1.A: Manufacturing is Responsible for a Significant Amount of
Employment in Florida
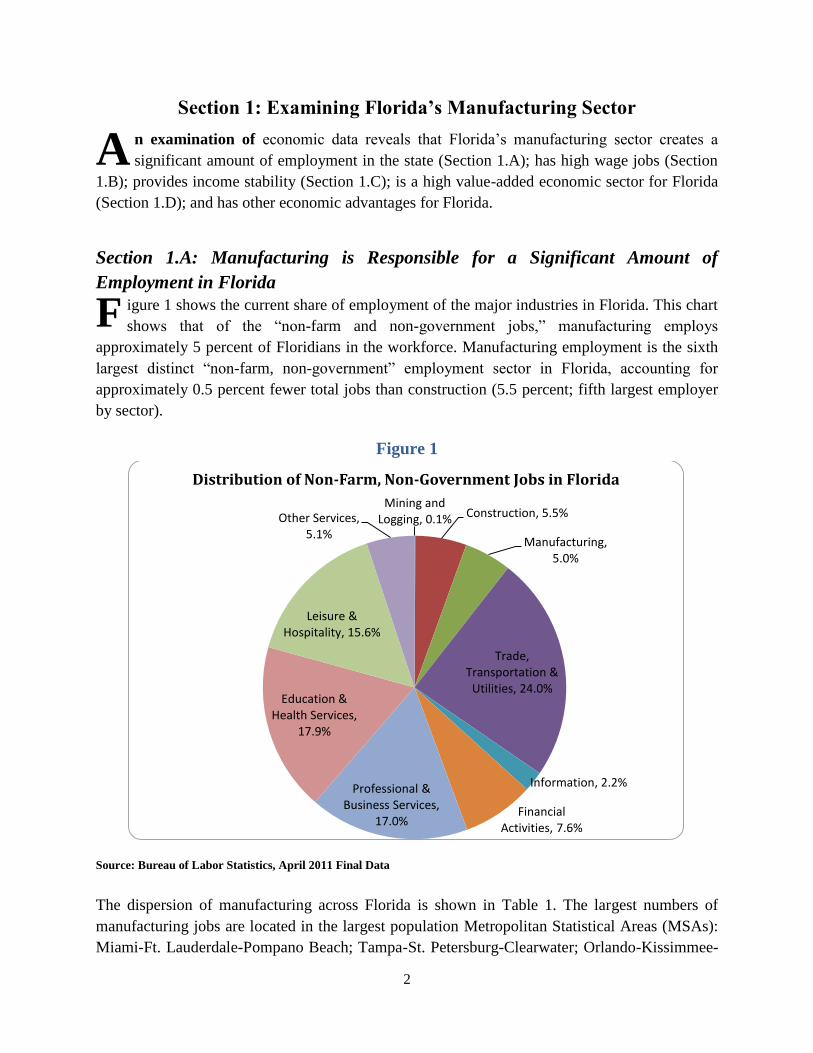
igure 1 shows the current share of employment of the major industries in Florida. This chart
shows that of the “non-farm and non-government jobs,” manufacturing employs
approximately 5 percent of Floridians in the workforce. Manufacturing employment is the sixth
largest distinct “non-farm, non-government” employment sector in Florida, accounting for
approximately 0.5 percent fewer total jobs than construction (5.5 percent; fifth largest employer
by sector).
Figure 1
Source: Bureau of Labor Statistics, April 2011 Final Data
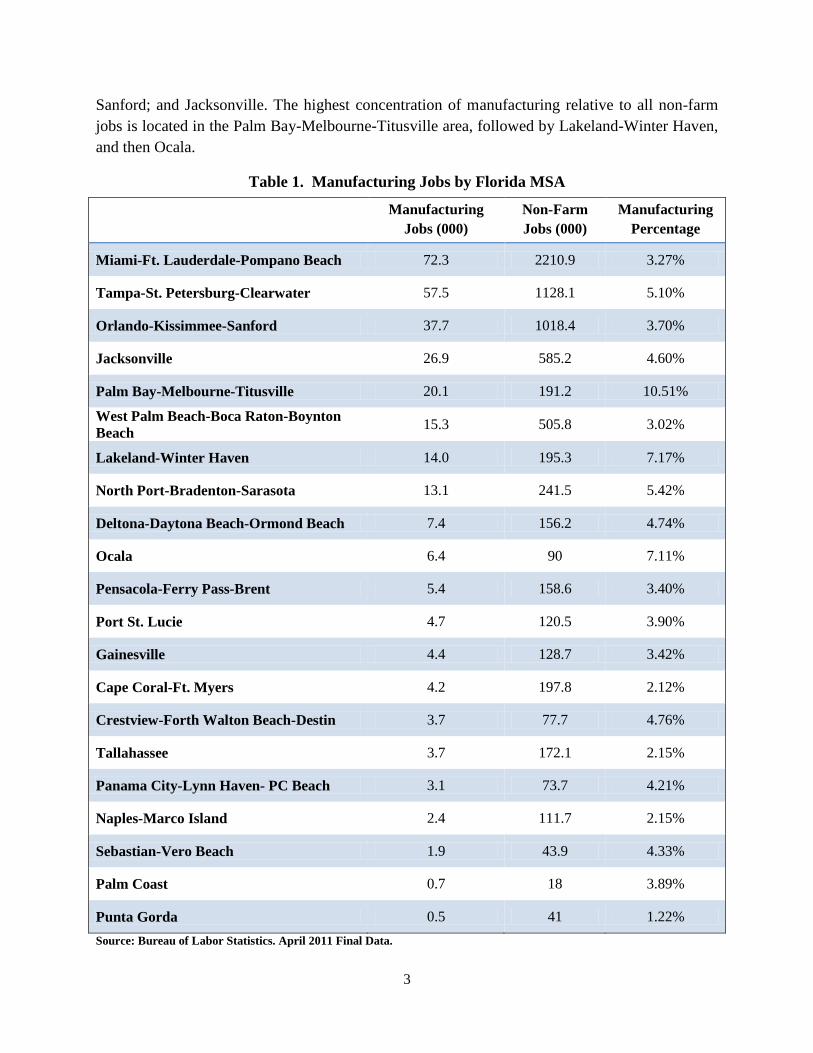
The dispersion of manufacturing across Florida is shown in Table 1. The largest numbers of
manufacturing jobs are located in the largest population Metropolitan Statistical Areas (MSAs):
Miami-Ft. Lauderdale-Pompano Beach; Tampa-St. Petersburg-Clearwater; Orlando-Kissimmee-
Mining and Logging, 0.1% Construction, 5.5%
Manufacturing, 5.0%
Trade, Transportation &
Utilities, 24.0%
Information, 2.2%
Financial Activities, 7.6%
Professional & Business Services,
17.0%
Education & Health Services,
17.9%
Leisure & Hospitality, 15.6%
Other Services, 5.1%
Distribution of Non-Farm, Non-Government Jobs in Florida
A
F
3
Sanford; and Jacksonville. The highest concentration of manufacturing relative to all non-farm
jobs is located in the Palm Bay-Melbourne-Titusville area, followed by Lakeland-Winter Haven,
and then Ocala.
Table 1. Manufacturing Jobs by Florida MSA
Manufacturing
Jobs (000)
Non-Farm
Jobs (000)
Manufacturing
Percentage
Miami-Ft. Lauderdale-Pompano Beach 72.3 2210.9 3.27%
Tampa-St. Petersburg-Clearwater 57.5 1128.1 5.10%
Orlando-Kissimmee-Sanford 37.7 1018.4 3.70%
Jacksonville 26.9 585.2 4.60%
Palm Bay-Melbourne-Titusville 20.1 191.2 10.51%
West Palm Beach-Boca Raton-Boynton
Beach 15.3 505.8 3.02%
Lakeland-Winter Haven 14.0 195.3 7.17%
North Port-Bradenton-Sarasota 13.1 241.5 5.42%
Deltona-Daytona Beach-Ormond Beach 7.4 156.2 4.74%
Ocala 6.4 90 7.11%
Pensacola-Ferry Pass-Brent 5.4 158.6 3.40%
Port St. Lucie 4.7 120.5 3.90%
Gainesville 4.4 128.7 3.42%
Cape Coral-Ft. Myers 4.2 197.8 2.12%
Crestview-Forth Walton Beach-Destin 3.7 77.7 4.76%
Tallahassee 3.7 172.1 2.15%
Panama City-Lynn Haven- PC Beach 3.1 73.7 4.21%
Naples-Marco Island 2.4 111.7 2.15%
Sebastian-Vero Beach 1.9 43.9 4.33%
Palm Coast 0.7 18 3.89%
Punta Gorda 0.5 41 1.22%
Source: Bureau of Labor Statistics. April 2011 Final Data.
4
Section 1.B: Wages are Higher in Florida’s Manufacturing Sector
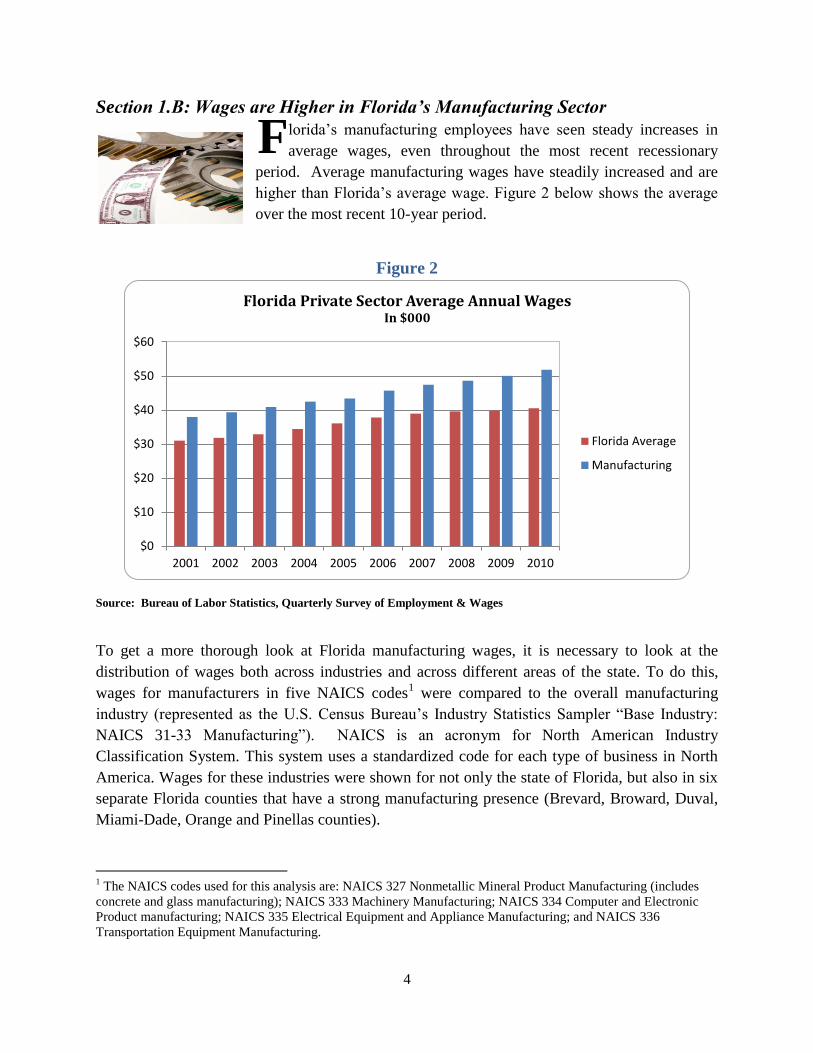
lorida’s manufacturing employees have seen steady increases in
average wages, even throughout the most recent recessionary
period. Average manufacturing wages have steadily increased and are
higher than Florida’s average wage. Figure 2 below shows the average
over the most recent 10-year period.
Figure 2
Source: Bureau of Labor Statistics, Quarterly Survey of Employment & Wages
To get a more thorough look at Florida manufacturing wages, it is necessary to look at the
distribution of wages both across industries and across different areas of the state. To do this,
wages for manufacturers in five NAICS codes1 were compared to the overall manufacturing
industry (represented as the U.S. Census Bureau’s Industry Statistics Sampler “Base Industry:
NAICS 31-33 Manufacturing”). NAICS is an acronym for North American Industry
Classification System. This system uses a standardized code for each type of business in North
America. Wages for these industries were shown for not only the state of Florida, but also in six
separate Florida counties that have a strong manufacturing presence (Brevard, Broward, Duval,
Miami-Dade, Orange and Pinellas counties).
1 The NAICS codes used for this analysis are: NAICS 327 Nonmetallic Mineral Product Manufacturing (includes
concrete and glass manufacturing); NAICS 333 Machinery Manufacturing; NAICS 334 Computer and Electronic
Product manufacturing; NAICS 335 Electrical Equipment and Appliance Manufacturing; and NAICS 336
Transportation Equipment Manufacturing.
$0
$10
$20
$30
$40
$50
$60
2001 2002 2003 2004 2005 2006 2007 2008 2009 2010
Florida Private Sector Average Annual Wages In $000
Florida Average
Manufacturing
F
5
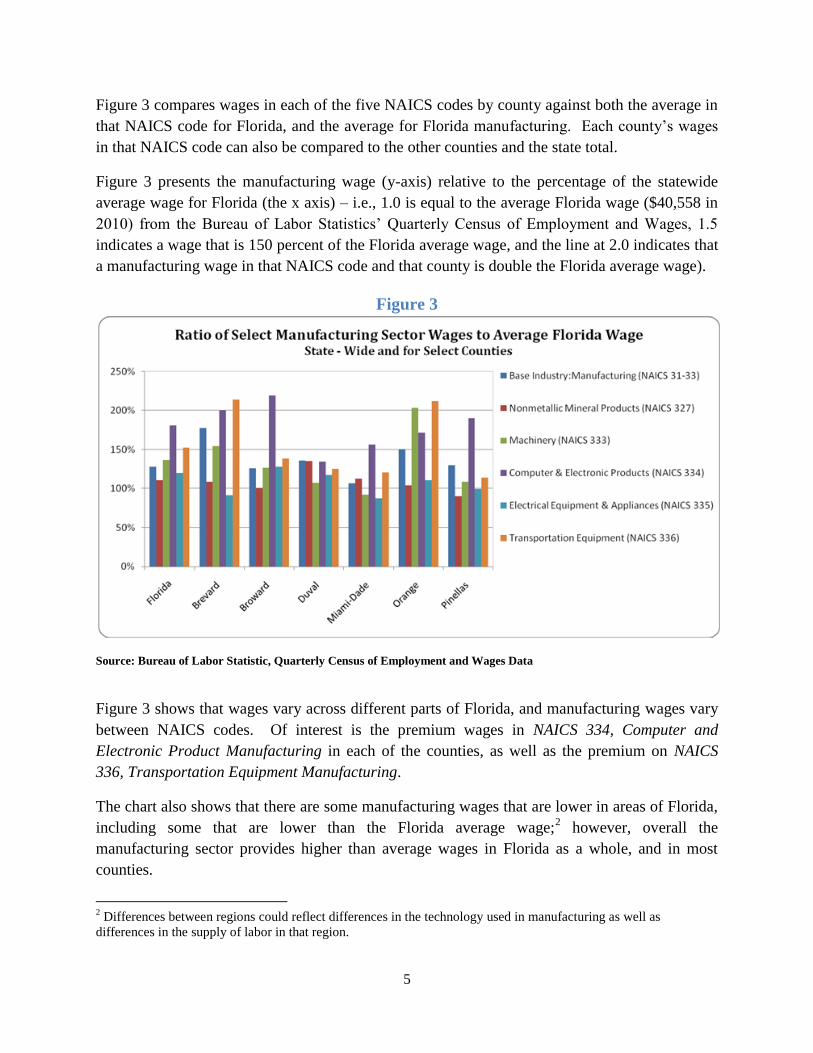
Figure 3 compares wages in each of the five NAICS codes by county against both the average in
that NAICS code for Florida, and the average for Florida manufacturing. Each county’s wages
in that NAICS code can also be compared to the other counties and the state total.
Figure 3 presents the manufacturing wage (y-axis) relative to the percentage of the statewide
average wage for Florida (the x axis) – i.e., 1.0 is equal to the average Florida wage ($40,558 in
2010) from the Bureau of Labor Statistics’ Quarterly Census of Employment and Wages, 1.5
indicates a wage that is 150 percent of the Florida average wage, and the line at 2.0 indicates that
a manufacturing wage in that NAICS code and that county is double the Florida average wage).
Figure 3
Source: Bureau of Labor Statistic, Quarterly Census of Employment and Wages Data
Figure 3 shows that wages vary across different parts of Florida, and manufacturing wages vary
between NAICS codes. Of interest is the premium wages in NAICS 334, Computer and
Electronic Product Manufacturing in each of the counties, as well as the premium on NAICS
336, Transportation Equipment Manufacturing.
The chart also shows that there are some manufacturing wages that are lower in areas of Florida,
including some that are lower than the Florida average wage;2 however, overall the
manufacturing sector provides higher than average wages in Florida as a whole, and in most
counties.
2 Differences between regions could reflect differences in the technology used in manufacturing as well as
differences in the supply of labor in that region.
6
Section 1.C: Manufacturing Sector Personal Income has Remained Stable
During the Recession
ersonal income includes wages and salary disbursements, personal dividend income,
personal interest income, and transfer payments to persons. These figures do not include
capital gains or asset sales. To be clear, the figures used throughout this paper are nominal
personal income, as opposed to real personal income. The difference between the two types is
that real personal income is inflation adjusted.
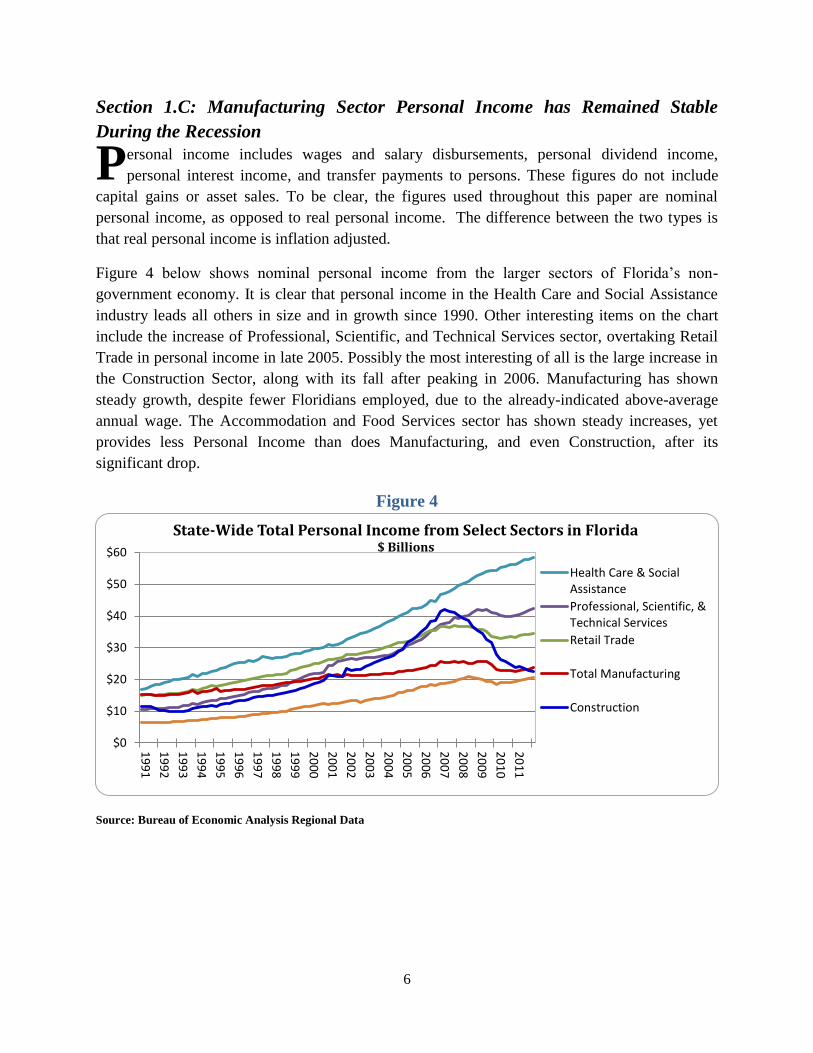
Figure 4 below shows nominal personal income from the larger sectors of Florida’s non-
government economy. It is clear that personal income in the Health Care and Social Assistance
industry leads all others in size and in growth since 1990. Other interesting items on the chart
include the increase of Professional, Scientific, and Technical Services sector, overtaking Retail
Trade in personal income in late 2005. Possibly the most interesting of all is the large increase in
the Construction Sector, along with its fall after peaking in 2006. Manufacturing has shown
steady growth, despite fewer Floridians employed, due to the already-indicated above-average
annual wage. The Accommodation and Food Services sector has shown steady increases, yet
provides less Personal Income than does Manufacturing, and even Construction, after its
significant drop.
Figure 4
Source: Bureau of Economic Analysis Regional Data
$0
$10
$20
$30
$40
$50
$60
19
91
19
92
19
93
19
94
19
95
19
96
19
97
19
98
19
99
20
00
20
01
20
02
20
03
20
04
20
05
20
06
20
07
20
08
20
09
20
10
20
11
State-Wide Total Personal Income from Select Sectors in Florida $ Billions
Health Care & SocialAssistance
Professional, Scientific, &Technical Services
Retail Trade
Total Manufacturing
Construction
P
7
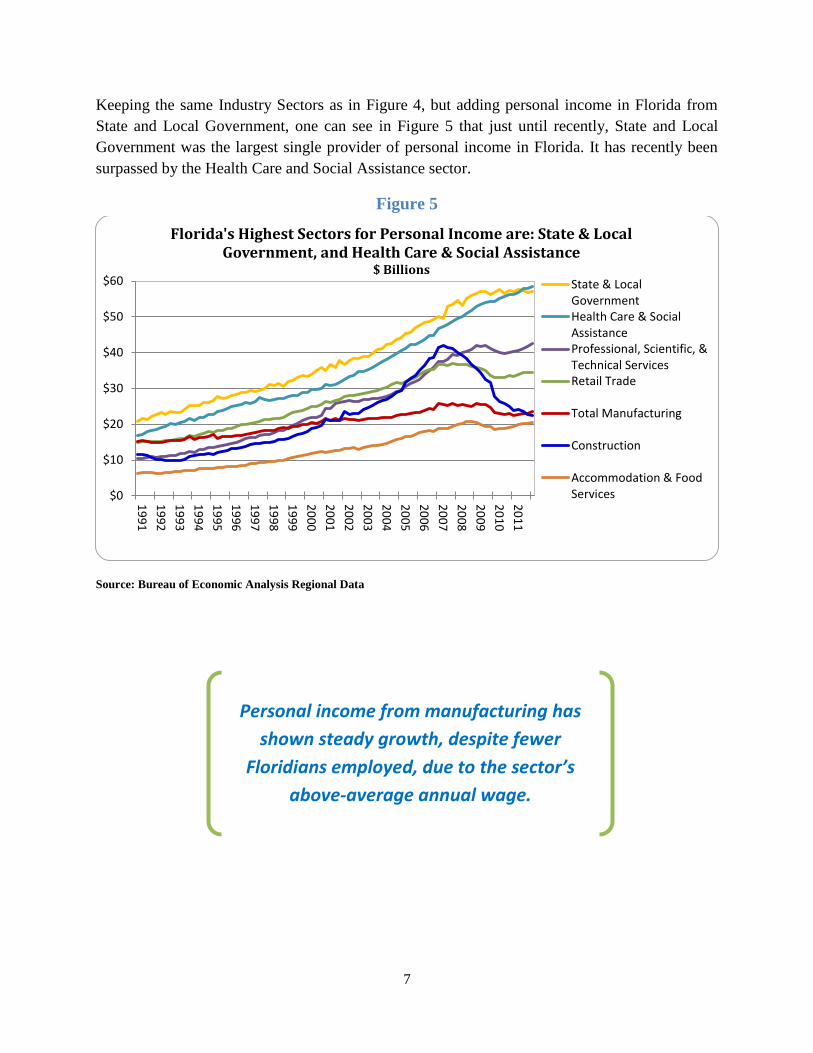
Keeping the same Industry Sectors as in Figure 4, but adding personal income in Florida from
State and Local Government, one can see in Figure 5 that just until recently, State and Local
Government was the largest single provider of personal income in Florida. It has recently been
surpassed by the Health Care and Social Assistance sector.
Figure 5
Source: Bureau of Economic Analysis Regional Data
$0
$10
$20
$30
$40
$50
$60
19
91
19
92
19
93
19
94
19
95
19
96
19
97
19
98
19
99
20
00
20
01
20
02
20
03
20
04
20
05
20
06
20
07
20
08
20
09
20
10
20
11
Florida's Highest Sectors for Personal Income are: State & Local Government, and Health Care & Social Assistance
$ Billions State & LocalGovernmentHealth Care & SocialAssistanceProfessional, Scientific, &Technical ServicesRetail Trade
Total Manufacturing
Construction
Accommodation & FoodServices
Personal income from manufacturing has
shown steady growth, despite fewer
Floridians employed, due to the sector’s
above-average annual wage.
8
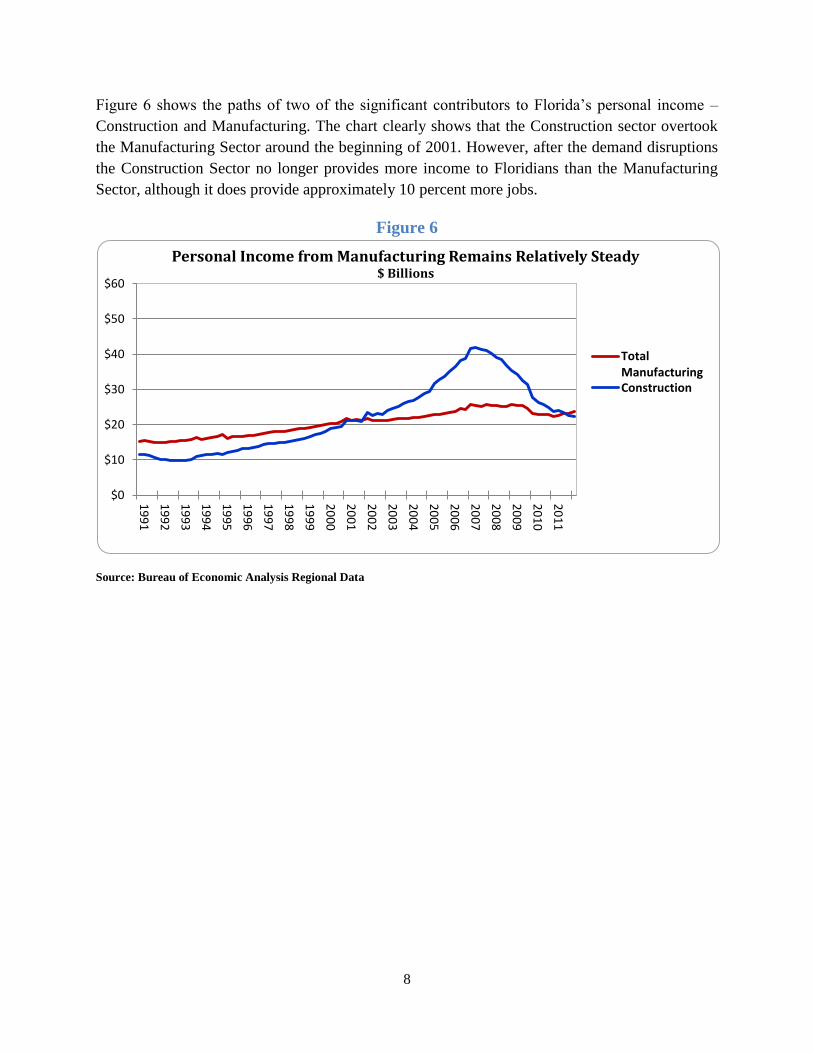
Figure 6 shows the paths of two of the significant contributors to Florida’s personal income –
Construction and Manufacturing. The chart clearly shows that the Construction sector overtook
the Manufacturing Sector around the beginning of 2001. However, after the demand disruptions
the Construction Sector no longer provides more income to Floridians than the Manufacturing
Sector, although it does provide approximately 10 percent more jobs.
Figure 6
Source: Bureau of Economic Analysis Regional Data
$0
$10
$20
$30
$40
$50
$60
19
91
19
92
19
93
19
94
19
95
19
96
19
97
19
98
19
99
20
00
20
01
20
02
20
03
20
04
20
05
20
06
20
07
20
08
20
09
20
10
20
11
Personal Income from Manufacturing Remains Relatively Steady $ Billions
TotalManufacturingConstruction
9
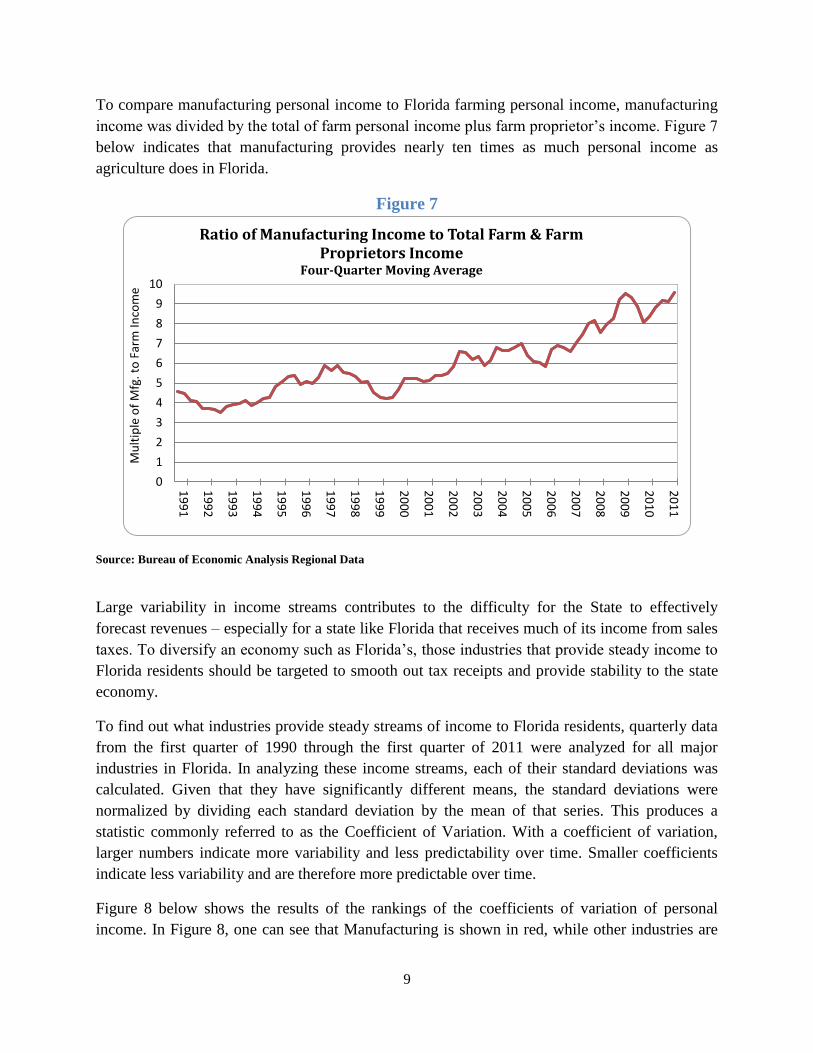
To compare manufacturing personal income to Florida farming personal income, manufacturing
income was divided by the total of farm personal income plus farm proprietor’s income. Figure 7
below indicates that manufacturing provides nearly ten times as much personal income as
agriculture does in Florida.
Figure 7
Source: Bureau of Economic Analysis Regional Data
Large variability in income streams contributes to the difficulty for the State to effectively
forecast revenues – especially for a state like Florida that receives much of its income from sales
taxes. To diversify an economy such as Florida’s, those industries that provide steady income to
Florida residents should be targeted to smooth out tax receipts and provide stability to the state
economy.
To find out what industries provide steady streams of income to Florida residents, quarterly data
from the first quarter of 1990 through the first quarter of 2011 were analyzed for all major
industries in Florida. In analyzing these income streams, each of their standard deviations was
calculated. Given that they have significantly different means, the standard deviations were
normalized by dividing each standard deviation by the mean of that series. This produces a
statistic commonly referred to as the Coefficient of Variation. With a coefficient of variation,
larger numbers indicate more variability and less predictability over time. Smaller coefficients
indicate less variability and are therefore more predictable over time.
Figure 8 below shows the results of the rankings of the coefficients of variation of personal
income. In Figure 8, one can see that Manufacturing is shown in red, while other industries are
0
1
2
3
4
5
6
7
8
9
10
19
91
19
92
19
93
19
94
19
95
19
96
19
97
19
98
19
99
20
00
20
01
20
02
20
03
20
04
20
05
20
06
20
07
20
08
20
09
20
10
20
11
Mu
ltip
le o
f M
fg. t
o F
arm
Inco
me
Ratio of Manufacturing Income to Total Farm & Farm Proprietors Income
Four-Quarter Moving Average
10
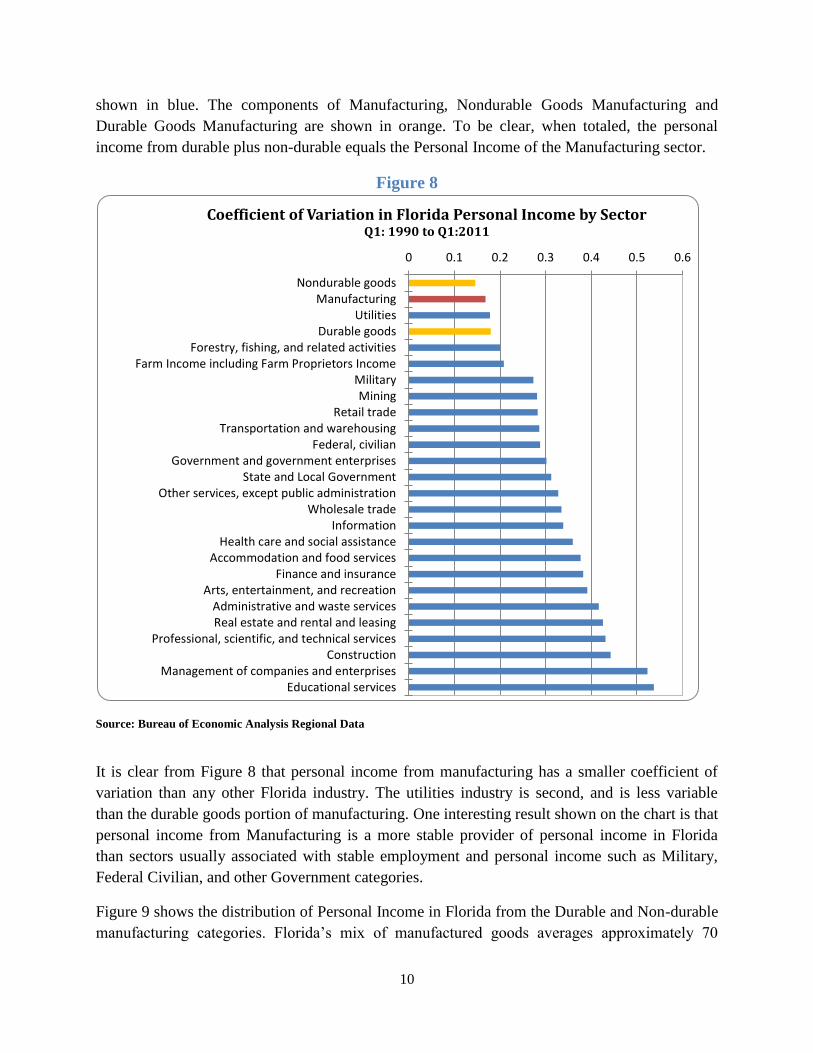
shown in blue. The components of Manufacturing, Nondurable Goods Manufacturing and
Durable Goods Manufacturing are shown in orange. To be clear, when totaled, the personal
income from durable plus non-durable equals the Personal Income of the Manufacturing sector.
Figure 8
Source: Bureau of Economic Analysis Regional Data
It is clear from Figure 8 that personal income from manufacturing has a smaller coefficient of
variation than any other Florida industry. The utilities industry is second, and is less variable
than the durable goods portion of manufacturing. One interesting result shown on the chart is that
personal income from Manufacturing is a more stable provider of personal income in Florida
than sectors usually associated with stable employment and personal income such as Military,
Federal Civilian, and other Government categories.
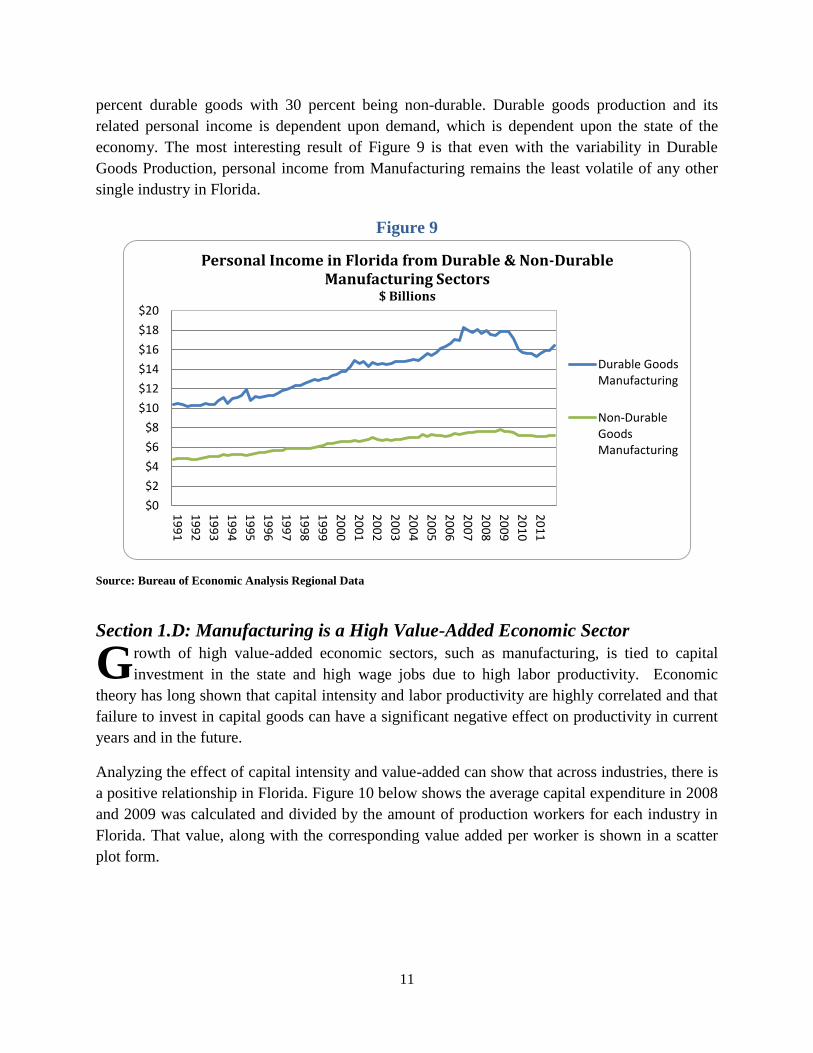
Figure 9 shows the distribution of Personal Income in Florida from the Durable and Non-durable
manufacturing categories. Florida’s mix of manufactured goods averages approximately 70
0 0.1 0.2 0.3 0.4 0.5 0.6
Nondurable goods Manufacturing
Utilities Durable goods
Forestry, fishing, and related activitiesFarm Income including Farm Proprietors Income
Military Mining
Retail trade Transportation and warehousing
Federal, civilian Government and government enterprises
State and Local Government Other services, except public administration
Wholesale trade Information
Health care and social assistance Accommodation and food services
Finance and insurance Arts, entertainment, and recreation
Administrative and waste services Real estate and rental and leasing
Professional, scientific, and technical services Construction
Management of companies and enterprises Educational services
Coefficient of Variation in Florida Personal Income by Sector Q1: 1990 to Q1:2011
11
percent durable goods with 30 percent being non-durable. Durable goods production and its
related personal income is dependent upon demand, which is dependent upon the state of the
economy. The most interesting result of Figure 9 is that even with the variability in Durable
Goods Production, personal income from Manufacturing remains the least volatile of any other
single industry in Florida.
Figure 9
Source: Bureau of Economic Analysis Regional Data
Section 1.D: Manufacturing is a High Value-Added Economic Sector
rowth of high value-added economic sectors, such as manufacturing, is tied to capital
investment in the state and high wage jobs due to high labor productivity. Economic
theory has long shown that capital intensity and labor productivity are highly correlated and that
failure to invest in capital goods can have a significant negative effect on productivity in current
years and in the future.
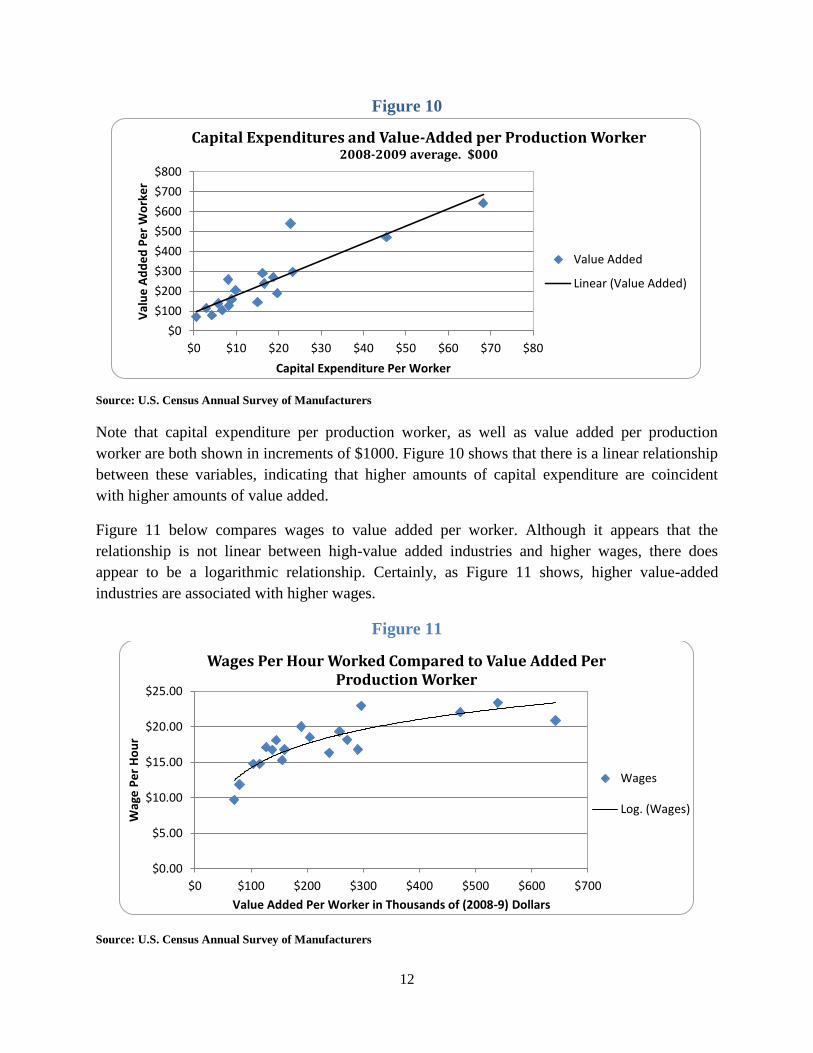
Analyzing the effect of capital intensity and value-added can show that across industries, there is
a positive relationship in Florida. Figure 10 below shows the average capital expenditure in 2008
and 2009 was calculated and divided by the amount of production workers for each industry in
Florida. That value, along with the corresponding value added per worker is shown in a scatter
plot form.
$0
$2
$4
$6
$8
$10
$12
$14
$16
$18
$20
19
91
19
92
19
93
19
94
19
95
19
96
19
97
19
98
19
99
20
00
20
01
20
02
20
03
20
04
20
05
20
06
20
07
20
08
20
09
20
10
20
11
Personal Income in Florida from Durable & Non-Durable Manufacturing Sectors
$ Billions
Durable GoodsManufacturing
Non-DurableGoodsManufacturing
G
12
Figure 10
Source: U.S. Census Annual Survey of Manufacturers
Note that capital expenditure per production worker, as well as value added per production
worker are both shown in increments of $1000. Figure 10 shows that there is a linear relationship
between these variables, indicating that higher amounts of capital expenditure are coincident
with higher amounts of value added.
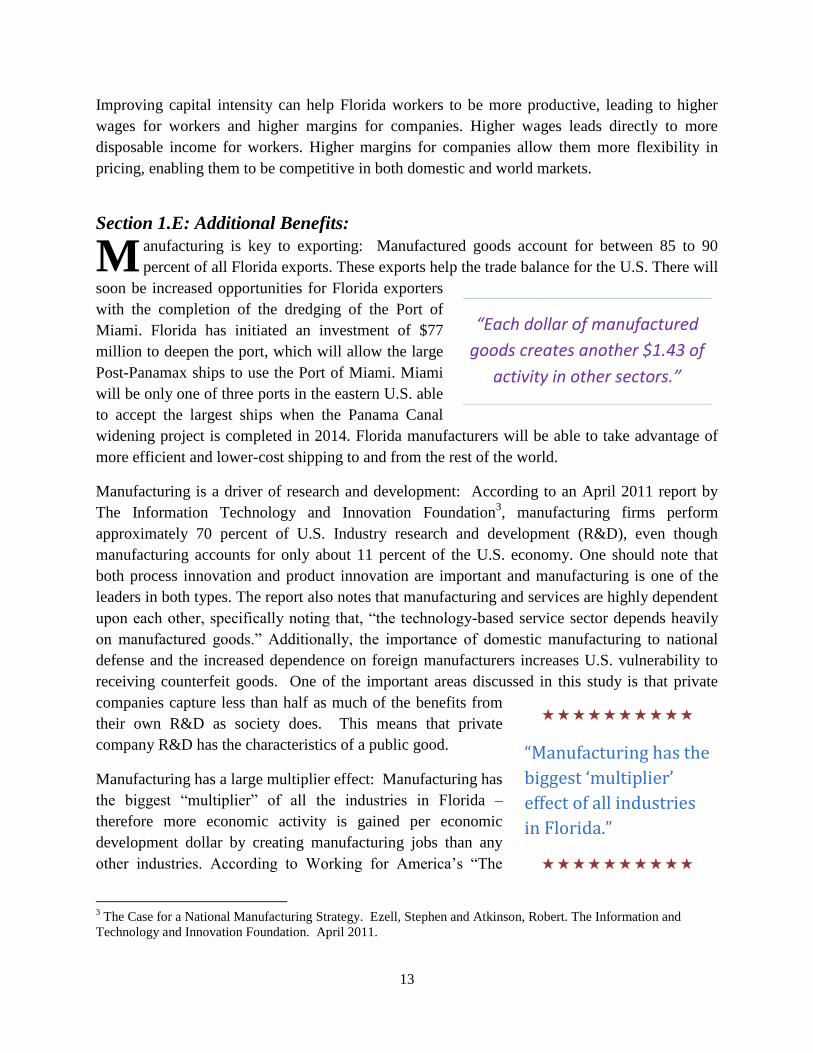
Figure 11 below compares wages to value added per worker. Although it appears that the
relationship is not linear between high-value added industries and higher wages, there does
appear to be a logarithmic relationship. Certainly, as Figure 11 shows, higher value-added
industries are associated with higher wages.
Figure 11
Source: U.S. Census Annual Survey of Manufacturers
$0
$100
$200
$300
$400
$500
$600
$700
$800
$0 $10 $20 $30 $40 $50 $60 $70 $80
Val
ue
Ad
de
d P
er
Wo
rke
r
Capital Expenditure Per Worker
Capital Expenditures and Value-Added per Production Worker 2008-2009 average. $000
Value Added
Linear (Value Added)
$0.00
$5.00
$10.00
$15.00
$20.00
$25.00
$0 $100 $200 $300 $400 $500 $600 $700
Wag
e P
er
Ho
ur
Value Added Per Worker in Thousands of (2008-9) Dollars
Wages Per Hour Worked Compared to Value Added Per Production Worker
Wages
Log. (Wages)
13
“Each dollar of manufactured
goods creates another $1.43 of
activity in other sectors.”
Improving capital intensity can help Florida workers to be more productive, leading to higher
wages for workers and higher margins for companies. Higher wages leads directly to more
disposable income for workers. Higher margins for companies allow them more flexibility in
pricing, enabling them to be competitive in both domestic and world markets.
Section 1.E: Additional Benefits:
anufacturing is key to exporting: Manufactured goods account for between 85 to 90
percent of all Florida exports. These exports help the trade balance for the U.S. There will
soon be increased opportunities for Florida exporters
with the completion of the dredging of the Port of
Miami. Florida has initiated an investment of $77
million to deepen the port, which will allow the large
Post-Panamax ships to use the Port of Miami. Miami
will be only one of three ports in the eastern U.S. able
to accept the largest ships when the Panama Canal
widening project is completed in 2014. Florida manufacturers will be able to take advantage of
more efficient and lower-cost shipping to and from the rest of the world.
Manufacturing is a driver of research and development: According to an April 2011 report by
The Information Technology and Innovation Foundation3, manufacturing firms perform
approximately 70 percent of U.S. Industry research and development (R&D), even though
manufacturing accounts for only about 11 percent of the U.S. economy. One should note that
both process innovation and product innovation are important and manufacturing is one of the
leaders in both types. The report also notes that manufacturing and services are highly dependent
upon each other, specifically noting that, “the technology-based service sector depends heavily
on manufactured goods.” Additionally, the importance of domestic manufacturing to national
defense and the increased dependence on foreign manufacturers increases U.S. vulnerability to
receiving counterfeit goods. One of the important areas discussed in this study is that private
companies capture less than half as much of the benefits from
their own R&D as society does. This means that private
company R&D has the characteristics of a public good.
Manufacturing has a large multiplier effect: Manufacturing has
the biggest “multiplier” of all the industries in Florida –
therefore more economic activity is gained per economic
development dollar by creating manufacturing jobs than any
other industries. According to Working for America’s “The
3 The Case for a National Manufacturing Strategy. Ezell, Stephen and Atkinson, Robert. The Information and
Technology and Innovation Foundation. April 2011.
M
“Manufacturing has the
biggest ‘multiplier’
effect of all industries
in Florida.”
14
Economic Overview of Manufacturing”, manufacturing has the highest multiplier of all sectors.
It indicates that each dollar of manufactured goods creates another $1.43 of activity in other
sectors. Further, it indicates that the manufacturing multiple is just over double the multiplier for
services.
Section 1 Conclusion
he economic data examined in this section reveals that Florida’s manufacturing sector is
responsible for a significant amount of employment in the state and provides higher wages
and Florida economic stability in terms of number of businesses operating, employment, and
levels of personal income for those involved in the sector. This is especially important given
Florida’s consumption based fiscal portfolio. Furthermore, manufacturing is a high-value
economic sector that adds significantly to Florida’s economy.
T
15
Section 2: Florida is Lagging Behind Other Southern States in
Manufacturing Capital Expenditures
apital intensity of manufacturing enterprises is important for many reasons. It is especially
interesting to economists because it affects the productivity of labor. Typically the more
capital intensive a process is, the more productive labor is. There are high correlations between
labor productivity and wages – therefore high productivity of labor is something both private
industry and the State should encourage. This is especially true for states that are dependent upon
sales tax receipts for their income – higher wages means higher discretionary spending, therefore
higher sales tax receipts.
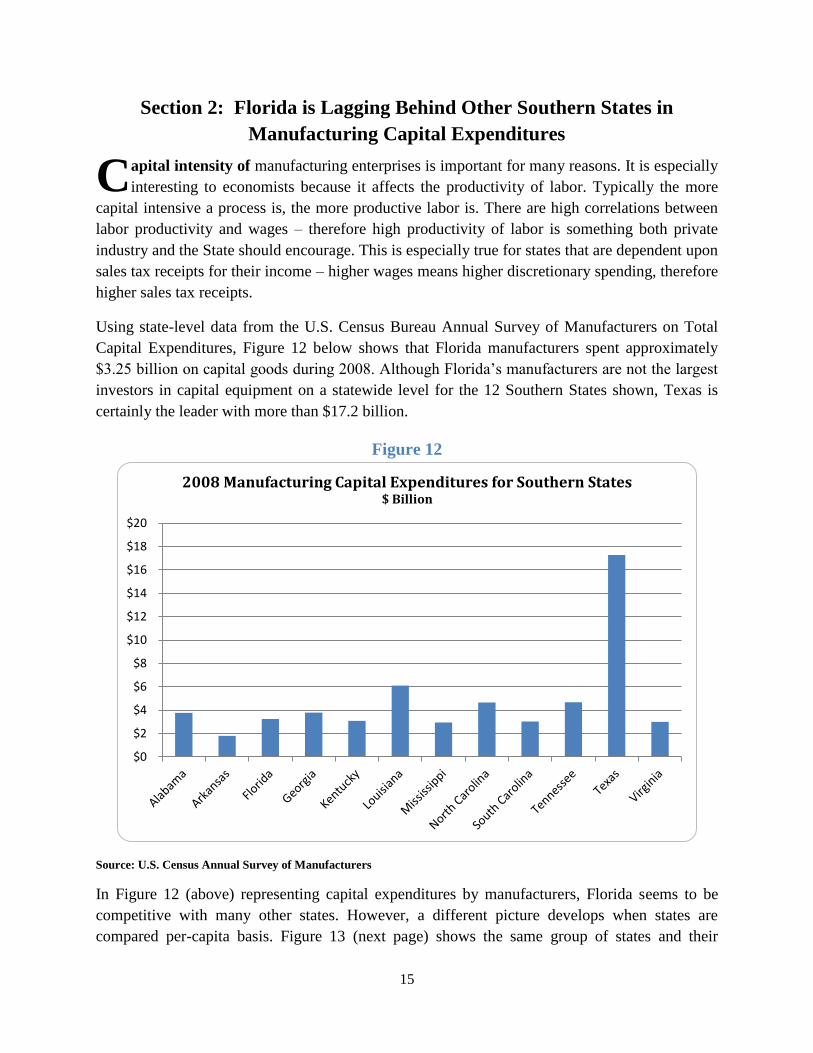
Using state-level data from the U.S. Census Bureau Annual Survey of Manufacturers on Total
Capital Expenditures, Figure 12 below shows that Florida manufacturers spent approximately
$3.25 billion on capital goods during 2008. Although Florida’s manufacturers are not the largest
investors in capital equipment on a statewide level for the 12 Southern States shown, Texas is
certainly the leader with more than $17.2 billion.
Figure 12
Source: U.S. Census Annual Survey of Manufacturers
In Figure 12 (above) representing capital expenditures by manufacturers, Florida seems to be
competitive with many other states. However, a different picture develops when states are
compared per-capita basis. Figure 13 (next page) shows the same group of states and their
$0
$2
$4
$6
$8
$10
$12
$14
$16
$18
$20
2008 Manufacturing Capital Expenditures for Southern States $ Billion
C
16
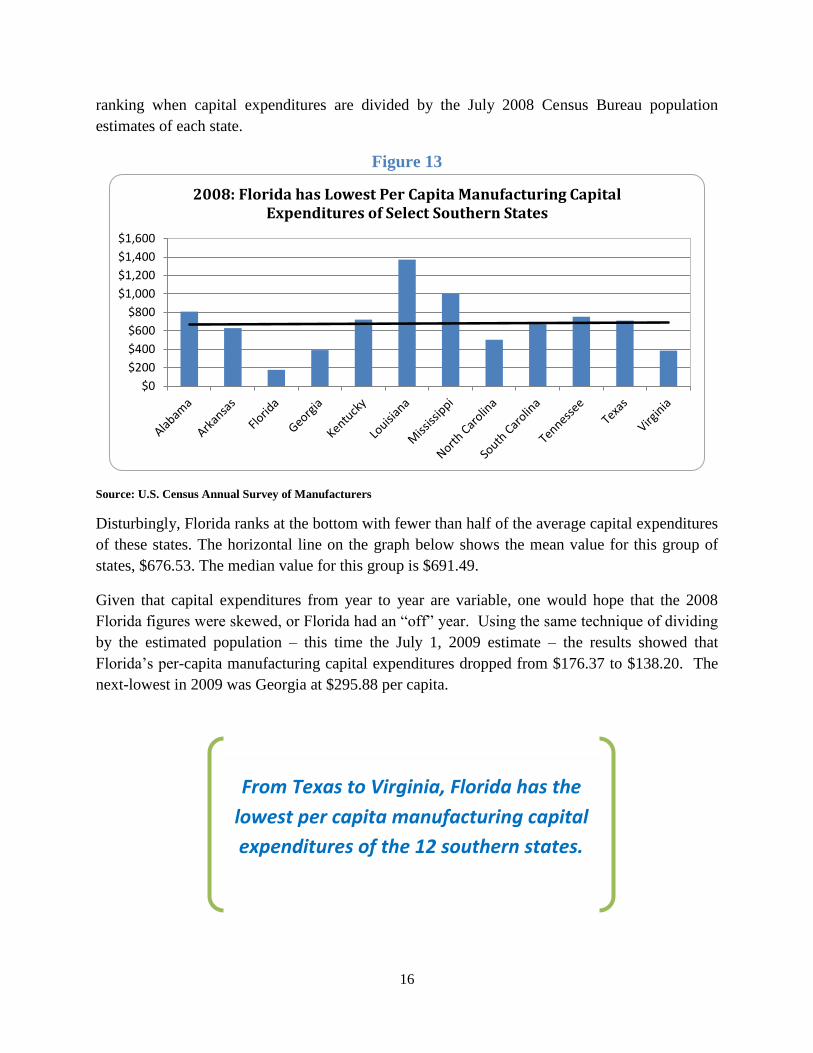
ranking when capital expenditures are divided by the July 2008 Census Bureau population
estimates of each state.
Figure 13
Source: U.S. Census Annual Survey of Manufacturers
Disturbingly, Florida ranks at the bottom with fewer than half of the average capital expenditures
of these states. The horizontal line on the graph below shows the mean value for this group of
states, $676.53. The median value for this group is $691.49.
Given that capital expenditures from year to year are variable, one would hope that the 2008
Florida figures were skewed, or Florida had an “off” year. Using the same technique of dividing
by the estimated population – this time the July 1, 2009 estimate – the results showed that
Florida’s per-capita manufacturing capital expenditures dropped from $176.37 to $138.20. The
next-lowest in 2009 was Georgia at $295.88 per capita.
$0
$200
$400
$600
$800
$1,000
$1,200
$1,400
$1,600
2008: Florida has Lowest Per Capita Manufacturing Capital Expenditures of Select Southern States
From Texas to Virginia, Florida has the
lowest per capita manufacturing capital
expenditures of the 12 southern states.
17
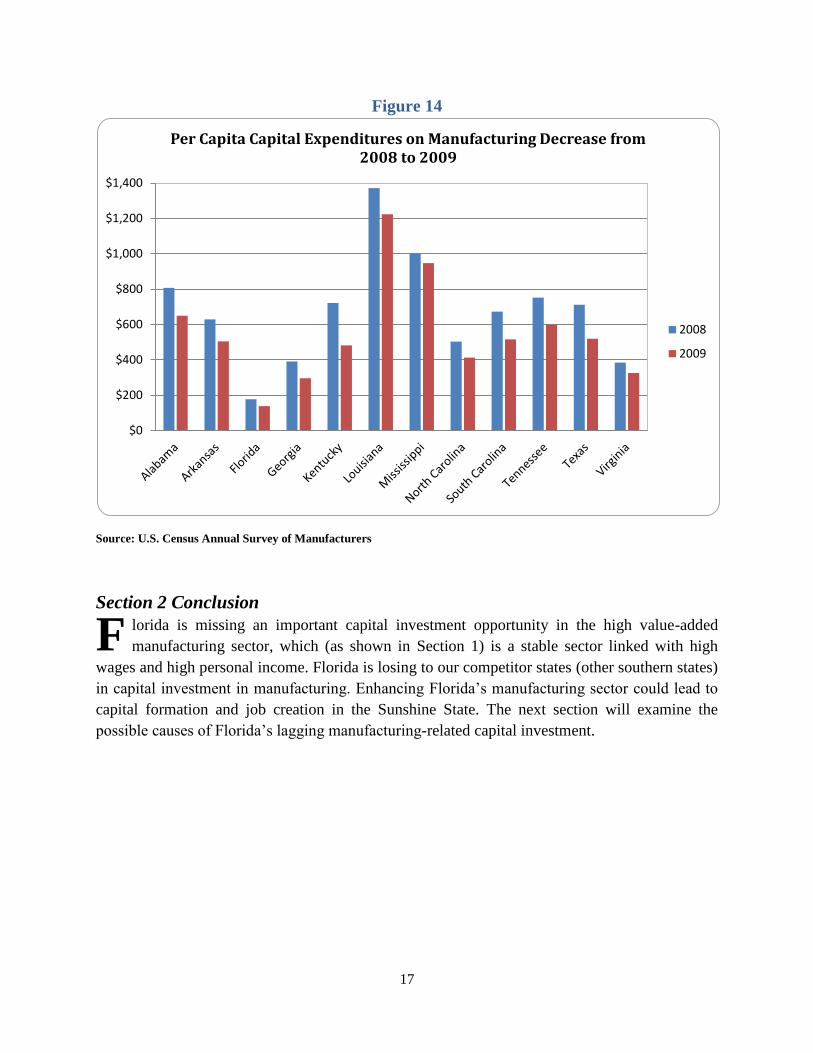
Figure 14
Source: U.S. Census Annual Survey of Manufacturers
Section 2 Conclusion
lorida is missing an important capital investment opportunity in the high value-added
manufacturing sector, which (as shown in Section 1) is a stable sector linked with high
wages and high personal income. Florida is losing to our competitor states (other southern states)
in capital investment in manufacturing. Enhancing Florida’s manufacturing sector could lead to
capital formation and job creation in the Sunshine State. The next section will examine the
possible causes of Florida’s lagging manufacturing-related capital investment.
$0
$200
$400
$600
$800
$1,000
$1,200
$1,400
Per Capita Capital Expenditures on Manufacturing Decrease from 2008 to 2009
2008
2009
F
18
Section 3: Why Florida Is Less Attractive to Manufacturing-Related
Capital Expenditures and Investment
new National Bureau of Economic Research (NBER) working paper4 shows evidence
Florida’s “economic development by retail” is crowding out “economic development by
manufacturing.” Researchers tested the theory that governments try to maximize local receipts,
so those with local and county taxes prefer retail because retail generates more local sales tax
revenue than does manufacturing (or anything else). After controlling for inflation, it is
indicated that local sales tax revenue in Florida increased by 380 percent between 1992 and 2008
compared with an eight percent increase in property tax revenues.
Section 1 has shown manufacturing is an important economic sector for Florida. Section 2 has
shown that Florida, on a per capita basis, has far less manufacturing capital investment compared
to the other 11 Southern states. Section 3 examines some of the reasons why Florida is not an
attractive place for manufacturing investment.
First, Florida taxes capital formation through sales taxes on machinery and equipment. Although
partial exemptions are possible for machinery and equipment, they apply only to new and
expanding businesses. Existing businesses that are not expanding, but wish to invest in new
capital equipment, are required to pay sales taxes on production equipment. Even those that are
expanding that wish to qualify for tax credits are required to show production increases. Some of
those may be difficult to show in complicated manufacturing processes. These taxes on
production equipment reduce the amount of capital investment that companies make, therefore
they keep Florida firms from increasing their competitiveness.
Second, Florida taxes capital formation through its Tangible Personal Property tax, exempting
only the first $25,000 of capital for businesses. Small businesses with low amounts of capital are
exempted and the more capital intensive industries pay the most. This Research Report reveals
(in Section 1.D) that more capital intensive industries are, in most cases, the high value-added
industries that provide high wages to Floridians. According to an April 2011 Ernst and Young
report5, on “new investment”, Florida has relatively high tax burden both on new capital and on
new jobs. Their study indicates that the effective tax rate on new capital for a mix of potential
businesses coming to Florida would be 7.4 percent and the effective tax rate on new jobs would
be 8.7 percent – ranking Florida 27th
and 26th
best in the country. Other southern states that have
lower tax burdens on new investment include Texas, Georgia, Kentucky and Virginia.
4 Fiscal Zoning and Sales Taxes: Do Higher Sales Taxes Lead to More Retailing and Less Manufacturing? Burnes,
D., Neumark, D., and White, M. National Bureau of Economic Research. Working Paper 16932. April, 2011. 5 Competitiveness of State and Local Business Taxes on New Investment. Cline, R., Phillips, A., and Neubig, T.
Ernst & Young. April 2011.
A
19
Third, forthcoming Florida TaxWatch research indicates that the Qualified Target Industries
(QTI) program, one of Florida’s current economic development programs, favors less capital
intensive industries at the expense of Florida’s manufacturing. A business that uses the QTI
program must be either a new or expanding business, and it must create a minimum of 10 jobs.
Given that manufacturing is more capital intensive than other industries, the capital needed to go
along with the production of those 10 new jobs is significantly higher than for the average
business. A manufacturer that wanted to bring new capital to Florida and start a small operation
with fewer than 10 employees would not be able to use the QTI program.
Fourth, Florida’s Capital Investment Tax Credit (CITC) program is designed to help Florida
attract large highly capital-intensive firms in targeted sectors. To qualify for the tax credits
possible with the CITC, firms are required to invest at least $25 million and to create at least 100
jobs.
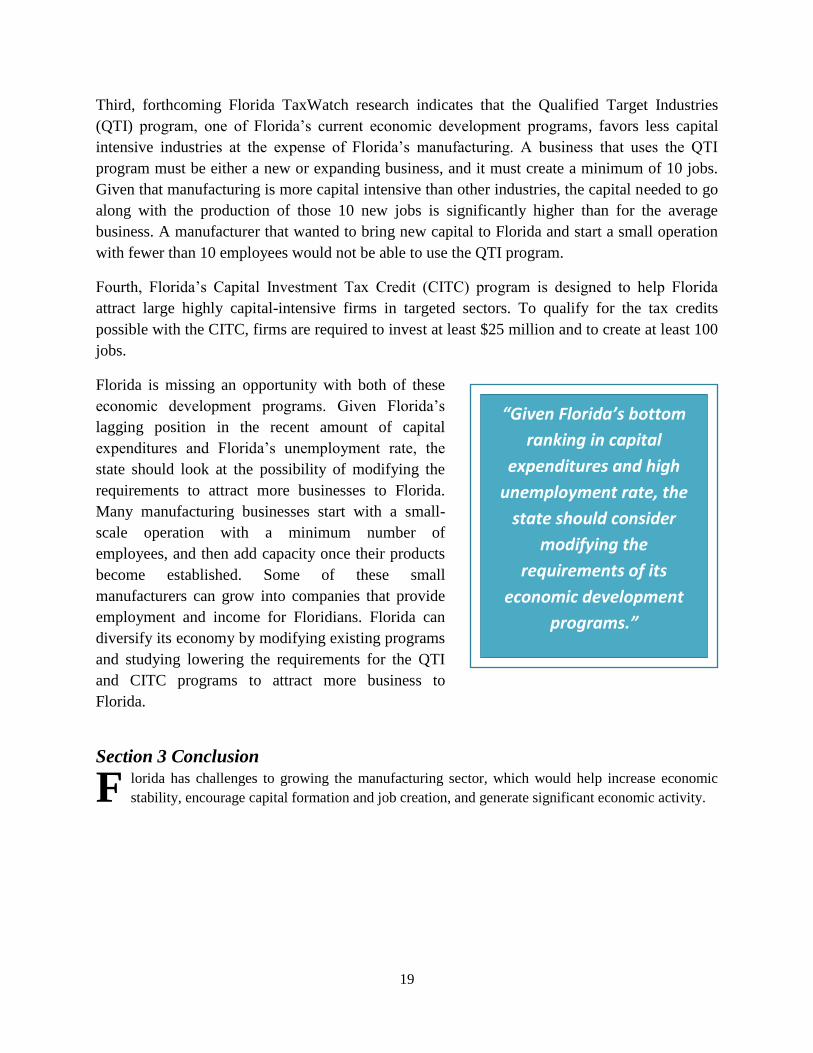
Florida is missing an opportunity with both of these
economic development programs. Given Florida’s
lagging position in the recent amount of capital
expenditures and Florida’s unemployment rate, the
state should look at the possibility of modifying the
requirements to attract more businesses to Florida.
Many manufacturing businesses start with a small-
scale operation with a minimum number of
employees, and then add capacity once their products
become established. Some of these small
manufacturers can grow into companies that provide
employment and income for Floridians. Florida can
diversify its economy by modifying existing programs
and studying lowering the requirements for the QTI
and CITC programs to attract more business to
Florida.
Section 3 Conclusion
lorida has challenges to growing the manufacturing sector, which would help increase economic
stability, encourage capital formation and job creation, and generate significant economic activity.
F
“Given Florida’s bottom
ranking in capital
expenditures and high
unemployment rate, the
state should consider
modifying the
requirements of its
economic development
programs.”
20
Section 4: Potential Benefits of Growing Florida’s Manufacturing Sector
o obtain an estimate of the value per added manufacturing job in Florida, Florida
TaxWatch employed the well-respected dynamic model from Regional Economic Models,
Inc. (REMI) to estimate the economic activity generated by the addition of manufacturing jobs in
Miami, which can be scaled up to other areas using relative manufacturing wages (from Section
1.B). For this exercise, in Miami-Dade County, an increase of 1,000 manufacturing jobs each
year for ten years was modeled. This appears to be a reasonable increase given the 72,300
manufacturing jobs in the Miami-Fort Lauderdale-Pompano Beach Metropolitan Statistical Area
(MSA).
As shown in Figure 3 (Section 1.B on page 5), Miami-Dade County has relatively lower
manufacturing wages than other counties with large numbers of manufacturing jobs, therefore
the multipliers obtained in this estimate should be larger for other areas in terms of income than
in Miami-Dade County. One should be careful to note that different areas have different
multipliers due to features of the economies of each area, therefore if precise estimates are
needed, an estimate for each area should be run.
In this exercise, some important assumptions must be noted. First, there are no construction costs
for either building new factories or retrofitting old ones. If there were, the multiple would
increase during the construction phase and cause significantly more economic activity. Second,
the new manufacturing jobs are allocated in the current percentages of the manufacturing
industry mix in Miami-Dade. Multipliers for more specific types of industries within
manufacturing can have higher or lower multiples. Finally, these jobs are created exogenously –
therefore the model has not been manipulated to create the jobs endogenously by increasing
demand to generate these jobs.
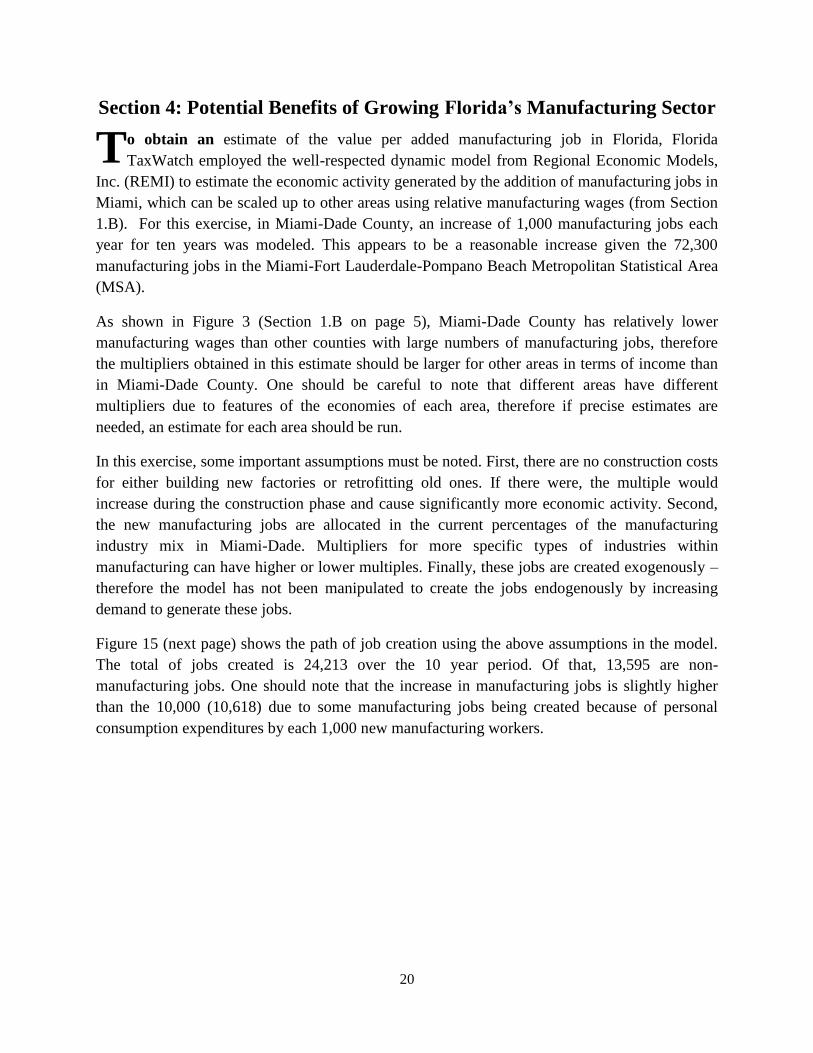
Figure 15 (next page) shows the path of job creation using the above assumptions in the model.
The total of jobs created is 24,213 over the 10 year period. Of that, 13,595 are non-
manufacturing jobs. One should note that the increase in manufacturing jobs is slightly higher
than the 10,000 (10,618) due to some manufacturing jobs being created because of personal
consumption expenditures by each 1,000 new manufacturing workers.
T
21
Figure 15
Source: Florida TaxWatch analysis using Regional Economic Models, Inc. (REMI), 2011
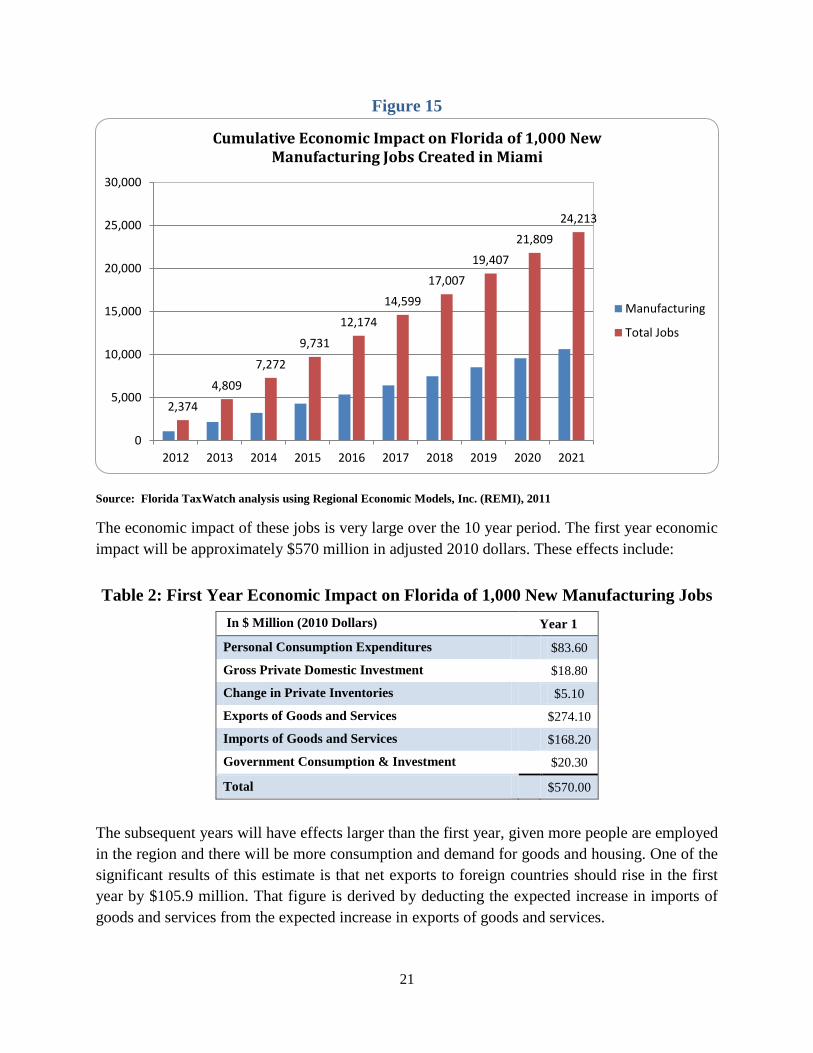
The economic impact of these jobs is very large over the 10 year period. The first year economic
impact will be approximately $570 million in adjusted 2010 dollars. These effects include:
Table 2: First Year Economic Impact on Florida of 1,000 New Manufacturing Jobs
In $ Million (2010 Dollars) Year 1
Personal Consumption Expenditures $83.60
Gross Private Domestic Investment $18.80
Change in Private Inventories $5.10
Exports of Goods and Services $274.10
Imports of Goods and Services $168.20
Government Consumption & Investment $20.30
Total $570.00
The subsequent years will have effects larger than the first year, given more people are employed
in the region and there will be more consumption and demand for goods and housing. One of the
significant results of this estimate is that net exports to foreign countries should rise in the first
year by $105.9 million. That figure is derived by deducting the expected increase in imports of
goods and services from the expected increase in exports of goods and services.
2,374
4,809
7,272
9,731
12,174
14,599
17,007
19,407
21,809
24,213
0
5,000
10,000
15,000
20,000
25,000
30,000
2012 2013 2014 2015 2016 2017 2018 2019 2020 2021
Cumulative Economic Impact on Florida of 1,000 New Manufacturing Jobs Created in Miami
Manufacturing
Total Jobs
22
Section 5: Florida TaxWatch Recommendations
lorida has great opportunity to increase the state’s manufacturing sector, which will attract
capital, create high-wage jobs, increase productivity, and enhance economic stability for
the state. Econometric analysis shows that increasing manufacturing jobs generates significant
economic activity and jobs in other economic sectors, adding millions to the Gross State Product.
Furthermore, comparison with our competitor states in the Southeast U.S. clearly shows that
Florida is lagging behind in the strength of our manufacturing sector, a sector that is especially
important to Florida because of the rising importance of international trade and the upcoming
expansion of the Panama Canal.
Florida’s political and economic leaders must take active steps to make Florida more attractive to
manufacturers in order to attract capital formation and job creation. Specifically, Florida should:
Incentivize capital investment by modifying the current Florida QTI and CITC programs to
allow for smaller companies to invest their capital in Florida. Modifying the requirements can
lead to smaller, more dynamic companies in their early stages to establish their businesses in
Florida and hire more Floridians.
Reduce the penalties for accumulating productive capital in Florida by: eliminating all taxes on
manufacturing inputs; eliminating sales taxes on purchases of machinery and equipment; and
allowing an accelerated depreciation schedule on valuations for Tangible Personal Property
Taxes. Lowering taxes on inputs and machinery will encourage capital investment and its
positive effects on competitiveness for Florida firms. Allowing accelerated depreciation on
existing equipment will lower the amount of Tangible Personal Property Tax, therefore lowering
the penalty for capital accumulation.
Continue to improve Florida’s infrastructure with investments such as the forthcoming
deepening of the Port of Miami. Improvements in transportation infrastructure lead to higher
national and international competitiveness and lower costs for all Floridians.
F

This Florida TaxWatch Research Report was written by Jerry Parrish, Ph.D.,
Chief Economist and Director of the Florida TaxWatch Center for Competitive Florida,
with assistance from Katie Furtick, Research Assistant, and direction from
Robert Weissert, Esq., Vice President for Research.
Marshall Criser, III, Chairman, Florida TaxWatch; John Zumwalt, III, Chairman, Center
for Competitive Florida; Dominic M. Calabro, President, Publisher, and Editor.
Florida TaxWatch Research Institute, Inc.
www.FloridaTaxWatch.org
© Copyright Florida TaxWatch, August 2011
About Florida TaxWatch Florida TaxWatch is a statewide, non-profit, non-partisan taxpayer research institute and government watchdog that over its 32-year history has become widely recognized as the watchdog of citizens’ hard-earned tax dollars. Its mission is to provide the citizens of Florida and public officials with high quality, independent research and education on government revenues, expenditures, taxation, public policies, and programs, and to increase the productivity and accountability of Florida Government. Florida TaxWatch's research recommends productivity enhancements and explains the statewide impact of economic and tax and spend policies and practices on citizens and businesses. Florida TaxWatch has worked diligently and effectively to help state government shape responsible fiscal and public policy that adds value and benefit to taxpayers. This diligence has yielded impressive results: in its first two decades alone, policymakers and government employees implemented three-fourths of Florida TaxWatch's cost-saving recommendations, saving the taxpayers of Florida more than $6.2 billion -- approximately $1,067 in added value for every Florida family, according to an independent assessment by Florida State University. Florida TaxWatch has a historical understanding of state government, public policy issues, and the battles fought in the past necessary to structure effective solutions for today and the future. It is the only statewide organization devoted entirely to Florida taxing and spending issues. Its research and recommendations are reported on regularly by the statewide news media. Supported by voluntary, tax-deductible memberships and grants, Florida TaxWatch is open to any organization or individual interested in helping to make Florida competitive, healthy and economically prosperous by supporting a credible research effort that promotes constructive taxpayer improvements. Members, through their loyal support, help Florida TaxWatch bring about a more effective, responsive government that is accountable to the citizens it serves. Florida TaxWatch is supported by all types of taxpayers -- homeowners, small businesses, large corporations, philanthropic foundations, professionals, associations, labor organizations, retirees -- simply stated, the taxpayers of Florida. The officers, Board of Trustees and members of Florida TaxWatch are respected leaders and citizens from across Florida, committed to improving the health and prosperity of Florida. With your help, Florida TaxWatch will continue its diligence to make certain your tax investments are fair and beneficial to you, the taxpaying customer, who supports Florida's government. Florida TaxWatch is ever present to ensure that taxes are equitable, not excessive, that their public benefits and costs are weighed, and government agencies are more responsive and productive in the use of your hard-earned tax dollars.
The Florida TaxWatch Board of Trustees is responsible for the general direction and oversight of the research institute and
safeguarding the independence of the organization's work. In his capacity as chief executive officer, the president is responsible for formulating and coordinating policies, projects, publications, and selecting professional staff. As an independent research institute and taxpayer watchdog, Florida TaxWatch does not accept money from Florida state and local governments. The research findings and recommendations of Florida TaxWatch do not necessarily reflect the view of its members, staff, distinguished Board of Trustees, or Executive Committee, and are not influenced by the positions of the individuals or organizations who directly or indirectly support the research.
Florida TaxWatch Values:
♦ Integrity ♦ Productivity ♦ Accountability ♦ Independence ♦ Quality Research

NON-PROFIT ORG.
U.S. POSTAGE PAID
TALLAHASSEE, FL
Permit No. 409
For a copy of this Research Report, please call: (850) 222-5052
OR Write to Florida TaxWatch at: P.O. Box 10209
Tallahassee, FL 32302 OR
Access and download the report at: www.FloridaTaxWatch.org where this Research Report was initially
released before being printed in hardcopy format