california manufacturing jobs in demand - edd … · listings for part-time jobs in manufacturing...
TRANSCRIPT

California
Manufacturing
Jobs in Demand
July 2012

Labor Market Information Division | 7000 Franklin Blvd, Suite 1100, Sacramento, CA 95823 | www.labormarketinfo.ca.gov
Acknowledgments
The authors of this report would like to acknowledge the following organizations and individuals for their many contributions to this work:
The Center for Regional Economic Competitiveness (CREC); Lauren Gilchrist, Program Analyst
The California Manufacturers and Technology Association (CMTA); Gino DiCaro, VP Communications
The Conference Board; Jeanne Shu, Project Manager

Page 1
Labor Market Information Division | 7000 Franklin Blvd, Suite 1100, Sacramento, CA 95823 | www.labormarketinfo.ca.gov
TABLE OF CONTENTS
Title Page
Key Findings 2
Introduction 3
Defining Manufacturing Occupational Groups 3
Job Listings in Perspective – Labor Market Information 4
Top Manufacturing Job Listings by Occupational Group 4
Geographic Location of Job Listings 8
Which California Employers Are Advertising? 16
Training and Experience Requirements 17
Skills, Tools, and Certifications in Demand 18
Ad Age – What Jobs are Hard to Fill? 20
Summary and Caveats about Real-Time Data 21
Appendix A-D – Labor Market Information 22
Appendix E-H – Occupational Distributions 26
Appendix I – California Workforce Services Branch Regions 30
Appendix J-M – Skills and Knowledge, Tools and Technology, Job Titles, and Certifications in Demand
31
Page 2
Labor Market Information Division | 7000 Franklin Blvd, Suite 1100, Sacramento, CA 95823 |www.labormarketinfo.ca.gov
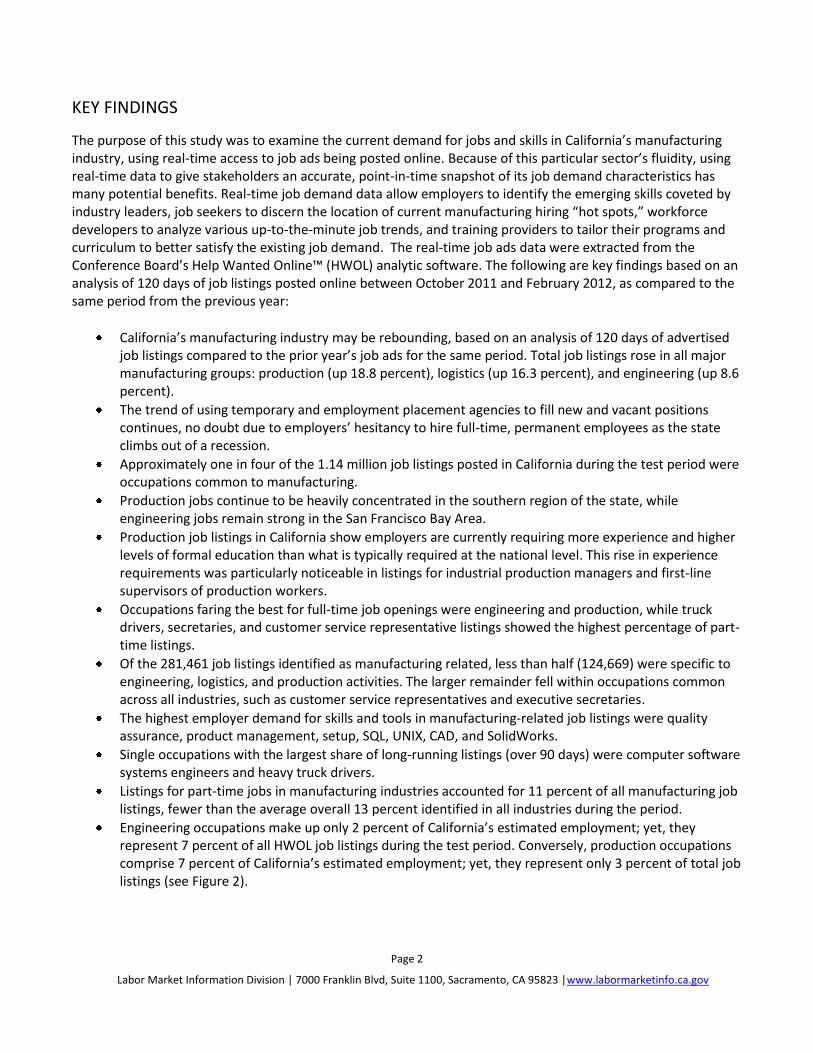
KEY FINDINGS
The purpose of this study was to examine the current demand for jobs and skills in California’s manufacturing industry, using real-time access to job ads being posted online. Because of this particular sector’s fluidity, using real-time data to give stakeholders an accurate, point-in-time snapshot of its job demand characteristics has many potential benefits. Real-time job demand data allow employers to identify the emerging skills coveted by industry leaders, job seekers to discern the location of current manufacturing hiring “hot spots,” workforce developers to analyze various up-to-the-minute job trends, and training providers to tailor their programs and curriculum to better satisfy the existing job demand. The real-time job ads data were extracted from the Conference Board’s Help Wanted Online™ (HWOL) analytic software. The following are key findings based on an analysis of 120 days of job listings posted online between October 2011 and February 2012, as compared to the same period from the previous year:
California’s manufacturing industry may be rebounding, based on an analysis of 120 days of advertised job listings compared to the prior year’s job ads for the same period. Total job listings rose in all major manufacturing groups: production (up 18.8 percent), logistics (up 16.3 percent), and engineering (up 8.6 percent).
The trend of using temporary and employment placement agencies to fill new and vacant positions continues, no doubt due to employers’ hesitancy to hire full-time, permanent employees as the state climbs out of a recession.
Approximately one in four of the 1.14 million job listings posted in California during the test period were occupations common to manufacturing.
Production jobs continue to be heavily concentrated in the southern region of the state, while engineering jobs remain strong in the San Francisco Bay Area.
Production job listings in California show employers are currently requiring more experience and higher levels of formal education than what is typically required at the national level. This rise in experience requirements was particularly noticeable in listings for industrial production managers and first-line supervisors of production workers.
Occupations faring the best for full-time job openings were engineering and production, while truck drivers, secretaries, and customer service representative listings showed the highest percentage of part-time listings.
Of the 281,461 job listings identified as manufacturing related, less than half (124,669) were specific to engineering, logistics, and production activities. The larger remainder fell within occupations common across all industries, such as customer service representatives and executive secretaries.
The highest employer demand for skills and tools in manufacturing-related job listings were quality assurance, product management, setup, SQL, UNIX, CAD, and SolidWorks.
Single occupations with the largest share of long-running listings (over 90 days) were computer software systems engineers and heavy truck drivers.
Listings for part-time jobs in manufacturing industries accounted for 11 percent of all manufacturing job listings, fewer than the average overall 13 percent identified in all industries during the period.
Engineering occupations make up only 2 percent of California’s estimated employment; yet, they represent 7 percent of all HWOL job listings during the test period. Conversely, production occupations comprise 7 percent of California’s estimated employment; yet, they represent only 3 percent of total job listings (see Figure 2).

Page 3
Labor Market Information Division | 7000 Franklin Blvd, Suite 1100, Sacramento, CA 95823 | www.labormarketinfo.ca.gov
INTRODUCTION This study seeks to identify the most current demand for jobs and skills in California’s manufacturing industry. The study is modeled in part on a November 2011 national report written by the Center for Regional Economic Competitiveness (CREC), entitled U.S. Manufacturing Jobs: Where Companies Are Hiring. Whereas the CREC study was based on national real-time data over a six-month period, this report was based on analysis of 120 days of California job listings posted online between October 2011 and February 2012 as compared to the same period from the previous year using the Conference Board’s Help Wanted OnLine™ (HWOL) analytics tool.
DEFINING MANUFACTURING OCCUPATIONAL GROUPS
Job listings were classified into four broad occupational groups within manufacturing: engineering, production, logistics, and a miscellaneous group of “Other” occupations common to manufacturing. Occupations were selected based on 2010 statewide employment and staffing patterns within the manufacturing industry. Below is a short description of the four manufacturing occupational groups. Figure 1 shows the groups and sample occupations within each group.
Engineering occupations are jobs involved in the design, development, testing, and evaluation of products and components, including software for computer-driven production machines. This occupational group also includes engineering support occupations, such as technicians and drafters.
Production occupations are jobs generally unique to the manufacturing industry. Their work involves creating new products from raw and component materials.
Logistics occupations are jobs involved in the transportation, storage, and distribution of raw materials and manufactured products.
“Other” manufacturing occupations are jobs involved in the support, finance, and sales aspects of the manufacturing industry. These occupations can be found in most other industries and are difficult to isolate.
Figure 1: Manufacturing Occupational Groups
Occupational Group Sample Occupations
Engineering Occupations Industrial Engineers
Software Applications Engineers
Mechanical Engineering Technicians
Production Occupations Machinists
Production Worker Supervisors
Team Assemblers
Logistics Occupations Logisticians
Heavy Truck Drivers
“Other” Manufacturing Occupations
Wholesale Sales Representatives
Marketing Managers
Customer Service Representatives
Page 4
Labor Market Information Division | 7000 Franklin Blvd, Suite 1100, Sacramento, CA 95823 | www.labormarketinfo.ca.gov
JOB LISTINGS IN PERSPECTIVE – LABOR MARKET INFORMATION
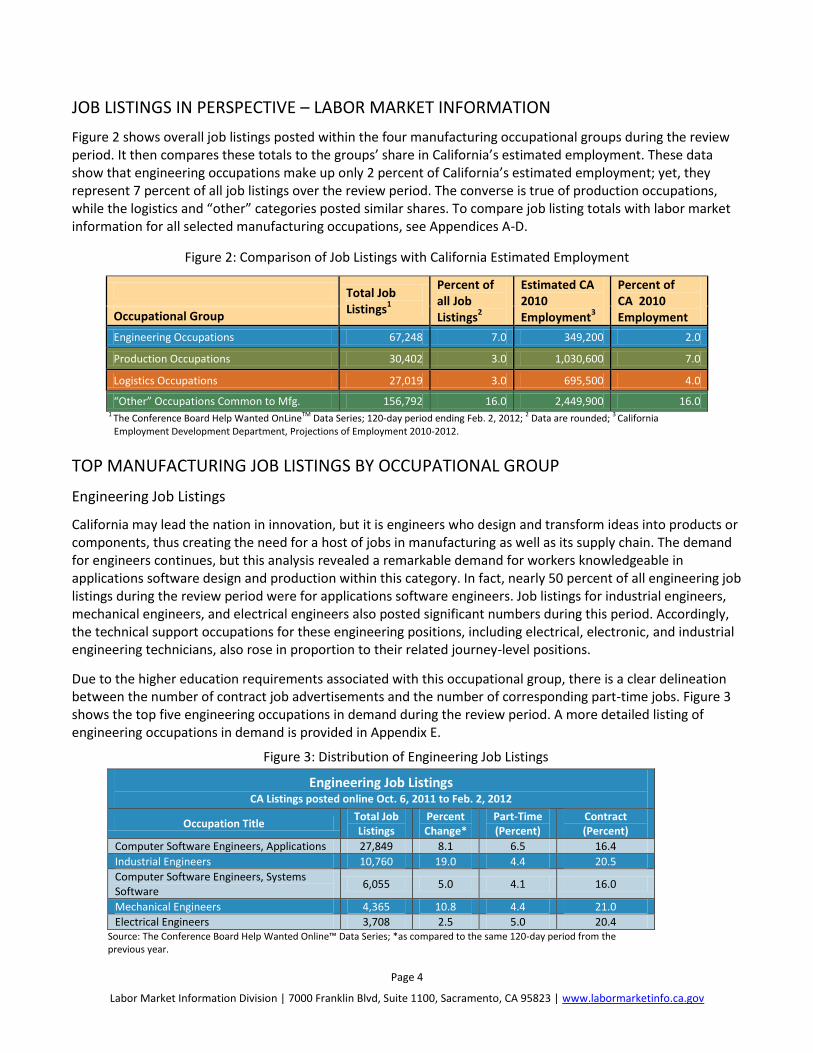
Figure 2 shows overall job listings posted within the four manufacturing occupational groups during the review period. It then compares these totals to the groups’ share in California’s estimated employment. These data show that engineering occupations make up only 2 percent of California’s estimated employment; yet, they represent 7 percent of all job listings over the review period. The converse is true of production occupations, while the logistics and “other” categories posted similar shares. To compare job listing totals with labor market information for all selected manufacturing occupations, see Appendices A-D.
Figure 2: Comparison of Job Listings with California Estimated Employment
Total Job Listings
1
Percent of all Job Listings
2
Estimated CA 2010 Employment
3
Percent of CA 2010 Employment Occupational Group
Engineering Occupations 67,248 7.0 349,200 2.0
Production Occupations 30,402 3.0 1,030,600 7.0
Logistics Occupations 27,019 3.0 695,500 4.0
“Other” Occupations Common to Mfg. 156,792 16.0 2,449,900 16.0
1 The Conference Board Help Wanted OnLineTM Data Series; 120-day period ending Feb. 2, 2012; 2 Data are rounded; 3 California Employment Development Department, Projections of Employment 2010-2012.
TOP MANUFACTURING JOB LISTINGS BY OCCUPATIONAL GROUP
Engineering Job Listings
California may lead the nation in innovation, but it is engineers who design and transform ideas into products or components, thus creating the need for a host of jobs in manufacturing as well as its supply chain. The demand for engineers continues, but this analysis revealed a remarkable demand for workers knowledgeable in applications software design and production within this category. In fact, nearly 50 percent of all engineering job listings during the review period were for applications software engineers. Job listings for industrial engineers, mechanical engineers, and electrical engineers also posted significant numbers during this period. Accordingly, the technical support occupations for these engineering positions, including electrical, electronic, and industrial engineering technicians, also rose in proportion to their related journey-level positions.
Due to the higher education requirements associated with this occupational group, there is a clear delineation between the number of contract job advertisements and the number of corresponding part-time jobs. Figure 3 shows the top five engineering occupations in demand during the review period. A more detailed listing of engineering occupations in demand is provided in Appendix E.
Figure 3: Distribution of Engineering Job Listings
Engineering Job Listings CA Listings posted online Oct. 6, 2011 to Feb. 2, 2012
Occupation Title Total Job Listings
Percent Change*
Part-Time (Percent)
Contract (Percent)
Computer Software Engineers, Applications 27,849 8.1 6.5 16.4
Industrial Engineers 10,760 19.0 4.4 20.5
Computer Software Engineers, Systems Software
6,055 5.0 4.1 16.0
Mechanical Engineers 4,365 10.8 4.4 21.0
Electrical Engineers 3,708 2.5 5.0 20.4 Source: The Conference Board Help Wanted Online™ Data Series; *as compared to the same 120-day period from the previous year.
Page 5
Labor Market Information Division | 7000 Franklin Blvd, Suite 1100, Sacramento, CA 95823 | www.labormarketinfo.ca.gov
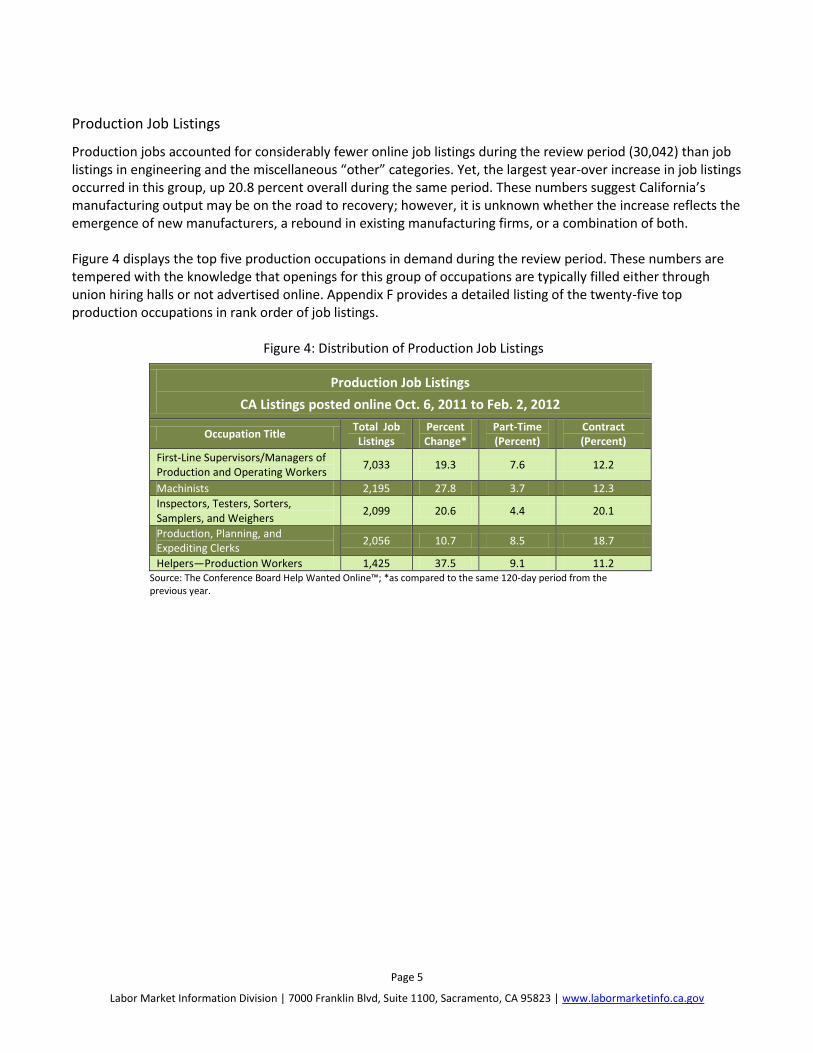
Production Job Listings
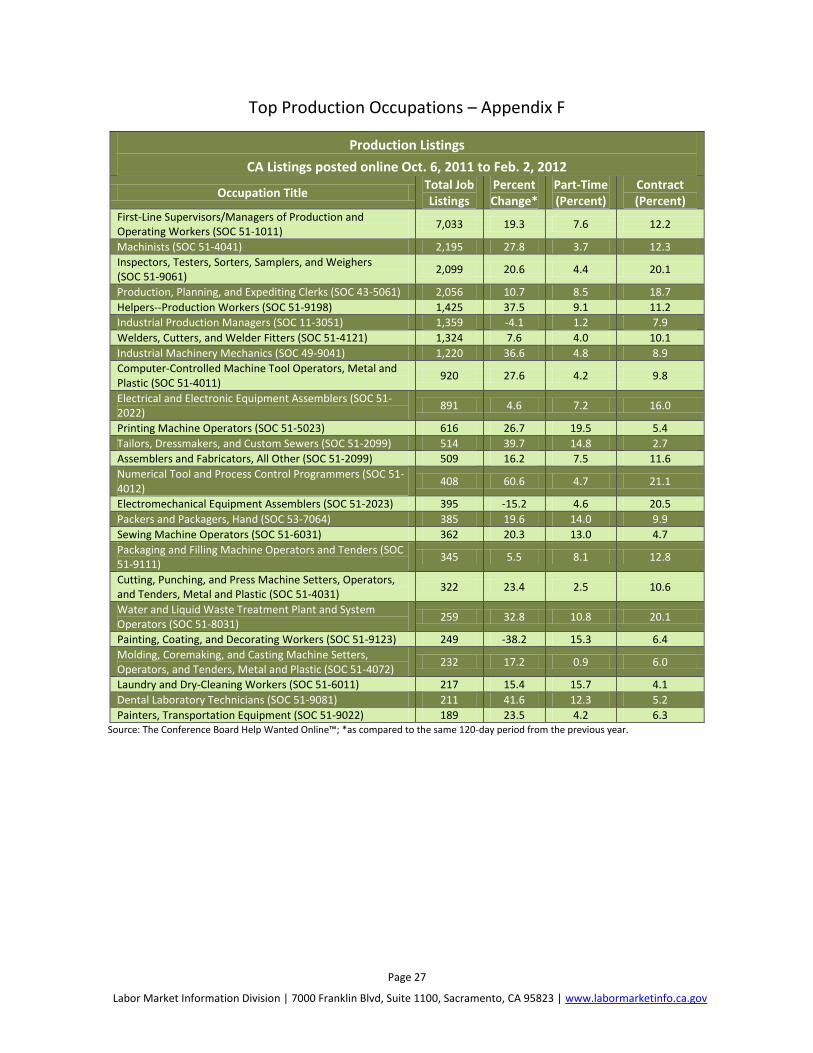
Production jobs accounted for considerably fewer online job listings during the review period (30,042) than job listings in engineering and the miscellaneous “other” categories. Yet, the largest year-over increase in job listings occurred in this group, up 20.8 percent overall during the same period. These numbers suggest California’s manufacturing output may be on the road to recovery; however, it is unknown whether the increase reflects the emergence of new manufacturers, a rebound in existing manufacturing firms, or a combination of both. Figure 4 displays the top five production occupations in demand during the review period. These numbers are tempered with the knowledge that openings for this group of occupations are typically filled either through union hiring halls or not advertised online. Appendix F provides a detailed listing of the twenty-five top production occupations in rank order of job listings. Figure 4: Distribution of Production Job Listings
Production Job Listings
CA Listings posted online Oct. 6, 2011 to Feb. 2, 2012
Occupation Title Total Job Listings
Percent Change*
Part-Time (Percent)
Contract (Percent)
First-Line Supervisors/Managers of Production and Operating Workers
7,033 19.3 7.6 12.2
Machinists 2,195 27.8 3.7 12.3
Inspectors, Testers, Sorters, Samplers, and Weighers
2,099 20.6 4.4 20.1
Production, Planning, and Expediting Clerks
2,056 10.7 8.5 18.7
Helpers—Production Workers 1,425 37.5 9.1 11.2 Source: The Conference Board Help Wanted Online™; *as compared to the same 120-day period from the previous year.

Page 6
Labor Market Information Division | 7000 Franklin Blvd, Suite 1100, Sacramento, CA 95823 | www.labormarketinfo.ca.gov
Logistics Job Listings Logistics occupations are indispensable components of the manufacturing industry. By organizing the supply chain, transporting raw materials and finished products, and unloading cargo, these workers provide critical support for the production and engineering sectors of the manufacturing industry. Among the jobs with the greatest number of job listings (10,835) in logistics is the heavy and tractor-trailer truck driver occupation. Figure 5 shows the top five logistics occupations in demand during the review period and Appendix G provides a detailed listing of the ten top logistics occupations in rank order of job listings. Unlike the engineering occupations, logistics job listings showed no clear distinction between part-time and contract jobs. The exceptions to this trend were the relatively lower-skilled light truck drivers (31.7 percent part-time versus just 7.0 percent contract) and the usually college-educated logisticians (22.9 percent contract versus 7.1 percent part-time). Overall, logistics job listings rose 16.3 percent as compared to the same 120-day period from the previous year, the highest increase among the four occupational groups in this report. The aforementioned heavy and tractor-trailer truck driver occupation spearheaded this significant percentage increase, accounting for an impressive 37.5 percent change over the same period last year.
Figure 5: Distribution of Logistics Job Listings
Logistics Job Listings
CA Listings posted online Oct. 6, 2011 to Feb. 2, 2012
Occupation Title # Job
Listings Percent Change*
Part-Time (Percent)
Contract (Percent)
Truck Drivers, Heavy and Tractor-Trailer (SOC 53-3032)
10,835 37.5 13.2 15.8
Truck Drivers, Light or Delivery Services (SOC 53-3033)
3,861 13.4 31.7 7.0
First-Line Supervisors/Managers of Transportation and Material-Moving Machine and Vehicle Operators (SOC 53-1031)
3,134 17.2 13.7 12.5
Laborers and Freight, Stock, and Material Movers (Hand) (SOC 53-7062)
2,874 -6.3 17.0 7.9
Shipping, Receiving, and Traffic Clerks (SOC 43-5071)
1,543 0.7 12.2 10.1
Source: The Conference Board Help Wanted Online™; *as compared to the same 120-day period from the previous year.

Page 7
Labor Market Information Division | 7000 Franklin Blvd, Suite 1100, Sacramento, CA 95823 | www.labormarketinfo.ca.gov
“Other” Manufacturing Job Listings The “other” category consists of occupations integral to the daily operation of firms in the manufacturing
industry. Occupations such as wholesale sales representatives, accountants and auditors, and general
maintenance and repair workers, all contribute to the successful operation of any manufacturing firm. Due to
the universal nature of these occupations, the “other” job listings represent new jobs and vacancies across all
industries. Figure 6 shows the top five “other” occupations in demand during the review period.
Figure 6: Distribution of “Other” Manufacturing Job Listings
Job Listings for Other Manufacturing Occupations
CA Listings posted online Oct. 6, 2011 to Feb. 2, 2012
Occupation Title Total Job Listings
Percent Change*
Part-Time (Percent)
Contract (Percent)
Executive Secretaries and Administrative Assistants (SOC 43-6011)
21,677 5.4 20.0 11.2
Marketing Managers (SOC 11-2021) 19,515 -0.2 4.7 11.3
Customer Service Representatives (SOC 43-4051)
17,251 1.7 19.9 12.2
Accountants and Auditors (SOC 13-2011)
16,700 9.7 6.4 14.5
Sales Representatives, Wholesale and Manufacturing, Except Technical and Scientific Products (SOC 41-4012)
12,599 0.9 10.1 8.4
Source: The Conference Board Help Wanted Online™; *as compared to the same 120-day period from the previous year.
Compared to the same 120-day period from the previous year, job listings for the occupations within this occupational group were almost unanimously higher, led by janitors and cleaners (up 14.5 percent). General maintenance and repair workers (11.1 percent), first-line supervisors of office workers (10.4 percent), accountants and auditors (9.7 percent), and general and operations managers (8.7 percent) round out the top 5 in highest percentage increase within this group. Appendix H provides a detailed listing of the fifteen top “other” occupations in rank order of job listings.

Page 8
Labor Market Information Division | 7000 Franklin Blvd, Suite 1100, Sacramento, CA 95823 | www.labormarketinfo.ca.gov
GEOGRAPHIC LOCATION OF JOB LISTINGS An analysis of the geographic location of job listings posted during the review period reinforced widely held beliefs about the distribution of manufacturing jobs, particularly in the production and engineering occupational groups. Production is still heavily concentrated in the southern region of the state, while engineering remains strong in the San Francisco Bay Area.
By mapping total listings and year-over change in California’s 28 metropolitan statistical areas (MSA), other patterns emerge that indicate positive regional activity and job demand. One flurry of listings was noted in the Bakersfield MSA, which held the state’s highest year-over growth in job listings within production, engineering, logistics, and “other” occupational categories. A review of the data showed notable growth in listings from employers in the oil refining industry such as Chevron, Baker Hughes, and Weatherford. In addition, new distribution center openings expected in the area showed an uptick in job listings for Target and Holt Caterpillar.
Engineering Listings in California
Unlike the distribution of production job listings, employers directed their search for engineering workers in what have traditionally been the most fertile grounds for computer, industrial, and technological research and development: the Silicon Valley and the remainder of the San Francisco Bay Area. The MSAs of San Jose-Sunnyvale-Santa Clara (18,569 job listings) and San Francisco-Oakland-Fremont (16,861) comprised over half of all engineering job advertisements during the review period. In year-over comparisons, the percentage of engineering job listings in the Southern California MSAs of Bakersfield (up 41.1 percent), Riverside-San Bernardino-Ontario (26.8 percent), and Santa Barbara-Santa Maria-Goleta (21.8 percent) all increased substantially; perhaps, in part, to the heightened activity of Lockheed Martin in these areas. Figure 7 displays the geographic distribution of engineering job listings in the major MSAs.

Page 9
Labor Market Information Division | 7000 Franklin Blvd, Suite 1100, Sacramento, CA 95823 | www.labormarketinfo.ca.gov
Figure 7: Map of Engineering Job Listings

Page 10
Labor Market Information Division | 7000 Franklin Blvd, Suite 1100, Sacramento, CA 95823 | www.labormarketinfo.ca.gov
Production Listings in California
In terms of the number of production job listings, the Los Angeles-Long Beach-Santa Ana MSA, not surprisingly, led the state during the researched timeframe with 13,082 job listings, followed by the San Francisco-Oakland-Fremont (3,735), the San Diego-Carlsbad-San Marcos (2,966), and the Riverside-San Bernardino-Ontario (2,658) MSAs. The Merced (up 60.4 percent), Bakersfield (57.4 percent), and Chico (44.9 percent) MSAs all experienced significant growth in year-over comparisons. Figure 8 shows the geographic layout of production job listings for California’s 28 MSAs.

Page 11
Labor Market Information Division | 7000 Franklin Blvd, Suite 1100, Sacramento, CA 95823 | www.labormarketinfo.ca.gov
Figure 8: Map of Production Job Listings

Page 12
Labor Market Information Division | 7000 Franklin Blvd, Suite 1100, Sacramento, CA 95823 | www.labormarketinfo.ca.gov
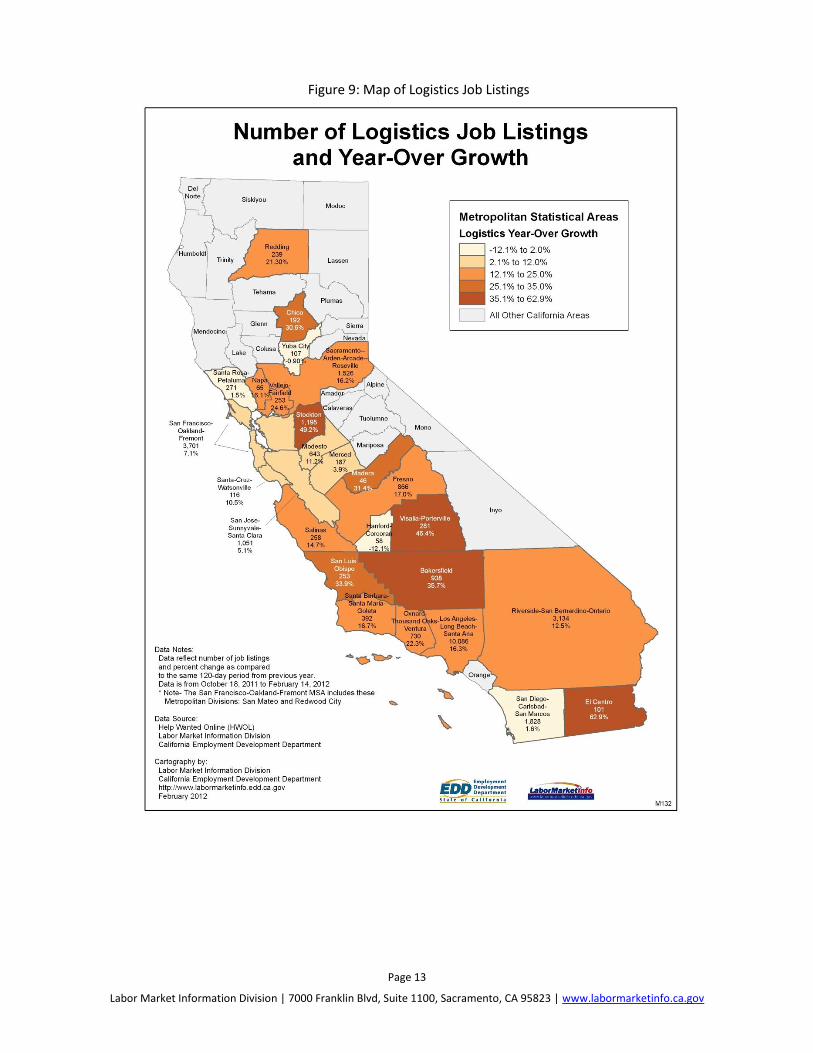
Logistics Listings in California The geographic pattern of job listings in the logistics sub-sector closely resembles that of the production occupational group, as the symbiotic relationship between the two would strongly suggest: relatively robust activity in the southern part of the state with pockets in the San Francisco Bay Area and the Central Valley. Furthermore, with the predominance of advertisements for long-haul semi-truck drivers within this occupational group, the regions straddling the Interstate 5, 10, and 80 corridors showed the highest number of job listings within logistics, highlighted by the Los Angeles-Long Beach-Santa Ana (10,086 job listings), San Francisco-Oakland-Fremont (3,701), and Riverside-San Bernardino-Ontario (3,134) MSAs. Strong year-over growth of job listings in the Stockton (up 49.2 percent), Visalia-Porterville (46.4 percent), and Vallejo-Fairfield (24.6 percent) MSAs also serve to underscore the logistical importance of California’s main arteries and demonstrate the stable growth of its manufacturing industry. Figure 9 displays the geographical layout of logistics job listings in California’s MSAs.
Page 13
Labor Market Information Division | 7000 Franklin Blvd, Suite 1100, Sacramento, CA 95823 | www.labormarketinfo.ca.gov
Figure 9: Map of Logistics Job Listings

Page 14
Labor Market Information Division | 7000 Franklin Blvd, Suite 1100, Sacramento, CA 95823 | www.labormarketinfo.ca.gov
Listings for “Other” Manufacturing Occupations in California As befitting occupations common to manufacturing that are also present in many other industries, there was no discerning geographic pattern in job listings within the “other” occupational group. Not surprisingly, the highly populated Los Angeles-Long Beach-Santa Ana MSA was the home to the lion’s share of the job listings (61,828), more than the second (San Francisco-Oakland-Fremont – 33, 476), third (San Diego-Carlsbad-San Marcos – 13,775), and fourth (San Jose-Sunnyvale-Santa Clara – 12,465) MSAs combined. In terms of year-over comparison, Stockton (up 36.7 percent), Bakersfield (35.6 percent), and El Centro (34.9 percent) MSAs posted significant growth in the rate of job listings in this subsector. Figure 10 displays the geographical layout of “other” job listings in California’s MSAs.

Page 15
Labor Market Information Division | 7000 Franklin Blvd, Suite 1100, Sacramento, CA 95823 | www.labormarketinfo.ca.gov
Figure 10: Map of “Other” Manufacturing Job Listings

Page 16
Labor Market Information Division | 7000 Franklin Blvd, Suite 1100, Sacramento, CA 95823 | www.labormarketinfo.ca.gov
Demand by Workforce Services Branch Region Job listings in the study period were also counted and summarized within the Employment Development Department’s (EDD’s) Workforce Services Branch’s three geographic regions: Los Angeles and Ventura, Southern California, and Northern California (see Appendix I for counties within each region).
L.A.-Ventura Region One of every three production job listings was for positions in the L.A.-Ventura region. This is consistent with the region’s one-third share of the workforce population. However, the region’s share of engineering advertised job listings remains low at 17 percent.
Southern Region The Southern Region garnered 25 percent of all engineering job listings during the period.
Northern Region The Northern Region captured 58 percent of all engineering job listings in the state, not unexpected given the predominance of software and hardware firms. Surprisingly, the San Francisco area showed the most job demand for engineers by far, with more job listings than the San Jose-Sunnyvale-Santa Clara MSA.
Logistics and “Other” job listing numbers fell fairly evenly between the three California regions during the review period.
WHICH CALIFORNIA EMPLOYERS ARE ADVERTISING?
Although we can identify some of the employers associated with jobs posted online, in many instances we do not know the identity of employers hiring. An upward trend exists in employer use of temporary and employment placement agencies to advertise and fill openings. This masks the identity of hiring employers and impedes an accurate analysis of employer demand. The North American Industry Classification System (NAICS) defines temporary help services as “establishments primarily engaged in supplying workers to clients businesses for limited periods of time to supplement the working force of the client,” while employment placement services are “primarily engaged in listing employment vacancies and in referring or placing applicants for
employment.” The top “employers” reported for most job listings within each of production (72 percent), engineering (66 percent), and “other” manufacturing (47 percent) occupational groups were either temporary or placement firms. Within the production occupational group, temporary and placement firms both heavily advertised for the same occupations (e.g., supervisors/managers of production workers, machinists) with two notable exceptions. First, temporary help services firms posted 166 openings for production worker helpers, up 120.3 percent over last year, while employment placement agencies advertised for welders and cutters 83 times in this period, a year-over increase of 50 percent. Geographically, the distribution of job listings follows the state population distribution, with the greater Los Angeles, San Diego, and San Francisco metropolitan areas among the top areas for these job listings. The exception to the trend of using temporary agencies was seen in logistics, where the top five employers listing openings were private trucking firms.

Page 17
Labor Market Information Division | 7000 Franklin Blvd, Suite 1100, Sacramento, CA 95823 | www.labormarketinfo.ca.gov
Notable Employer Activity - Lockheed In mid-November 2011, a large statewide jump in job listings (1,884) was noted for Lockheed Martin, particularly in Los Angeles and Santa Barbara counties. These listings reflect recent Lockheed contracts, with work centered on or near Air Force bases. Lockheed Martin was, in fact, the top advertising employer during the review period, outside of temporary or placement agencies, for manufacturing occupations.
TRAINING AND EXPERIENCE REQUIREMENTS An analysis of HWOL job ads appearing in the production occupations shows that employers’ qualification requirements and preferences slightly differ from the BLS-assigned training levels1. BLS assigns training levels to Standard Occupational Classification codes based on employer survey results. Occupations within the production occupation group vary according to BLS education and training levels. While the training levels assigned by BLS accurately reflect training required to perform the occupation, they may not represent current employer demand for educational requirements within the manufacturing industry. For some production occupations, the qualifications in employer job listings are similar to BLS training levels. However, job listings for several occupations do not appear to match their BLS-assigned training levels. According to BLS, first-line supervisors/managers of production and operating workers’ average training level is “work experience,” but upon further examination, most employers preferred an applicant with a bachelor of science degree and prior work experience. Similarly, the assigned training level for industrial production managers is a bachelor of science degree, but upon further analysis, most employers in the 120-day review period required 3-5 years’ experience. The most revealing: of the top ten production occupations with the greatest number of job ads, production, planning, and expediting clerks showed the most discrepancy between employer demand and BLS level. The BLS-assigned training level for this occupation is short-term on-the-job training (less than 30 days in length), yet most advertising employers preferred an applicant with a bachelor of science or bachelor of arts degree plus work experience. When looking at disparities between job listings and average training requirements, it is important to add that during poor economic times, when the labor pool is large, employers can demand higher skill levels for candidates. The information contained within job ads for education and work experience is difficult to quantify reliably. Job ads may be disproportionately concentrated in one region and the types of manufacturing vary by region. Employer size affects the types of job ads: the larger the employer, the greater number of job ads. These factors can and should be properly weighted, making the information in job ads more quantifiable, but there is also a categorization problem. The job requirements for education and work experience differ among the various employers. For example, a welder may only have experience in Tungsten Inert Gas (TIG) welding, but a company is seeking a welder with 2 years of Metal Inert Gas (MIG) welding experience. There are no standard rules for employer requirements regarding education and work experience; therefore, there is no consistency. There are so many different combinations of experience within each area of an occupation that trying to realistically categorize the types and length of experience and training levels becomes unmanageable. Real-time job ads do, however, provide a snapshot of a changing industry. To understand the emergent hiring trends in the manufacturing industry, greater attention needs to be concentrated on how employers define employment qualifications through education and work experience.
1 Bureau of Labor Statistics, Training Levels: http://www.bls.gov/emp/ep_education_tech.htm.

Page 18
Labor Market Information Division | 7000 Franklin Blvd, Suite 1100, Sacramento, CA 95823 | www.labormarketinfo.ca.gov
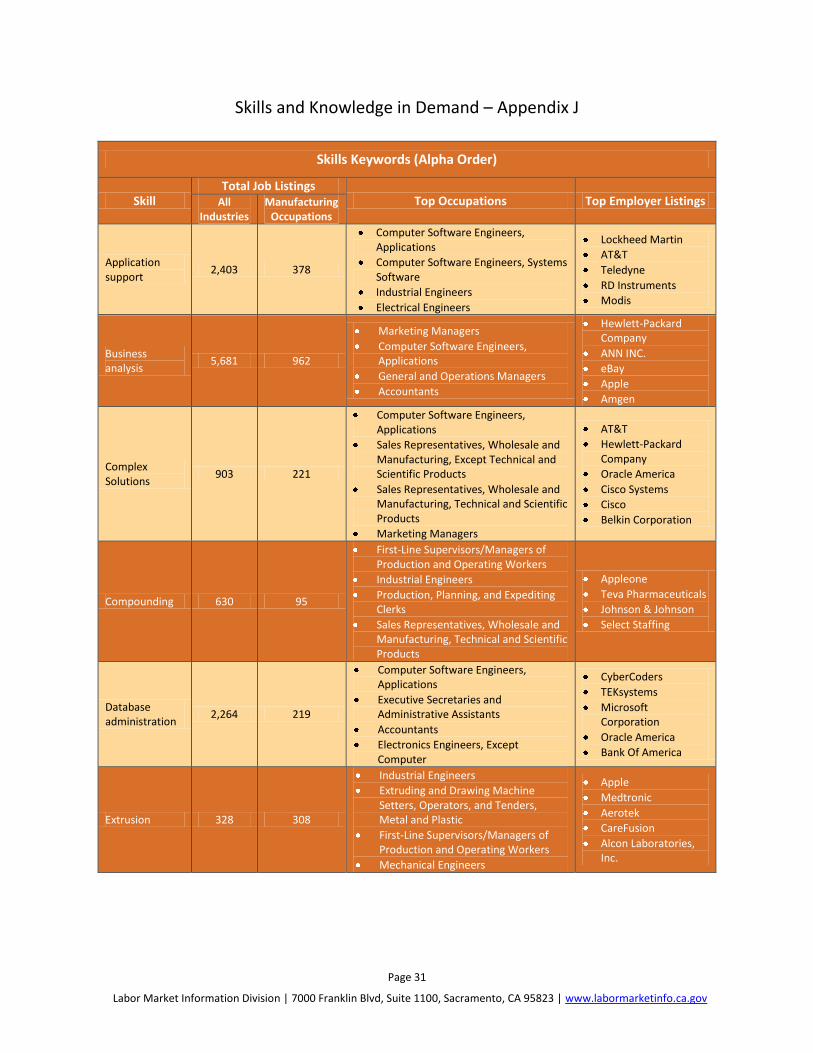
SKILLS, TOOLS, AND CERTIFICATIONS IN DEMAND
This section identifies the essential skills, tools, software, and certifications needed in manufacturing firms today. Using 49 keywords recommended by members of the California Manufacturers & Technology Association (CMTA), the HWOL tool was used to search across all job listings during the review period. Figures 11, 12, and 13 below show the top five ranked skills, tools, job titles, and certifications. For results on all 49 keywords provided by CMTA, see Appendices J-L. Note: a few keywords supplied by CMTA brought indefinite results due to the multiple meanings of the word depending on field of work. For example, “setup” is a skill required by occupations in production as well as in office and accounting occupations.
Figure 11: Skills in Demand
Skills in Demand
Skill keyword(s)
Total Job
Listings Top Occupations Top Employers
QA2 21,481
Computer Software Engineers, Applications
Industrial Engineers
First-Line Supervisors/Managers of Production and Operating Workers
Aerotek
CyberCoders
Apple
VMware, Inc.
Emc Corporation
Product management
12,322
Marketing Managers
Computer Software Engineers, Applications
General and Operations Managers
CyberCoders
VMware, Inc.
eBay
Google Inc.
Salesforce.com
Setup 10,719
Computer Software Engineers, Applications
Machinists
Customer Service Representatives
Aerotek
OfficeTeam
Appleone
CyberCoders
Business analysis
5,681
Marketing Managers
Computer Software Engineers, Applications
General and Operations Managers
Hewlett-Packard Company
ANN INC.
eBay
Apple
Amgen
Welding 4,676
Welders, Cutters, and Welder Fitters
Maintenance and Repair Workers, General
First-Line Supervisors/Managers of Production and Operating Workers
Aerotek
Allegis Group
Airgas
Space Exploration Technologies Corp
Source: The Conference Board Help Wanted Online™120-day Period ending Feb. 2, 2012; California Manufacturers & Technology Association.
2 The quality assurance acronym “QA” was applied to the keyword search, as the acronym produced higher results.

Page 19
Labor Market Information Division | 7000 Franklin Blvd, Suite 1100, Sacramento, CA 95823 | www.labormarketinfo.ca.gov
Figure 12: Tools and Software in Demand
Tools and Software
Tool Total Job
Listings Sample Occupations Top Employers
SQL 37,641
Computer Software Engineers, Applications
Marketing Managers
Computer Software Engineers, Systems Software
CyberCoders
Salesforce.com
Microsoft Corporation
Apple
UNIX 18,280
Computer Software Engineers, Applications
Computer Software Engineers, Systems Software
Computer Hardware Engineers
Electronics Engineers, Except Computer
Apple
CyberCoders
Cisco Systems
Yahoo! Inc
CAD 6,548
Mechanical Engineers
Industrial Engineers
Electrical Engineers
Electronics Engineers, Except Computer
Aerotek
Allegis Group
Apple
Nvidia Corporation
SolidWorks 2,686
Mechanical Engineers
Industrial Engineers
Mechanical Drafters
Electrical Engineers
Aerotek
Allegis Group
Randstad Engineering
CyberCoders
CAM 1,591
Machinists
Accountants
Industrial Engineers
Numerical Tool and Process Control Programmers
DP Technology
The Boeing Company
Aerotek
DP TECHNOLOGY CORP Source: The Conference Board Help Wanted Online™120-day Period ending Feb. 2, 2012; California Manufacturers & Technology Association.
Figure 13: Certifications in Demand
Certifications
Certification Total Job Listings
Sample Occupations Top Employers
CISSP (Certified Information Systems Security Professional)*
1,837
Network and Computer Systems Administrators
Computer and Information Systems Managers
Engineers, All Other
Lockheed Martin
Intuit Inc.
ca technologies
Kforce Professional Staffing, Inc.
Allegis Group
AS9100 851
Industrial Engineers
First-Line Supervisors/Managers of Production and Operating Workers
Inspectors, Testers, Sorters, Samplers, and Weighers
Aerotek
Precision Castparts Corp.
Lockheed Martin
C&D Zodiac
Circor
ISO9000 216
Industrial Engineers
Inspectors, Testers, Sorters, Samplers, and Weighers
Computer Software Engineers, Systems Software
Volt
Aerotek
Avery Dennison
Aerotek
Philips Source: The Conference Board Help Wanted Online™120-day Period ending Feb. 2, 2012; California Manufacturers & Technology Association. * Job listings reported for all occupations.
Page 20
Labor Market Information Division | 7000 Franklin Blvd, Suite 1100, Sacramento, CA 95823 | www.labormarketinfo.ca.gov
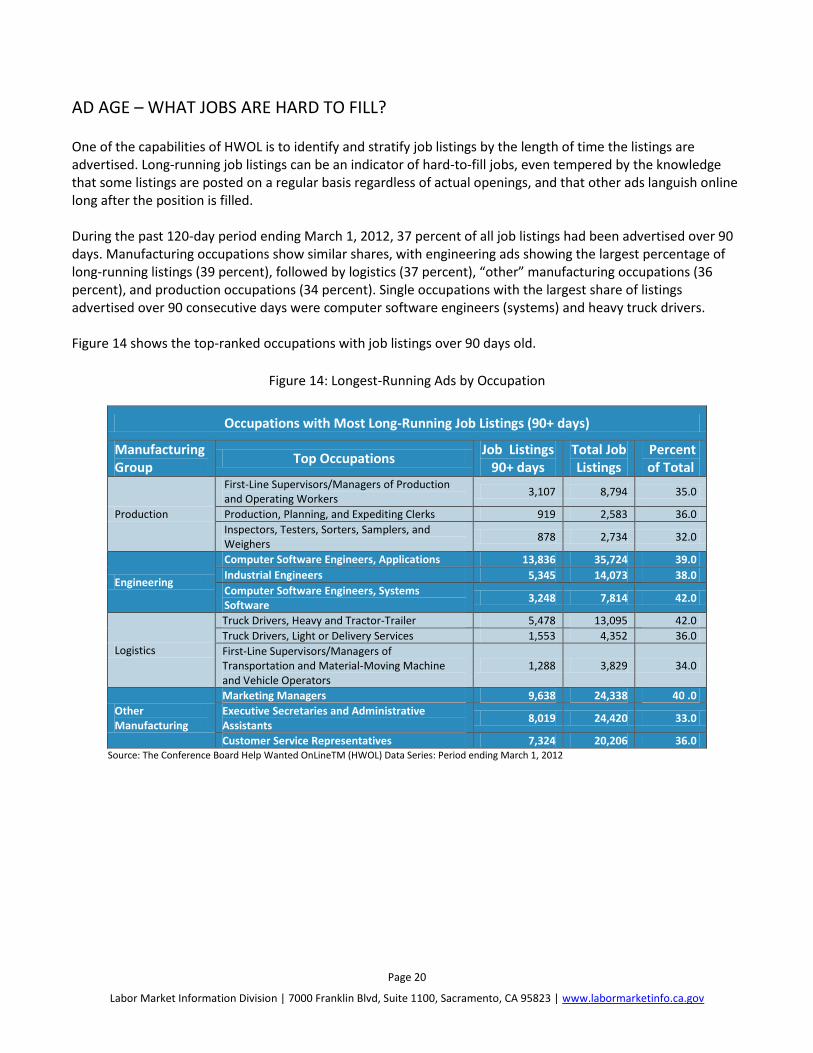
AD AGE – WHAT JOBS ARE HARD TO FILL?
One of the capabilities of HWOL is to identify and stratify job listings by the length of time the listings are advertised. Long-running job listings can be an indicator of hard-to-fill jobs, even tempered by the knowledge that some listings are posted on a regular basis regardless of actual openings, and that other ads languish online long after the position is filled. During the past 120-day period ending March 1, 2012, 37 percent of all job listings had been advertised over 90 days. Manufacturing occupations show similar shares, with engineering ads showing the largest percentage of long-running listings (39 percent), followed by logistics (37 percent), “other” manufacturing occupations (36 percent), and production occupations (34 percent). Single occupations with the largest share of listings advertised over 90 consecutive days were computer software engineers (systems) and heavy truck drivers. Figure 14 shows the top-ranked occupations with job listings over 90 days old.
Figure 14: Longest-Running Ads by Occupation
Occupations with Most Long-Running Job Listings (90+ days)
Manufacturing Group
Top Occupations Job Listings
90+ days Total Job Listings
Percent of Total
Production
First-Line Supervisors/Managers of Production and Operating Workers
3,107 8,794 35.0
Production, Planning, and Expediting Clerks 919 2,583 36.0
Inspectors, Testers, Sorters, Samplers, and Weighers
878 2,734 32.0
Engineering
Computer Software Engineers, Applications 13,836 35,724 39.0
Industrial Engineers 5,345 14,073 38.0
Computer Software Engineers, Systems Software
3,248 7,814 42.0
Logistics
Truck Drivers, Heavy and Tractor-Trailer 5,478 13,095 42.0
Truck Drivers, Light or Delivery Services 1,553 4,352 36.0
First-Line Supervisors/Managers of Transportation and Material-Moving Machine and Vehicle Operators
1,288 3,829 34.0
Other Manufacturing
Marketing Managers 9,638 24,338 40 .0
Executive Secretaries and Administrative Assistants
8,019 24,420 33.0
Customer Service Representatives 7,324 20,206 36.0 Source: The Conference Board Help Wanted OnLineTM (HWOL) Data Series: Period ending March 1, 2012
Page 21
Labor Market Information Division | 7000 Franklin Blvd, Suite 1100, Sacramento, CA 95823 | www.labormarketinfo.ca.gov
SUMMARY AND CAVEATS ABOUT REAL-TIME DATA It appears California’s manufacturing industry is rebounding, based on year-over comparisons of advertised job listings for relevant occupations in production (up 18.8 percent), logistics (up 16.3 percent), and engineering (up 8.6 percent) firms. Overall, advertised jobs for occupations in the manufacturing sector rose 7.7 percent over the same 120-day timeframe a year ago, just short of the average 8.3 percent increase across all occupations during the same time. Production-level job listings were low, given the overall employment in this category. The authors believe skilled labor job listings on HWOL do not reflect true demand, since these jobs generally are not advertised but are filled through union halls, word-of-mouth, or other methods. Real-time labor market information using tools such as the Conference Board’s Help Wanted OnlineTM provide point-in-time snapshots of job demand, as well as valuable year-over comparisons. However, comparing job listings as a time series over a number of years would be even more valuable and would smooth out irregularities, giving a more accurate picture of job demand by industry, by geographic location, and by occupational classification.
Caveats of HWOL and Real-Time Data
Real-time data systems such as HWOL cannot classify a majority of job listings to their correct industry, due in part to lack of employer information within the ads, but also because many postings are generated through temporary agencies or recruiting firms. Therefore, while this study focuses on occupations common to manufacturing based on staffing patterns, some of the occupational ad listing totals will be inflated due to the cross-industry nature of some occupations. This is particularly true in the “other” occupational group, where occupations (e.g., accountants and auditors) appear in all industries.
The “job description” field in each job listing is rich with emerging and in-demand skills, software, certifications, and other information. However, the non-standard nature of this information makes it very time-consuming to develop an anecdotal-level analysis and impossible to quantify on a reliable basis.
The HWOL system does not have a year-over comparison function for keyword searches, which inhibits tracking the demand for new technologies and skills.
Even with the use of the HWOL filter settings designed to exclude duplicate ads, the authors still came across instances where multiple ads were found for one position in a single location.
Users of real-time data need to be aware that job listings are not the same as job openings. One listing often represents multiple open positions.
Page 22
Labor Market Information Division | 7000 Franklin Blvd, Suite 1100, Sacramento, CA 95823 | www.labormarketinfo.ca.gov
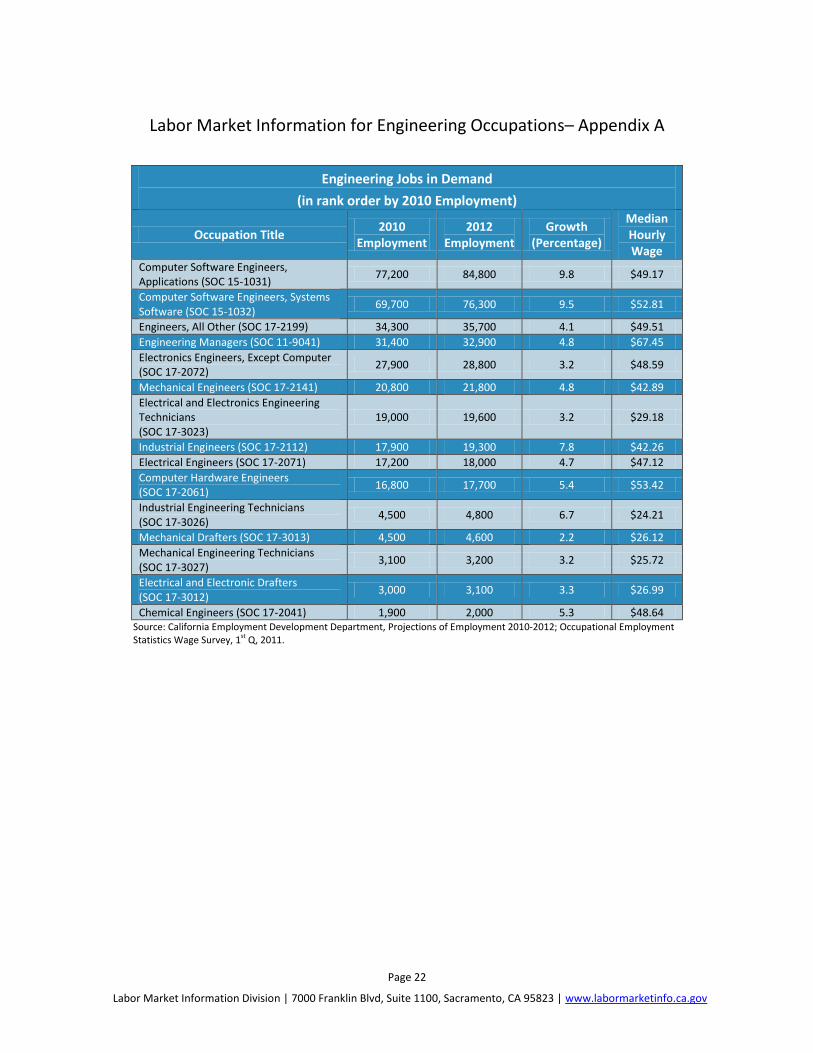
Labor Market Information for Engineering Occupations– Appendix A
Engineering Jobs in Demand
(in rank order by 2010 Employment)
Occupation Title 2010
Employment 2012
Employment Growth
(Percentage)
Median Hourly Wage
Computer Software Engineers, Applications (SOC 15-1031)
77,200 84,800 9.8 $49.17
Computer Software Engineers, Systems Software (SOC 15-1032)
69,700 76,300 9.5 $52.81
Engineers, All Other (SOC 17-2199) 34,300 35,700 4.1 $49.51
Engineering Managers (SOC 11-9041) 31,400 32,900 4.8 $67.45
Electronics Engineers, Except Computer (SOC 17-2072)
27,900 28,800 3.2 $48.59
Mechanical Engineers (SOC 17-2141) 20,800 21,800 4.8 $42.89
Electrical and Electronics Engineering Technicians (SOC 17-3023)
19,000 19,600 3.2 $29.18
Industrial Engineers (SOC 17-2112) 17,900 19,300 7.8 $42.26
Electrical Engineers (SOC 17-2071) 17,200 18,000 4.7 $47.12
Computer Hardware Engineers (SOC 17-2061)
16,800 17,700 5.4 $53.42
Industrial Engineering Technicians (SOC 17-3026)
4,500 4,800 6.7 $24.21
Mechanical Drafters (SOC 17-3013) 4,500 4,600 2.2 $26.12
Mechanical Engineering Technicians (SOC 17-3027)
3,100 3,200 3.2 $25.72
Electrical and Electronic Drafters (SOC 17-3012)
3,000 3,100 3.3 $26.99
Chemical Engineers (SOC 17-2041) 1,900 2,000 5.3 $48.64 Source: California Employment Development Department, Projections of Employment 2010-2012; Occupational Employment Statistics Wage Survey, 1st Q, 2011.

Page 23
Labor Market Information Division | 7000 Franklin Blvd, Suite 1100, Sacramento, CA 95823 | www.labormarketinfo.ca.gov
Labor Market Information for Production Occupations – Appendix B
.
Production Jobs in Demand
(in rank order by 2010 Employment)
Occupation Title 2010
Employment 2012
Employment Growth
(Percent) Median Hourly
Wage Packers and Packagers, Hand (SOC 53-7064)
99,900 102,300 2.4 $9.39
First-Line Supervisors/Managers of Production and Operating Workers (SOC 51-1011)
54,000 55,600 3.0 $26.48
Inspectors, Testers, Sorters, Samplers, and Weighers (SOC 51-9061)
47,000 49,100 4.5 $16.12
Packaging and Filling Machine Operators and Tenders (SOC 51-9111)
45,200 47,000 4.0 $10.84
Sewing Machine Operators (SOC 51-6031)
41,600 42,900 3.1 $9.29
Helpers--Production (SOC 51-9198) 38,300 40,300 5.2 $10.24
Production, Planning, and Expediting Clerks (SOC 43-5061)
37,500 39,000 4.0 $22.94
Machinists (SOC 51-4041) 31,500 33,200 5.4 $18.70
Assemblers and Fabricators, All Other (SOC 51-2099)
28,500 30,100 5.6 $12.56
Welders, Cutters, and Welder Fitters (SOC 51-4121)
23,900 24,800 3.8 $17.62
Electrical and Electronic Equipment Assemblers (SOC 51-2022)
21,700 22,800 5.1 $14.37
Laundry and Dry-Cleaning Workers (SOC 51-6011)
21,200 21,400 0.9 $9.83
Industrial Production Managers (SOC 11-3051)
16,900 17,400 3. $44.62
Printing Machine Operators (SOC 51-5023)
16,800 17,200 2.4 $16.87
Cutting, Punching, and Press Machine Setters, Operators, and Tenders, Metal and Plastic (SOC 51-4031)
15,300 15,700 2.6 $13.71
Industrial Machinery Mechanics (SOC 49-9041)
15,000 15,900 6.0 $26.16
Computer-Controlled Machine Tool Operators, Metal and Plastic (SOC 51-4011)
9,200 9,900 7.6 $17.10
Water and Liquid Waste Treatment Plant Operators (SOC 51-8031)
8,200 8,200 0.0 $29.17
Electromechanical Equipment Assemblers (SOC 51-2023)
7,900 8,300 5.1 $13.86
Molding, Coremaking, and Casting Machine Setters, Operators, and Tenders, Metal and Plastic (SOC 51-4072)
7,500 7,700 2.7 $11.25
Painters, Transportation (SOC 51-9122) 5,200 5,300 1.9 $21.73
Dental Lab Technicians (SOC 51-9081) 4,200 4,300 2.4 $17.87
Painting, Coating, and Decorating Workers (SOC 51-9023)
1,400 1,400 0.0 $11.99
Numerical Tool and Process Control Programmers (SOC 51-4012)
1,200 1,300 8.3 $26.94
Source: California Employment Development Department, Projections of Employment 2010-2012; Occupational Employment Statistics Wage Survey, 1st Q, 2011
Page 24
Labor Market Information Division | 7000 Franklin Blvd, Suite 1100, Sacramento, CA 95823 |www.labormarketinfo.ca.gov
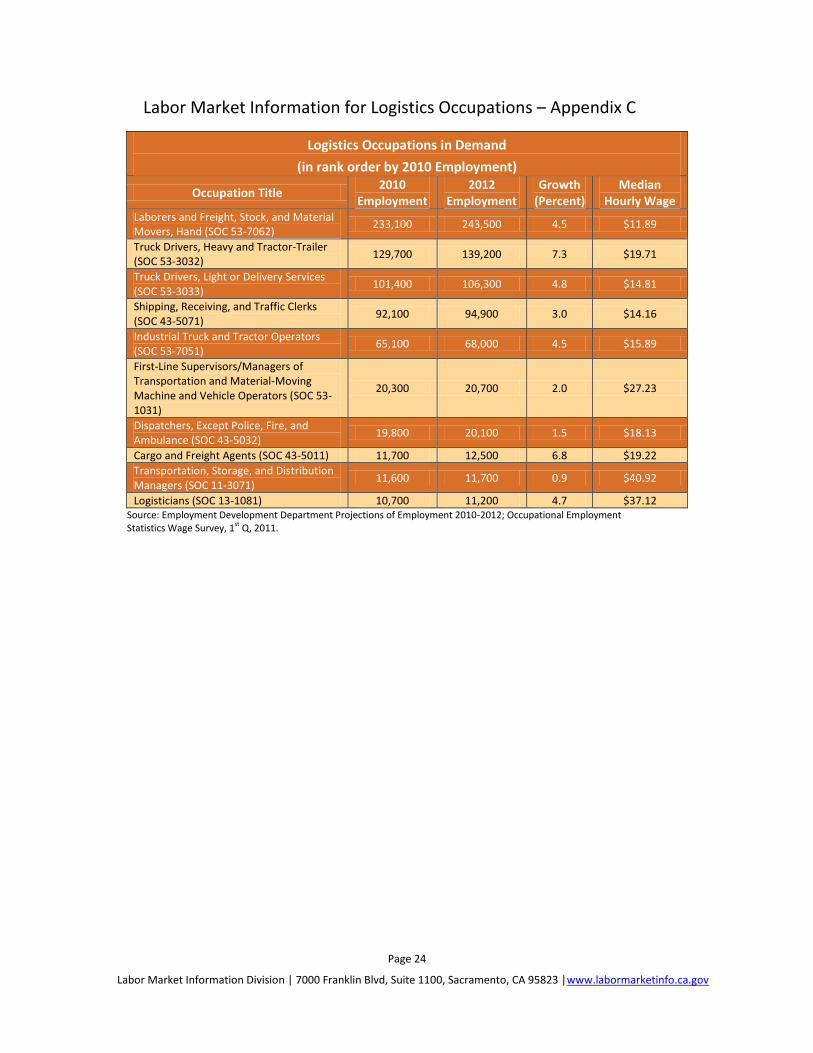
Labor Market Information for Logistics Occupations – Appendix C
Logistics Occupations in Demand
(in rank order by 2010 Employment)
Occupation Title 2010
Employment 2012
Employment Growth
(Percent) Median
Hourly Wage Laborers and Freight, Stock, and Material Movers, Hand (SOC 53-7062)
233,100 243,500 4.5 $11.89
Truck Drivers, Heavy and Tractor-Trailer (SOC 53-3032)
129,700 139,200 7.3 $19.71
Truck Drivers, Light or Delivery Services (SOC 53-3033)
101,400 106,300 4.8 $14.81
Shipping, Receiving, and Traffic Clerks (SOC 43-5071)
92,100 94,900 3.0 $14.16
Industrial Truck and Tractor Operators (SOC 53-7051)
65,100 68,000 4.5 $15.89
First-Line Supervisors/Managers of Transportation and Material-Moving Machine and Vehicle Operators (SOC 53-1031)
20,300 20,700 2.0 $27.23
Dispatchers, Except Police, Fire, and Ambulance (SOC 43-5032)
19,800 20,100 1.5 $18.13
Cargo and Freight Agents (SOC 43-5011) 11,700 12,500 6.8 $19.22
Transportation, Storage, and Distribution Managers (SOC 11-3071)
11,600 11,700 0.9 $40.92
Logisticians (SOC 13-1081) 10,700 11,200 4.7 $37.12 Source: Employment Development Department Projections of Employment 2010-2012; Occupational Employment Statistics Wage Survey, 1st Q, 2011.

Page 25
Labor Market Information Division | 7000 Franklin Blvd, Suite 1100, Sacramento, CA 95823 | www.labormarketinfo.ca.gov
Labor Market Information for “Other” Occupations – Appendix D
“Other” Manufacturing Occupations in Demand
(in rank order by 2010 Employment)
Occupation Title 2010
Employment 2012
Employment Growth
(Percent) Median
Hourly Wage Office Clerks, General (SOC 43-9061)
339,100 349,300 3.0 $14.45
General and Operations Managers (SOC 11-1021)
230,300 236,200 2.6 $53.29
Janitors and Cleaners, Except Maids and Housekeeping Cleaners (SOC 37-2011)
205,200 208,800 1.8 $11.59
Bookkeeping, Accounting, and Auditing Clerks (SOC 43-3031)
202,400 209,600 3.6 $18.82
Executive Secretaries and Administrative Assistants (SOC 43-6011)
202,300 210,300 4.0 $23.11
Customer Service Representatives (SOC 43-4051)
184,400 196,400 6.5 $17.32
First-Line Supervisors/Managers of Office and Administrative Support Workers (SOC 43-1011)
173,100 179,600 3.8 $26.15
Business Operations Specialists, All Other (SOC 13-1199)
161,700 165,600 2.4 $31.71
Accountants and Auditors (SOC 13-2011)
129,400 136,600 5.6 $33.03
Sales Representatives, Wholesale and Manufacturing, Except Technical and Scientific Products (SOC 41-4012)
128,500 136,500 6.2 $27.25
Maintenance and Repair Workers, General (SOC 49-9042)
119,100 122,800 3.1 $18.46
Financial Managers (SOC 11-3031) 67,100 69,800 4.0 $56.45
Sales Representatives, Wholesale and Manufacturing, Technical and Scientific Products (SOC 41-4011)
48,000 51,300 6.9 $37.87
Marketing Managers (SOC 11-2021) 33,400 35,400 6.0 $63.88
Purchasing Agents, Except Wholesale, Retail, and Farm Products (SOC 13-1023)
30,800 32,400 5.2 $29.49
Source:Employment Development Department Projections of Employment 2010-2012; Occupational Employment Statistics Wage Survey, 1st Q, 2011.

Page 26
Labor Market Information Division | 7000 Franklin Blvd, Suite 1100, Sacramento, CA 95823 | www.labormarketinfo.ca.gov
Top Engineering Occupations – Appendix E
Engineering Listings
CA Listings posted online Oct. 6, 2011 to Feb. 2, 2012
Occupation Title HWOL
Job Listings
Percent Change*
Part-Time (Percent)
Contract (Percent)
Computer Software Engineers, Applications (SOC 15-1031)
27,849 8.1 6.5 16.4
Industrial Engineers (SOC 17-2112) 10,760 19.0 4.4 20.5
Computer Software Engineers, Systems Software (SOC 15-1032)
6,055 5.0 4.1 16.0
Mechanical Engineers (SOC 17-2141) 4,365 10.8 4.4 21.0
Electrical Engineers (SOC 17-2071) 3,708 2.5 5.0 20.4
Engineering Managers (SOC 11-9041) 3,367 12.5 2.7 23.0
Electronics Engineers, Except Computer (SOC 17-2072) 3,240 -7.7 7.0 12.8
Computer Hardware Engineers (SOC 17-2061) 2,643 10.7 3.8 14.3
Electrical and Electronics Engineering Technicians (SOC 17-3023)
2,162 25.2 9.4 19.2
Industrial Engineering Technicians (SOC 17-3026) 1,045 2.3 6.0 23.2
Engineers, All Other (SOC 17-2199) 663 -19.9 5.6 18.3
Chemical Engineers (SOC 17-2041) 509 22.1 6.7 27.1
Mechanical Drafters (SOC 17-3013) 477 -27.2 8.2 24.1
Mechanical Engineering Technicians (SOC 17-3027) 250 52.4 6.0 19.2
Electrical and Electronic Drafters (SOC 17-3012) 155 47.2 10.3 31.6 Source: The Conference Board Help Wanted Online™ Data Series; *as compared to the same 120-day period from the previous year.
Page 27
Labor Market Information Division | 7000 Franklin Blvd, Suite 1100, Sacramento, CA 95823 | www.labormarketinfo.ca.gov
Top Production Occupations – Appendix F
Production Listings
CA Listings posted online Oct. 6, 2011 to Feb. 2, 2012
Occupation Title Total Job Listings
Percent Change*
Part-Time (Percent)
Contract (Percent)
First-Line Supervisors/Managers of Production and Operating Workers (SOC 51-1011)
7,033 19.3 7.6 12.2
Machinists (SOC 51-4041) 2,195 27.8 3.7 12.3
Inspectors, Testers, Sorters, Samplers, and Weighers (SOC 51-9061)
2,099 20.6 4.4 20.1
Production, Planning, and Expediting Clerks (SOC 43-5061) 2,056 10.7 8.5 18.7
Helpers--Production Workers (SOC 51-9198) 1,425 37.5 9.1 11.2
Industrial Production Managers (SOC 11-3051) 1,359 -4.1 1.2 7.9
Welders, Cutters, and Welder Fitters (SOC 51-4121) 1,324 7.6 4.0 10.1
Industrial Machinery Mechanics (SOC 49-9041) 1,220 36.6 4.8 8.9
Computer-Controlled Machine Tool Operators, Metal and Plastic (SOC 51-4011)
920 27.6 4.2 9.8
Electrical and Electronic Equipment Assemblers (SOC 51-2022)
891 4.6 7.2 16.0
Printing Machine Operators (SOC 51-5023) 616 26.7 19.5 5.4
Tailors, Dressmakers, and Custom Sewers (SOC 51-2099) 514 39.7 14.8 2.7
Assemblers and Fabricators, All Other (SOC 51-2099) 509 16.2 7.5 11.6
Numerical Tool and Process Control Programmers (SOC 51-4012)
408 60.6 4.7 21.1
Electromechanical Equipment Assemblers (SOC 51-2023) 395 -15.2 4.6 20.5
Packers and Packagers, Hand (SOC 53-7064) 385 19.6 14.0 9.9
Sewing Machine Operators (SOC 51-6031) 362 20.3 13.0 4.7
Packaging and Filling Machine Operators and Tenders (SOC 51-9111)
345 5.5 8.1 12.8
Cutting, Punching, and Press Machine Setters, Operators, and Tenders, Metal and Plastic (SOC 51-4031)
322 23.4 2.5 10.6
Water and Liquid Waste Treatment Plant and System Operators (SOC 51-8031)
259 32.8 10.8 20.1
Painting, Coating, and Decorating Workers (SOC 51-9123) 249 -38.2 15.3 6.4
Molding, Coremaking, and Casting Machine Setters, Operators, and Tenders, Metal and Plastic (SOC 51-4072)
232 17.2 0.9 6.0
Laundry and Dry-Cleaning Workers (SOC 51-6011) 217 15.4 15.7 4.1
Dental Laboratory Technicians (SOC 51-9081) 211 41.6 12.3 5.2
Painters, Transportation Equipment (SOC 51-9022) 189 23.5 4.2 6.3 Source: The Conference Board Help Wanted Online™; *as compared to the same 120-day period from the previous year.

Page 28
Labor Market Information Division | 7000 Franklin Blvd, Suite 1100, Sacramento, CA 95823 | www.labormarketinfo.ca.gov
Top Logistics Occupations– Appendix G
Logistics Listings
CA Listings posted online Oct. 6, 2011 to Feb. 2, 2012
Occupation Title HWOL
Job Listings
Percent Change*
Part-Time (Percent)
Contract (Percent)
Truck Drivers, Heavy and Tractor-Trailer (SOC 53-3032)
10,835 37.5 13.2 15.8
Truck Drivers, Light or Delivery Services (SOC 53-3033)
3,861 13.4 31.7 7.0
First-Line Supervisors/Managers of Transportation and Material-Moving Machine and Vehicle Operators (SOC 53-1031)
3,134 17.2 13.7 12.5
Laborers and Freight, Stock, and Material Movers, Hand (SOC 53-7062)
2,874 -6.3 17.0 7.9
Shipping, Receiving, and Traffic Clerks (SOC 43-5071) 1,543 0.7 12.2 10.1
Transportation, Storage, and Distribution Managers (SOC 11-3071)
1,421 2.8 6.6 10.4
Industrial Truck and Tractor Operators (SOC 53-7051) 1,175 -16.4 4.9 13.6
Logisticians (SOC 13-1081) 907 28.5 7.1 22.9
Dispatchers, Except Police, Fire, and Ambulance (SOC 43-5032)
803 10.6 13.7 7.8
Cargo and Freight Agents (SOC 43-5011) 466 4.7 11.6 9.0 Source: The Conference Board Help Wanted Online™; *as compared to the same 120-day period from the previous year.

Page 29
Labor Market Information Division | 7000 Franklin Blvd, Suite 1100, Sacramento, CA 95823 | www.labormarketinfo.ca.gov
Top “Other” Manufacturing Occupations– Appendix H
“Other” Job Listings
CA Listings posted online Oct. 6, 2011 to Feb. 2, 2012
Occupation Title Total Job Listings
Percent Change*
Part-Time (Percent)
Contract (Percent)
Executive Secretaries and Administrative Assistants (SOC 43-6011)
21,677 5.4 20.0 11.2
Marketing Managers (SOC 11-2021) 19,515 -0.2 4.7 11.3
Customer Service Representatives (SOC 43-4051)
17,251 1.7 19.9 12.2
Accountants and Auditors (SOC 13-2011) 16,700 9.7 6.4 14.5
Sales Representatives, Wholesale and Manufacturing, Except Technical and Scientific Products (SOC 41-4012)
12,599 0.9 10.1 8.4
First-Line Supervisors/Managers of Office and Administrative Support Workers (SOC 43-1011)
10,650 10.4 13.6 11.2
Bookkeeping, Accounting, and Auditing Clerks (SOC 43-3031)
10,098 5.5 18.7 17.4
Financial Managers (SOC 11-3031) 9,519 -1.6 6.5 10.1
Office Clerks, General (SOC 43-9061) 8,854 4.0 28.8 11.3
General and Operations Managers (SOC 11-1021)
8,364 8.7 6.0 12.4
Sales Representatives, Wholesale and Manufacturing, Technical and Scientific Products (SOC 41-4011)
8,005 2.0 7.5 10.0
Maintenance and Repair Workers, General (SOC 49-9042)
5,679 11.1 19.6 6.8
Janitors and Cleaners, Except Maids and Housekeeping Cleaners (SOC 37-2011)
3,652 14.5 27.8 6.1
Purchasing Agents, Except Wholesale, Retail, and Farm Products (SOC 13-1023)
2,514 7.0 4.0 35.2
Business Operations Specialists, All Other (SOC 13-1199)
2,017 5.0 7.7 43.1
Source: The Conference Board Help Wanted Online™; *as compared to the same 120-day period from the previous year.

Page 30
Labor Market Information Division | 7000 Franklin Blvd, Suite 1100, Sacramento, CA 95823 | www.labormarketinfo.ca.gov
California Workforce Services Branch Regions – Appendix I
The Employment Development Department’s (EDD’s) Workforce Services Branch’s three geographic regions are comprised of counties grouped into three areas: Los Angeles and Ventura, Southern California, and Northern California.
WORKFORCE SERVICES BRANCH REGIONS
NORTHERN REGION L.A.-VENTURA REGION
Alameda County Los Angeles County
Alpine County Ventura County
Amador County
Butte County SOUTHERN REGION
Calaveras County Fresno County
Colusa County Imperial County
Contra Costa County Inyo County
Del Norte County Kern County
El Dorado County Kings County
Glenn County Madera County
Humboldt County Mono County
Lake County Orange County
Lassen County Riverside County
Marin County San Bernardino County
Mendocino County San Diego County
Merced County San Luis Obispo County
Modoc County Santa Barbara County
Monterey County Tulare County
Napa County
Nevada County
Placer County
Plumas County
Sacramento County
San Benito County
San Francisco County
San Joaquin County
Santa Clara County
Santa Cruz County
Shasta County
Sierra County
Siskiyou County
Solano County
Sonoma County
Stanislaus County
Tehama County
Trinity County
Tuolumne County
Yolo County
Yuba County
Page 31
Labor Market Information Division | 7000 Franklin Blvd, Suite 1100, Sacramento, CA 95823 | www.labormarketinfo.ca.gov
Skills and Knowledge in Demand – Appendix J
Skills Keywords (Alpha Order)
Skill Total Job Listings
Top Occupations Top Employer Listings All Industries
Manufacturing Occupations
Application support
2,403 378
Computer Software Engineers, Applications
Computer Software Engineers, Systems Software
Industrial Engineers
Electrical Engineers
Lockheed Martin
AT&T
Teledyne
RD Instruments
Modis
Business analysis
5,681 962
Marketing Managers
Computer Software Engineers, Applications
General and Operations Managers
Accountants
Hewlett-Packard Company
ANN INC.
eBay
Apple
Amgen
Complex Solutions
903 221
Computer Software Engineers, Applications
Sales Representatives, Wholesale and Manufacturing, Except Technical and Scientific Products
Sales Representatives, Wholesale and Manufacturing, Technical and Scientific Products
Marketing Managers
AT&T
Hewlett-Packard Company
Oracle America
Cisco Systems
Cisco
Belkin Corporation
Compounding 630 95
First-Line Supervisors/Managers of Production and Operating Workers
Industrial Engineers
Production, Planning, and Expediting Clerks
Sales Representatives, Wholesale and Manufacturing, Technical and Scientific Products
Appleone
Teva Pharmaceuticals
Johnson & Johnson
Select Staffing
Database administration
2,264 219
Computer Software Engineers, Applications
Executive Secretaries and Administrative Assistants
Accountants
Electronics Engineers, Except Computer
CyberCoders
TEKsystems
Microsoft Corporation
Oracle America
Bank Of America
Extrusion 328 308
Industrial Engineers
Extruding and Drawing Machine Setters, Operators, and Tenders, Metal and Plastic
First-Line Supervisors/Managers of Production and Operating Workers
Mechanical Engineers
Apple
Medtronic
Aerotek
CareFusion
Alcon Laboratories, Inc.

Page 32
Labor Market Information Division | 7000 Franklin Blvd, Suite 1100, Sacramento, CA 95823 | www.labormarketinfo.ca.gov
Skills Keywords (Alpha Order)
Skill Total Job Listings
Top Occupations Top Employer Listings All Industries
Manufacturing Occupations
Fiber placement 88 22
Materials Engineers**
Industrial Engineers
Computer Software Engineers, Applications
Engineering Managers
Aerospace Engineers
Lockheed Martin
HITCO Carbon Composites
General Employment
RONIN
GOODRICH
Injection molding
925 859
Industrial Engineers
Mechanical Engineers
Production and Operating Worker Supervisors
Molding, Coremaking, and Casting Machine Setters, Operators, and Tenders, Metal and Plastic
Aerotek
Apple
CyberCoders
Dynacast
Allegis Group
Marcom 551 377
Marketing Managers
General and Operations Managers
Computer Software Engineers, Applications
Executive Secretaries and Administrative Assistants
Apple
Hewlett-Packard Company
Thermo Fisher Scientific
Cisco
VPofMarketing.com
Mold making 57 46
Machinists
Industrial Engineers
Tool and Die Makers
First-Line Supervisors/Managers of Production and Operating Workers
Apple
Appleone
Marman Industries Inc.
Nation Hire
Collins Professional Placement
Plastic injection 296 275
Mechanical Engineers
Industrial Engineers
First-Line Supervisors/Managers of Production and Operating Workers
Molding, Coremaking, and Casting Machine Setters, Operators, and Tenders, Metal and Plastic
Aerotek
Allegis Group
Aerotek CE
Apple
Volt
Product management
12,322 7,462
Marketing Managers
Computer Software Engineers, Applications
General and Operations Managers
Engineering Managers
CyberCoders
VMware, Inc.
eBay
Google Inc.
Salesforce.com
QA 21,481 8,115
Computer Software Engineers, Applications
Industrial Engineers
First-Line Supervisors/Managers of Production and Operating Workers
Marketing Managers
Aerotek
CyberCoders
Apple
VMware, Inc.
Emc Corporation
Requirements documentation
854 215
Computer Software Engineers, Applications
Marketing Managers
Industrial Engineers
Computer Software Engineers, Systems Software
Hostess Brands
CyberCoders
Belkin Corporation
Advanced BioHealing Inc.
Aerotek

Page 33
Labor Market Information Division | 7000 Franklin Blvd, Suite 1100, Sacramento, CA 95823 | www.labormarketinfo.ca.gov
Skills Keywords (Alpha Order)
Skill Total Job Listings
Top Occupations Top Employer Listings All Industries
Manufacturing Occupations
Scientific molding
4 4
Molding, Coremaking, and Casting Machine Setters, Operators, and Tenders, Metal and Plastic
Industrial Machinery Mechanics
Volt
Scholle Packaging
Setup 10,719 3,819
Computer Software Engineers, Applications
Machinists
Customer Service Representatives
Computer-Controlled Machine Tool Operators, Metal and Plastic
Aerotek
OfficeTeam
Appleone
CyberCoders
Ship Repair 263 90
Executive Secretaries and Administrative Assistants
Purchasing Agents, Except Wholesale, Retail, and Farm Products
General and Operations Managers
Welders, Cutters, and Welder Fitters
Inspectors, Testers, Sorters, Samplers, and Weighers
BAe Systems
NSC TECHNOLOGIES, INC.
Epsilon Systems Solutions, Inc.
Aerotek
Pacific Ship Repair & Fabrication
Shipbuilding 141 89
Marketing Managers
Sales Representatives, Wholesale and Manufacturing, Except Technical and Scientific Products
First-Line Supervisors/Managers of Production and Operating Workers
Industrial Engineers
Northrop Grumman
Deloitte
THE TORQUE GUN COMPANY
Huntington Ingalls Industries
MR - SC Buffalo
SPM 160 68
Marketing Managers
Financial Managers, Branch or Department
Computer Software Engineers, Applications
Computer Software Engineers, Systems Software
Sierra Pacific Mortgage Company, Inc.
Lockheed Martin
PubMatic
Genentech, Inc.
Aerotek
Test and Trial 1 1 N/A N/A
Thermoforming 66 58
Industrial Engineers
Extruding and Drawing Machine Setters, Operators, and Tenders, Metal and Plastic
First-Line Supervisors/ Managers of Production and Operating Workers
Packaging and Filling Machine Operators and Tenders
Personnel Plus
ASG
Staffmark
Manufacturing Pros
BAe Systems
Welding 4,676 3,289
Welders, Cutters, and Welder Fitters
Maintenance and Repair Workers, General
First-Line Supervisors/Managers of Production and Operating Workers
Industrial Machinery Mechanics
Aerotek
Allegis Group
Airgas
Space Exploration Technologies Corp
Source: The Conference Board Help Wanted Online™ Data Series; 120-day period ending Feb 2, 2012;* Keywords supplied by California Manufacturers & Technology Association.

Page 34
Labor Market Information Division | 7000 Franklin Blvd, Suite 1100, Sacramento, CA 95823 | www.labormarketinfo.ca.gov
Tools and Technology in Demand – Appendix K
Tools and Technologies in Demand*
Tool or Software
Total Job Listings Top Occupations
Top Advertising Employers
All Industries
Manufacturing Occupations
Atrium1 313 64
Executive Secretaries and Administrative Assistants
Computer Software Engineers, Applications
Maintenance and Repair Workers
Supervisors/Managers of Office and Administrative Support Workers
Accountants
Apple
Dew Software
Experis, formerly Manpower Professional
Cognate
CAD 6,548 4,428
Mechanical Engineers
Industrial Engineers
Electrical Engineers
Electronics Engineers
Mechanical Drafters
Aerotek
Allegis Group
Apple
Nvidia Corporation
Qualcomm
CAM 1,591 1,035
Machinists
Accountants
Industrial Engineers
Numerical Tool and Process Control Programmers
Marketing Managers
DP Technology
The Boeing Company
Aerotek
DP TECHNOLOGY CORP
Apple
InDesign 3,400 584
Marketing Managers
Executive Secretaries and Administrative Assistants
Applications Software Engineers
First-Line Supervisors/Managers of Production and Operating Workers
Office and Administrative Support Supervisors
Creative Circle
Schawk, Inc.
Quiksilver
Amylin Pharmaceuticals, Inc.
Extron Electronics
ITIL (IT Service Management)
2,771 274
Applications Software Engineers
Auditors
Industrial Engineers
Marketing Managers
First-Line Supervisors/Managers of Office and Administrative Support Workers
Hewlett-Packard Company
ca technologies
IBM
Cisco Systems
Kforce Professional Staffing, Inc.
VMware, Inc.
MasterCAM 558 549
Machinists
Numerical Tool and Process Control Programmers
First-Line Supervisors/Managers of Production and Operating Workers
Industrial Engineers
Aerotek
Allegis Group
Volt
Space Exploration Technologies Corporation
LSI Manufacturing Solutions

Page 35
Labor Market Information Division | 7000 Franklin Blvd, Suite 1100, Sacramento, CA 95823 | www.labormarketinfo.ca.gov
Tools and Technologies in Demand*
Tool or Software
Total Job Listings Top Occupations
Top Advertising Employers
All Industries
Manufacturing Occupations
Remedy (BMC) 1,758 358
Computer Software Engineers, Applications
First-Line Supervisors/Managers of Office and Administrative Support Workers
Marketing Managers
Electronics Engineering Technicians
AT&T Interactive
CyberCoders
EMC Corporation
Appleone
BMC Software
SolidWorks 2,686 2,406
Mechanical Engineers
Industrial Engineers
Mechanical Drafters
Electrical Engineers
Machinists
Aerotek
Allegis Group
Randstad Engineering
CyberCoders
PEAK Technical Staffing USA
SQL 37,641 8,641
Computer Software Engineers, Applications
Marketing Managers
Computer Software Engineers, Systems Software
Industrial Engineers
CyberCoders
Salesforce.com
Microsoft Corporation
Apple
Kforce Professional Staffing, Inc.
SurfCAM 95 95
Machinists
Numerical Tool and Process Control Programmers
Mechanical Engineers
First-Line Supervisors/Managers of Production and Operating Workers
Industrial Engineers
Aerotek
LSI Manufacturing Solutions
Allegis Group
Volt
PEAK Technical Staffing USA
Tool Path 18 18
Machinists
Numerical Tool and Process Control Programmers
Industrial Engineers
Computer Software Engineers, Applications
Mechanical Drafters
Apple
Namasco Corporation
Collins Professional Placement
SUPERBTECH, INC.
Volt
Unigraphics 350 271
Mechanical Engineers
Industrial Engineers
Mechanical Drafters
Computer Software Engineers, Applications
Numerical Tool and Process Control Programmers
PEAK Technical Staffing USA
The Boeing Company
Apple
Aerotek
Allegis Group
UNIX 18,280 5,614
Computer Software Engineers, Applications
Computer Software Engineers, Systems Software
Computer Hardware Engineers
Electronics EngineersAuditors
Apple
CyberCoders
Cisco Systems
Yahoo! Inc
Qualcomm
Source: The Conference Board Help Wanted OnLineTM Data Series for 120-day period ending February 2, 2012; Keywords Submitted by California Manufacturers Technological Association; *Certifications may also exist for many of these tools and software; 1 This keyword represents more than one software product or program.
Page 36
Labor Market Information Division | 7000 Franklin Blvd, Suite 1100, Sacramento, CA 95823 | www.labormarketinfo.ca.gov
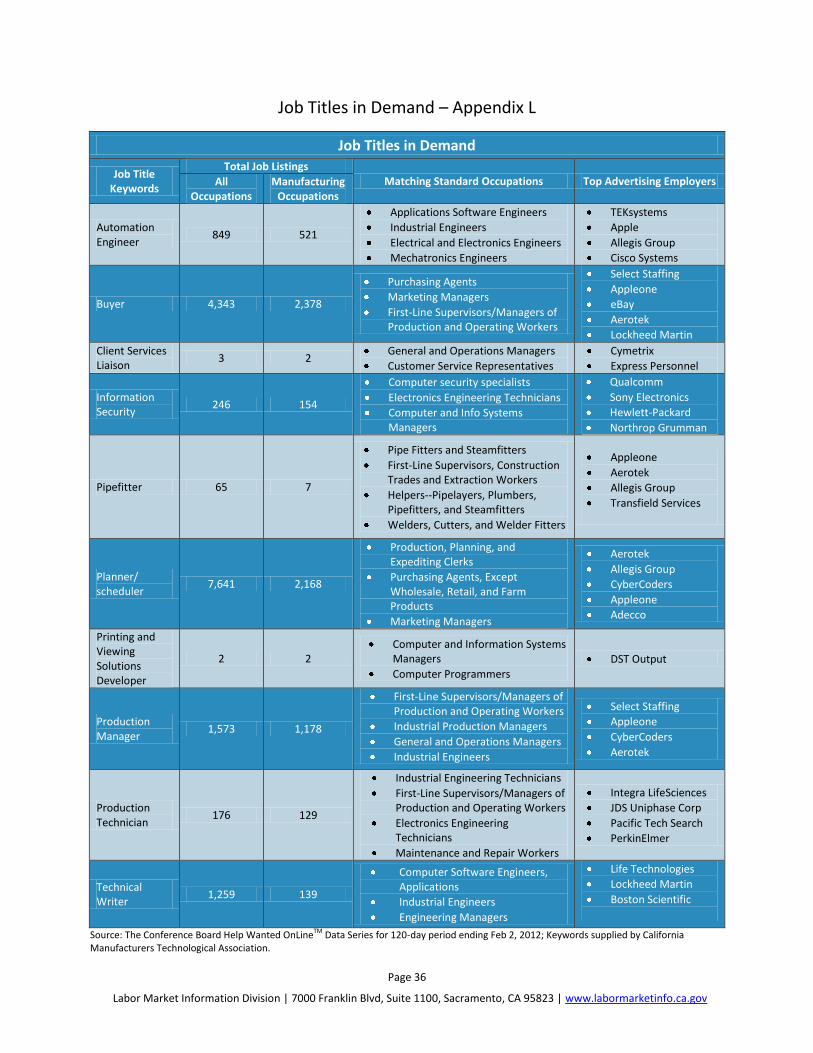
Job Titles in Demand – Appendix L
Job Titles in Demand
Job Title Keywords
Total Job Listings Matching Standard Occupations Top Advertising Employers All
Occupations Manufacturing
Occupations
Automation Engineer
849 521
Applications Software Engineers
Industrial Engineers
Electrical and Electronics Engineers
Mechatronics Engineers
TEKsystems
Apple
Allegis Group
Cisco Systems
Buyer 4,343 2,378
Purchasing Agents
Marketing Managers
First-Line Supervisors/Managers of Production and Operating Workers
Select Staffing
Appleone
eBay
Aerotek
Lockheed Martin
Client Services Liaison
3 2 General and Operations Managers
Customer Service Representatives
Cymetrix
Express Personnel
Information Security
246 154
Computer security specialists
Electronics Engineering Technicians
Computer and Info Systems Managers
Qualcomm
Sony Electronics
Hewlett-Packard
Northrop Grumman
Pipefitter 65 7
Pipe Fitters and Steamfitters
First-Line Supervisors, Construction Trades and Extraction Workers
Helpers--Pipelayers, Plumbers, Pipefitters, and Steamfitters
Welders, Cutters, and Welder Fitters
Appleone
Aerotek
Allegis Group
Transfield Services
Planner/ scheduler
7,641 2,168
Production, Planning, and Expediting Clerks
Purchasing Agents, Except Wholesale, Retail, and Farm Products
Marketing Managers
Aerotek
Allegis Group
CyberCoders
Appleone
Adecco
Printing and Viewing Solutions Developer
2 2 Computer and Information Systems
Managers
Computer Programmers
DST Output
Production Manager
1,573 1,178
First-Line Supervisors/Managers of Production and Operating Workers
Industrial Production Managers
General and Operations Managers
Industrial Engineers
Select Staffing
Appleone
CyberCoders
Aerotek
Production Technician
176 129
Industrial Engineering Technicians
First-Line Supervisors/Managers of Production and Operating Workers
Electronics Engineering Technicians
Maintenance and Repair Workers
Integra LifeSciences
JDS Uniphase Corp
Pacific Tech Search
PerkinElmer
Technical Writer
1,259 139
Computer Software Engineers, Applications
Industrial Engineers
Engineering Managers
Life Technologies
Lockheed Martin
Boston Scientific
Source: The Conference Board Help Wanted OnLineTM Data Series for 120-day period ending Feb 2, 2012; Keywords supplied by California Manufacturers Technological Association.

Page 37
Labor Market Information Division | 7000 Franklin Blvd, Suite 1100, Sacramento, CA 95823 | www.labormarketinfo.ca.gov
Certifications in Demand – Appendix M
Certifications in Demand
Certification
# Job Listings
Top Occupations Top Employers All Industries
Manufacturing
CISSP (Certified Information Systems Security Professional)
1,837 258
Computer Security Specialists
Network and Computer Systems Administrators
Computer and Information Systems Managers
Computer Systems Engineers/Architects
Auditors
Lockheed Martin
Intuit Inc.
ca technologies
Kforce Professional Staffing, Inc.
Allegis Group
AS9100 851 779
Industrial Engineers
First-Line Supervisors/Managers of Production and Operating Workers
Inspectors, Testers, Sorters, Samplers, and Weighers
Machinists
Purchasing Agents, Except Wholesale, Retail, and Farm Products
Aerotek
Precision Castparts Corp.
Lockheed Martin
C&D Zodiac
Circor
ISO9000 216 157
Industrial Engineers
Inspectors, Testers, Sorters, Samplers, and Weighers
Computer Software Engineers, Systems Software
First-Line Supervisors/Managers of Production and Operating Workers
Industrial Engineering Technicians
Volt
Aerotek
Avery Dennison
Aerotek
Philips
HYSPAN PRECISION PRODUCTS
Source: The Conference Board Help Wanted OnLineTM Data Series for 120-day period ending Feb. 2, 2012; Keywords Submitted by California Manufacturers Technological Association.