global ozone and threats to food production.€¦ · · 2015-11-27global ozone and threats to...
TRANSCRIPT

Global ozone and threats to food production.
Frank Dentener European Commission- JRC
Co-chair TF HTAP
International Conference on Atmospheric Chemistry and Agricultural Meteorology
Frank Dentener1, Gina Mills2, Lisa Emberson3, Maurits van den Berg1
1 European Commission, JRC, Italy,
[email protected] 2 Centre for Ecology and Hydrology, UK 3 Stockholm Environment Institute, University of York, UK

2
• Ozone: why, when, and what are the issues? • Interactions of ozone and plants • How is ozone changing, HTAP • What can we do about it?

Royal Society (2008)
• Current day O3 concentrations are now high in many agriculturally
important regions ....
• Monitoring, models, and satellite information
Ground level ozone pollution –where?

Ground level ozone pollution –when?
Rural location in the UK Regional / local emissions
contribute to peak ozone
concentrations
Can reach 200 ppb and over
Global emissions contribute
to global - 30 to 40 ppb
and rising in many regions
• The photochemical formation and secondary nature of O3 makes it
an important summertime and rural air pollutant…
• In tropical regions seasonality of ozone is more connected to wet-
and-dry seasons

Why do we worry about tropospheric ozone?
5
Ozone is one the most harmful air pollutants: •Ozone is damaging agricultural crops and natural vegetation •Tropospheric ozone is an important climate gas warming the atmosphere. •Levels continue to exceed air quality thresholds to protect public health •In Europe: peak ozone is going down, but mean ozone levels are not.
In ground-level air, ozone is a pollutant formed by sunlight-driven chemical reactions involving CO, VOC, NOx from vehicle exhausts, industry but also from CH4 from agriculture and other sources
NOx
CO
VOC + CH4
Ground level ozone pollution – issues.

Ozone
Apoplast
Reactive Oxygen Species (ROS)
Chain reaction (including hydroxyl radical,
superoxide)
Increased repair respiration
Anti-oxidant defence mechanisms triggered
Cell membrane damage
Overwhelmed
Reduced growth
Direct effect on chloroplasts
Resources diverted away from growth and seed production
Cell death
Reduced functional leaf area
Reduced yield
Decrease photo- synthesis
Bottomline: Even if you don’t see it, O3 can affect crop growth
Courtesy: Gina Mills
Mechanism of O3 damage

O3
O3
Key concerns of ozone for agriculture
I. Leaf damage by ozone
II. Growth reductions
III. Yield quantity and quality reductions
IV. Fertilizer efficiency reduced
V. Drought tolerance reduced
VI. Forage quality
VII. Pests & Diseases
VIII. Interactions with climate change

Key concerns for agriculture I. Leaf damage by ozone
Wheat, Europe
Spinach, Europe
Source: J. Bender
Source: G. Mills Incidences of O3 injury in
the field, 1990 – 2006
Especially relevant for horticulture
e.g. salad leaf crops
(Mills et al., 2011,
Global Change Biology)

Key concerns for agriculture II. Growth reductions
Wheat Rice
Plants grown in ambient air with high levels of O3 pollution
Plants grown in filtered air (pollutant free), Lahore, Pakistan

Key concerns for agriculture III. Yield quantity and quality
reductions
r² = 0.59
0.0
0.2
0.4
0.6
0.8
1.0
1.2
0 20 40 60 80 100 120 140
Rel
ativ
e yi
eld
Ozone, 7h mean, ppb
Wheat
7 hour mean O3 concentration
(ppb)
--- 5 % loss.
Rela
tive y
ield
0 10 20 30 40 50
Soybean
Wheat
Rice
Peas and beans
Maize
Oilseed Rape
Alfalfa
Tomato
Potato
Sugar beet
Barley
Lettuce
Threshold ozone conc (ppb)Threshold 7 hour mean O3
concentration (ppb)
Mil
ls &
Harm
ens,
2011,
ICP V
egeta
tion
Food S
ecuri
ty R
eport
,
htt
p:/
/icpvegeta
tion.c
eh.a
c.u
k/
Threshold for significant yield effects
Ozone exposure experiments in
Sweden

Varanasi, India
Winter wheat (Nov to April) RY = 90-
75%
Rice RY = 86-84%
Indian mustard RY = 92–86%
Palak RY = 78 %
Soybean (?) RY = 89%
Allahabad, India
Mung bean (Dec to March) RY = 70%
Lahore, Pakistan
Winter wheat (Nov to May) RY = 69-53%
Spring wheat (Nov to April) RY = 82 to 52 %
Rice (May to Nov) RY = 71 to 53%
Mung bean RY = 50%
Soybean (Aug to Oct / Feb to May) RY = 68 to 26 %
Yangtze River Delta, China
Rice (July to Oct) RY = 92%
Tokyo, Japan
Rice (April to Sept) RY = 80%
Klang Valley, Malaysia
Rice (Oct to Jan) RY = 97 to 94%
Thailand
Rice (?) RY = 94 to 70%
Crop yield commonly improved by around 5-30% by filtration of
air pollution from plant micro-climate
ICP Vegetation reports
(2011, 2014)
Observations of ozone damage in Asia

• The fraction of N (P & K) added that ends up in grain is negatively
affected by ozone – leading to additional environmental problems
• Adding more N fertilizer is not a good solution to the ozone problem,
as it comes with additional environmental problems
Pleijel, Feng et al., pers. Comm.
Key concerns for agriculture IV. Fertilizer efficiency
reduced

Leontodon hispidus
r2 = 0.43, p = 0.109
Dactylis glomerata
r2 = 0.66, p = 0.042
0
50
100
150
200
250
300
350
400
450
0 20 40 60 80 100 120
Seasonal mean O3 conc. (24h, ppb)
Sto
ma
tal
co
nd
uc
tan
ce
(m
mo
l m
-2 s
-1)
Stomatal conductance
Key concerns for agriculture V. Drought tolerance reduced
• Ozone reduces drought tolerance in
agricultural species by interfering with
hormonal control.
• Increase in stomatal conductance
1Mills et al., 2009; 2, 3 Wilkinson and Davies (2009, 2010)
R2 = 0.31,
p = 0.15
R2 = 0.75,
p = 0.005
0
25
50
75
100
125
150
0 20 40 60 80
AFst0 (mmol m-2)
Bio
mass (
% o
f 34 p
pb
tre
atm
en
t)
Shoot
Root
Biomass Allocation
• Also a affects C allocation - decrease in
root biomass further limiting access to soil
water

Concentration-response relationships to perform risk
assessments to estimate yield losses...
Van Dingenen et al, 2009
• Year 2000 global economic losses estimated to cost $14-26 billion
• For economies largely based on agriculture , O3 induced damage is
estimated to offset a significant portion (20 – 80%) of the year 2000 GDP
growth rate.
• Community is moving away from AOT40 or similar to flux based approaches.

Tang et al (2013)
How will ozone affect wheat yield across Asia?
• Based on modelled ozone uptake (POD12), ozone pollution is predicted
to reduce wheat yield by 10.3% in China and 9.7% in India in 2000
• Losses predicted to increase by a further 8.9 and 6.4% respectively in
2020
2000 2020
Tang et al., 2013
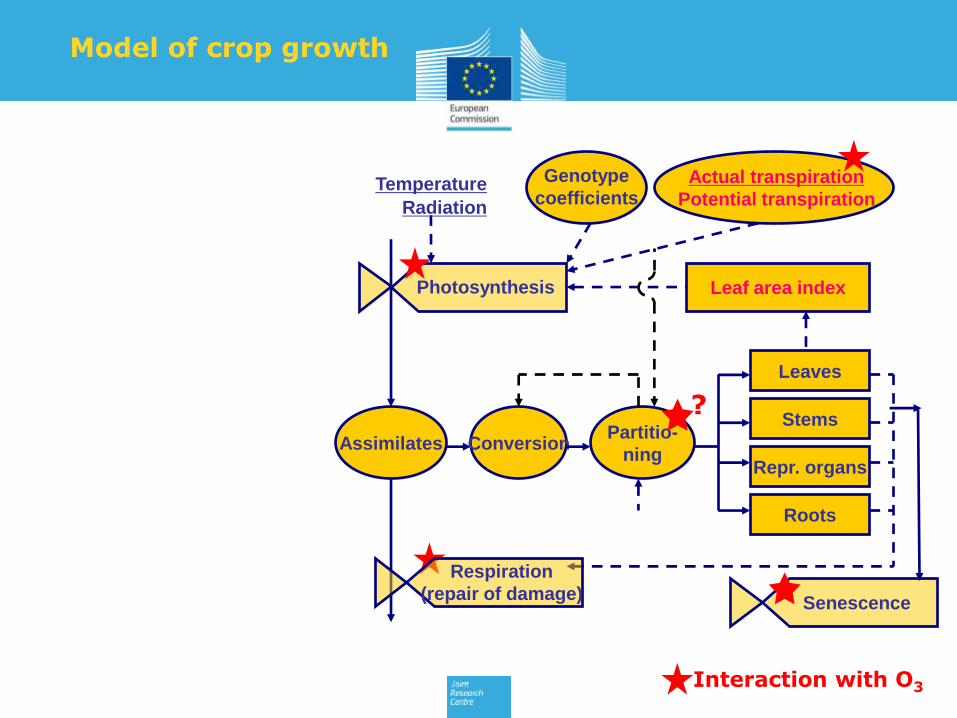
Photosynthesis
Senescence
Leaf area index
Genotype
coefficients Temperature
Radiation
Assimilates Conversion Partitio-
ning
Leaves
Stems
Repr. organs
Roots
Actual transpiration
Potential transpiration
Respiration
(repair of damage)
?
Model of crop growth
Interaction with O3
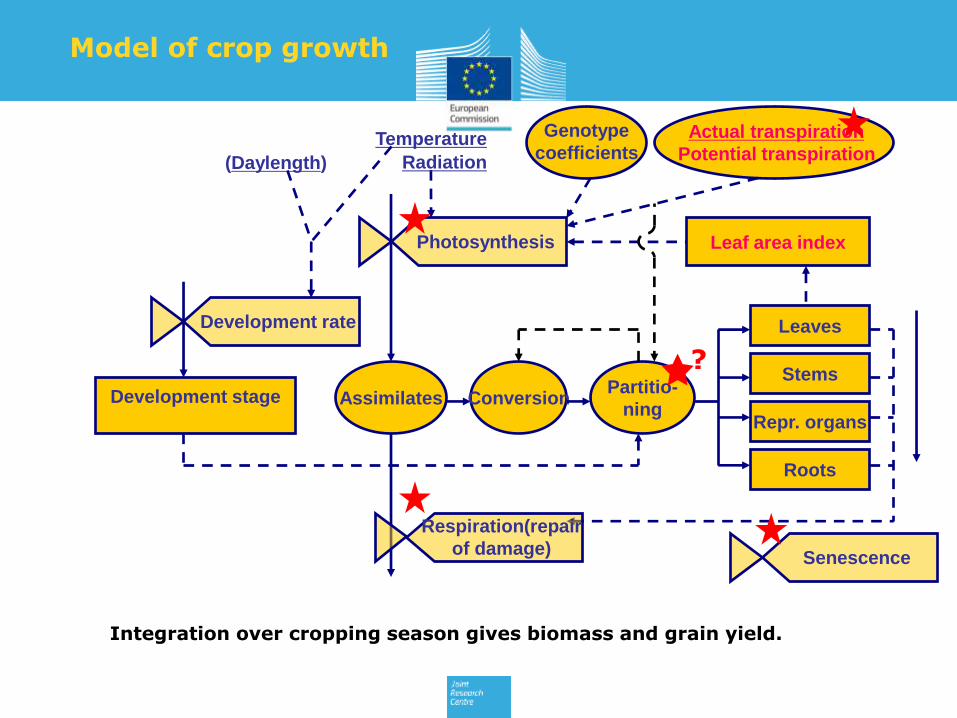
Photosynthesis
Senescence
Leaf area index
Genotype
coefficients Temperature
Radiation
Assimilates Conversion Partitio-
ning
Leaves
Stems
Repr. organs
Roots
Development rate
Development stage
(Daylength)
Actual transpiration
Potential transpiration
Respiration(repair
of damage)
?
Model of crop growth
Integration over cropping season gives biomass and grain yield.

18
Agro-met and management
Factors
• Temperature
• Precipitation
• Radiation
• CO2,
Climate
• Irrigation
• Fertilization
• Varieties
• Sowing date
• Pests, diseases
Management
Soil
• H2O
• C, N, P, K
Usual concerns of agronomist: •Frost kill (hardening/vernalisation) •Is there enough water during flowering
Potential/water limited yield •Fertilizer/nutrient limitation •Avoiding heat stress •Harvest conditions
How does ozone play into this? •Is ozone hidden in the calibration/parameterisation? •Ozone trends?
Winter wheat development stages

Ewert and
Porter, 2000
Integrated effects on target variables
Modelling ozone effects
Comparison with
observations
Climate chamber, cv. Wembley OTC, cv. Minaret
• Open-top and climate chamber experiments • Biomass for O3 and CO2 experiments well predicted • Overall significance not well known

• Ozone pollution is a ‘hidden threat’ to world’s food production
causing 5 to 30% yield losses in ‘hot-spot’ regions. Many food
crops are ozone sensitive including rice, wheat and pulses
• Ozone affects Nitrogen use efficiency, drought tolerance,
resistance to pests & diseases, forage quality
• First attempts to include ozone in crop growth models look
promising. Not too many parameters- well tested for wheat.
• Lots of open questions: other crops, role of varieties
(genotype), interactions with meteorology (heat stress,
drought)
• Links between agronomic and atmospheric impact communities
needs to be strengthened. (AgMIP, ISIMIP, HTAP, ICP Veg)
• Adaptation (agricultural management) e.g. crop breeding for
varieties that are not sensitive to ozone, seasonal forecasting of
ozone episodes
• Large scale significance? Does ozone play a role in the yield
gap?
mid summary

What is HTAP?
21
www.htap.org
Task Force on Hemispheric Transport of Air Pollution
Established in 2004 by the UNECE Convention on Long-Range Transport Air Pollution An expert group of scientists across the world studying hemispheric transport of air pollution
Examine transport of air pollution across the Northern Hemisphere
Assess potential emission mitigation options available inside and outside the UNECE region
Assess their impacts on regional and global air quality, public health, ecosystems, near-term climate change
Collaboration and outreach

Remote measurements of ozone in Europe, East Asia and Rest of the world
Cooper et al., 2014
Ozone trends
Ozone increases in Europe prior to 1990
Large increases in Asia and western America
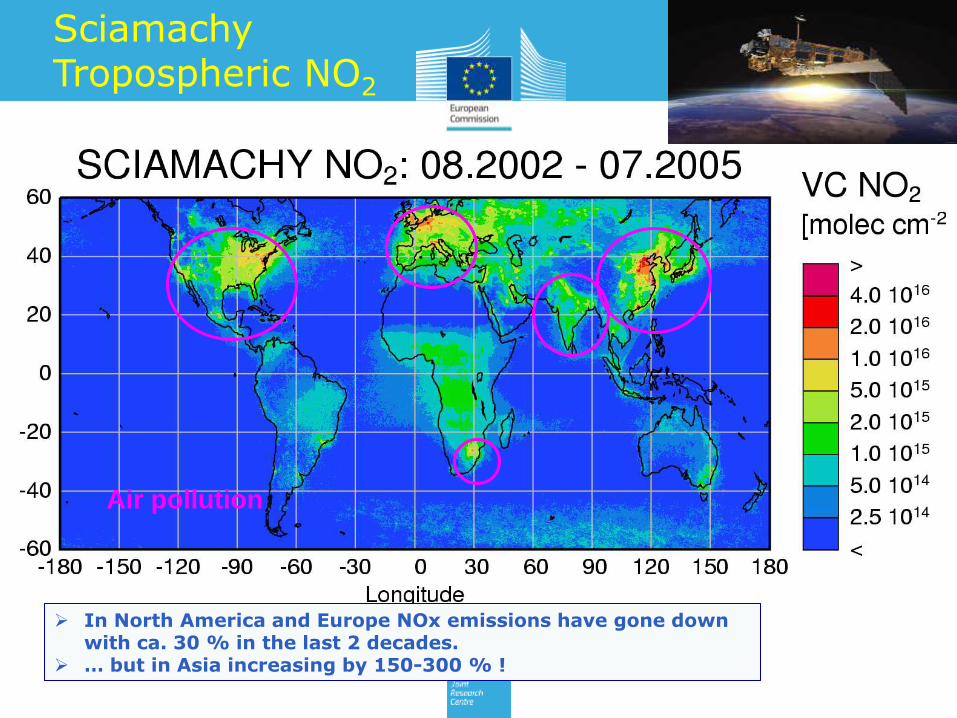
Air pollution
In North America and Europe NOx emissions have gone down with ca. 30 % in the last 2 decades.
… but in Asia increasing by 150-300 % !
Sciamachy Tropospheric NO2

24
Lower troposphere
Mid-upper troposphere
Pathways of transport hemispheric air pollution
Stohl et al, 2004 5
North America, Europe, South Asia and East Asia cover ca. 60-70 % of human-related emissions
Within one month the atmosphere in the Northern Hemisphere is mixed.
Ozone produced in Asia is transported to North America, from North America to Europe etc.
NA EU
EA SA
A special case is methane which stays about 10 years in the atmosphere, and is both a greenhouse gas and an air pollutant.
Hemispheric transport

Total O3
change
Within EU
Outside of EU
Methane
HTAP attribution of O3 changes in Europe
NA EU
EA SA
Wild et al, ACP, 2012
25
Annual average - large region –global models
Largest O3 (6 ppb) decreases before 1980;
small reductions in O3 during 1980-2000
O3 reductions attributable to EU emissions
compensated by increasing emissions
elsewhere
Important contribution from CH4 30-50 %
Taken together changes in O3 from outside
Europe and CH4 are larger than within EU (60-
70 % of total)
External O3 becomes more important when
‘local’ sources are more regulated.
Hemispheric transport more important at
‘lower’ concentrations

26
Observations from a global network of CH4 indicate continuous increases over the last two centuries
Small interruption but increasing again
Methane observations

http://edgar.jrc.ec.europa.eu Agricultural regions in North and South America, Europe, South Asia, China
Fossil fuel production regions
http://edgar.jrc.ec.europa.eu
Methane anthropogenic emissions

28
There are many sources of methane: agriculture (rice production, manure, cattle) contributes ca. 40 % of the man-made emissions
About half of the methane emissions comes from natural sources (not in figure), which may increase due to climate change.
Methane emission trends
Fuel use and
production
Waste
Agriculture

No Further Control (NFC)
Current Legislation (CLE)
Maximum Feasible Reduction (MFR)
2010 2050
NFC: What are the benefits of implementing current policies in terms of health, ecosystems, and climate impacts?
MFR: What technology and policy options will be available (at a reasonable cost) to further mitigate pollution problems in the future?
CLE: Given current policies,
what are emissions likely to be in the future?
Policy Relevant Questions
Future: HTAP benchmark emission scenarios
GAINS
30
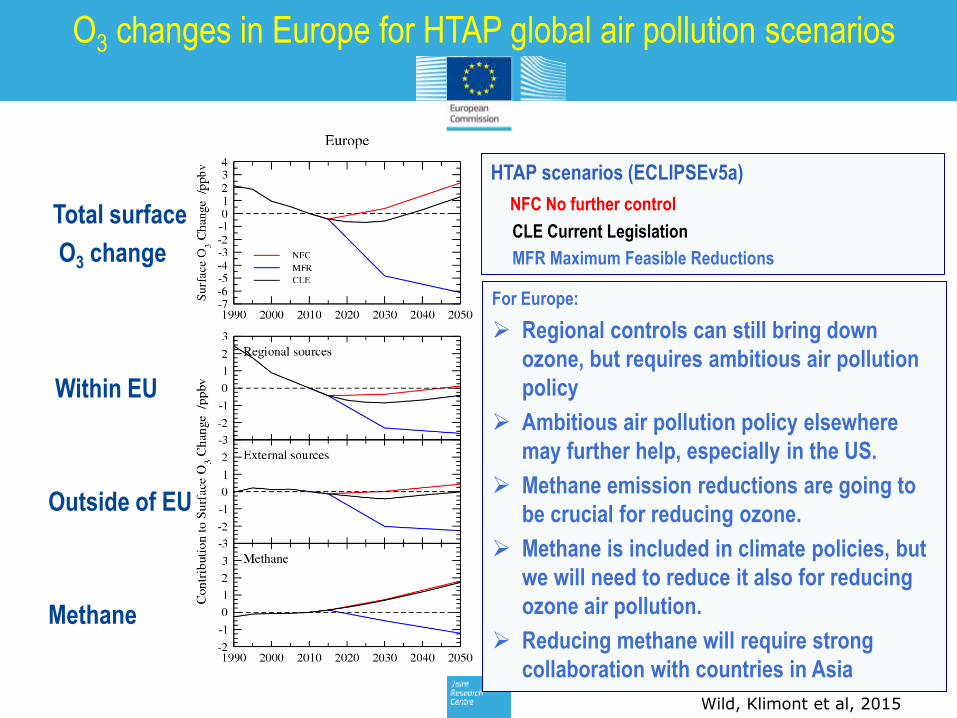
O3 changes in Europe for HTAP global air pollution scenarios
Wild, Klimont et al, 2015
Total surface
O3 change
Within EU
Outside of EU
Methane
HTAP scenarios (ECLIPSEv5a)
NFC No further control
CLE Current Legislation
MFR Maximum Feasible Reductions
For Europe:
Regional controls can still bring down
ozone, but requires ambitious air pollution
policy
Ambitious air pollution policy elsewhere
may further help, especially in the US.
Methane emission reductions are going to
be crucial for reducing ozone.
Methane is included in climate policies, but
we will need to reduce it also for reducing
ozone air pollution.
Reducing methane will require strong
collaboration with countries in Asia

31
In Europe and North America peak ozone is declining. Ozone concentrations
look likely to continue to increase in Asia over the coming decade
The contribution of hemispheric O3 to local pollution is increasing.
International efforts to reduce tropospheric ozone, will facilitate achievement of local air quality objectives.
UNECE’s TF HTAP and ICP vegetation brings scientists together to inform policy on the role of hemispheric air pollution, their impacts, and mitigation options. A portfolio of mitigation options is emerging- it is clear that emission reduction of CH4 (producing O3) is going to be very important- with important benefits from (and for) climate policies.
Reducing ozone will have large benefits for agriculture, and agriculture is also key to reducing methane and other air pollution emissions.
Global institutions (WMO, UNEP, FAO, UNECE, CCAC … ) can help with raising awareness regarding options and benefit of reducing emissions, informing and facilitating international agreements.
Take home messages
32
20 years of in support to the implementation and
monitoring of Common Agricultural Policy
Thank you for your attention!

33
For Discussion session

34
• Little awareness of agriculture as a source of and being affected by air pollution
• Increasing contribution to AP from agriculture, but not much happening despite cost-effective measures in particular for NH3
• Methane is partly from agriculture, GHG
and O3 precursor. O3 damages agriculture.
• Reducing methane is win-win.
• What to do? Continuing outreach and research Early warning systems;
demonstration Smart technologies to measure AP Inclusion of air pollution in
environmental labelling Rewarding innovation
https://ec.europa.eu/jrc/en/event/conference/sustainable-food-production-and-air-
pollution
Discussion rather Europe focussed
‘Sustainable Agriculture and Air Pollution’
10 July 2015; EXPO, Milan, Italy
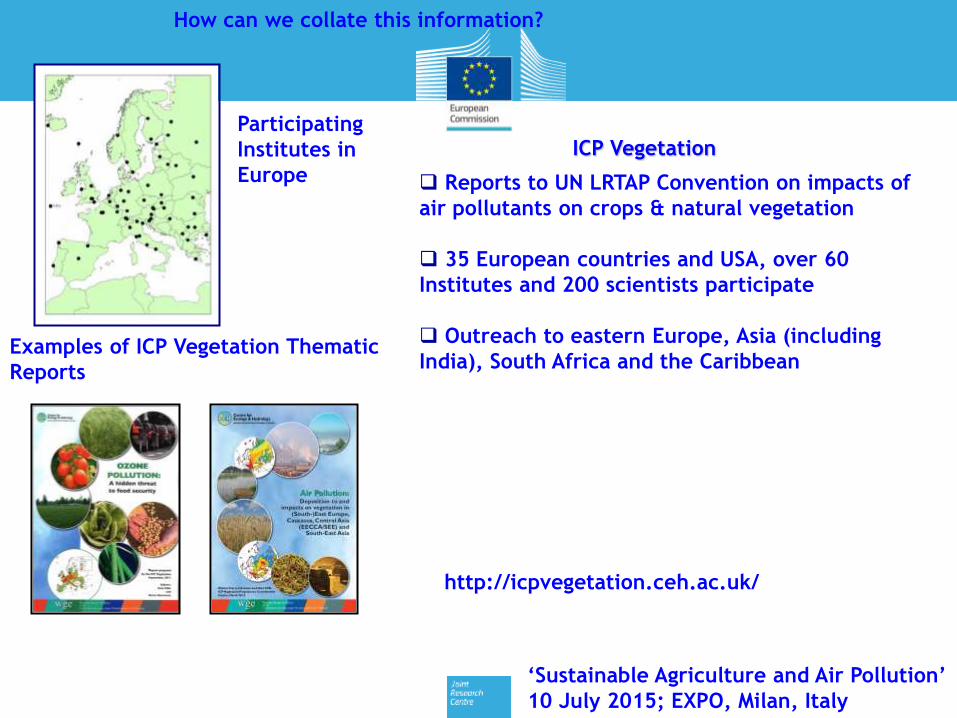
Reports to UN LRTAP Convention on impacts of
air pollutants on crops & natural vegetation
35 European countries and USA, over 60
Institutes and 200 scientists participate
Outreach to eastern Europe, Asia (including
India), South Africa and the Caribbean
ICP Vegetation Participating
Institutes in
Europe
How can we collate this information?
http://icpvegetation.ceh.ac.uk/
Examples of ICP Vegetation Thematic
Reports

What is HTAP?
36
www.htap.org
Task Force on Hemispheric Transport of Air Pollution
Established in 2004 by the UNECE Convention on Long-Range Transport Air Pollution An expert group of scientists across the world studying hemispheric transport of air pollution
Examine transport of air pollution across the Northern Hemisphere
Assess potential emission mitigation options available inside and outside the UNECE region
Assess their impacts on regional and global air quality, public health, ecosystems, near-term climate change
Collaboration and outreach
‘Sustainable Agriculture and Air Pollution’
10 July 2015; EXPO, Milan, Italy
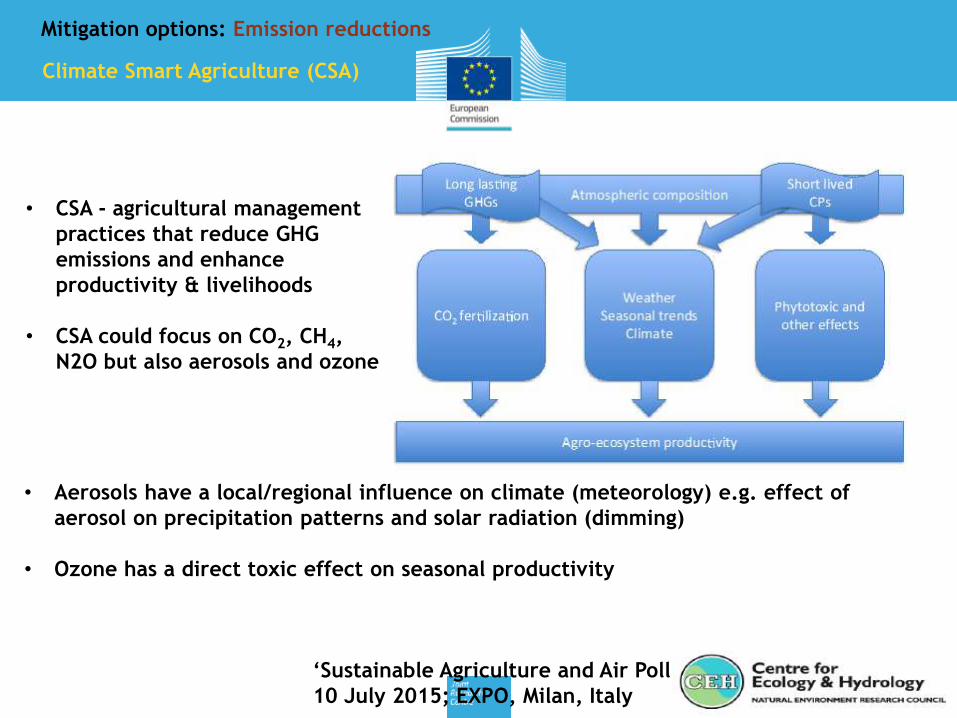
Climate Smart Agriculture (CSA)
• CSA - agricultural management
practices that reduce GHG
emissions and enhance
productivity & livelihoods
• CSA could focus on CO2, CH4,
N2O but also aerosols and ozone
• Aerosols have a local/regional influence on climate (meteorology) e.g. effect of
aerosol on precipitation patterns and solar radiation (dimming)
• Ozone has a direct toxic effect on seasonal productivity
Mitigation options: Emission reductions

‘Plants and the changing Environment’
9-12 June 2014; Monterey, California, US
Similar results found that modern wheat cultivars are more ozone-sensitive
(Barnes et al., 1990; Biswas et al., 2008; Pleijel et al., 2006; Velissariou et al.,
1992).
Adaptation options: Raised awareness in crop
breeding
Selection of higher yielding varieties tend to have higher gas exchange
and hence greater ozone uptake
Osbourne et al. (in prep) Slo
pe o
f re
sponse
functi
on
Year of release

‘Plants and the changing Environment’
9-12 June 2014; Monterey, California, US
Adaptation options: Early warning systems
Early warning system of ozone episodes in place in
Cuba since 1992:
• Farmers get 5 day warning of high
ozone
• Watering withheld
• Damage to garlic reduced from 73% to
2%
Source: Jésus Ramirez

Five key threats
The WAGES of too much nitrogen Water quality Air quality Greenhouse balance Ecosystems Soil quality
European Nitrogen Assessment, 2011
Plus better food & energy supply

Joining up nitrogen: addressing the barriers-to-change
The car and the exhaust pipe…
Splash Plate Spreader
- 1950s technology
Trailing Shoe Slot Injector
Trailing Hose


“20:20 for 2020” 20% better NUE: saving 20 Mt N per yr by 2020
Benefits expressed here as N saving / ha per year (Full-chain NUE)
N saving as kg N per ha per yr
Bottom line for the Green Nutrient Economy ($billion/year)
Net Benefit 170= Fert Saving 23 + Env+Health 160 – Implementation 12

44
https://ec.europa.eu/jrc/en/event/conference/s
ustainable-food-production-and-air-pollution