glaucoma progression: what’s new in optic nerve imaging ...snewinopticnervei… · 1 what’s new...
TRANSCRIPT

1
What’s New in Optic Nerve What’s New in Optic Nerve ImagingImaging
H. George Tanaka, MD
Glaucoma Progression:Glaucoma Progression:Structure vs. FunctionStructure vs. Function
normal
pathological
time
optic nerve
visual field
pre-perimetric
“glaucoma suspect”
perimetric
“glaucoma”
ocular hypertension
normal
abnormal
borderline
time
normal
abnormal
optic nerve
A
Make Definitive Diagnosis at AMake Definitive Diagnosis at A
“Doctor, do I have glaucoma?”
time
B
ORORDocument Progression at BDocument Progression at B
normal
abnormal
optic nerve
A
Make Definitive Diagnosis at AMake Definitive Diagnosis at A
CHANGE = A - B
“Doctor, am I getting worse?”

2
What’s OLD in Optic nerve imagingWhat’s OLD in Optic nerve imaging
Scanning Laser Tomography (HRT)Scanning Laser Tomography (HRT)(Heidelberg Engineering, Heidelberg, Germany)(Heidelberg Engineering, Heidelberg, Germany)
Scanning Laser Scanning Laser PolarimetryPolarimetry ((GDxGDx®))((Carl Carl ZeissZeiss MeditecMeditec , Jena, Germany, Jena, Germany ))
TimeTime --DomainDomainOptical Coherence Tomography (OCT)Optical Coherence Tomography (OCT)((Carl Carl ZeissZeiss MeditecMeditec , Jena, Germany, Jena, Germany ))
Cross sectional imaging
Optical Coherence Tomography
Source
Reference Mirror
BeamSplitter
Detector
Sample
Time Domain OCT (OCT3)
Axial (Z)Scanning
Lateral (X-Y)Scanning
OCT Signal
Optic Nerve Head Analysis
Topography (interpolated)
3
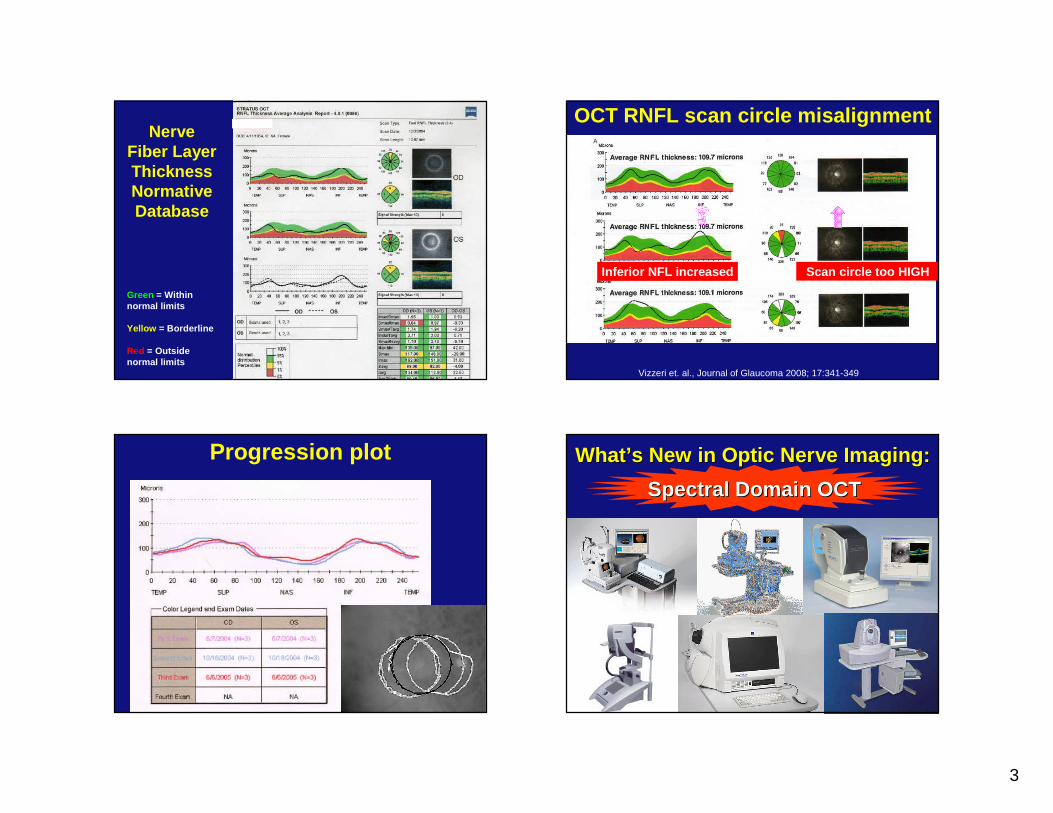
Green = Within normal limits
Yellow = Borderline
Red = Outside normal limits
Nerve Fiber LayerThickness Normative Database
OCT RNFL scan circle misalignment
Inferior NFL increased Scan circle too HIGH
Vizzeri et. al., Journal of Glaucoma 2008; 17:341-349
Progression plot WhatWhat ’’s New in Optic Nerve Imaging:s New in Optic Nerve Imaging:
Spectral Domain OCTSpectral Domain OCT

4
time
ampl
itude
Time DomainTime DomainSignal amplitude varies with timeSignal amplitude varies with time
time
ampl
itude
Time Time DomainDomain
frequency
ampl
itude
Frequency A = 1/t
A
Frequency Frequency DomainDomain
t
time
ampl
itude
frequency
ampl
itude
Frequency A
A
Frequency B
B
Time Time DomainDomain
Frequency Frequency DomainDomain
time
ampl
itude
frequency
ampl
itude
AB CD
Frequency AFrequency BFrequency CFrequency D
Time Time DomainDomain
Frequency Frequency DomainDomain

5
time
ampl
itude
frequencyAB CD
Time Time DomainDomain
Frequency Frequency DomainDomain
FourierFourierTransformTransform
Source
Reference Mirror
BeamSplitter Sample
(Fourier transform)
Spectrometer
Spectral Domain OCT
OCT Signal
Spectral Domain OCT Advantages of Spectral Domain OCTAdvantages of Spectral Domain OCT
• More scans in less time– 20,000 to 40,000 A-scans per second
• Better resolution– 5 micron
• Less motion artifact – Blinking, saccades, fixation losses
• 3D scans = cube of data

6
Comparison of ModelsModel Scanning speed
(A scans/sec)Axial Resolution
3-DBscan
Fundusimaging, misc
Cirrus 27,000 5 microns Yes SLO
Optovue 26,000 5 microns Yes Near IRnon-mydAS OCT
Spectralis 40,000 7 microns Yes SLO,FA, ICG, autofluo, IR
Stratus OCT3
400 10 microns No No
Stratus OCT
Cirrus HD -OCT
OCT 2
Glaucomatous damage occurs at 3 levels in the posterior segment
Ganglion cells
(Cell body)
Highest concentration
in the macula
Retinal nerve fiber layer (Axon)
Optic nerve head(Axon + connective
tissue)
Ganglion cell complex (GCC) scan Nerve fiber layer + Ganglion Cell layer + inner plexiform layer
RTVue
SD OCT allows us to scan the macula for glaucoma

7
Cirrus™ HD-OCTCarl-Zeiss Meditec (Dublin, CA)
www.meditec.zeiss.com
• Scan type – Optic disc cube 200 x 200 scan
– 200 line scans each consisting of 200 A scans each
– Covers 6 mm2 area
RNFL analysis with SDOCT
• TSNIT graph based on circle scan 3.45 in diameter centered on optic disc – Unlike TDOCT, centration of
TSNIT circle can be performed post-scan acquisition with SDOCT
• RNFL maps with comparison to normative database
CirrusNormal ODEarly glaucoma OS
CirrusNormal ODEarly glaucoma OS

8
CirrusAdvanced glaucoma OS
StratusAdvanced glaucoma OS
Optovue RTVue™(Fremont, CA)
www.optovue.com
• Scan types– 3D Disk (covers 4mm2 area)– ONH (Grid pattern with circular
and radial scans)
– GCC (Ganglion cell complex scan, covers 7mm2 area
Glaucoma suspectDisc and cups areasymmetricalNormal NFL and GCC
OD shows superiorNFL loss
OS normal

9
OD and OS bothShow severe NFLloss
High myopeWith tilted discsUnable to analyzeoptic disc OD but GCC normal
SpectralisHeidelberg Engineering (Heidelberg, Germany)
www.heidelbergengineering.com
• Unique features– Eye tracking technology– Image noise reduction– Can add capability for FA, ICGA, red
free & infrared imaging, autofluorescence
Stratus 3 Spectralis

10
RNFL Circle Scan / RNFL Progression Normal Images and Thickness Map
RNFL fibers canbe seen following the blood vessel arcades on the infrared image.
The OCT scan shows a normal
distribution of RNFL thickness around
the ONH
Posterior Pole thickness map shows thicker areas (white and
red) along the blood vessel arcades and around the macula.
(The ganglion cell complex (GCC) is
typically thicker around the macula.)
Case 1 – Loss visible on multiple tests
Fundus photo has a clearly defined wedge of RNFL loss
Both the RNFL - OCT and the visual field confirm this RNFL loss superior to the ONH
Retinal thickness map correlates with other tests showing a wedge shaped thickness loss
Case 2 – Thinning beyond circle scan
The wedge defect is not very wide at the circle scan location and is not easily seen in the RNFL – OCT thickness graph
The infrared image shows a darker wedge defect in the inferior temporal area
The posterior pole thickness map shows asymmetrical thinning in this inferior temporal area

11
Case 3 – Thickness Map Confirmation
The RNFL - OCT shows thinning in the inferior temporal area on the thickness graph but the defect is not significant enough to trigger the sector classification
The posterior pole thickness map shows a clearly defined area of thinning in this inferior temporal area and thinning around the macula is not picked up by the other tests.
The infrared image shows a hint of discoloration, but does not clearly indicate thinning.
New Reports – RNFL & Post. Pole
New reports – Asymmetry OU
Yes
Yes
Yes
Normative database
YesNoNoYesSpectralis
YesYesYesYesOptovue
YesNoNoYesCirrus
ProgressionOptic disc
Macular Inner Retinal Layer
RNFL(TSNIT/Map)
Glaucoma analysis

12
Conclusions•• HighHigh --tech imaging enhances tech imaging enhances but does not replacebut does not replace
good clinical skills in diagnosing glaucomagood clinical skills in diagnosing glaucoma•• Potentially useful in following optic nerve Potentially useful in following optic nerve
progression in early glaucomaprogression in early glaucoma•• AIGS (Advanced Imaging in Glaucoma Study)AIGS (Advanced Imaging in Glaucoma Study)
•• HRT2, HRT2, GDxGDx, OCT3, , OCT3, OptovueOptovue•• www.AIGStudy.netwww.AIGStudy.net
Conclusions
• Do not base treatment decisions on a single imaging study
• Interpret imaging data in a clinical context
• Reliable criteria for progression are lacking
• Prospective validation is needed
Technology progresses faster than most optic nerves.
Has Optic Nerve Imaging Made Has Optic Nerve Imaging Made Stereo Disc Photography Stereo Disc Photography
Obsolete?Obsolete?
Not yet.