getting to know the latin america and caribbean market by joyce williams, esq. (c) sillac 2014...
TRANSCRIPT
Getting to Know the Latin America and Caribbean
MarketBy Joyce Williams, Esq.
(c) SILLAC 2014
SILLAC
SPECIALISTS IN INTERNATIONAL LAW ON LATIN AMERICA AND THE CARIBBEAN, S.C.www.sillac.com

PRESENTATION ROAD MAP
1. Overview of presentation
Latin America and the Caribbean have quickly evolved into a strategic Investment destination for diverse opportunities. The coming together of
several macroeconomic trends, youthful population and rising middle class in the region has all contributed to the boosting of investment and
business in the region.
In 2013, the World Bank predicted a growth rate of at least 2.9% in 2014 and expected growth in the region to continue through 2015 and 2016at 3.2
and 3.7 respectively. 2. Focus of presentation will be on the
• Major five markets in Latin America • Caribbean as a destination for investment: accessing regulatory reforms
under CARICOM
3. Conclusion
(c) SILLAC 2014

BRAZIL
(c) SILLAC 2014
KEY FACTS
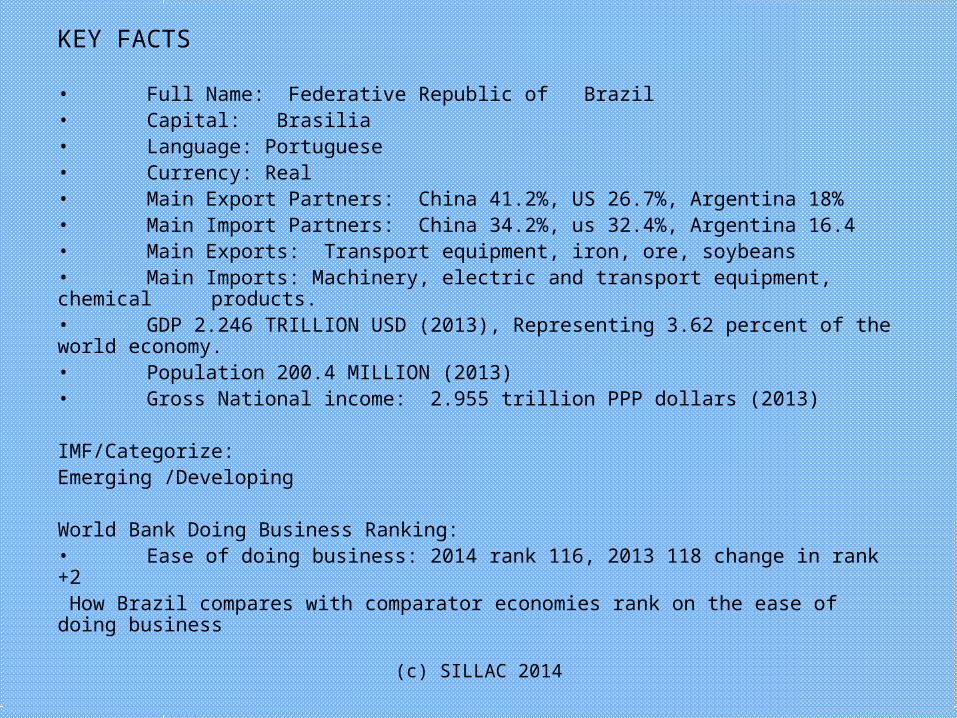
• Full Name: Federative Republic of Brazil• Capital: Brasilia • Language: Portuguese• Currency: Real • Main Export Partners: China 41.2%, US 26.7%, Argentina 18% • Main Import Partners: China 34.2%, us 32.4%, Argentina 16.4 • Main Exports: Transport equipment, iron, ore, soybeans• Main Imports: Machinery, electric and transport equipment, chemical products. • GDP 2.246 TRILLION USD (2013), Representing 3.62 percent of the world economy.• Population 200.4 MILLION (2013)• Gross National income: 2.955 trillion PPP dollars (2013)
IMF/Categorize: Emerging /Developing
World Bank Doing Business Ranking:• Ease of doing business: 2014 rank 116, 2013 118 change in rank +2 How Brazil compares with comparator economies rank on the ease of doing business
(c) SILLAC 2014
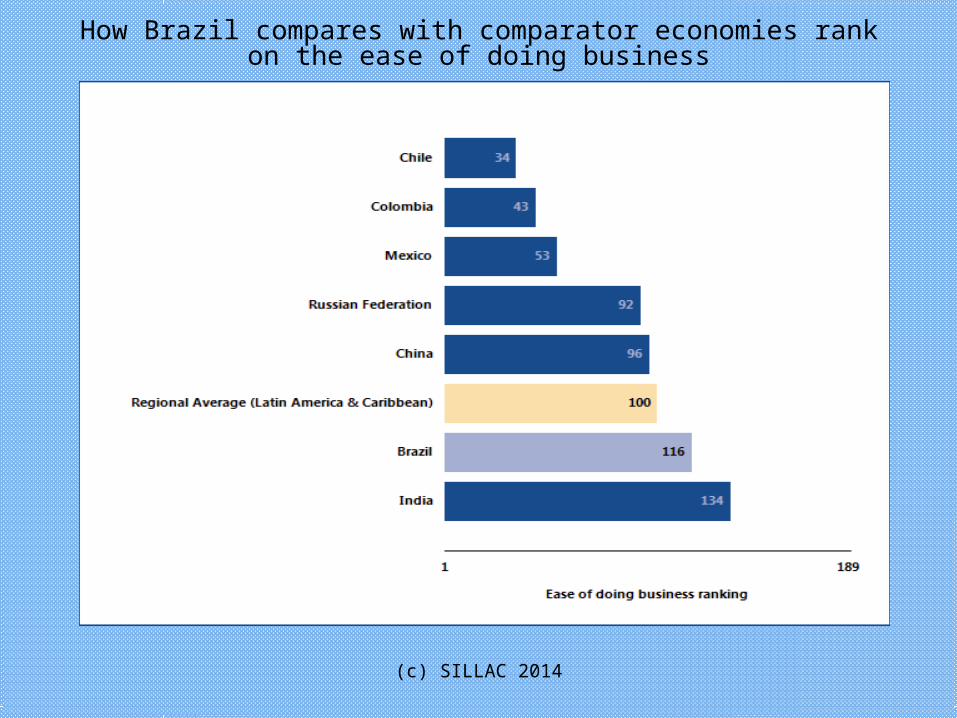
How Brazil compares with comparator economies rank on the ease of doing business
(c) SILLAC 2014
(c) SILLAC 2014
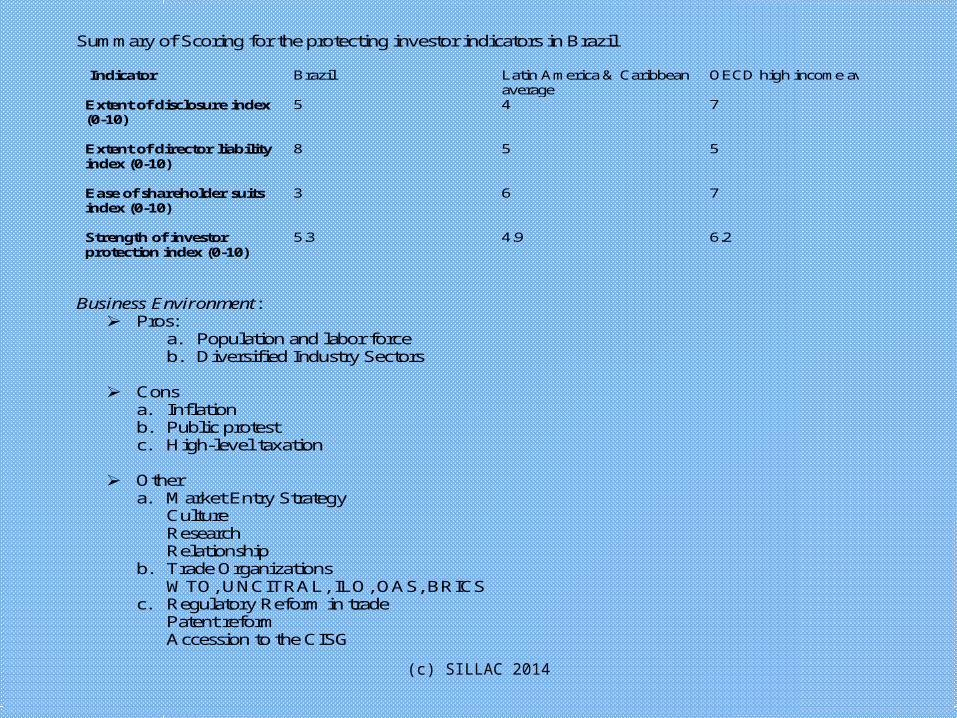
Summary of Scoring for the protecting investor indicators in Brazil
Indicator Brazil Latin America & Caribbean average
OECD high income average
Extent of disclosure index (0-10)
5 4 7
Extent of director liability index (0-10)
8 5 5
Ease of shareholder suits index (0-10)
3 6 7
Strength of investor protection index (0-10)
5.3 4.9 6.2
Business Environment:
Pros: a. Population and labor force b. Diversified Industry Sectors
Cons
a. Inflation b. Public protest c. High-level taxation
Other
a. Market Entry Strategy Culture Research Relationship
b. Trade Organizations WTO, UNCITRAL, ILO, OAS, BRICS
c. Regulatory Reform in trade Patent reform Accession to the CISG
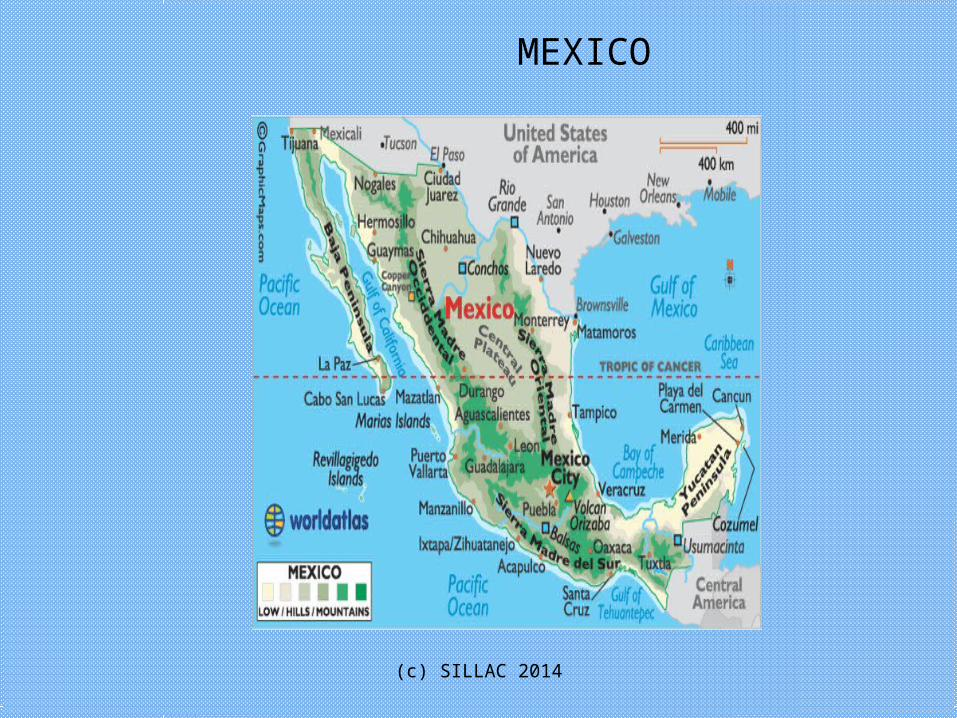
MEXICO
(c) SILLAC 2014

KEY FACTS FULL NAME: United Mexican StateCapital: Mexico City Language: Spanish Currency: Mexico Peso Main Export Partner: United States 78.0%Main Import Partners: United States 50%, China 15 %, and Japan%Main Exports: Manufactured goods, oil and oil products, silverMain Imports: Metalworking machine, steel mill products, agricultural machinery GDP: 1.261 TRILLION USD representing 2.03 percent of the world economyPopulation: 122.3 MILLIONGross National Income: 1.971 Trillion PPP Dollars (2013)
IMF/CategorizationEmerging Market
World Bank Doing Business RankingEase of Doing Business: 2014 rank 53, 2013 51, change in rank-2
(c) SILLAC 2014
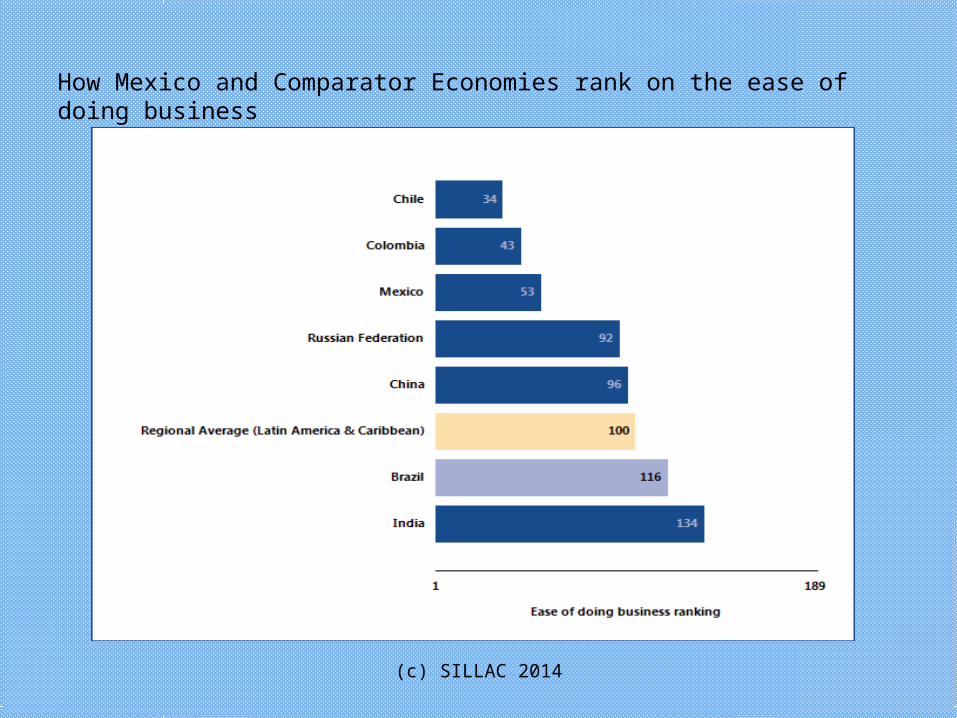
How Mexico and Comparator Economies rank on the ease of doing business
(c) SILLAC 2014
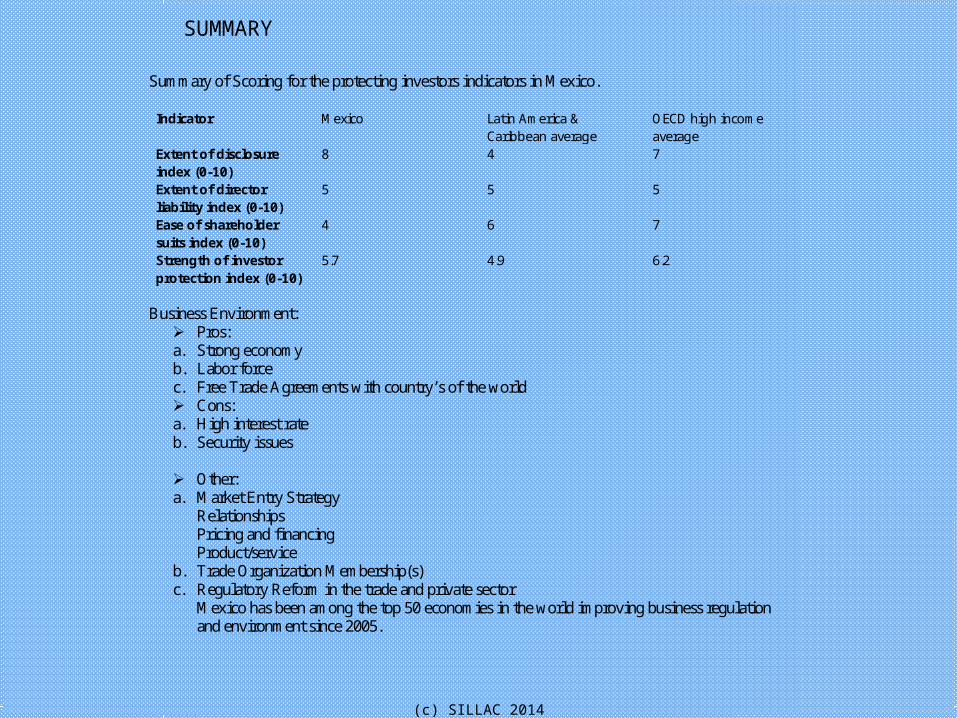
Summary of Scoring for the protecting investors indicators in Mexico. Indicator Mexico Latin America &
Caribbean average OECD high income average
Extent of disclosure index (0-10)
8 4 7
Extent of director liability index (0-10)
5 5 5
Ease of shareholder suits index (0-10)
4 6 7
Strength of investor protection index (0-10)
5.7 4.9 6.2
Business Environment:
Pros: a. Strong economy b. Labor force c. Free Trade Agreements with country’s of the world Cons: a. High interest rate b. Security issues
Other: a. Market Entry Strategy
Relationships Pricing and financing Product/service
b. Trade Organization Membership(s) c. Regulatory Reform in the trade and private sector
Mexico has been among the top 50 economies in the world improving business regulation and environment since 2005.
SUMMARY
(c) SILLAC 2014
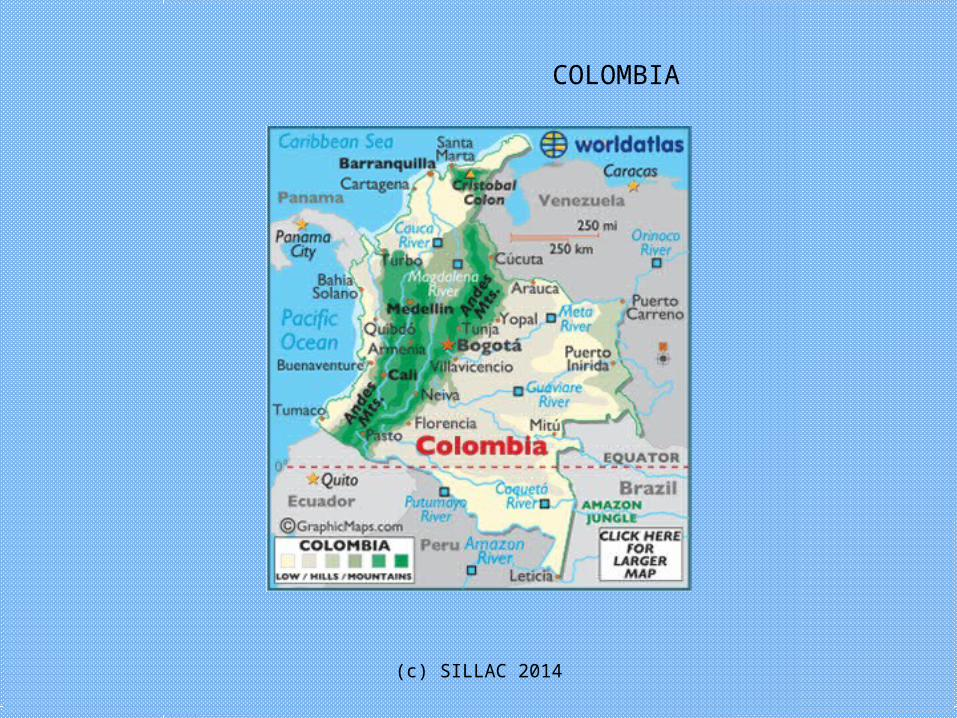
COLOMBIA
(c) SILLAC 2014
KEY FACTS
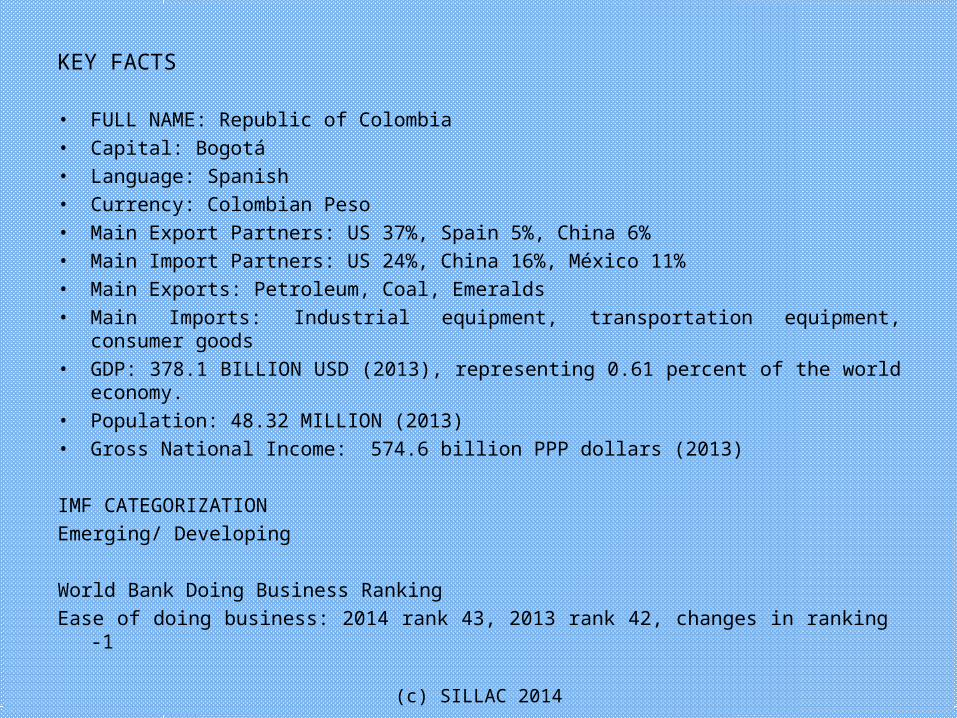
• FULL NAME: Republic of Colombia • Capital: Bogotá • Language: Spanish • Currency: Colombian Peso • Main Export Partners: US 37%, Spain 5%, China 6% • Main Import Partners: US 24%, China 16%, México 11%• Main Exports: Petroleum, Coal, Emeralds• Main Imports: Industrial equipment, transportation equipment, consumer
goods• GDP: 378.1 BILLION USD (2013), representing 0.61 percent of the world
economy.• Population: 48.32 MILLION (2013)• Gross National Income: 574.6 billion PPP dollars (2013)
IMF CATEGORIZATIONEmerging/ Developing
World Bank Doing Business Ranking Ease of doing business: 2014 rank 43, 2013 rank 42, changes in ranking -1
(c) SILLAC 2014

How Colombia compares with comparator economies rank of the ease of doing business.
(c) SILLAC 2014
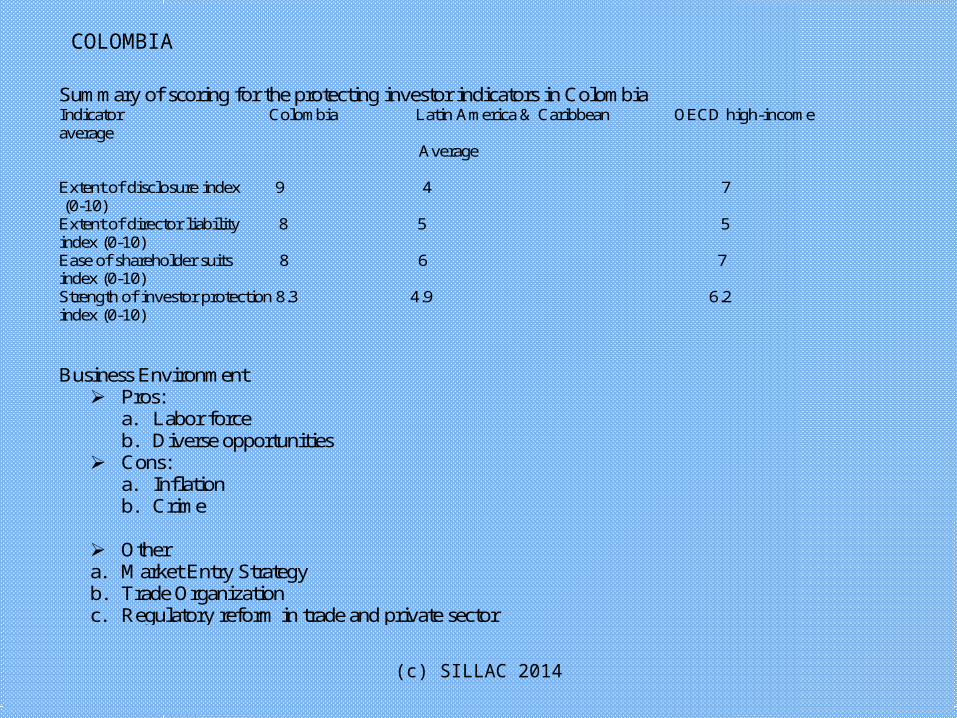
Summary of scoring for the protecting investor indicators in Colombia Indicator Colombia Latin America & Caribbean OECD high-income average Average Extent of disclosure index 9 4 7 (0-10) Extent of director liability 8 5 5 index (0-10) Ease of shareholder suits 8 6 7 index (0-10) Strength of investor protection 8.3 4.9 6.2 index (0-10) Business Environment
Pros: a. Labor force b. Diverse opportunities
Cons: a. Inflation b. Crime
Other a. Market Entry Strategy b. Trade Organization c. Regulatory reform in trade and private sector
COLOMBIA
(c) SILLAC 2014

PERU
(c) SILLAC 2014
KEY FACTS
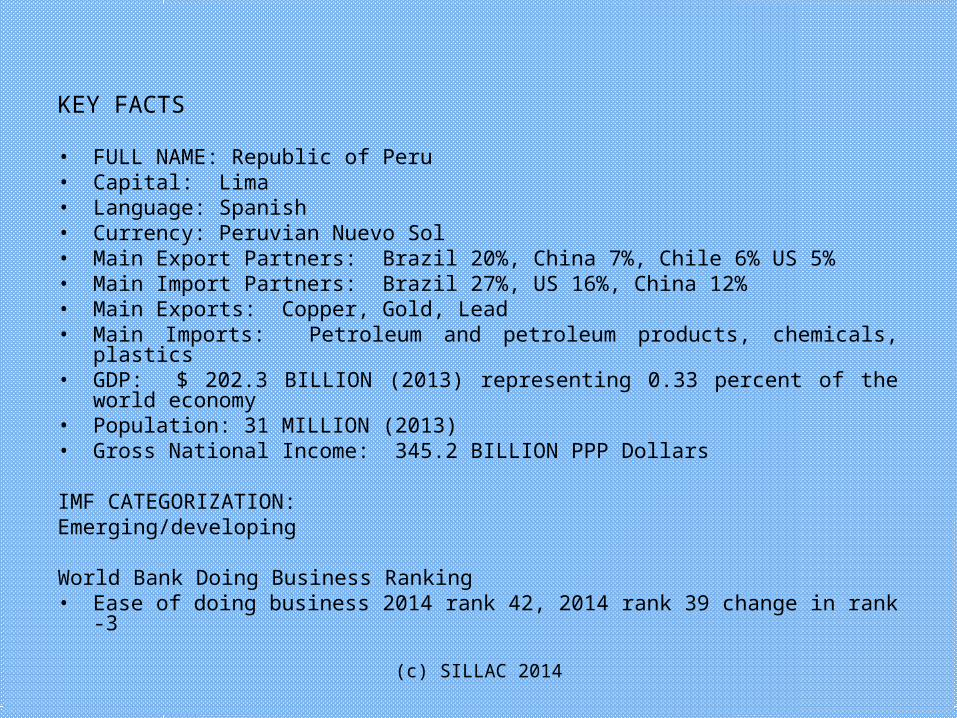
• FULL NAME: Republic of Peru • Capital: Lima • Language: Spanish• Currency: Peruvian Nuevo Sol • Main Export Partners: Brazil 20%, China 7%, Chile 6% US 5%• Main Import Partners: Brazil 27%, US 16%, China 12%• Main Exports: Copper, Gold, Lead• Main Imports: Petroleum and petroleum products, chemicals, plastics• GDP: $ 202.3 BILLION (2013) representing 0.33 percent of the world
economy• Population: 31 MILLION (2013)• Gross National Income: 345.2 BILLION PPP Dollars IMF CATEGORIZATION:Emerging/developing
World Bank Doing Business Ranking • Ease of doing business 2014 rank 42, 2014 rank 39 change in rank -3
(c) SILLAC 2014
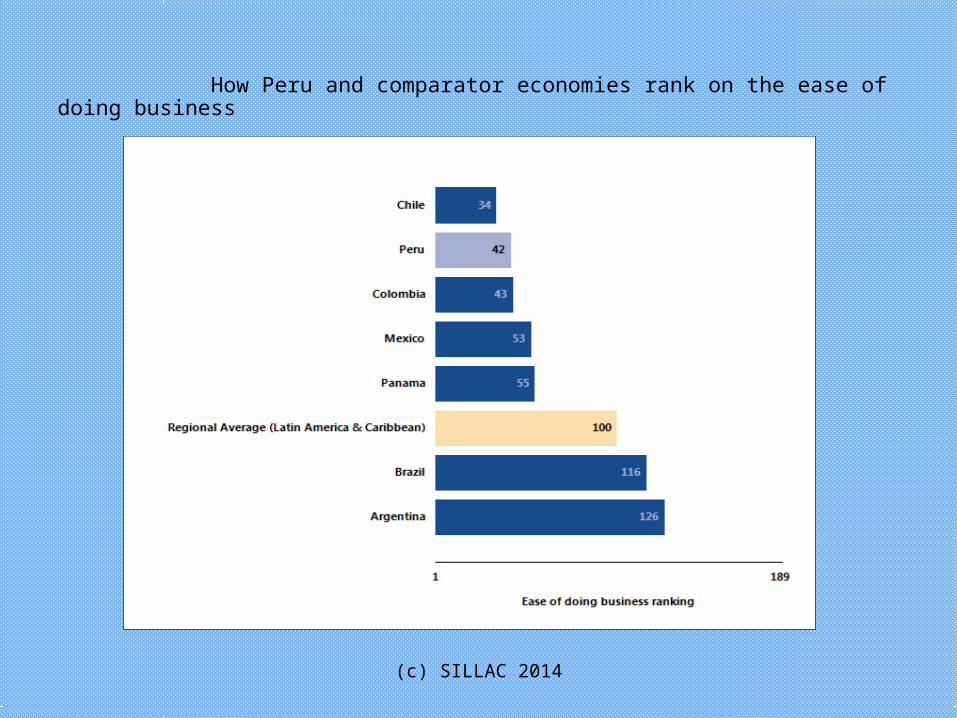
How Peru and comparator economies rank on the ease of doing business
(c) SILLAC 2014
(c) SILLAC 2014
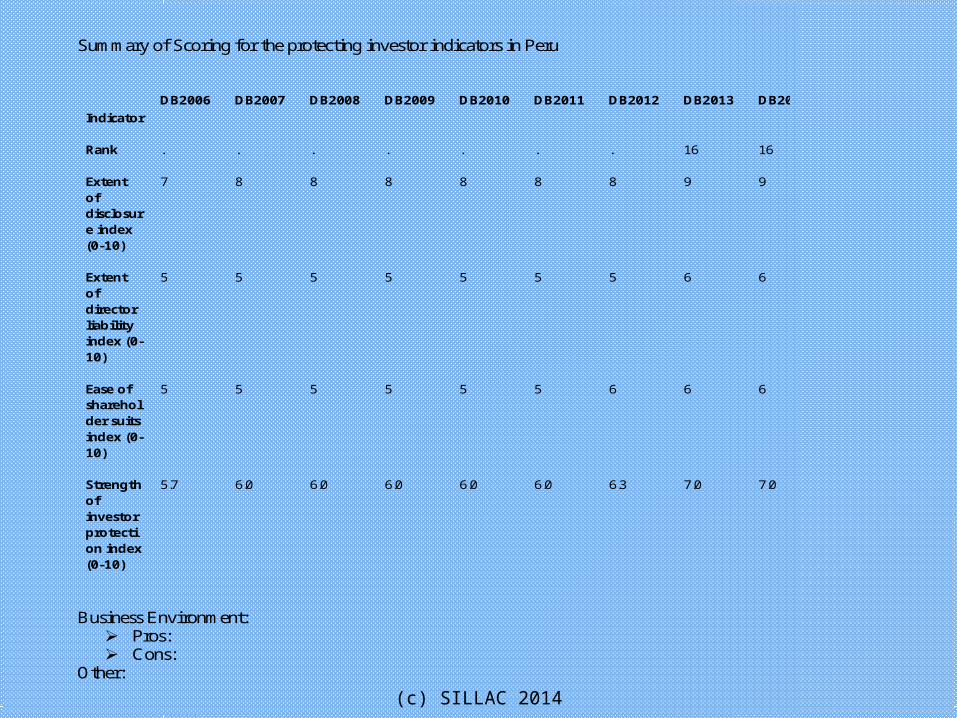
Summary of Scoring for the protecting investor indicators in Peru Indicator
DB2006 DB2007 DB2008 DB2009 DB2010 DB2011 DB2012 DB2013 DB2014
Rank . . . . . . . 16 16
Extent of disclosure index (0-10)
7 8 8 8 8 8 8 9 9
Extent of director liability index (0-10)
5 5 5 5 5 5 5 6 6
Ease of shareholder suits index (0-10)
5 5 5 5 5 5 6 6 6
Strength of investor protection index (0-10)
5.7 6.0 6.0 6.0 6.0 6.0 6.3 7.0 7.0
Business Environment:
Pros: Cons:
Other:
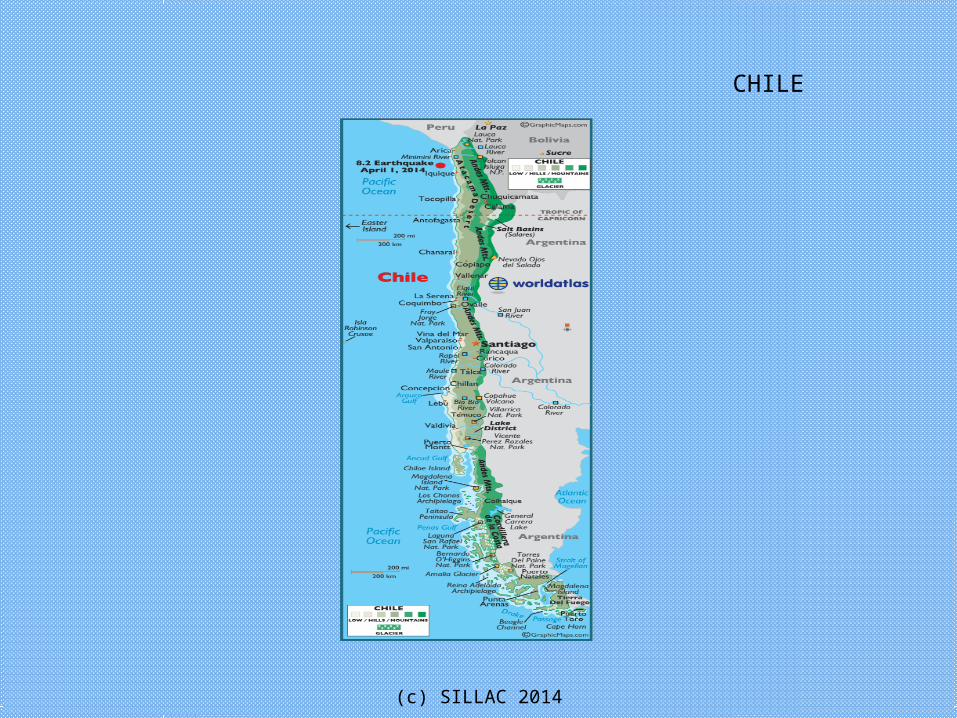
CHILE
(c) SILLAC 2014
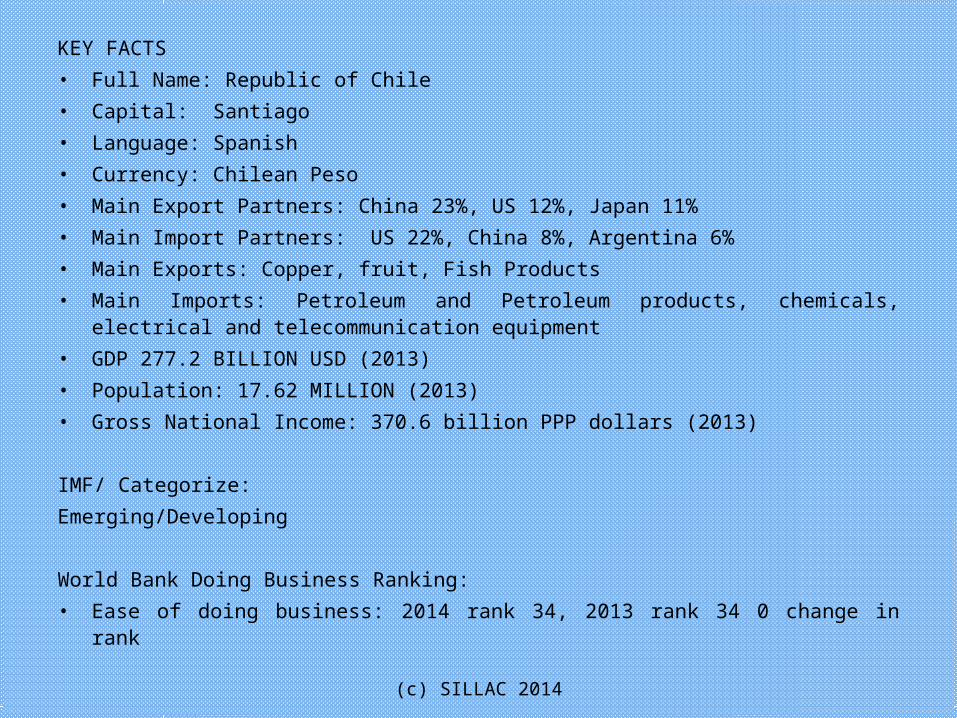
KEY FACTS
• Full Name: Republic of Chile
• Capital: Santiago
• Language: Spanish
• Currency: Chilean Peso
• Main Export Partners: China 23%, US 12%, Japan 11%
• Main Import Partners: US 22%, China 8%, Argentina 6%
• Main Exports: Copper, fruit, Fish Products
• Main Imports: Petroleum and Petroleum products, chemicals, electrical and telecommunication equipment
• GDP 277.2 BILLION USD (2013)
• Population: 17.62 MILLION (2013)
• Gross National Income: 370.6 billion PPP dollars (2013)
IMF/ Categorize:
Emerging/Developing
World Bank Doing Business Ranking:
• Ease of doing business: 2014 rank 34, 2013 rank 34 0 change in rank
(c) SILLAC 2014
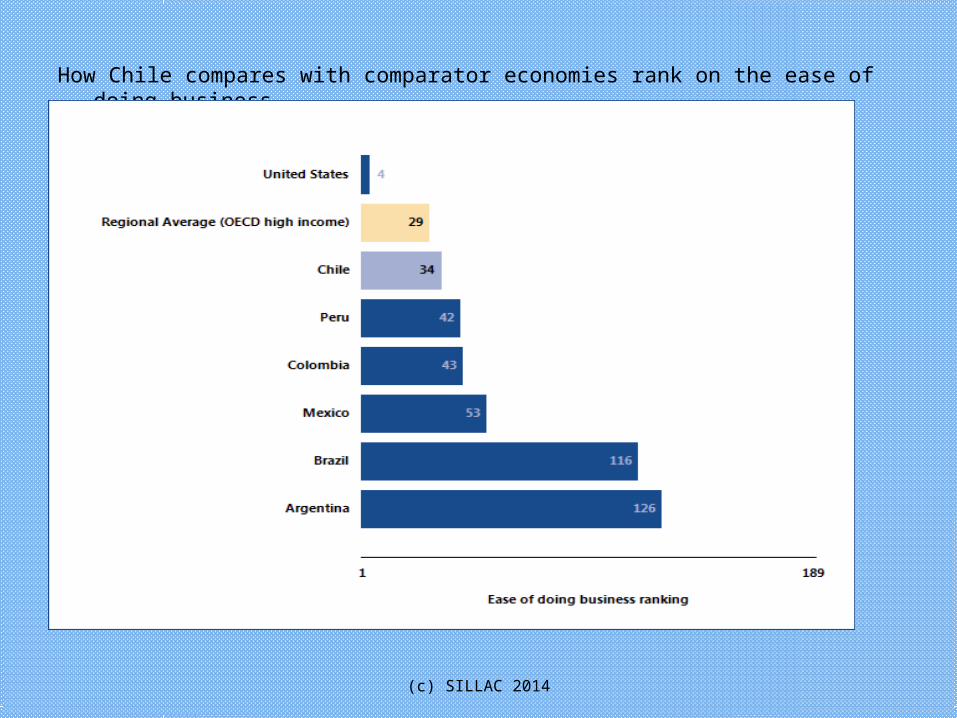
How Chile compares with comparator economies rank on the ease of doing business
(c) SILLAC 2014

Summary of Scoring for the protecting investor indicators in Chile Indicator DB2006 DB2007 DB2008 DB2009 DB2010 DB2011 DB2012 DB2013 DB2014 Rank . . . . . . . 32 34 Extent of disclosure index (0-10)
7 7 7 7 7 8 8 8 8
Extent of director liability index (0-10)
6 6 6 6 6 6 6 6 6
Ease of shareholder suits index (0-10)
5 5 5 5 5 5 5 5 5
Strength of investor protection index (0-10)
6.0 6.0 6.0 6.0 6.0 6.3 6.3 6.3 6.3
Business Environment:
Pros:
Cons
Other a. Market Entry Strategy b. Trade Organizations c. Regulatory Reform in trade
CHILE
(c) SILLAC 2014

THE CARIBBEAN MARKET BEYOND TOURISM
(c) SILLAC 2014
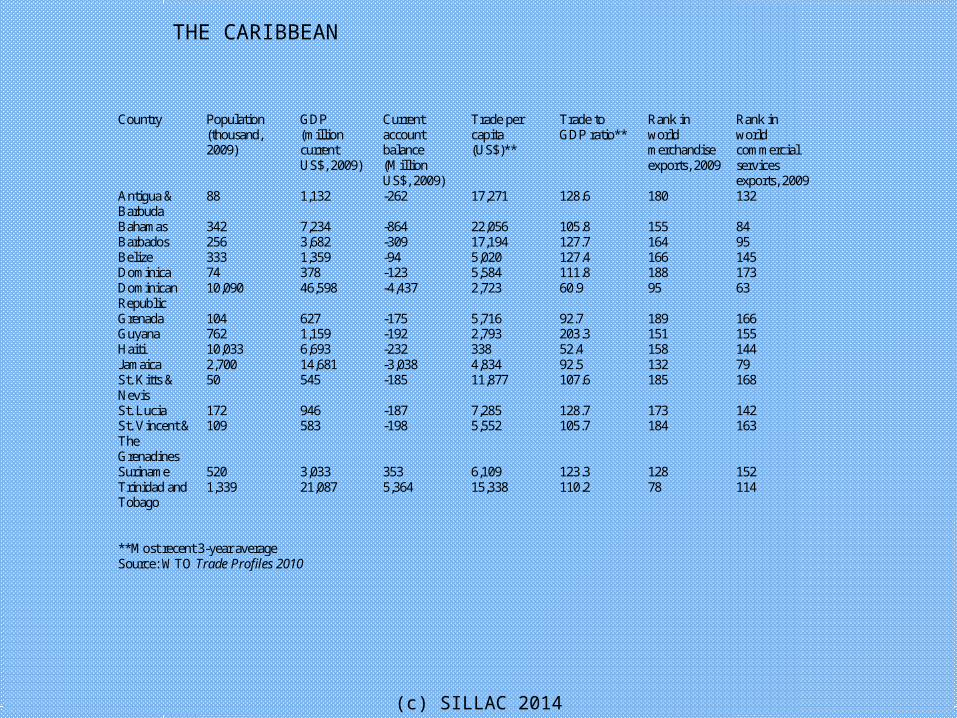
Country Population (thousand, 2009)
GDP (million current US$, 2009)
Current account balance (Million US$, 2009)
Trade per capita (US$)**
Trade to GDP ratio**
Rank in world merchandise exports, 2009
Rank in world commercial services exports, 2009
Antigua & Barbuda
88 1,132 -262 17,271 128.6 180 132
Bahamas 342 7,234 -864 22,056 105.8 155 84 Barbados 256 3,682 -309 17,194 127.7 164 95 Belize 333 1,359 -94 5,020 127.4 166 145 Dominica 74 378 -123 5,584 111.8 188 173 Dominican Republic
10,090 46,598 -4,437 2,723 60.9 95 63
Grenada 104 627 -175 5,716 92.7 189 166 Guyana 762 1,159 -192 2,793 203.3 151 155 Haiti 10,033 6,693 -232 338 52.4 158 144 Jamaica 2,700 14,681 -3,038 4,834 92.5 132 79 St. Kitts & Nevis
50 545 -185 11,877 107.6 185 168
St. Lucia 172 946 -187 7,285 128.7 173 142 St. Vincent & The Grenadines
109 583 -198 5,552 105.7 184 163
Suriname 520 3,033 353 6,109 123.3 128 152 Trinidad and Tobago
1,339 21,087 5,364 15,338 110.2 78 114
**Most recent 3-year average Source: WTO Trade Profiles 2010
THE CARIBBEAN
(c) SILLAC 2014

CARICOM
ObjectivesImplementationResults ChallengesPrivate Sector and the CARICOM objectives
(c) SILLAC 2014

•Q & A (c) SILLAC 2014

SILLAC
SPECIALISTS IN INTERNATIONAL LAW ON LATIN AMERICA AND THE CARIBBEAN, S.C.www.sillac.com
THANK YOU!
JOYCE WILLIAMS, Esq.• E-mail: [email protected]
(c) SILLAC 2014