genes,brain & behavior1
TRANSCRIPT
Genes, Brain and Behavior (2009) 8: 114–126 # 2009 The AuthorsJournal compilation # 2009 Blackwell Publishing Ltd/International Behavioural and Neural Genetics Society
Increased anxiety-like behavior in mice lacking theinhibitory synapse cell adhesion molecule neuroligin 2
J. Blundell†,‡, K. Tabuchi§, M. F. Bolliger§,
C. A. Blaiss†, N. Brose¶,**, X. Liu§,
T. C. Sudhof§,¶,†† and C. M. Powell*,†,‡‡
†Department of Neurology, The University of Texas Southwestern
Medical Center, Dallas, TX, USA ‡Present address: Department of
Psychology, Memorial University of Newfoundland, St John’s,
Newfoundland, Canada §Department of Neuroscience and¶Department of Molecular Genetics, The University of Texas
SouthwesternMedical Center, Dallas, TX, USA **Present address:
Department of Molecular Neurobiology, Max-Planck-Institute for
Experimental Medicine, Gottingen, Germany ††Howard Hughes
Medical Institute, and ‡‡Department of Psychiatry, The University
of Texas Southwestern Medical Center, Dallas, TX, USA
*Corresponding author: C. M. Powell, The University of Texas
Southwestern Medical Center, Dallas, TX, 75390-8813. E-mail: craig.
Neuroligins (NL) are postsynaptic cell adhesionmolecules
that are thought to specify synapse properties. Previous
studies showed that mutant mice carrying an autism-
associated pointmutation in NL3 exhibit social interaction
deficits, enhanced inhibitory synaptic function and
increased staining of inhibitory synaptic puncta without
changes inoverall inhibitory synapsenumbers. In contrast,
mutant mice lacking NL2 displayed decreased inhibitory
synaptic function. These studies raised two relevant ques-
tions. First, does NL2 deletion impair inhibitory synaptic
function by altering the number of inhibitory synapses, or
by changing their efficacy? Second, does this effect of NL2
deletion on inhibition produce behavioral changes? We
now show that although NL2-deficient mice exhibit an
apparentdecrease innumberof inhibitorysynapticpuncta,
the number of symmetric synapses as determined by
electron microscopy is unaltered, suggesting that NL2
deletion impairs the function of inhibitory synapses with-
out decreasing their numbers. This decrease in inhibitory
synaptic function in NL2-deficient mice correlates with
a discrete behavioral phenotype that includes a marked
increase in anxiety-like behavior, a decrease in pain sensi-
tivity and a slight decrease in motor co-ordination. This
work confirms that NL2 modulates inhibitory synaptic
function and is the first demonstration that global deletion
of NL2 can lead to a selective behavioral phenotype.
Keywords: Anxiety, autism, GABA, inhibition, neurexin, neu-roligin, nociception, pain, social interaction
Received 21 July 2008, revised 10 September, 15 October2008, accepted for publication 18 October 2008
Introduction
Neuroligins (NLs) are a family of ubiquitously expressedpostsynaptic cell adhesion molecules in the brain that interact
with neurexins (Ichtchenko et al. 1995, 1996) and aredifferentially localized to the postsynaptic specializations
of excitatory and inhibitory synapses (Graf et al. 2004;Ichtchenko et al. 1995, 1996; Song et al. 1999; Varoqueaux
et al. 2004). NL1 is enriched at postsynaptic densities ofexcitatory synapses in vivo (Song et al. 1999). NL2, however,
is preferentially localized to inhibitory synapses (Varoqueauxet al. 2004). Recent data suggest that NL3 is enriched in the
brain and appears to be localized to both excitatory andinhibitory synapses (Budreck & Scheiffele 2007). While the
results of early in vitro transfection experiments suggesteda role for NLs in synapse formation (Boucard et al. 2005; Chih
et al. 2005; Dean et al., 2003; Graf et al. 2004; Levinson et al.2005; Nam & Chen 2005; Prange et al. 2004), more recent
experiments in cultured neurons and in vivo suggest thatNLs are not required for synapse formation, but rather for
synapse specification and modulation (Chubykin et al. 2007;Varoqueaux et al. 2006).
Investigation of the role of NLs in vivo is critical for
understanding not only the molecular basis of synapsefunction and its role in complex behavior but also the
pathophysiology of autism spectrum disorder (ASD). In par-ticular, internal deletions in neurexin 1, a binding partner of
NL1, NL2 and NL3, have been observed in patients withautism (Feng et al. 2006; Szatmari et al. 2007). Understanding
how deletion of each of the neurexin 1’s postsynaptic binding
partners (i.e. NL1, NL2 and NL3) affects behavior is thus animportant step toward clarification of how neurexin 1 loss of
function may lead to autism. Furthermore, a point mutation inNL3 and multiple loss-of-function mutations in NL4 have been
discovered in individuals with X-linked autism (Chih et al.
2004; Comoletti et al. 2004; Jamain et al. 2003; Laumonnieret al. 2004; Yan et al. 2005), and three different nonsense
mutations in SHANK3 (Durand et al. 2007), a synaptic scaf-folding protein associated with NLs intracellularly (Meyer
et al. 2004), have been found in patients with ASDs. Whenwe introduced the autism-related R451C substitution in NL3
into mice, it caused an increase in inhibitory synaptic trans-
mission with no apparent effect on excitatory synapses(Tabuchi et al. 2007). Our NL2 knockout (KO) mice, which
exhibit reduced inhibitory synaptic transmission, now providea contrast to the NL3 R451C mutation mouse model that
shows enhanced inhibitory synaptic transmission.Consistent with its localization in vivo, NL2 appears to
function primarily at inhibitory synapses (Chubykin et al.
2007). Deletion of NL2 in mice leads to a decrease ininhibitory synaptic transmission (Chubykin et al. 2007).
Whether this effect of NL2 on inhibitory synapses is mediated
114 doi: 10.1111/j.1601-183X.2008.00455.x
through a change in inhibitory synapse numbers, and whetherthis effect of NL2 deletion leads to selective behavioral
deficits, remain critical questions. Analogous to findings inNL3 R451C mutant mice, we now demonstrate that the
decrease in inhibitory synaptic transmission in NL2 KOs isassociated with a decrease in the density of vesicular g-aminobutyric acid transporter (VGAT)-positive puncta abovea set threshold, but with no change in synapse number as
determined by electron microscopy (EM). Next, we deter-mined whether the decrease in inhibitory synaptic transmis-
sion induced by NL2 deletion produced a discrete behavioralphenotype consistent with a role for NL2 in a specific neural
circuit vs. non-specific, global alteration in brain function. Ourfindings suggest that global loss of NL2 leads to abnormalities
in specific behavioral domains referable to the decrease ininhibitory synaptic function. In particular, NL2 KO mice exhibit
increased anxiety-like behavior, decreased pain sensitivity anddecreased motor co-ordination, yet they show normal loco-
motor activity, social interaction and social learning.
Experimental procedures
Genetic manipulations
Neuroligin-2 KO mice were generated using SM1 embryonicstem cell clone derived from 129S6/SvEvTac mouse, and the
resulting chimeric mice were bred with C57BL/6J mice toobtain F1 heterozygous KO mice. Thus, the F1 mice were on
a 129S6/SvEvTac/C57BL/6J hybrid background. Knockoutmice were maintained by interbreeding mice heterozygous
for the NL2 allele for approximately 30 generations.Littermates were used for the breeding in some gener-
ations, although this was avoided as much as possible.Before the behavioral study, KO mice were backcrossed to
C57BL/6NCrl mice for two generations and subsequently to129S2/SvPasCrlf mice for another two generations. Resulting
NL2 heterozygote mice were interbred and resulting age- andsex-matched littermate pair offspring were used for behav-
ioral studies. The use of such a hybrid background minimizesthe possibility of deleterious recessivemutations that occur in
inbred strains being homozygous in the experimental mice.
Morphological analyses
Male NL2 KO and littermate control micewere anesthetized and
perfusion fixed with 4% paraformaldehyde in 100 mM phos-phate buffer (pH 7.4). Brainswere removed and immersion fixed
for 4 hours in 4% paraformaldehyde in 100 mM phosphatebuffer (pH 7.4) and cryoprotected with 30% sucrose in phos-
phate-buffered saline (PBS) for 2 days at 48C. Labels on glassvials storing brain samples were removed and coded for blind
experiment. A 30-mm serial parasagittal sections were cut ona cryomicrotome and blocked with 3% goat serum/0.3% Triton-
X-100 in PBS and incubatedwith anti-synaptophysin monoclonalantibody (Millipore, Billerica, MA, USA), anti-VGlut1 monoclonal
antibody (Synaptic System, Gottingen, Germany), and/or anti-VGAT polyclonal antibody (Millipore, Billerica, MA, USA) over-
night at 48C, followed by incubation with Alexa Fluor 488 or633 conjugated goat anti-mouse immunoglobulin G (Invitro-
gen, Eugene, OR, USA). Sections were transferred onto
SuperFrost slides and mounted under glass coverslips withVectashield with 4’,6-diamidino-2-phenylindole (Vector Labo-
ratories, Burlingame, CA, USA). For each brain section, areasincluding the center portion of the CA1 and CA3 subfields of
the hippocampus were imaged with a Leica TCS2 laserscanning confocal microscope (Leica Microsystems, Wetzlar,
Germany) at 63�, and the stratum radiatum layer of the CA1and CA3 regions (where the dendrites of pyramidal neurons
receive synaptic inputs) was magnified fivefold. For eachprotein of interest, images were acquired with identical
settings for laser power, photomultiplier gain and offset witha pinhole diameter. Images of identical regions (specified
above) were acquired from 15 sections from each of threeanimals/genotype. Images were imported into IMAGEJ 1.41
software for morphometric analysis. In the software, imageswere converted into binary data and thresholded to outline
immunopositive particles. Thresholds were determined tooutline as many immunopositive puncta as possible through-
out all images. Identical thresholds were used for the samesets of experiments (threshold ¼ 60 for synapsin and VGlut1
staining, threshold ¼ 20 for VGAT staining). The number andsize of puncta were detected using the ‘analyze particle’
module of the program. The average number and size ofimmunopositive puncta were normalized with data from
wildtype (WT) to determine synaptic density and size, respec-tively. Statistical significance was determined by Student’s
t-test. All of the data shown are mean � SEM.
Electron microscopy
Male NL2 KO littermates (four WT and four KO, 8 weeks of
age) were anesthetized and vascularly perfused through theheart with 2% paraformaldehyde and 1% glutaraldehyde in
100 mM phosphate buffer (pH 7.4) for the first 15 min. Brainswere removed and immersion fixed with 2% paraformalde-
hyde and 2% glutaraldehyde in the 100 mM cacodylate bufferovernight at 48C. The tissue was sectioned using a vibratome
at 200 mm thickness. The hippocampus of each section wasdissected out before the post-fixation (1 h) with 1% OsO4,
0.8% potassium ferricyanide and en bloc stained with 2%uranyl acetate for 15 min. After dehydration in a series of
ethanol up to 100%, slices were embedded in Poly/bed 812(Polysciences Inc., Warrington, PA, USA) for 24 h. Thin sec-
tions (65 nm) were made and post-stained with uranyl acetateand lead citrate, and viewed under a FEI Tecnai transmission
electron microscope at 120 kV accelerating voltage. All EMimages were captured by a 4k� 4k CCD camera at magnifica-
tions of 30 000, and quantitative analyses were conducted onthe digital EM micrographs of the same magnification. Images
were taken in the stratum radiatum layer of the CA1 hippo-campal region, and all images were within 20–30 mm of the
inner layer of pyramidal neuron cell bodies. A total of 258 EMmicrographs were analyzed. From the four KOmice, 30, 45, 25
and 25 images were randomly selected for analysis, and fromthe four WT mice, 42, 42, 26, and 36 images were randomly
selected for analysis. The measurement was performed with-out knowledge of the genotyping and was assisted by
METAMORPH 7.5 software (Molecular Devices, Union City,CA, USA). The final data were derived from the number of
synapses in the following sequence: Asymmetric/symmetric/
Genes, Brain and Behavior (2009) 8: 114–126 115
Increased anxiety-like behavior in mice
unidentifiable. The statistical significance was calculated withSIGMAPLOT 11 and MICROSOFT EXCEL 2003 SP3.
Western blot
Protein compositions were determined by immunoblotting onwhole brain tissues homogenized in PBS, 10 mM ethylenedia-
minetetraacetic acid, and proteinase inhibitors from four pairs ofP40 littermate mice per genotype. Proteins of 40 mg were
loaded per lane and blottedwith antibodies for synaptic proteinsand internal controls (b-actin or Rab GDP dissociation inhibitor).
Blots were reacted with 125I-labeled secondary antibodiesfollowed by STORM 820 PHOSPHOIMAGER (STORM 860 Amersham
Pharmacia Biotech) detection.
Behavioral overview
Mice were age-/sex-matched littermate progeny of heterozy-
gous/heterozygous matings tested behaviorally in two groups.Experimenters were blind to genotype. For all behavioral tests,
the number of NL2 KO littermate pairs was 22 (total of 44mice). No significant sex � genotype interactions were found
during the statistical analysis of any test (Table 1; NL2, n ¼ 10male pairs, 12 female pairs). For shock threshold, pain sensi-
tivity and the test of olfaction, however, only 15 littermate pairswere tested (30mice total) as some of themice were removed
for histological studies. All mice ranged from 2 to 4 months of
age during the behavioral testing, and within each group, micewere born within 4 weeks of each other. Less stressful
behaviors were tested first with more stressful procedures atthe end. The order of tests was as follows: locomotor, dark/
light box, open field, accelerating rotarod, social interactionwith a juvenile, social learning, social vs. inanimate preference
test, preference for social novelty test, social interaction withan adult caged conspecific, hot-plate sensitivity and shock
threshold. Mice were moved within the animal facility to thetesting room and allowed to habituate to the new location for at
least 1 h before behavioral testing. Significance was taken asP < 0.05 for all experiments and a complete description of
statistical results are given in Table 1.
Anxiety-like behavioral tests
The dark/light and open field tests were performed essen-
tially as described (Powell et al. 2004). In the dark/light test,one side of the apparatus was kept dark (room light entry
limited) while a light built into the top lit the other side(1700 lx, each chamber 25 � 26 cm). Mice were placed in
the dark side and allowed to freely explore the light and darksides for 10 min. Anxiety-like behavior was measured using
latency to enter the light side, time in the dark side andnumber of crosses into the light side. Locomotor activity
was also examined in both the light and dark sides of theapparatus. The open field test was performed for 10 min in
a brightly lit (�800 lx), 48 � 48 � 48 cm white plastic arenausing video tracking software from Noldus (ETHOVISION 2.3.19;
Wageningen, The Netherlands). Time spent in the center zone(15 � 15 cm) and frequency to enter the center was recorded.
Locomotor activity was also measured during the open fieldtest. Data were analyzed with a two-way ANOVA for genotype
and sex.
Accelerating rotarod
An accelerating rotarod designed for mice (IITC Life Sciences;Woodlands Hills, CA, USA) was used essentially as described
(Powell et al. 2004) except three sets of three trials wereperformed per day over 3 days. Briefly, the rotarod was
activated after placing a mouse on the motionless rod. The rodaccelerated from 0 to 45 r.p.m. in 60 s. Time to fall off the rod or
to turn one full revolution was measured. Data were analyzedwith a mixed ANOVA for genotype, sex and the repeated
measures of trial.
Hot-plate sensitivity
Mice were placed on a black, anodized, constant temperatureplate of 528C (IITC model 39 hot plate) covered with a Plex-
iglass enclosure. Latency to lick any pawwasmeasured.Micewere removed upon first paw lick or after 30 s if no response
was elicited, and the plate was cleaned with water betweenmice and allowed to return to room temperature. Data were
analyzed with a two-way ANOVA for genotype and sex.
Shock threshold
Footshock threshold analysis was performed by placing mice
in the fear conditioning apparatus (described in Powell et al.2004) for a 2-min habituation followed by a 2 s footshock with
an interstimulus interval of 20 s of gradually increasing
intensity from 0.05 mA at 0.05-mA intervals. The intensityrequired to elicit flinching, jumping and vocalizing was
recorded by an observer blind to genotype. Data wereanalyzed with a two-way ANOVA for genotype and sex.
Social interaction and social learning
Direct social interaction with a juvenile took place in a novel,empty, clear, plastic mouse cage under red light (Kwon et al.
2006). Following a 15-min habituation in the dark, the experi-mental and target mice were placed in the neutral cage for
2 min and allowed to directly interact. Time spent interactingwith the juvenile was scored by an observer blind to geno-
type. Social learning was assessed 3 days later by allowingmice to interact with the same juvenile for an additional
2 min. Again, time spent interacting with the juvenile wasscored. Data were analyzed with a three-way mixed ANOVA
with genotype and sex as between-subject factors and testsession as a within-subject factor.
Social vs. inanimate preference and preference for socialnovelty analyses were performed as described (Moy et al.
2004; Nadler et al. 2004) except room and door dimensionswere different (15 � 90 � 18.5 cm divided into three com-
partments of 15 � 29 cm separated by dividers with a central3.8 � 3.8 cm door), and video tracking software from Noldus
(ETHOVISION 2.3.19) was used to record mouse behavior (Kwonet al. 2006). In the test, mice were initially allowed to explore
the apparatus for 10 min. Then, mice were allowed to interactwith an empty cage in one compartment vs. a caged social
target in the far compartment for another 10 min. The test forsocial novelty involved a subsequent 10-min test in which mice
were allowed to interact with the familiar caged adult, or a novelcaged adult. Location of empty cages and target mouse as well
as novel vs. familiar mouse was counterbalanced. The test
116 Genes, Brain and Behavior (2009) 8: 114–126
Blundell et al.
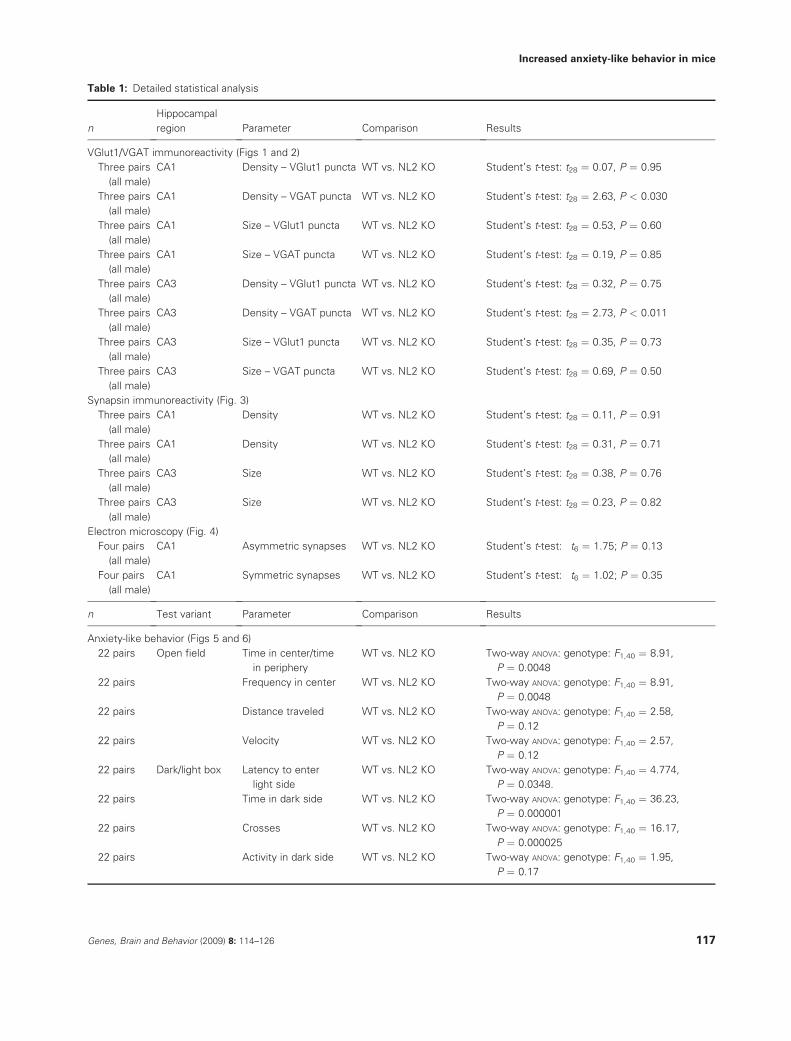
Table 1: Detailed statistical analysis
n
Hippocampal
region Parameter Comparison Results
VGlut1/VGAT immunoreactivity (Figs 1 and 2)
Three pairs
(all male)
CA1 Density – VGlut1 puncta WT vs. NL2 KO Student’s t-test: t28 ¼ 0.07, P ¼ 0.95
Three pairs
(all male)
CA1 Density – VGAT puncta WT vs. NL2 KO Student’s t-test: t28 ¼ 2.63, P < 0.030
Three pairs
(all male)
CA1 Size – VGlut1 puncta WT vs. NL2 KO Student’s t-test: t28 ¼ 0.53, P ¼ 0.60
Three pairs
(all male)
CA1 Size – VGAT puncta WT vs. NL2 KO Student’s t-test: t28 ¼ 0.19, P ¼ 0.85
Three pairs
(all male)
CA3 Density – VGlut1 puncta WT vs. NL2 KO Student’s t-test: t28 ¼ 0.32, P ¼ 0.75
Three pairs
(all male)
CA3 Density – VGAT puncta WT vs. NL2 KO Student’s t-test: t28 ¼ 2.73, P < 0.011
Three pairs
(all male)
CA3 Size – VGlut1 puncta WT vs. NL2 KO Student’s t-test: t28 ¼ 0.35, P ¼ 0.73
Three pairs
(all male)
CA3 Size – VGAT puncta WT vs. NL2 KO Student’s t-test: t28 ¼ 0.69, P ¼ 0.50
Synapsin immunoreactivity (Fig. 3)
Three pairs
(all male)
CA1 Density WT vs. NL2 KO Student’s t-test: t28 ¼ 0.11, P ¼ 0.91
Three pairs
(all male)
CA1 Density WT vs. NL2 KO Student’s t-test: t28 ¼ 0.31, P ¼ 0.71
Three pairs
(all male)
CA3 Size WT vs. NL2 KO Student’s t-test: t28 ¼ 0.38, P ¼ 0.76
Three pairs
(all male)
CA3 Size WT vs. NL2 KO Student’s t-test: t28 ¼ 0.23, P ¼ 0.82
Electron microscopy (Fig. 4)
Four pairs
(all male)
CA1 Asymmetric synapses WT vs. NL2 KO Student’s t-test: t6 ¼ 1.75; P ¼ 0.13
Four pairs
(all male)
CA1 Symmetric synapses WT vs. NL2 KO Student’s t-test: t6 ¼ 1.02; P ¼ 0.35
n Test variant Parameter Comparison Results
Anxiety-like behavior (Figs 5 and 6)
22 pairs Open field Time in center/time
in periphery
WT vs. NL2 KO Two-way ANOVA: genotype: F1,40 ¼ 8.91,
P ¼ 0.0048
22 pairs Frequency in center WT vs. NL2 KO Two-way ANOVA: genotype: F1,40 ¼ 8.91,
P ¼ 0.0048
22 pairs Distance traveled WT vs. NL2 KO Two-way ANOVA: genotype: F1,40 ¼ 2.58,
P ¼ 0.12
22 pairs Velocity WT vs. NL2 KO Two-way ANOVA: genotype: F1,40 ¼ 2.57,
P ¼ 0.12
22 pairs Dark/light box Latency to enter
light side
WT vs. NL2 KO Two-way ANOVA: genotype: F1,40 ¼ 4.774,
P ¼ 0.0348.
22 pairs Time in dark side WT vs. NL2 KO Two-way ANOVA: genotype: F1,40 ¼ 36.23,
P ¼ 0.000001
22 pairs Crosses WT vs. NL2 KO Two-way ANOVA: genotype: F1,40 ¼ 16.17,
P ¼ 0.000025
22 pairs Activity in dark side WT vs. NL2 KO Two-way ANOVA: genotype: F1,40 ¼ 1.95,
P ¼ 0.17
Genes, Brain and Behavior (2009) 8: 114–126 117
Increased anxiety-like behavior in mice
was performed under red light and the box was wiped with
70% ethanol and air-dried between mice. Data were ana-lyzed with a three-way mixed ANOVA with genotype and sex
as between-subject factors and interaction target as
a within-subject factor.
Results
Effect of NL2 deletion on synapse density
One might expect that loss of the cell adhesion moleculeNL2 during development may lead to gross developmental
brain abnormalities. At the light microscopic level, however,
gross observation of brain sections by light microscopy didnot reveal any gross differences in anatomy or morphology
(not shown). Because NLs have been implicated in regula-
tion of the excitatory/inhibitory balance (Chubykin et al.2007; Varoqueaux et al. 2004) and NL2 causes a selective
decrease in inhibitory synaptic strength (Chubykin et al.2007), we examined the effects of NL2 loss on density of
excitatory and inhibitory synapses in vivo. We hypothesizedthat the functional effects of NL2 deletion might correlate
with changes in density of puncta labeled with inhibitorysynaptic markers.
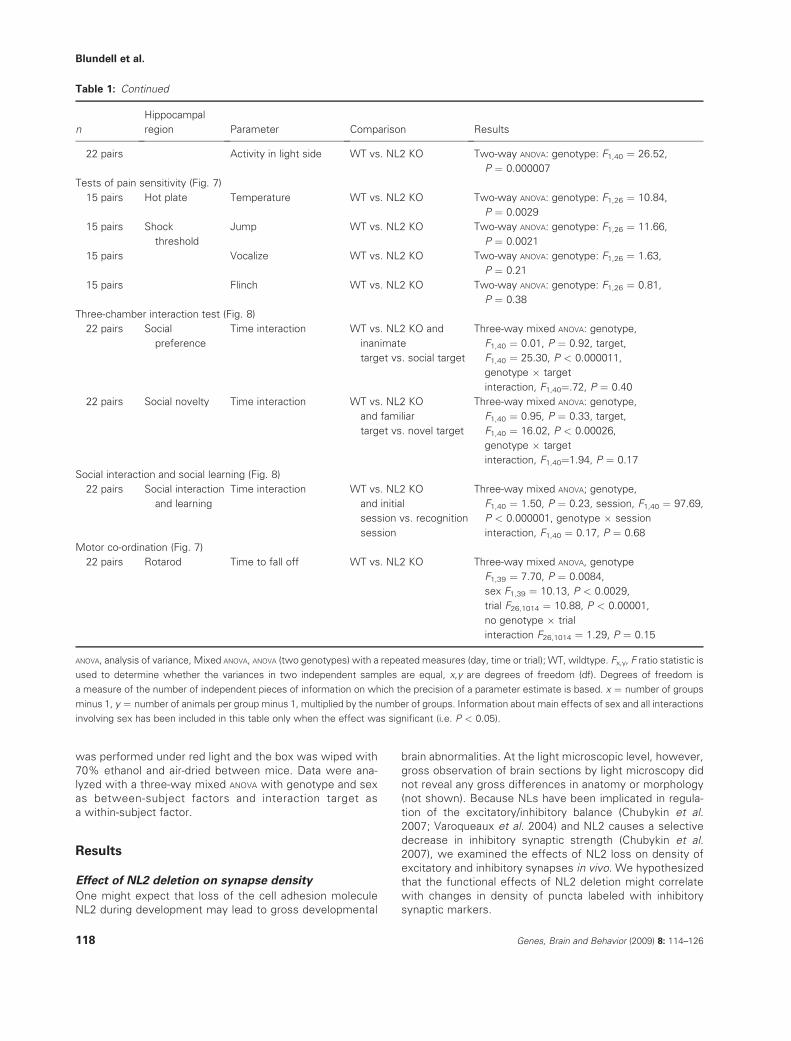
Table 1: Continued
n
Hippocampal
region Parameter Comparison Results
22 pairs Activity in light side WT vs. NL2 KO Two-way ANOVA: genotype: F1,40 ¼ 26.52,
P ¼ 0.000007
Tests of pain sensitivity (Fig. 7)
15 pairs Hot plate Temperature WT vs. NL2 KO Two-way ANOVA: genotype: F1,26 ¼ 10.84,
P ¼ 0.0029
15 pairs Shock
threshold
Jump WT vs. NL2 KO Two-way ANOVA: genotype: F1,26 ¼ 11.66,
P ¼ 0.0021
15 pairs Vocalize WT vs. NL2 KO Two-way ANOVA: genotype: F1,26 ¼ 1.63,
P ¼ 0.21
15 pairs Flinch WT vs. NL2 KO Two-way ANOVA: genotype: F1,26 ¼ 0.81,
P ¼ 0.38
Three-chamber interaction test (Fig. 8)
22 pairs Social
preference
Time interaction WT vs. NL2 KO and
inanimate
target vs. social target
Three-way mixed ANOVA: genotype,
F1,40 ¼ 0.01, P ¼ 0.92, target,
F1,40 ¼ 25.30, P < 0.000011,
genotype � target
interaction, F1,40¼.72, P ¼ 0.40
22 pairs Social novelty Time interaction WT vs. NL2 KO
and familiar
target vs. novel target
Three-way mixed ANOVA: genotype,
F1,40 ¼ 0.95, P ¼ 0.33, target,
F1,40 ¼ 16.02, P < 0.00026,
genotype � target
interaction, F1,40¼1.94, P ¼ 0.17
Social interaction and social learning (Fig. 8)
22 pairs Social interaction
and learning
Time interaction WT vs. NL2 KO
and initial
session vs. recognition
session
Three-way mixed ANOVA; genotype,
F1,40 ¼ 1.50, P ¼ 0.23, session, F1,40 ¼ 97.69,
P < 0.000001, genotype � session
interaction, F1,40 ¼ 0.17, P ¼ 0.68
Motor co-ordination (Fig. 7)
22 pairs Rotarod Time to fall off WT vs. NL2 KO Three-way mixed ANOVA, genotype
F1,39 ¼ 7.70, P ¼ 0.0084,
sex F1,39 ¼ 10.13, P < 0.0029,
trial F26,1014 ¼ 10.88, P < 0.00001,
no genotype � trial
interaction F26,1014 ¼ 1.29, P ¼ 0.15
ANOVA, analysis of variance, Mixed ANOVA, ANOVA (two genotypes) with a repeated measures (day, time or trial); WT, wildtype. Fx,y, F ratio statistic is
used to determine whether the variances in two independent samples are equal, x,y are degrees of freedom (df). Degrees of freedom is
a measure of the number of independent pieces of information on which the precision of a parameter estimate is based. x ¼ number of groups
minus 1, y ¼ number of animals per group minus 1, multiplied by the number of groups. Information about main effects of sex and all interactions
involving sex has been included in this table only when the effect was significant (i.e. P < 0.05).
118 Genes, Brain and Behavior (2009) 8: 114–126
Blundell et al.
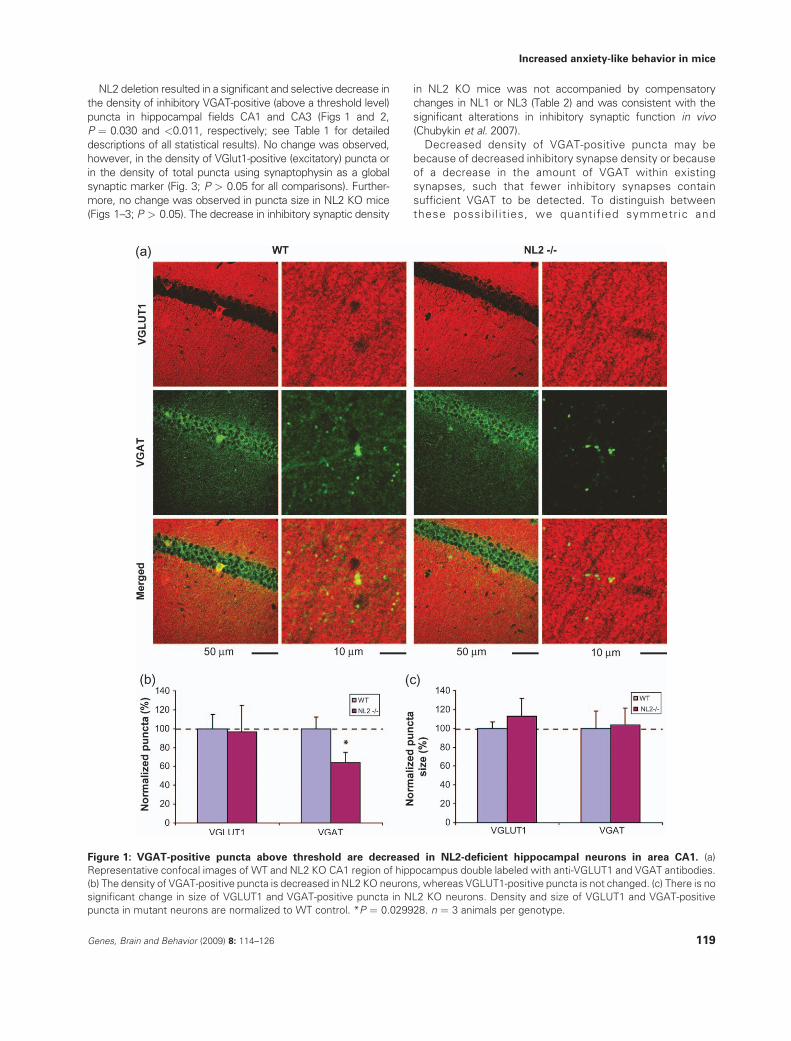
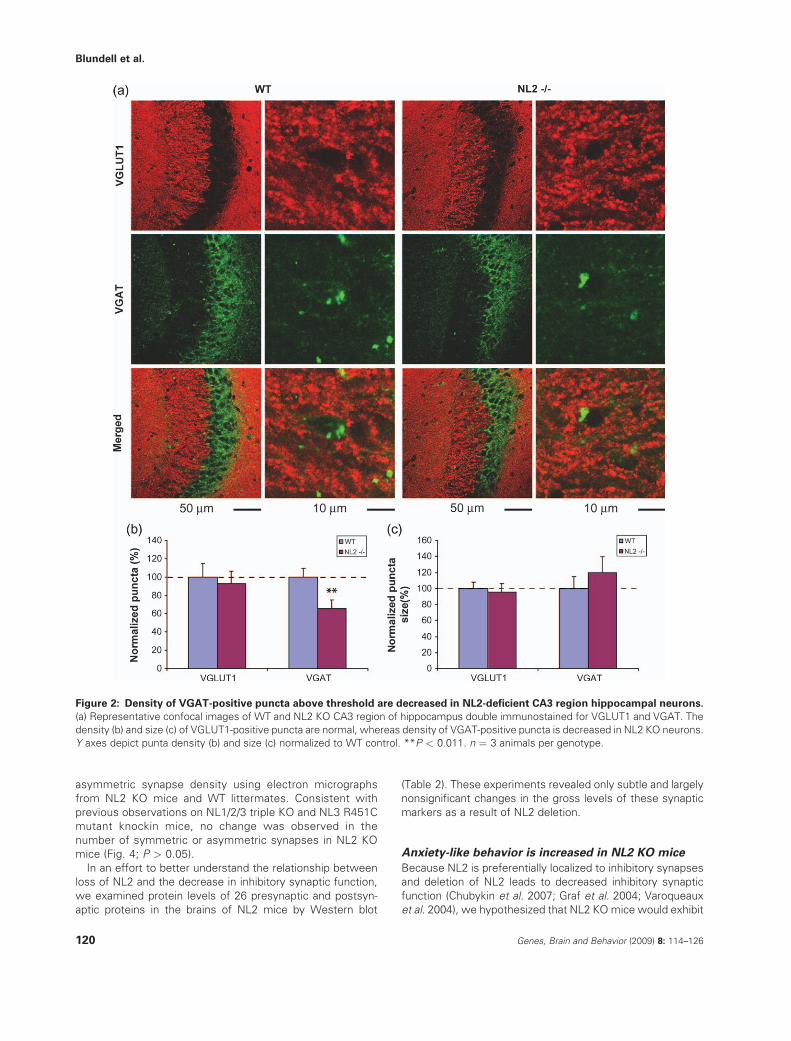
NL2 deletion resulted in a significant and selective decrease inthe density of inhibitory VGAT-positive (above a threshold level)
puncta in hippocampal fields CA1 and CA3 (Figs 1 and 2,P ¼ 0.030 and <0.011, respectively; see Table 1 for detailed
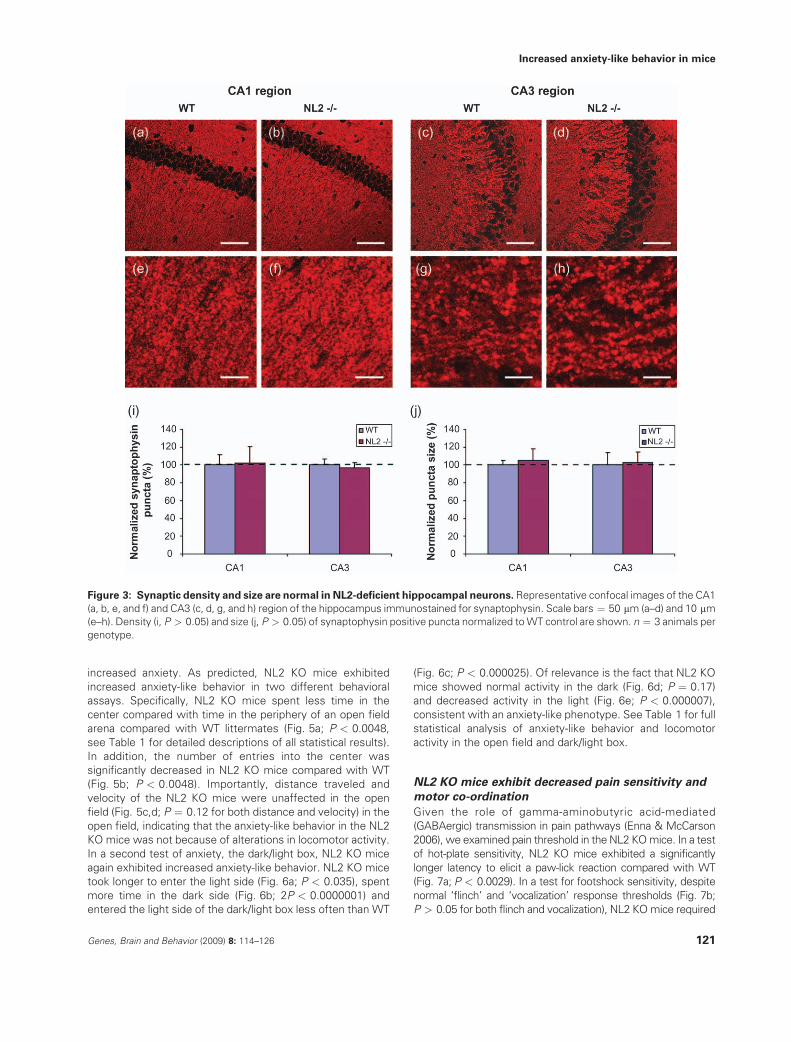
descriptions of all statistical results). No change was observed,however, in the density of VGlut1-positive (excitatory) puncta or
in the density of total puncta using synaptophysin as a globalsynaptic marker (Fig. 3; P > 0.05 for all comparisons). Further-
more, no change was observed in puncta size in NL2 KO mice(Figs 1–3; P > 0.05). The decrease in inhibitory synaptic density
in NL2 KO mice was not accompanied by compensatorychanges in NL1 or NL3 (Table 2) and was consistent with the
significant alterations in inhibitory synaptic function in vivo(Chubykin et al. 2007).
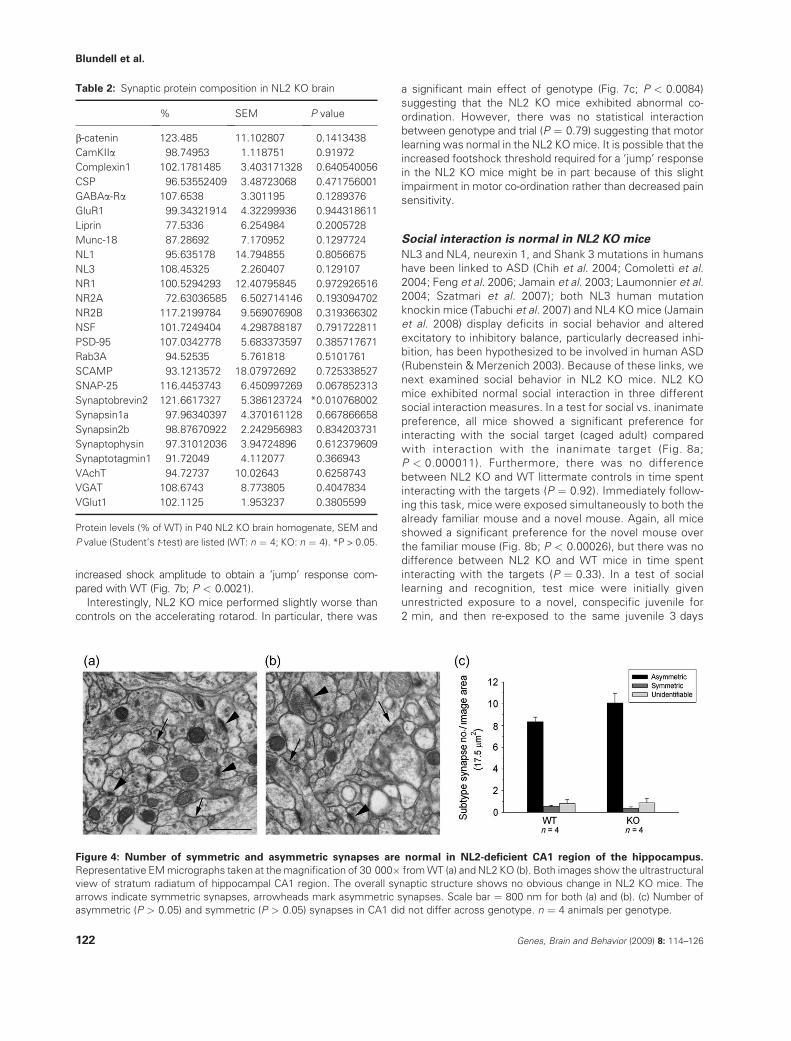
Decreased density of VGAT-positive puncta may bebecause of decreased inhibitory synapse density or because
of a decrease in the amount of VGAT within existingsynapses, such that fewer inhibitory synapses contain
sufficient VGAT to be detected. To distinguish betweenthese possibi l i t ies, we quantif ied symmetr ic and
Figure 1: VGAT-positive puncta above threshold are decreased in NL2-deficient hippocampal neurons in area CA1. (a)
Representative confocal images of WT and NL2 KO CA1 region of hippocampus double labeled with anti-VGLUT1 and VGAT antibodies.
(b) The density of VGAT-positive puncta is decreased in NL2 KO neurons, whereas VGLUT1-positive puncta is not changed. (c) There is no
significant change in size of VGLUT1 and VGAT-positive puncta in NL2 KO neurons. Density and size of VGLUT1 and VGAT-positive
puncta in mutant neurons are normalized to WT control. *P ¼ 0.029928. n ¼ 3 animals per genotype.
Genes, Brain and Behavior (2009) 8: 114–126 119
Increased anxiety-like behavior in mice
asymmetric synapse density using electron micrographsfrom NL2 KO mice and WT littermates. Consistent with
previous observations on NL1/2/3 triple KO and NL3 R451Cmutant knockin mice, no change was observed in the
number of symmetric or asymmetric synapses in NL2 KOmice (Fig. 4; P > 0.05).
In an effort to better understand the relationship betweenloss of NL2 and the decrease in inhibitory synaptic function,
we examined protein levels of 26 presynaptic and postsyn-aptic proteins in the brains of NL2 mice by Western blot
(Table 2). These experiments revealed only subtle and largelynonsignificant changes in the gross levels of these synaptic
markers as a result of NL2 deletion.
Anxiety-like behavior is increased in NL2 KO mice
Because NL2 is preferentially localized to inhibitory synapsesand deletion of NL2 leads to decreased inhibitory synaptic
function (Chubykin et al. 2007; Graf et al. 2004; Varoqueauxet al. 2004), we hypothesized that NL2 KOmice would exhibit
Figure 2: Density of VGAT-positive puncta above threshold are decreased in NL2-deficient CA3 region hippocampal neurons.
(a) Representative confocal images of WT and NL2 KO CA3 region of hippocampus double immunostained for VGLUT1 and VGAT. The
density (b) and size (c) of VGLUT1-positive puncta are normal, whereas density of VGAT-positive puncta is decreased in NL2 KO neurons.
Y axes depict punta density (b) and size (c) normalized to WT control. **P < 0.011. n ¼ 3 animals per genotype.
120 Genes, Brain and Behavior (2009) 8: 114–126
Blundell et al.
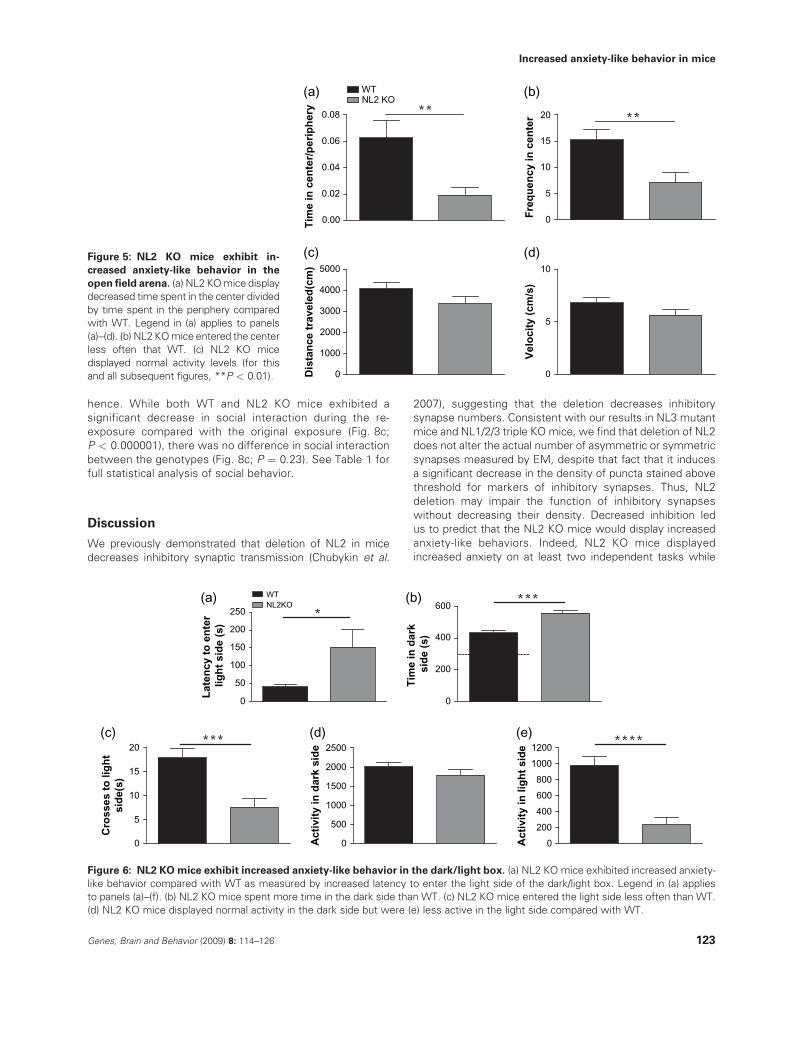
increased anxiety. As predicted, NL2 KO mice exhibited
increased anxiety-like behavior in two different behavioralassays. Specifically, NL2 KO mice spent less time in the
center compared with time in the periphery of an open fieldarena compared with WT littermates (Fig. 5a; P < 0.0048,
see Table 1 for detailed descriptions of all statistical results).In addition, the number of entries into the center was
significantly decreased in NL2 KO mice compared with WT(Fig. 5b; P < 0.0048). Importantly, distance traveled and
velocity of the NL2 KO mice were unaffected in the openfield (Fig. 5c,d; P ¼ 0.12 for both distance and velocity) in the
open field, indicating that the anxiety-like behavior in the NL2KO mice was not because of alterations in locomotor activity.
In a second test of anxiety, the dark/light box, NL2 KO mice
again exhibited increased anxiety-like behavior. NL2 KO micetook longer to enter the light side (Fig. 6a; P < 0.035), spent
more time in the dark side (Fig. 6b; 2P < 0.0000001) andentered the light side of the dark/light box less often than WT
(Fig. 6c; P < 0.000025). Of relevance is the fact that NL2 KO
mice showed normal activity in the dark (Fig. 6d; P ¼ 0.17)and decreased activity in the light (Fig. 6e; P < 0.000007),
consistent with an anxiety-like phenotype. See Table 1 for fullstatistical analysis of anxiety-like behavior and locomotor
activity in the open field and dark/light box.
NL2 KO mice exhibit decreased pain sensitivity and
motor co-ordination
Given the role of gamma-aminobutyric acid-mediated
(GABAergic) transmission in pain pathways (Enna & McCarson2006), we examined pain threshold in the NL2 KOmice. In a test
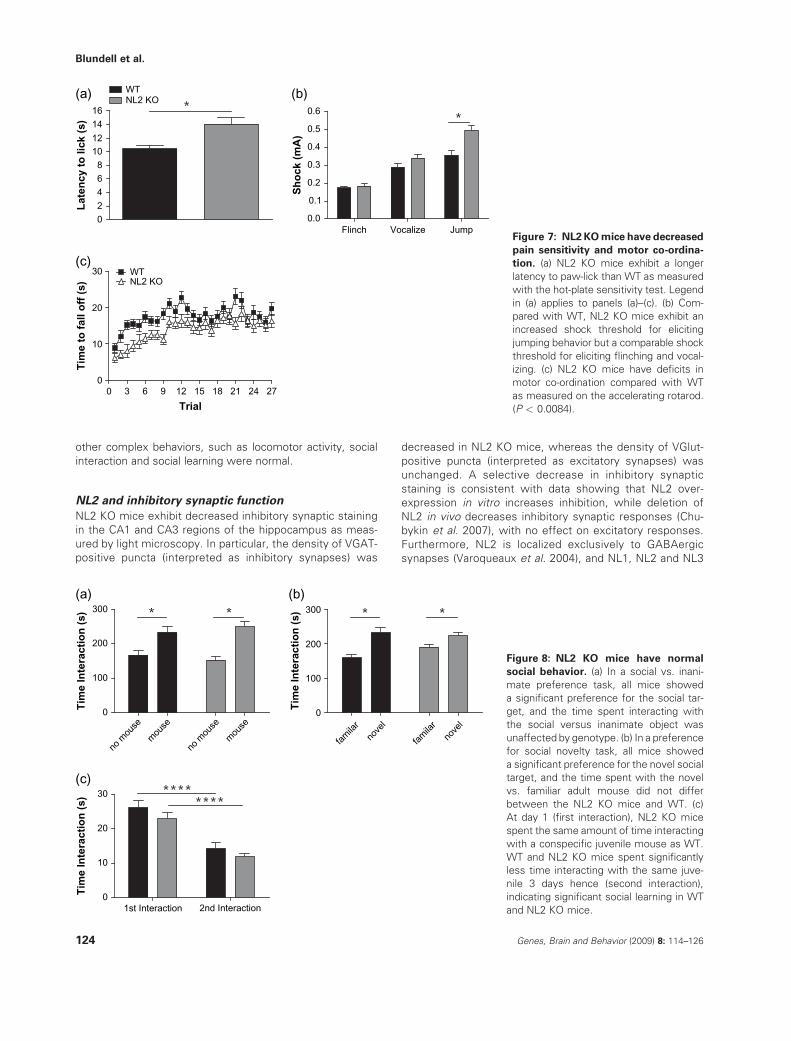
of hot-plate sensitivity, NL2 KO mice exhibited a significantly
longer latency to elicit a paw-lick reaction compared with WT(Fig. 7a; P < 0.0029). In a test for footshock sensitivity, despite
normal ‘flinch’ and ‘vocalization’ response thresholds (Fig. 7b;P > 0.05 for both flinch and vocalization), NL2 KOmice required
Figure 3: Synaptic density and size are normal in NL2-deficient hippocampal neurons. Representative confocal images of the CA1
(a, b, e, and f) and CA3 (c, d, g, and h) region of the hippocampus immunostained for synaptophysin. Scale bars ¼ 50 mm (a–d) and 10 mm(e–h). Density (i, P > 0.05) and size (j, P > 0.05) of synaptophysin positive puncta normalized toWT control are shown. n ¼ 3 animals per
genotype.
Genes, Brain and Behavior (2009) 8: 114–126 121
Increased anxiety-like behavior in mice
increased shock amplitude to obtain a ‘jump’ response com-
pared with WT (Fig. 7b; P < 0.0021).Interestingly, NL2 KO mice performed slightly worse than
controls on the accelerating rotarod. In particular, there was
a significant main effect of genotype (Fig. 7c; P < 0.0084)suggesting that the NL2 KO mice exhibited abnormal co-
ordination. However, there was no statistical interactionbetween genotype and trial (P ¼ 0.79) suggesting that motor
learning was normal in the NL2 KOmice. It is possible that theincreased footshock threshold required for a ‘jump’ response
in the NL2 KO mice might be in part because of this slightimpairment in motor co-ordination rather than decreased pain
sensitivity.
Social interaction is normal in NL2 KO mice
NL3 and NL4, neurexin 1, and Shank 3 mutations in humanshave been linked to ASD (Chih et al. 2004; Comoletti et al.
2004; Feng et al. 2006; Jamain et al. 2003; Laumonnier et al.2004; Szatmari et al. 2007); both NL3 human mutation
knockin mice (Tabuchi et al. 2007) and NL4 KO mice (Jamainet al. 2008) display deficits in social behavior and altered
excitatory to inhibitory balance, particularly decreased inhi-bition, has been hypothesized to be involved in human ASD
(Rubenstein & Merzenich 2003). Because of these links, wenext examined social behavior in NL2 KO mice. NL2 KO
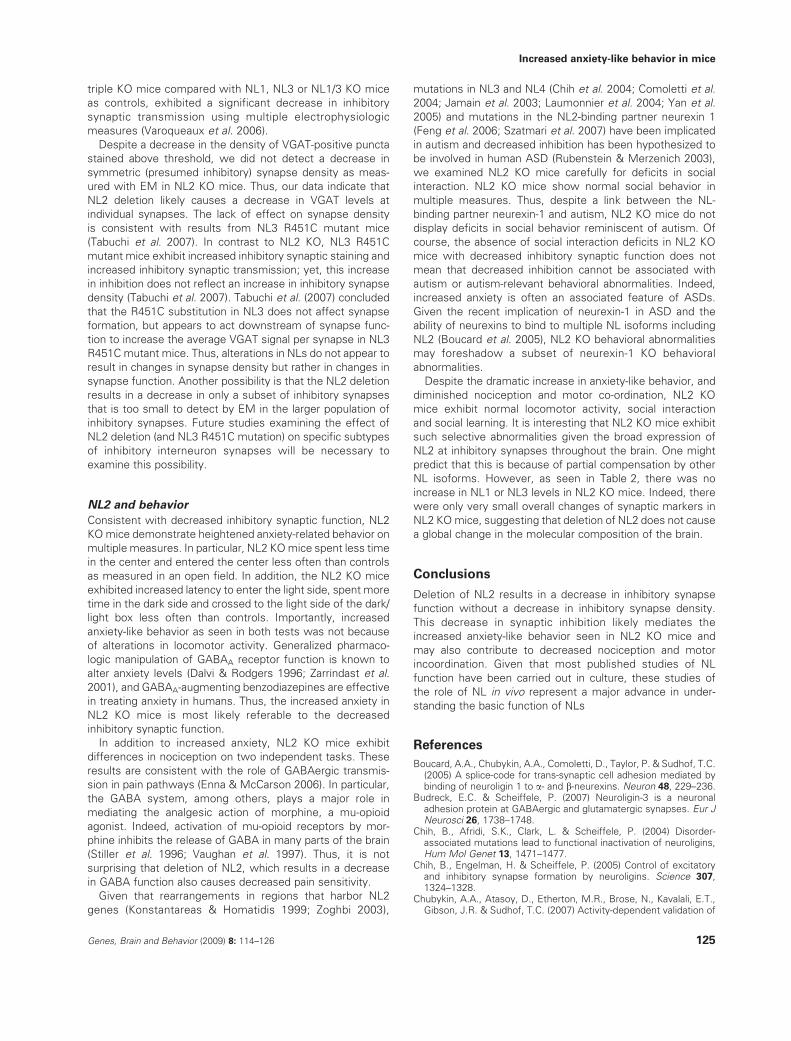
mice exhibited normal social interaction in three differentsocial interaction measures. In a test for social vs. inanimate
preference, all mice showed a significant preference forinteracting with the social target (caged adult) compared
with interaction with the inanimate target (Fig. 8a;P < 0.000011). Furthermore, there was no difference
between NL2 KO and WT littermate controls in time spentinteracting with the targets (P ¼ 0.92). Immediately follow-
ing this task, mice were exposed simultaneously to both thealready familiar mouse and a novel mouse. Again, all mice
showed a significant preference for the novel mouse over
the familiar mouse (Fig. 8b; P < 0.00026), but there was nodifference between NL2 KO and WT mice in time spent
interacting with the targets (P ¼ 0.33). In a test of sociallearning and recognition, test mice were initially given
unrestricted exposure to a novel, conspecific juvenile for2 min, and then re-exposed to the same juvenile 3 days
Table 2: Synaptic protein composition in NL2 KO brain
% SEM P value
b-catenin 123.485 11.102807 0.1413438
CamKIIa 98.74953 1.118751 0.91972
Complexin1 102.1781485 3.403171328 0.640540056
CSP 96.53552409 3.48723068 0.471756001
GABAa-Ra 107.6538 3.301195 0.1289376
GluR1 99.34321914 4.32299936 0.944318611
Liprin 77.5336 6.254984 0.2005728
Munc-18 87.28692 7.170952 0.1297724
NL1 95.635178 14.794855 0.8056675
NL3 108.45325 2.260407 0.129107
NR1 100.5294293 12.40795845 0.972926516
NR2A 72.63036585 6.502714146 0.193094702
NR2B 117.2199784 9.569076908 0.319366302
NSF 101.7249404 4.298788187 0.791722811
PSD-95 107.0342778 5.683373597 0.385717671
Rab3A 94.52535 5.761818 0.5101761
SCAMP 93.1213572 18.07972692 0.725338527
SNAP-25 116.4453743 6.450997269 0.067852313
Synaptobrevin2 121.6617327 5.386123724 *0.010768002
Synapsin1a 97.96340397 4.370161128 0.667866658
Synapsin2b 98.87670922 2.242956983 0.834203731
Synaptophysin 97.31012036 3.94724896 0.612379609
Synaptotagmin1 91.72049 4.112077 0.366943
VAchT 94.72737 10.02643 0.6258743
VGAT 108.6743 8.773805 0.4047834
VGlut1 102.1125 1.953237 0.3805599
Protein levels (% of WT) in P40 NL2 KO brain homogenate, SEM and
P value (Student’s t-test) are listed (WT: n ¼ 4; KO: n ¼ 4). *P > 0.05.
Figure 4: Number of symmetric and asymmetric synapses are normal in NL2-deficient CA1 region of the hippocampus.
Representative EMmicrographs taken at themagnification of 30 000� fromWT (a) and NL2 KO (b). Both images show the ultrastructural
view of stratum radiatum of hippocampal CA1 region. The overall synaptic structure shows no obvious change in NL2 KO mice. The
arrows indicate symmetric synapses, arrowheads mark asymmetric synapses. Scale bar ¼ 800 nm for both (a) and (b). (c) Number of
asymmetric (P > 0.05) and symmetric (P > 0.05) synapses in CA1 did not differ across genotype. n ¼ 4 animals per genotype.
122 Genes, Brain and Behavior (2009) 8: 114–126
Blundell et al.
hence. While both WT and NL2 KO mice exhibited asignificant decrease in social interaction during the re-
exposure compared with the original exposure (Fig. 8c;P < 0.000001), there was no difference in social interaction
between the genotypes (Fig. 8c; P ¼ 0.23). See Table 1 forfull statistical analysis of social behavior.
Discussion
We previously demonstrated that deletion of NL2 in micedecreases inhibitory synaptic transmission (Chubykin et al.
2007), suggesting that the deletion decreases inhibitorysynapse numbers. Consistent with our results in NL3 mutant
mice and NL1/2/3 triple KO mice, we find that deletion of NL2does not alter the actual number of asymmetric or symmetric
synapses measured by EM, despite that fact that it inducesa significant decrease in the density of puncta stained above
threshold for markers of inhibitory synapses. Thus, NL2deletion may impair the function of inhibitory synapses
without decreasing their density. Decreased inhibition ledus to predict that the NL2 KO mice would display increased
anxiety-like behaviors. Indeed, NL2 KO mice displayedincreased anxiety on at least two independent tasks while
0.00
0.02
0.04
0.06
0.08
WTNL2 KO
**
Tim
e in
cen
ter/
per
iph
ery
(a)
0
5
10
15
20 **
Fre
qu
ency
in c
ente
r
(b)
0
1000
2000
3000
4000
5000
Dis
tan
ce t
rave
led
(cm
)
(c)
0
5
10
Vel
oci
ty (
cm/s
)
(d)
0
5
10
15
20***
Cro
sses
to
lig
ht
sid
e(s)
(c)
0
500
1000
1500
2000
2500
Act
ivit
y in
dar
k si
de
(d)
0
200
400
600
800
1000
1200****
Act
ivit
y in
lig
ht
sid
e
(e)
0
50
100
150
200
250
WTNL2KO
*
Lat
ency
to
en
ter
lig
ht
sid
e (s
)
(a)
-----------------------
0
200
400
600***
Tim
e in
dar
k si
de
(s)
(b)
Figure 6: NL2 KOmice exhibit increased anxiety-like behavior in the dark/light box. (a) NL2 KO mice exhibited increased anxiety-
like behavior compared with WT as measured by increased latency to enter the light side of the dark/light box. Legend in (a) applies
to panels (a)–(f). (b) NL2 KO mice spent more time in the dark side than WT. (c) NL2 KO mice entered the light side less often than WT.
(d) NL2 KO mice displayed normal activity in the dark side but were (e) less active in the light side compared with WT.
Figure 5: NL2 KO mice exhibit in-
creased anxiety-like behavior in the
open field arena. (a) NL2 KOmice display
decreased time spent in the center divided
by time spent in the periphery compared
with WT. Legend in (a) applies to panels
(a)–(d). (b) NL2 KOmice entered the center
less often that WT. (c) NL2 KO mice
displayed normal activity levels (for this
and all subsequent figures, **P < 0.01).
Genes, Brain and Behavior (2009) 8: 114–126 123
Increased anxiety-like behavior in mice
other complex behaviors, such as locomotor activity, social
interaction and social learning were normal.
NL2 and inhibitory synaptic function
NL2 KO mice exhibit decreased inhibitory synaptic stainingin the CA1 and CA3 regions of the hippocampus as meas-
ured by light microscopy. In particular, the density of VGAT-positive puncta (interpreted as inhibitory synapses) was
decreased in NL2 KO mice, whereas the density of VGlut-
positive puncta (interpreted as excitatory synapses) wasunchanged. A selective decrease in inhibitory synaptic
staining is consistent with data showing that NL2 over-expression in vitro increases inhibition, while deletion of
NL2 in vivo decreases inhibitory synaptic responses (Chu-bykin et al. 2007), with no effect on excitatory responses.
Furthermore, NL2 is localized exclusively to GABAergicsynapses (Varoqueaux et al. 2004), and NL1, NL2 and NL3
0 3 6 9 12 15 18 21 24 270
10
20
30 WTNL2 KO
Trial
Tim
e to
fal
l off
(s)
(c)
02468
1012
1416
WTNL2 KO *
Lat
ency
to
lick
(s)
(a)
Flinch Vocalize Jump0.0
0.1
0.2
0.3
0.4
0.5
0.6*
Sh
ock
(m
A)
(b)
Figure 7: NL2KOmice have decreased
pain sensitivity and motor co-ordina-
tion. (a) NL2 KO mice exhibit a longer
latency to paw-lick than WT as measured
with the hot-plate sensitivity test. Legend
in (a) applies to panels (a)–(c). (b) Com-
pared with WT, NL2 KO mice exhibit an
increased shock threshold for eliciting
jumping behavior but a comparable shock
threshold for eliciting flinching and vocal-
izing. (c) NL2 KO mice have deficits in
motor co-ordination compared with WT
as measured on the accelerating rotarod.
(P < 0.0084).
1st Interaction 2nd Interaction0
10
20
30 ********
Tim
e In
tera
ctio
n (
s)
(c)
no m
ouse
mou
se
no m
ouse
mou
se0
100
200
300 * *
Tim
e In
tera
ctio
n (
s)
(a)
fam
ilar
nove
l
fam
ilar
nove
l0
100
200
300 * *
Tim
e In
tera
ctio
n (
s)
(b)
Figure 8: NL2 KO mice have normal
social behavior. (a) In a social vs. inani-
mate preference task, all mice showed
a significant preference for the social tar-
get, and the time spent interacting with
the social versus inanimate object was
unaffected by genotype. (b) In a preference
for social novelty task, all mice showed
a significant preference for the novel social
target, and the time spent with the novel
vs. familiar adult mouse did not differ
between the NL2 KO mice and WT. (c)
At day 1 (first interaction), NL2 KO mice
spent the same amount of time interacting
with a conspecific juvenile mouse as WT.
WT and NL2 KO mice spent significantly
less time interacting with the same juve-
nile 3 days hence (second interaction),
indicating significant social learning in WT
and NL2 KO mice.
124 Genes, Brain and Behavior (2009) 8: 114–126
Blundell et al.
triple KO mice compared with NL1, NL3 or NL1/3 KO miceas controls, exhibited a significant decrease in inhibitory
synaptic transmission using multiple electrophysiologicmeasures (Varoqueaux et al. 2006).
Despite a decrease in the density of VGAT-positive punctastained above threshold, we did not detect a decrease in
symmetric (presumed inhibitory) synapse density as meas-ured with EM in NL2 KO mice. Thus, our data indicate that
NL2 deletion likely causes a decrease in VGAT levels atindividual synapses. The lack of effect on synapse density
is consistent with results from NL3 R451C mutant mice(Tabuchi et al. 2007). In contrast to NL2 KO, NL3 R451C
mutant mice exhibit increased inhibitory synaptic staining andincreased inhibitory synaptic transmission; yet, this increase
in inhibition does not reflect an increase in inhibitory synapsedensity (Tabuchi et al. 2007). Tabuchi et al. (2007) concluded
that the R451C substitution in NL3 does not affect synapseformation, but appears to act downstream of synapse func-
tion to increase the average VGAT signal per synapse in NL3R451C mutant mice. Thus, alterations in NLs do not appear to
result in changes in synapse density but rather in changes insynapse function. Another possibility is that the NL2 deletion
results in a decrease in only a subset of inhibitory synapsesthat is too small to detect by EM in the larger population of
inhibitory synapses. Future studies examining the effect ofNL2 deletion (and NL3 R451C mutation) on specific subtypes
of inhibitory interneuron synapses will be necessary to
examine this possibility.
NL2 and behavior
Consistent with decreased inhibitory synaptic function, NL2KOmice demonstrate heightened anxiety-related behavior on
multiple measures. In particular, NL2 KOmice spent less timein the center and entered the center less often than controls
as measured in an open field. In addition, the NL2 KO miceexhibited increased latency to enter the light side, spent more
time in the dark side and crossed to the light side of the dark/light box less often than controls. Importantly, increased
anxiety-like behavior as seen in both tests was not becauseof alterations in locomotor activity. Generalized pharmaco-
logic manipulation of GABAA receptor function is known toalter anxiety levels (Dalvi & Rodgers 1996; Zarrindast et al.
2001), and GABAA-augmenting benzodiazepines are effectivein treating anxiety in humans. Thus, the increased anxiety in
NL2 KO mice is most likely referable to the decreasedinhibitory synaptic function.
In addition to increased anxiety, NL2 KO mice exhibitdifferences in nociception on two independent tasks. These
results are consistent with the role of GABAergic transmis-sion in pain pathways (Enna & McCarson 2006). In particular,
the GABA system, among others, plays a major role inmediating the analgesic action of morphine, a mu-opioid
agonist. Indeed, activation of mu-opioid receptors by mor-phine inhibits the release of GABA in many parts of the brain
(Stiller et al. 1996; Vaughan et al. 1997). Thus, it is notsurprising that deletion of NL2, which results in a decrease
in GABA function also causes decreased pain sensitivity.Given that rearrangements in regions that harbor NL2
genes (Konstantareas & Homatidis 1999; Zoghbi 2003),
mutations in NL3 and NL4 (Chih et al. 2004; Comoletti et al.2004; Jamain et al. 2003; Laumonnier et al. 2004; Yan et al.
2005) and mutations in the NL2-binding partner neurexin 1(Feng et al. 2006; Szatmari et al. 2007) have been implicated
in autism and decreased inhibition has been hypothesized tobe involved in human ASD (Rubenstein & Merzenich 2003),
we examined NL2 KO mice carefully for deficits in socialinteraction. NL2 KO mice show normal social behavior in
multiple measures. Thus, despite a link between the NL-binding partner neurexin-1 and autism, NL2 KO mice do not
display deficits in social behavior reminiscent of autism. Ofcourse, the absence of social interaction deficits in NL2 KO
mice with decreased inhibitory synaptic function does notmean that decreased inhibition cannot be associated with
autism or autism-relevant behavioral abnormalities. Indeed,increased anxiety is often an associated feature of ASDs.
Given the recent implication of neurexin-1 in ASD and theability of neurexins to bind to multiple NL isoforms including
NL2 (Boucard et al. 2005), NL2 KO behavioral abnormalitiesmay foreshadow a subset of neurexin-1 KO behavioral
abnormalities.Despite the dramatic increase in anxiety-like behavior, and
diminished nociception and motor co-ordination, NL2 KOmice exhibit normal locomotor activity, social interaction
and social learning. It is interesting that NL2 KO mice exhibitsuch selective abnormalities given the broad expression of
NL2 at inhibitory synapses throughout the brain. One might
predict that this is because of partial compensation by otherNL isoforms. However, as seen in Table 2, there was no
increase in NL1 or NL3 levels in NL2 KO mice. Indeed, therewere only very small overall changes of synaptic markers in
NL2 KOmice, suggesting that deletion of NL2 does not causea global change in the molecular composition of the brain.
Conclusions
Deletion of NL2 results in a decrease in inhibitory synapsefunction without a decrease in inhibitory synapse density.
This decrease in synaptic inhibition likely mediates theincreased anxiety-like behavior seen in NL2 KO mice and
may also contribute to decreased nociception and motorincoordination. Given that most published studies of NL
function have been carried out in culture, these studies ofthe role of NL in vivo represent a major advance in under-
standing the basic function of NLs
References
Boucard, A.A., Chubykin, A.A., Comoletti, D., Taylor, P. & Sudhof, T.C.(2005) A splice-code for trans-synaptic cell adhesion mediated bybinding of neuroligin 1 to a- and b-neurexins. Neuron 48, 229–236.
Budreck, E.C. & Scheiffele, P. (2007) Neuroligin-3 is a neuronaladhesion protein at GABAergic and glutamatergic synapses. Eur JNeurosci 26, 1738–1748.
Chih, B., Afridi, S.K., Clark, L. & Scheiffele, P. (2004) Disorder-associated mutations lead to functional inactivation of neuroligins,Hum Mol Genet 13, 1471–1477.
Chih, B., Engelman, H. & Scheiffele, P. (2005) Control of excitatoryand inhibitory synapse formation by neuroligins. Science 307,1324–1328.
Chubykin, A.A., Atasoy, D., Etherton, M.R., Brose, N., Kavalali, E.T.,Gibson, J.R. & Sudhof, T.C. (2007) Activity-dependent validation of
Genes, Brain and Behavior (2009) 8: 114–126 125
Increased anxiety-like behavior in mice
excitatory versus inhibitory synapses by neuroligin-1 versus neuro-ligin-2. Neuron 54, 919–931.
Comoletti, D., De Jaco, A., Jennings, L.L., Flynn, R.E., Gaietta, G.,Tsigelny, I., Ellisman, M.H. & Taylor, P. (2004) The Arg451Cysneuroligin-3 mutation associated with autism reveals a defect inprotein processing. J Neurosci 24, 4889–4893.
Dalvi, A. & Rodgers, R.J. (1996) GABAergic influences on plus-mazebehaviour in mice. Psychopharmacology (Berl) 128, 380–397.
Dean, C., Scholl, F.G., Choih, J., DeMaria, S., Berger, J., Isacoff, E. &Scheiffele, P. (2003) Neurexin mediates the assembly of presyn-aptic terminals. Nat Neurosci 6, 708–716.
Durand, C.M., Betancur, C., Boeckers, T.M. et al. (2007) Mutations inthe gene encoding the synaptic scaffolding protein SHANK3 areassociated with autism spectrum disorders. Nat Genet 39, 25–27.
Enna, S.J. &McCarson, K.E. (2006) The role of GABA in the mediationand perception of pain. Adv Pharmacol 54, 1–27.
Feng, J., Schroer, R., Yan, J., Song, W., Yang, C., Bockholt, A., Cook,E.H. Jr, Skinner, C., Schwartz, C.E. & Sommer, S.S. (2006) Highfrequency of neurexin 1beta signal peptide structural variants inpatients with autism. Neurosci Lett 409, 10–13.
Graf, E.R., Zhang, X., Jin, S.X., Linhoff, M.W. & Craig, A.M. (2004)Neurexins induce differentiation of GABA and glutamate post-synaptic specializations via neuroligins. Cell 119, 1013–1026.
Ichtchenko, K., Hata, Y., Nguyen, T., Ullrich, B., Missler, M., Moo-maw, C. & Sudhof, T.C. (1995) Neuroligin 1: a splice site-specificligand for beta-neurexins. Cell 81, 435–443.
Ichtchenko, K., Nguyen, T. & Sudhof, T.C. (1996) Structures, alterna-tive splicing, and neurexin binding of multiple neuroligins. J BiolChem 271, 2676–2682.
Jamain, S., Quach, H., Betancur, C., Rastam, M., Colineaux, C.,Gillberg, I.C., Soderstrom, H., Giros, B., Leboyer, M., Gillberg, C. &Bougeron, T. (2003) Mutations of the X-linked genes encodingneuroligins NLGN3 and NLGN4 are associated with autism. NatGenet 34, 27–29.
Jamain, S., Radyushkin, K., Hammerschmidt, K., Granon, S., Boretius,S., Varoqueaux, F., Ramanantsoa, N., Gallego, J., Ronnenberg, A.,Winter, D., Frahm, J., Fischer, J., Bourgeron, T., Ehrenreich, H. &Brose, N. (2008) Reduced social interaction and ultrasonic commu-nication in a mouse model of monogenic heritable autism. Proc NatlAcad Sci U S A 105, 1710–1715.
Konstantareas, M.M. & Homatidis, S. (1999) Chromosomal abnor-malities in a series of children with autistic disorder. J Autism DevDisord 29, 275–285.
Kwon, C.H., Luikart, B.W., Powell, C.M., Zhou, J.,Matheny,S.A., Zhang,W., Li, Y., Baker, S.J. & Parada, L.F. (2006) Pten regulates neuronalarborization and social interaction in mice. Neuron 50, 377–388.
Laumonnier, F., Bonnet-Brilhault, F., Gomot, M., Blanc, R., David, A.,Moizard, M.P., Raynaud, M., Ronce, N., Lemmonnier, E., Calvas, P.,Laudier, B., Chelly, J., Fryns, J.P., Ropers, H.H., Hamel, B.C.,Andres, C., Barthelemy, C., Moraine, C. & Briault, S. (2004) X-linkedmental retardation and autism are associated with a mutation in theNLGN4 gene, a member of the neuroligin family. Am J Hum Genet74, 552–557.
Levinson, J.N., Chery, N., Huang, K., Wong, T.P., Gerrow, K., Kang,R., Prange, O., Wang, Y.T. & El-Husseini, A. (2005) Neuroliginsmediate excitatory and inhibitory synapse formation: involvementof PSD-95 and neurexin-1beta in neuroligin-induced synaptic speci-ficity. J Biol Chem 280, 17312–17319.
Meyer, G., Varoqueaux, F., Neeb, A., Oschlies, M. & Brose, N. (2004)The complexity of PDZ domain-mediated interactions at glutama-tergic synapses: a case study on neuroligin. Neuropharmacology47, 724–733.
Moy, S.S. Nadler, J.J., Perez, A., Barbaro, R.P., Johns, J.M.,Magnuson, T.R., Piven, J. & Crawley, J.N. (2004) Sociability and
preference for social novelty in five inbred strains: an approach toassess autistic-like behavior in mice. Genes Brain Behav3, 287–302.
Nadler, J.J., Moy, S.S., Dold, G., Trang, D., Simmons, N., Perez, A.,Young, N.B., Barbaro, R.P., Piven, J., Magnuson, T.R. & Crawley,J.N. (2004) Automated apparatus for quantitation of social approachbehaviors in mice. Genes Brain Behav 3, 303–314.
Nam, C.I. & Chen, L. (2005) Postsynaptic assembly induced byneurexin-neuroligin interaction and neurotransmitter. Proc NatlAcad Sci U S A 102, 6137–6142.
Powell, C.M., Schoch, S., Monteggia, L., Barrot, M., Matos, M.F.,Feldmann, N., Sudhof, T.C. & Nestler, E.J. (2004) The presynapticactive zone protein RIM1alpha is critical for normal learning andmemory. Neuron 42, 143–153.
Prange, O., Wong, T.P., Gerrow, K., Wang, Y.T. & El-Husseini, A.(2004) A balance between excitatory and inhibitory synapses iscontrolled by PSD-95 and neuroligin. Proc Natl Acad Sci U S A101, 13915–13920.
Rubenstein, J.L. & Merzenich, M.M. (2003) Model of autism:increased ratio of excitation/inhibition in key neural systems. GenesBrain Behav 2, 255–267.
Song, J.Y., Ichtchenko, K., Sudhof, T.C. & Brose, N. (1999) Neuroligin1 is a postsynaptic cell-adhesion molecule of excitatory synapses.Proc Natl Acad Sci U S A 96, 1100–1105.
Stiller, C.O., Bergquist, J., Beck, O., Ekman, R. & Brodin, E. (1996)Local administration of morphine decreases the extracellular levelof GABA in the periaqueductal gray matter of freely moving rats.Neurosci Lett 209, 165–168.
Szatmari, P., Paterson, A.D., Zwaigenbaum, L. et al. (2007) Mappingautism risk loci using genetic linkage and chromosomal rearrange-ments. Nat Genet 39, 319–328.
Tabuchi, K., Blundell, J., Etherton, M.R., Hammer, R.E., Liu, X.,Powell, C.M. & Sudhof, T.C. (2007) A neuroligin-3 mutationimplicated in autism increases inhibitory synaptic transmission inmice. Science 318, 71–76.
Varoqueaux, F., Jamain, S. & Brose, N. (2004) Neuroligin 2 isexclusively localized to inhibitory synapses. Eur J Cell Biol83, 449–456.
Varoqueaux, F., Aramuni, G., Rawson, R.L., Mohrmann, R., Missler,M., Gottmann, K., Zhang, W., Sudhof, T.C. & Brose, N. (2006)Neuroligins determine synapse maturation and function. Neuron51, 741–754.
Vaughan, C.W., Ingram, S.L., Connor, M.A. & Christie, M.J. (1997)How opioids inhibit GABA-mediated neurotransmission. Nature390, 611–614.
Yan, J., Oliveira, G., Coutinho, A., Yang, C., Feng, J., Katz, C., Sram, J.,Bockholt, A., Jones, I.R., Craddock, N., Cook, E.H. Jr., Vicente, A. &Sommer, S.S. (2005) Analysis of the neuroligin 3 and 4 genes inautism and other neuropsychiatric patients. Mol Psychiatry10, 329–332.
Zarrindast, M., Rostami, P. & Sadeghi-Hariri, M. (2001) GABA(A) butnot GABA(B) receptor stimulation induces antianxiety profile in rats.Pharmacol Biochem Behav 69, 9–15.
Zoghbi, H.Y. (2003) Postnatal neurodevelopmental disorders: meetingat the synapse? Science 302, 826–830.
Acknowledgements
The study was supported by grants from Autism Speaks (toC.M.P.) and the National Institute of Mental Health (MH065975-05 to C.M.P. and R37 MH52804-08 to T.C.S.), and gifts from theCrystal Charity Ball and the Hartwell Foundation (to C.M.P).
126 Genes, Brain and Behavior (2009) 8: 114–126
Blundell et al.