a study of differently expressed brain genes for …ipcbee.com/vol34/004-icbet2012-b012.pdf · a...
TRANSCRIPT
17
A Study of Differently Expressed Brain Genes for Calcium Channel Gene Knockout and Wild-Type Mice by Statistical and Hierarchical
Clustering
Jui-Ming Chen1,2, Ya-Chun Tang3, Utpala Shrestha5, Meng-Hsiun Tsai 3,4+,
and Sheng-Hsiung Chiu6 1Department of Endocrinology and Metabolism, Tungs’ Taichung MetroHarbor Hospital Taiwan, R.O.C
2Department of Biomedical informatics, Asia University Taiwan, R.O.C 3Department of Management Information Systems, National Chung Hsing University Taiwan, R.O.C
4Institute of Genomics and Bioinformatics, National Chung Hsing University Taiwan, R.O.C 5Department of Medicine-Dermatology University of California San Diego, U.S.A
6Troilus Bio-technology Co. Ltd Taiwan, R.O.C
Abstract. Brain science research becomes an important issue because there are still many unknown mystery in the human brain. The researchers make efforts to answer the questions of how are the functions of these learning and memory genes from human brain. Presently, microarray is the most mature technology of studying whole genome from specific organs, and hoping to discover new marker genes from them. Consequently, the data used in this paper are microarray data obtained from the α1H T-type calcium channel with gene knockout mice. It was proven by experiments that the express of calcium channel was very high with hippocampus. And hippocampus is related to situated learning and spatial memory. The main purpose of this paper is to select some target genes related to learning, memory, or brain diseases in order to perform follow-up verification with these genes. In this paper, a new selection brain learning and memory maker genes analysis system is proposed. At first, by using linear regression analysis to select up-regulated and down-regulated genes, and then using analysis of variance (ANOVA) to detect genetic differences between these genes. We take these genes as input variables for unsupervised classification models (Hierarchical clustering) to find successful clustering result. The accurate rate of this Hierarchical clustering obtained in this experiment are100%. These select marker genes can be used for further research in brain science by biological evolution. This paper also provides a friendly user graphic interface systems for visualization. Thus, it also provides an useful information for biological experiments to comparison with.
Keywords: Microarray, learning, memory, calcium channel, hierarchical clustering, marker genes
1. Introduction For human beings, brain is the center to sustain lives, to think, to learn, and to generate emotions.
Together with 10 billion neural cells, which are called neurons, a brand forms a control center for the nervous system. Besides, a human brain weights only 1400 g [1]. But it can control and coordinate actions, stability of body statuses (e.g. heart rate, blood pressure, and body temperature), and mental activities (e.g. cognition, emotion, memory, and learning).
Now in the field of brain science, there are still a lot of unknown issues. Besides treatments for brain-related diseases, development of whole brain wisdom is also a hot topic in modern brain science researches because only less than 10% (about 5%) of human brain power is used.
+ Corresponding author. Tel.: +886-4-22840864 ; fax: +886-4-2285173 E-mail address: [email protected] (Meng-Hsiun Tsai)
2012 2nd International Conference on Biomedical Engineering and Technology IPCBEE vol. 34 (2012) © (2012) IACSIT Press, Singapore
18
In the central nervous system, the calcium channel plays an important role in the process of synaptic transmission [2]. It is proved by experiments that the express of calcium channel is very high with hippocampus [3]. And hippocampus is related to situated learning and spatial memory. It is obvious that in case of abnormal structure or function of the calcium channel, the organ structure of brain synapse may be disordered, resulting in abnormal neurological symptoms. Therefore, mutated gene screening is very important for patients with mutated genes. Therefore, we wish to select some marker genes related to learning, memory, or brain diseases in order to perform follow-up verification with these genes, in hopes of further contributing to exploring the relationships between human diseases and physiology.
In this paper, some mathematical methods are used as tools to study and analyze microarray data. Then hierarchical clustering is applied to select genes that find out if it can be well clustered. And a graphic interface system is designed for users to conduct an analysis conveniently and rapidly.
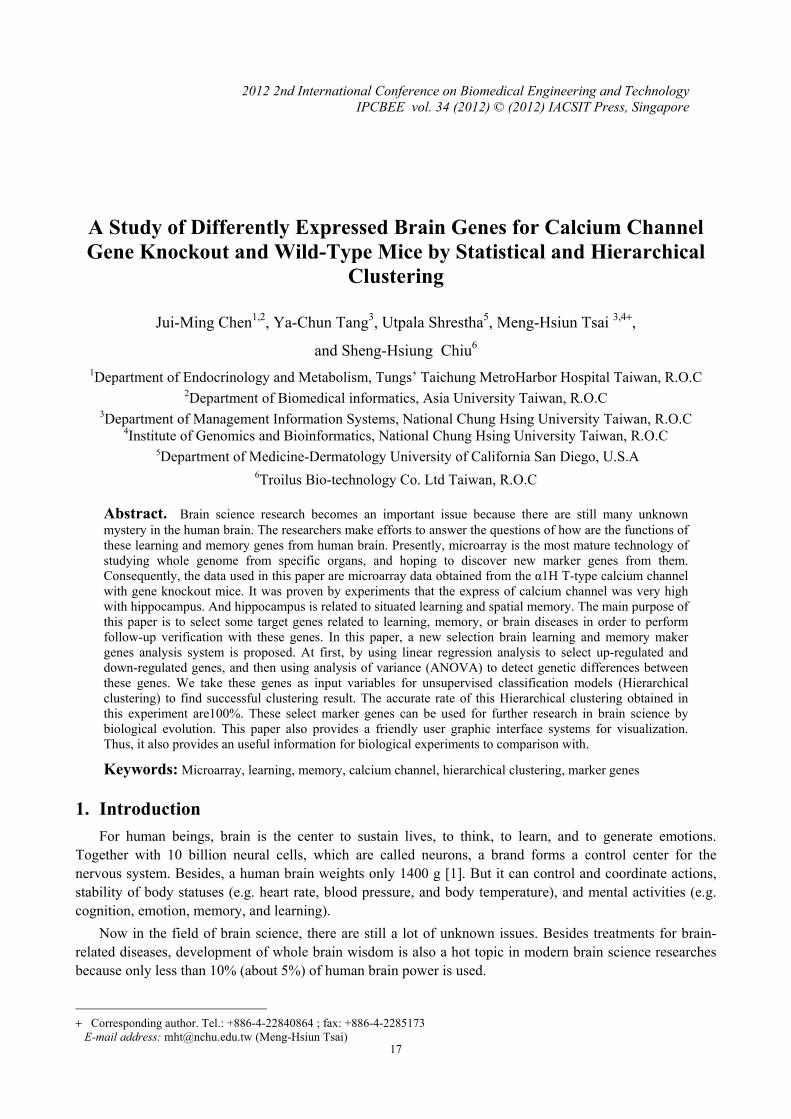
2. Methods The proposed methods consist of five stages in this paper:data loading, linear regression, ANOVA, and
unsupervised model analysis (hierarchical clustering) and validation. Linear regression is applied to reduce the number of dimensions of the data. ANOVA is applied to find marker genes. After using ANOVA to find the marker genes, we use unsupervised model to check and verify the result is correct or not. The work-flow chart is shown in Fig. 1
2.1. Data Analysis In this paper different experimental mice which are the Cav3.2α1H type in combination with gene
knockout (Cav3.2-/-) (KO) and wild-type (WT) mice are been chosen to perform experiments about learning effectiveness, in order to verify the important role calcium channels play in learning aspects for organisms. The data of this paper used is shown in Table 1.
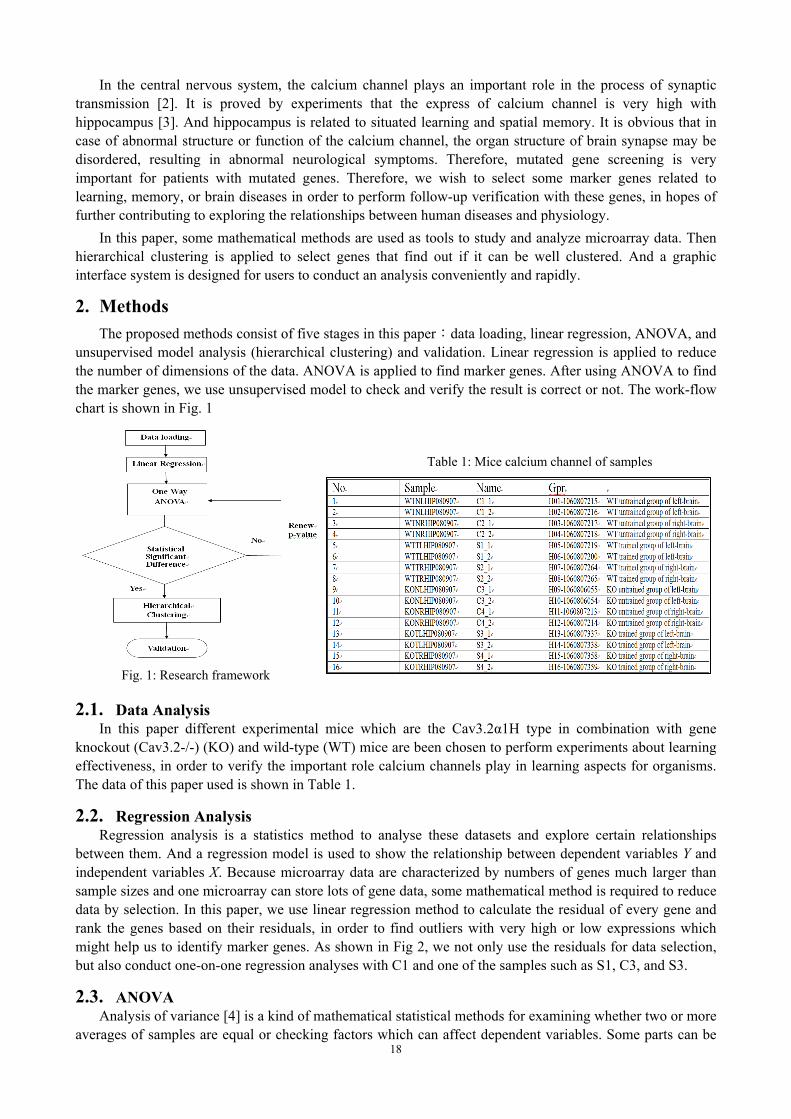
2.2. Regression Analysis Regression analysis is a statistics method to analyse these datasets and explore certain relationships
between them. And a regression model is used to show the relationship between dependent variables Y and independent variables X. Because microarray data are characterized by numbers of genes much larger than sample sizes and one microarray can store lots of gene data, some mathematical method is required to reduce data by selection. In this paper, we use linear regression method to calculate the residual of every gene and rank the genes based on their residuals, in order to find outliers with very high or low expressions which might help us to identify marker genes. As shown in Fig 2, we not only use the residuals for data selection, but also conduct one-on-one regression analyses with C1 and one of the samples such as S1, C3, and S3.
2.3. ANOVA Analysis of variance [4] is a kind of mathematical statistical methods for examining whether two or more
averages of samples are equal or checking factors which can affect dependent variables. Some parts can be
Fig. 1: Research framework
Table 1: Mice calcium channel of samples
19
divided according to the sources from data variation and every part can be classified to a source of variation. By examining these different sources of variations, we can understand whether there are significant differences in all kinds of variations. If differences exist, it means the sources from variations can influence data actually. In this paper, we use one-way ANOVA analysis to examine marker genes when there is difference between the samples, and we apply F-test to set a p-value as a benchmark for screening. If p-value gets smaller, then the confidence level gets higher.
Fig. 2: Linear regression analysis results
2.4. Hierarchical Clustering Hierarchical clustering [5] is one of unsupervised clustering methods. It is based on a hierarchical
structure to divide or agglomerate data over and over. The most important part of this algorithm is to calculate distances between data points and those between clusters. Hierarchical clustering can be categorized into agglomerative and divisive clustering based on analysis steps. This study used agglomerative clustering. Agglomerative clustering begins from the bottom of a tree structure and agglomerate data level by level. At first, each data point is considered as a cluster. And the closest clusters are merged into a new cluster. From bottom up, this agglomerative method creates a nest structure. The agglomeration stops when the expected number of clusters is reached.
2.5. Results In this paper, we group data into 4 types (Table 2). Different issues are explored for different clusters. It
is also hoped that relation between clusters can be found.
Table 2: Classification results of samples 1.WT trained group of left-brain
WT untrained group of left-brain
2.WT trained group of left-brain
KO trained group of left-brain
3. KO trained group of left-brain
KO untrained group of left-brain
4. WT untrained group of left-brain
KO untrained group of left-brain
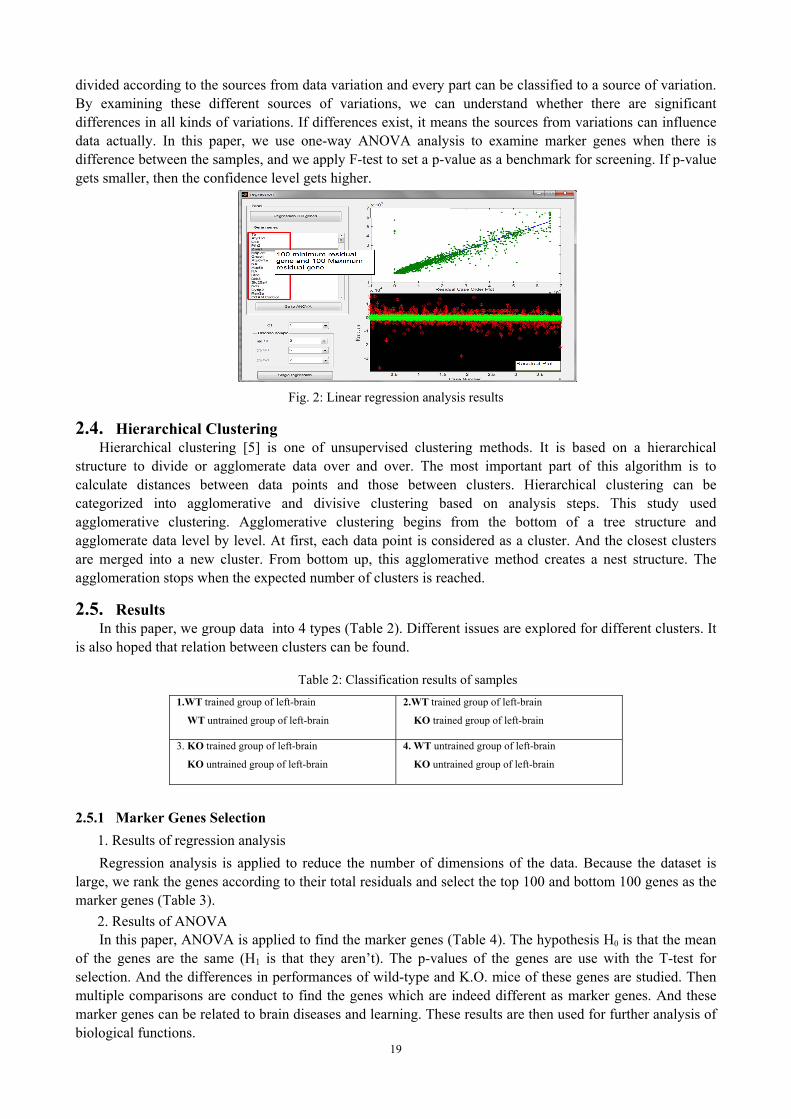
2.5.1 Marker Genes Selection 1. Results of regression analysis Regression analysis is applied to reduce the number of dimensions of the data. Because the dataset is
large, we rank the genes according to their total residuals and select the top 100 and bottom 100 genes as the marker genes (Table 3).
2. Results of ANOVA In this paper, ANOVA is applied to find the marker genes (Table 4). The hypothesis H0 is that the mean
of the genes are the same (H1 is that they aren’t). The p-values of the genes are use with the T-test for selection. And the differences in performances of wild-type and K.O. mice of these genes are studied. Then multiple comparisons are conduct to find the genes which are indeed different as marker genes. And these marker genes can be related to brain diseases and learning. These results are then used for further analysis of biological functions.
20
Table 3: Ranking of the top 20 selective marker genes (parts list of marker genes)
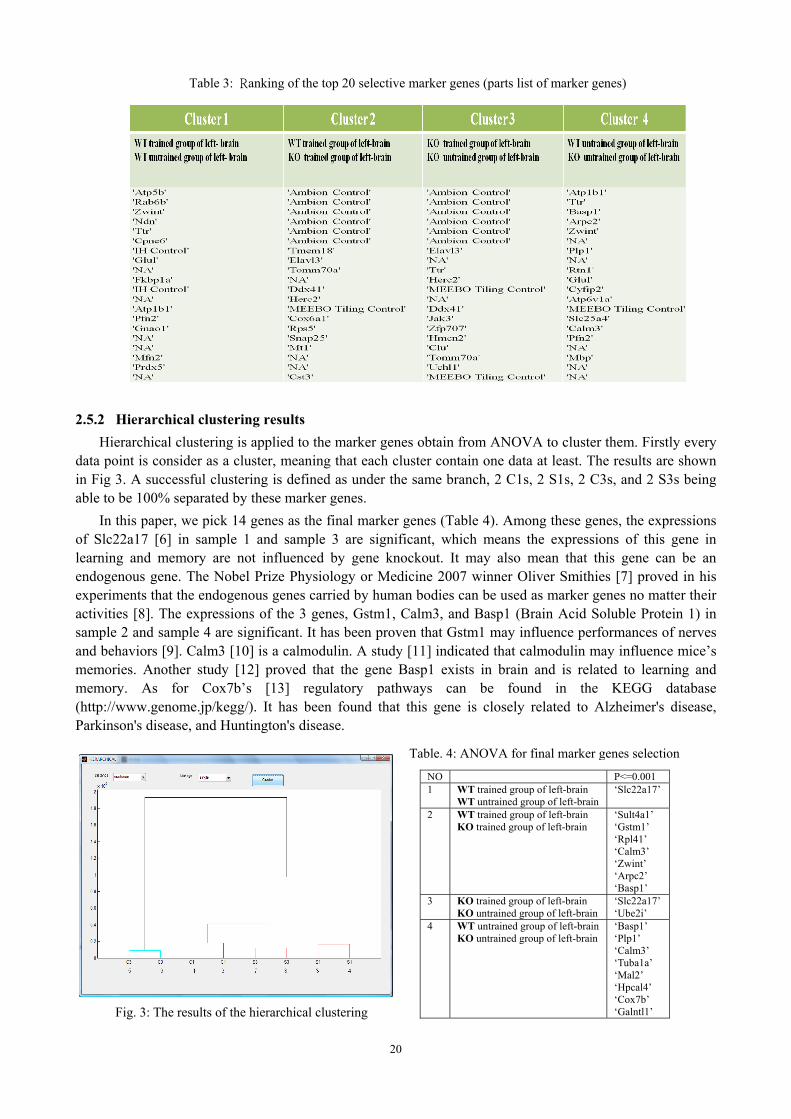
2.5.2 Hierarchical clustering results Hierarchical clustering is applied to the marker genes obtain from ANOVA to cluster them. Firstly every
data point is consider as a cluster, meaning that each cluster contain one data at least. The results are shown in Fig 3. A successful clustering is defined as under the same branch, 2 C1s, 2 S1s, 2 C3s, and 2 S3s being able to be 100% separated by these marker genes.
In this paper, we pick 14 genes as the final marker genes (Table 4). Among these genes, the expressions of Slc22a17 [6] in sample 1 and sample 3 are significant, which means the expressions of this gene in learning and memory are not influenced by gene knockout. It may also mean that this gene can be an endogenous gene. The Nobel Prize Physiology or Medicine 2007 winner Oliver Smithies [7] proved in his experiments that the endogenous genes carried by human bodies can be used as marker genes no matter their activities [8]. The expressions of the 3 genes, Gstm1, Calm3, and Basp1 (Brain Acid Soluble Protein 1) in sample 2 and sample 4 are significant. It has been proven that Gstm1 may influence performances of nerves and behaviors [9]. Calm3 [10] is a calmodulin. A study [11] indicated that calmodulin may influence mice’s memories. Another study [12] proved that the gene Basp1 exists in brain and is related to learning and memory. As for Cox7b’s [13] regulatory pathways can be found in the KEGG database (http://www.genome.jp/kegg/). It has been found that this gene is closely related to Alzheimer's disease, Parkinson's disease, and Huntington's disease.
NO P<=0.001 1 WT trained group of left-brain
WT untrained group of left-brain ‘Slc22a17’
2 WT trained group of left-brain KO trained group of left-brain
‘Sult4a1’ ‘Gstm1’ ‘Rpl41’ ‘Calm3’ ‘Zwint’ ‘Arpc2’ ‘Basp1’
3 KO trained group of left-brain KO untrained group of left-brain
‘Slc22a17’‘Ube2i’
4 WT untrained group of left-brain KO untrained group of left-brain
‘Basp1’ ‘Plp1’ ‘Calm3’ ‘Tuba1a’ ‘Mal2’ ‘Hpcal4’ ‘Cox7b’ ‘Galntl1’ Fig. 3: The results of the hierarchical clustering
Table. 4: ANOVA for final marker genes selection

21
2.6. Conclusion In this paper, we use microarray data of different sample sizes and apply unsupervised method
(Hierarchical clustering), in order to find the genes related to memory and learning of brain. In fact, regulatory mechanisms of living creatures in nature cannot be linear relationships. Sometimes, there are inhibiting, promotion, and feedback mechanisms to control balances of biological functions. However, once balance of a controlling mechanism inside an organism is gone, diseases may develop. Therefore, we hope that in the future this research method can be use to handle larger datasets of regulatory performances and that gene regulatory pathways can be found efficiently with understanding of directions and strengths of gene regulation, so that the relationship between calcium channels and learning and memory of brain can be studied further.
3. Acknowledgements The authors would like to thank the reviewers for their valuable suggestions and comments that are
helpful to improve the content and quality for this paper. This paper is supported by the National Science Council of Taiwan, ROC, under the contract of 99-2221-E-005-067 and the National Chung Hsing University of Taiwan, ROC, under the contract of 100S0610.
4. References [1] A.S. Dekaban, D. Sadowsky. Changes in brain weights during the span of human life: relation of brain weights to
body heights and body weights Ann. Neurol., 1978, 4: 345-356.
[2] A. B. Parekh and J.W. Putney. Store-operated calcium channels. Physiol Rev. 2005, 85(2): 757-810.
[3] J.W. Shen. Hippocampal-dependent learning of mice deficient in α1H T-type calcium channel. Tzu Chi University Master Thesis. 2007.
[4] R.V. Hogg and J. Ledolter. Engineering Statistics. MacMillan Publishing Company press, 1987.
[5] A. K. Virmani, J. A. Tsou, K.D. Siegmund, L.Y.C. Shen, T. I. Long, P.W. Laird, A. F. Gazdar, and I. A. Laird-Offringa. Hierarchical clustering of lung cancer cell lines using DNA methylation markers. Cancer Epidemiology, Biomarkers & Prevention. 2002, 11: 291-297.
[6] J. P. Carson, et al. A transcriptome atlas of the mouse brain at cellular resolution. Current Opinion in Neurobiology. 2002, 12: 562-565.
[7] O. Smithies. The Nobel prize in physiology or medicine 2007. The Nobel Foundation. Retrieved, 2007.
[8] O. Smithies, R. G. Gregg, S. S. Boggs, M. A. Koralewski, and R. S. Kucherlapati. Insertion of DNA sequences into the human chromosomal beta-globin locus by homologous recombination. Nature. 1985, 317 (6034): 230-234.
[9] C. L. Yochum, et al. Animal model of autism using GSTM1 knockout mice and early post-natal sodium valproate treatment. Behavioural Brain Research. 2010, 210(2): 202-210.
[10] J. Kim, L. Ashworth, E. Branscomb, and L. Stubbs. The human homolog of a mouse-imprinted gene, Peg3, maps to a zinc finger gene-rich region of human chromosome 19q13.4. Genome Research . 1997, 7(5): 532-540.
[11] K. Limbäck-Stokin, E. Korzus, R. N. Yasuda, and M. Mayford. Nuclear calcium/calmodulin regulates memory consolidation. The Journal of Neuroscience. 2004, 24(48): 10858-10867.
[12] M. Mosevitsky and I. Silicheva. Subcellular and regional location of "brain" proteins BASP1 and MARCKS in kidney and testis. Acta Histochemica. 2011, 113(1): 13-18.
[13] D. J. Pagliarini et al. A mitochondrial protein compendium elucidates complex I disease biology. Cell, 2008, 134(1): 112-123.