gene profiling, clustering, and...
TRANSCRIPT

IEEE ICASSP Plenary 20051
Gene Profiling, Clustering, and Networking
Alfred O. Hero IIIUniversity of Michigan, Ann Arbor, MI
http://www.eecs.umich.edu/~hero
Mar. 2005
1. Genomics, transcriptomics and gene microarrays2. Preprocessing of gene microarray data3. Screening differentially expressed genes4. Clustering gene co-regulation patterns5. Conclusions
IEEE ICASSP Plenary 20052
Acknowledgements! Anand Swaroop, Ophthalmology, UM! David States, Bioinformatics, UM! Alan Mears, Univ Ottawa (CA)! Gilles Fleury, ESE, France! Debashis Ghosh, Biostatistics, UM! Terry Speed, Statistics, UCB! Jindan Yu, BME, UM ! Dongxiao Zhu, Bioinformatics, UM! Yuezhou Jing, Dept. Statistics, UM

IEEE ICASSP Plenary 20053
Some Biological Questions! What is genetic basis for photoreceptor development, aging, and
degeneration?! What are patterns of gene expression in the retina over time?
! What genes mediate development of rods and cones?

IEEE ICASSP Plenary 20054
http://www-stat.stanford.edu/~susan/courses/s166/node2.html
1. Genomics, Transcriptomics and Gene Microarrays
http://www.genome.gov/

IEEE ICASSP Plenary 20055
Transcriptomics: Gene expression profiling
What is pattern of gene activation/inactivationover time, tissue, therapy, etc?
2 fold change 1 fold change
Time 1 Time 2 Time 3 (t)
Abu
ndan
ce (f
c)
fc_t(g)

IEEE ICASSP Plenary 20056
Discovery of Genetic CircuitsHow do genes regulate (activate/inhibit) each other’s expression levels over time?
Gene A Gene BActivation
Inhibition
Gene A
Gene B
Abu
ndan
ce (f
c)
t

IEEE ICASSP Plenary 20057
Discovery of Genetic PathwaysWhat sequence of gene interactions lead to a specific metabolic/structural (dys)function
Gene A Gene B Gene C Gene D
IEEE ICASSP Plenary 20058
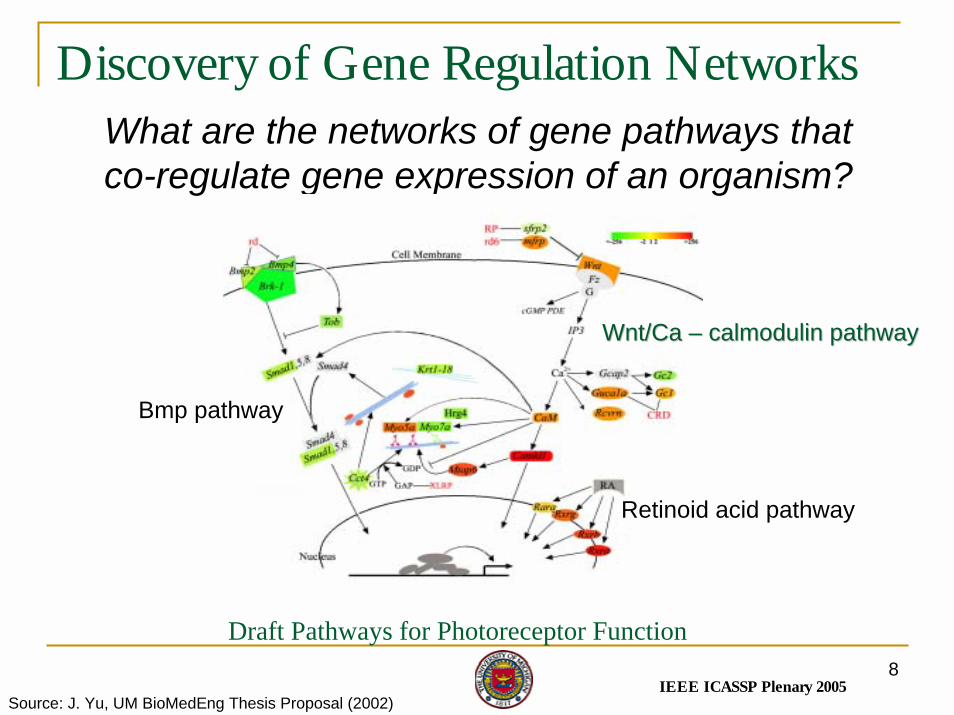
Discovery of Gene Regulation NetworksWhat are the networks of gene pathways that co-regulate gene expression of an organism?
WntWnt/Ca /Ca –– calmodulincalmodulin pathwaypathway
Retinoid acid pathway
Bmp pathway
Draft Pathways for Photoreceptor Function
Source: J. Yu, UM BioMedEng Thesis Proposal (2002)

IEEE ICASSP Plenary 20059
Experimental Design for Structure Discovery
! Treatment level experiments: aging, starvation, drugs! Gene knockout experiments: create a mutant organism
! Issues: " For a network of G genes require 2^G knockouts per time point
to explore full co-regulation network." Experimental replication is necessary (“large p small n”)" There are other factors affecting gene expression: co-
expression level,environment, protein-protein interactions…
Gene A Gene B Gene C Gene D

IEEE ICASSP Plenary 200510
Fundamental probing tool: hybridization

IEEE ICASSP Plenary 200511
Gene Microarrays
! Two principal gene microarray technologies:" Oligonucleotide arrays: (Affymetrix GeneChips)
! Matched and mismatched oligonucleotide probe sequences photoetched on a chip
! Dye-labeled RNA from sample is hybridized to chip! Abundance of RNA bound to each probe is laser-scanned
" cDNA spotted arrays: (Brown/Botstein)! Specific complementary DNA sequences arrayed on slide! Dye-labeled sample mRNA is hybridized to slide! Presence of bound mRNA-cDNA pairs is read out by laser scanner
! 10,000-50,000 genes can be probed simultaneously

IEEE ICASSP Plenary 200512
Oligonucleotide GeneChip (Affymetrix)
Fleury&etal:ICASSP (2001)
Probe set
Two PM/MM Probe sets
www.tmri.org/gene_exp_web/ oligoarray.htm
PMMM
PMMM

IEEE ICASSP Plenary 200513
cDNA spotted array
• Treated sample (ko) labeled red (Cy5)• Control (wt) labeled green (Cy3)

IEEE ICASSP Plenary 200514
Add Treatment Dimension: Expression Profiles
Probe response profiles

IEEE ICASSP Plenary 200515
Sources of Experimental Variability! Population – wide genetic diversity! Cell lines - poor sample preparation ! Slide Manufacture – slide surface quality, dust
deposition! Hybridization – sample concentration, wash conditions! Cross hybridization – similar but different genes bind to
same probe! Image Formation – scanner saturation, lens
aberrations, gain settings! Imaging and Extraction – misaligned spot grid,
segmentationMicroarray data is intrinsically statistical and
replication is necessary.Churchill (2002)
IEEE ICASSP Plenary 200516
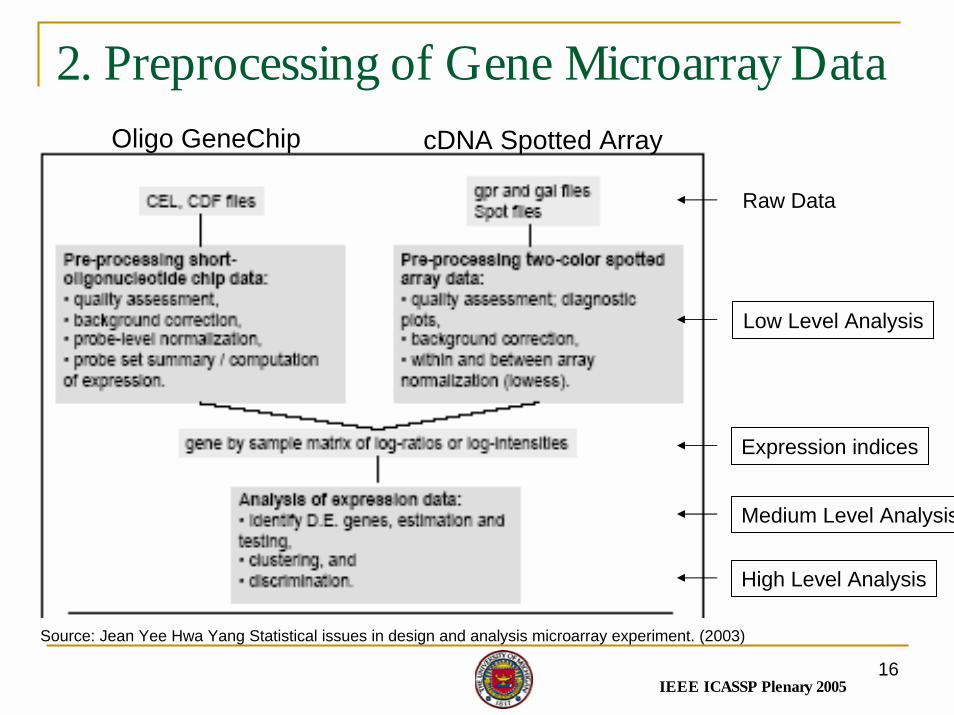
2. Preprocessing of Gene Microarray DataOligo GeneChip cDNA Spotted Array
Expression indices
Medium Level Analysis
High Level Analysis
Low Level Analysis
Raw Data
Source: Jean Yee Hwa Yang Statistical issues in design and analysis microarray experiment. (2003)

IEEE ICASSP Plenary 200517
Image Processing: cDNA Spot Extraction! Addressing – Locate “center of description” for each spot! Spot Segmentation – Classification of pixels either as signal
or background. ! Spot Quantification – Estimation of hybridization level/ratio
of spot
Grid misalignment Laser Misalignment
Source: C. Ball, Stanford Microarray Database
Refs: Spotfire, ScanAnalyze, GenePix,Quantarray, Spot

IEEE ICASSP Plenary 200518
Spot Segmentation
! Threshold based! Boundary based
" Fixed circle" Adaptive circle (used in QuantArray)" Fixed Spot Mask (used in ScanAlyze)
! Region based" Seeded Region Growing (used in Spot)
! Active contours: level set algorithms! Morphological operators: watershed segmentation

IEEE ICASSP Plenary 200519
Segmentation via Morphological Operators
Alternate-Sequential FilteredOriginal Image
Final Segmented ImageWatershed Transformed
Ref: Siddiqui&etal:Asilomar-02

IEEE ICASSP Plenary 200520
A vs B Microarray Normalization
Inverse
Mean
Mean
Inverse
UnifTran
UnifTran
HousekeepingGene
Selector
Normalized A
Normalized B
Exp B
Exp A

IEEE ICASSP Plenary 200521
Pooled Microarray Normalization
Graphs are generated using R plot function hist() and boxplot()
Data: Lemon WJ et al. 2002

IEEE ICASSP Plenary 200522
Post-Normalization Histogram
Graphs are generated using R plot function hist() and boxplot()
Data: Lemon WL et al. 2002

IEEE ICASSP Plenary 200523
Extracting Expression Indices! Each probe response level in microarray can be
modeled via general mixed model
! g=gene probe index, t=timepoint, r=replicate ! is fixed effect! is random effect that may correlate t,g! is noise component! Special cases: MAS5, DChip, RMA. SMA, GEE! Model similar to those used in array signal processing,
statistical imaging, and other SP applications.
IEEE ICASSP Plenary 200524
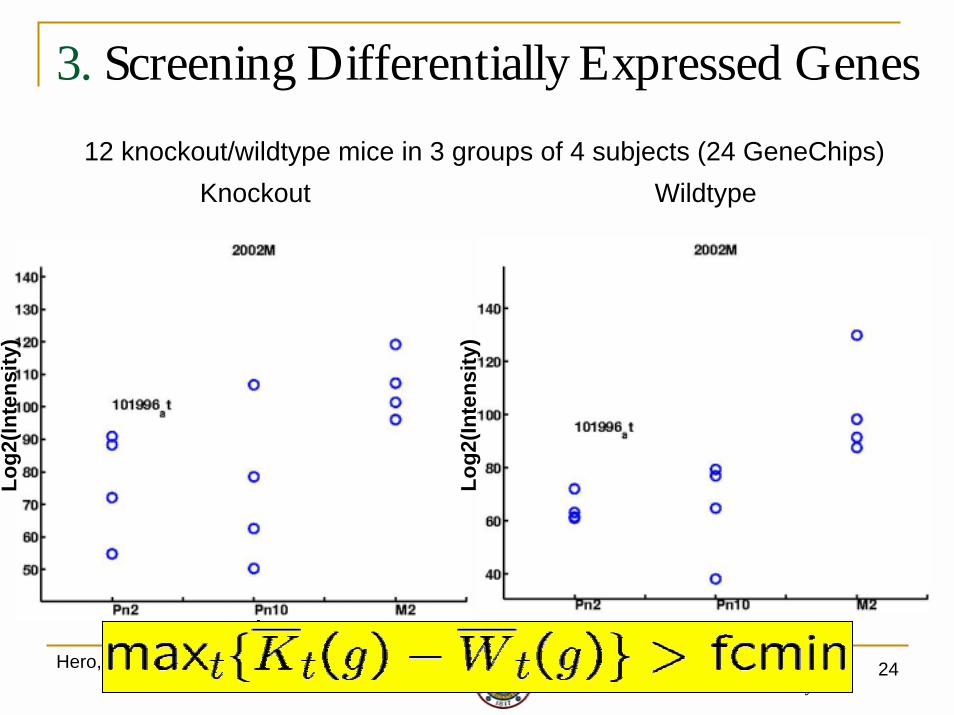
3. Screening Differentially Expressed Genes12 knockout/wildtype mice in 3 groups of 4 subjects (24 GeneChips)
Knockout Wildtype
time timeHero,Fleury,Mears,Swaroop:JASP2003
Log2
(Inte
nsity
)
Log2
(Inte
nsity
)

IEEE ICASSP Plenary 200525
Biological vs Statistical Significance
! Biological significance refers to foldchangebeing sufficiently large to be biologically meaningful or testable, e.g. testable by RT-PCR
! Statistical significance refers to foldchangebeing different from zero
Hero,Fleury,Mears,Swaroop:JASP2003
IEEE ICASSP Plenary 200526
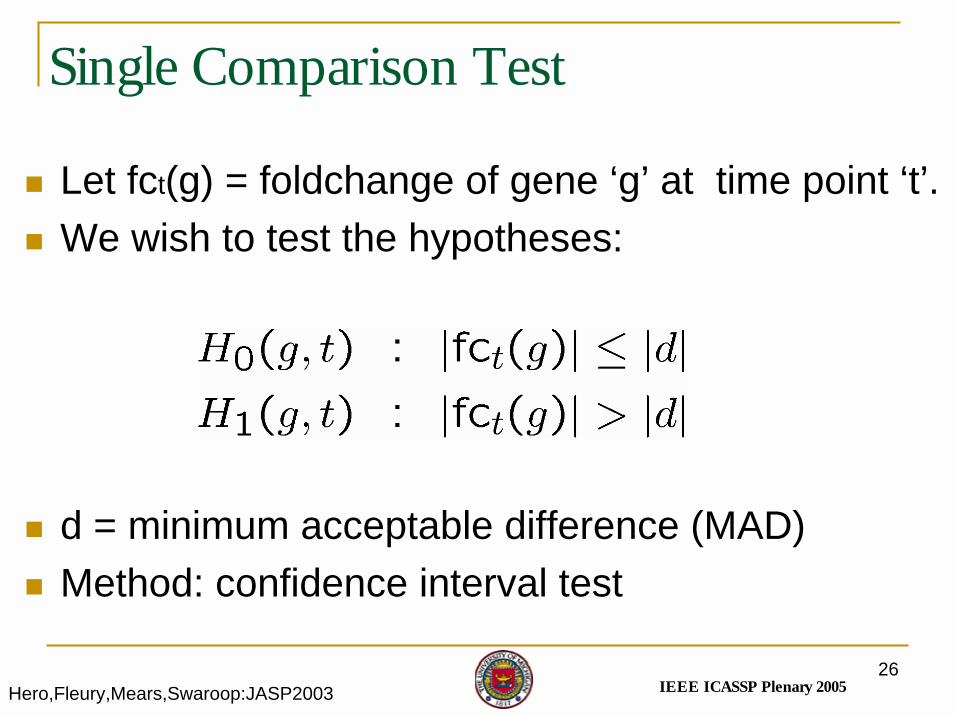
Single Comparison Test
! Let fct(g) = foldchange of gene ‘g’ at time point ‘t’. ! We wish to test the hypotheses:
! d = minimum acceptable difference (MAD)! Method: confidence interval test
Hero,Fleury,Mears,Swaroop:JASP2003

IEEE ICASSP Plenary 200527
Confidence Interval Test: Single Comparison! Biologically&statistically significant differential response
at 10% level of significance
][d
Conf. Interval on of level 1-alpha
0

IEEE ICASSP Plenary 200528
Confidence Interval Test: Single Comparison! Statistically significant but biologically insignificant fc
][d
Conf. Interval on of level 1-alpha
0

IEEE ICASSP Plenary 200529
Multiple Comparisons: FWER, FDR! Pvalue, CI apply to single comparison:
! FWER, FDR and FDRCI depend on {T(g), g=1, … G}." FWER: familywise error rate
! Avg number of experiments yielding at least one false positive
" FDR: false discovery rate (Benjamini&Hochburg:1996)! Avg proportion of false positives in experiments
" FDRCI: (1-α) CI on discovered fc (Benjamini&Yekutieli:2002)! Avg. proportion of CIs that cover true fc in a given experiment
g
False positive

IEEE ICASSP Plenary 200530
Sorted FDRCI pvalues for ko/wt study
Ref: Hero&etal:JASP03
α=0.2
Filtered genes at level (FDR=0.2,fc=0.32)

IEEE ICASSP Plenary 200531
Screening Gene Expression Profiles! Max foldchange is only one possible criterion of interest! Objective: find the 250-300 genes having the most
significant foldchanges wrt multiple criteria! Example: Retinal aging study
Monotonic?
Large end-to-endfoldchange?

IEEE ICASSP Plenary 200532
Multi-objective Optimization Approach
! Rarely does a linear order exist with respect to more than one ranking criterion, as in
! However, a partial order is usually possible

IEEE ICASSP Plenary 200533
Illustration: two extreme cases
! No linear ordering exists! A linear ordering exists
ξ2 ξ2Optimum
ξ1

IEEE ICASSP Plenary 200534
Pareto Front Analysis (PFA)
! Rank genes by peeling of successive Pareto Fronts
ts of non-dominated genes
Pareto fron
ξ2
Hero&Fleury:VLSI04
IEEE ICASSP Plenary 200535
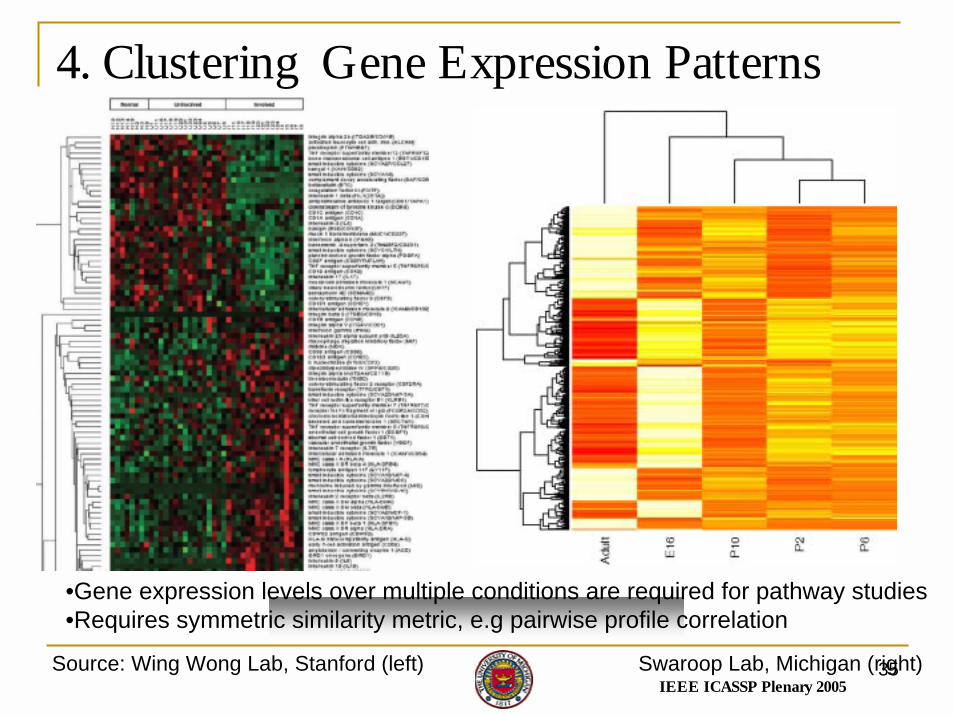
4. Clustering Gene Expression Patterns
•Gene expression levels over multiple conditions are required for pathway studies•Requires symmetric similarity metric, e.g pairwise profile correlation
Source: Wing Wong Lab, Stanford (left) Swaroop Lab, Michigan (right)

IEEE ICASSP Plenary 200536
Drawback of Traditional Clustering! Clustering using pairwise correlation fails to
account for transitive co-expression (Zhou etal 2002)
RPS21ARPS29B
RPS29A
RPL37BRPL37A
RPL29

IEEE ICASSP Plenary 200537
Extraction of Co-Regulation CircuitsGene C
Gene B
Gene A
Gene D
??
Gene A Gene B Gene C Gene D

IEEE ICASSP Plenary 200538
Modeling co-Regulation Networks
" Relevance networks! Edge = strong correlation
" Dependency networks! Directed edge = strong partial correlation
" Dynamical dependency networks! Directed edge = strong partial correlation
" Bayesian networks! Profiles are quantized to small number of bits! One bit quantization = boolean networks

IEEE ICASSP Plenary 200539
Network Constrained Clustering
! If topology were known could use to improve clustering! Otherwise suffer from combinatorial explosion:
! Soln: FDRCI edge screening

IEEE ICASSP Plenary 200540
FDRCI Edge Screen Procedure! Fix FDR level
and MAS level on discovered edges
! Construct FDRCI’s of desired FDR level on edge strengths
! Accept edge if FDRCI exceeds MAS
Dongxiao Zhu, A. Hero, S. Qi, JCB, 2004.

IEEE ICASSP Plenary 200541
Yeast Galactose Metabolism Experiment! 10 different yeast
strains (9 gene knock-outs and 1 wild type) incubated in either GAL-inducing or non-inducing media (Ideker et al. 2001).
! 9 gene knock-outs are GAL1, GAL2, GAL3, GAL4, GAL5, GAL6, GAL7, GAL10, GAL80.
! 5935 gene 2-channel cDNA array. Reference channel is dilution “wild-type + galactose”
Dongxiao Zhu, A. Hero, S. Qi, JCB, 2004.

IEEE ICASSP Plenary 200542
Relevance Network Visualization(FDR <= 0.05, MAS = 0.9)
Dongxiao Zhu, A. Hero, S. Qi, JCB, 2004.
B
A

IEEE ICASSP Plenary 200543
Network Constrained Clustering

IEEE ICASSP Plenary 200544
Horizons: Transcriptomics/Proteomics Technology
! Higher throughput cDNA/GeneChipmicroarrays
! Suspension microarrays! Microscale “Lab on a chip”! Protein-protein arrays! Nuclear magnetic resonance spectroscopy! In vivos molecular imaging: reporter genes

IEEE ICASSP Plenary 200545
Where does SP fit?Experiments
Math Modeling
Statistics
Biology
SP
CS
Processing

IEEE ICASSP Plenary 200546
Signal Processing Opportunites
! There is room for new SP approaches" Non-modularized analysis: task-driven and top-down?" Active waveform design: sequential design of experiments?" Internet Tomography: gene network topology discovery?" MIMO: spatio-temporal wideband array processing?" Channel optimization: optimal gene layout on microarray?
! New technology is appearing that offers opportunities for SP’ers to develop models/algorithms
! There is still some low lying fruit!! Collaboration with a biological scientist is essential in
order to have impact

IEEE ICASSP Plenary 200547
Where to learn more?
Genetics, the painlessway, 1991
Historical overview by one of the pioneers, 2003
Basic undergraduate texbook, 1992

IEEE ICASSP Plenary 200548
Where to learn more?
Edited volume on principal statistical techniques of microarray analysis, 2003
Overview of microarraytechnology and analysis, 2003
Textbook aimed at biostatisticians, 2004
IEEE ICASSP Plenary 200549
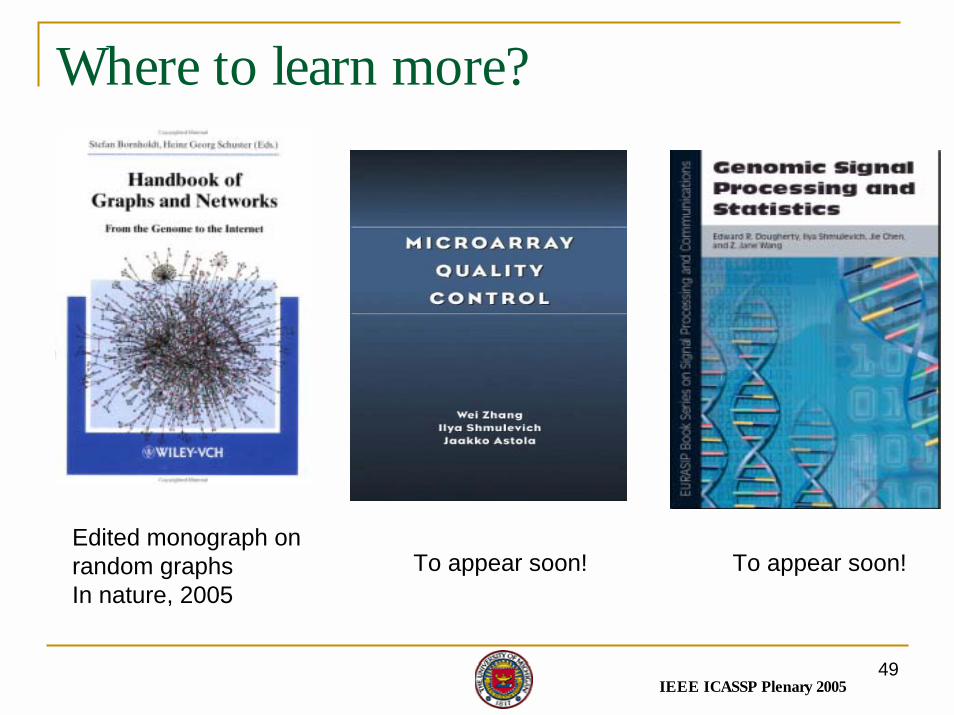
Where to learn more?
Edited monograph on random graphsIn nature, 2005
To appear soon! To appear soon!

IEEE ICASSP Plenary 200550
Future venues
! GENSIPS 2005 – Newport: " Ray Liu, Jaako Astola" Workshop dates: May 22 - 24, 2005 " Early registration ends March 30
IEEE Transactions on Signal ProcessingSpecial Issue on Genomic Signal Processing
! Submission deadline: May 1, 2005! Publication date: Sept. 2006
Final
acceptance
notification:
November
1,
2005
Final
manuscript
due:
Dece
Final
acceptance
notification:
November
1,
2005
Final
manuscript
due:
Dece
Final
acceptance
notification:
November
1,
2005
Final
manuscript
due:
Dece
Final
acceptance
notification:
November
1,
2005
Final
manuscript
due:
Dece

IEEE ICASSP Plenary 200551
5. Conclusions! Gene filtering: accounting for biological and
statistical significance ! Gene ranking: can involve optimization over multiple
criteria ! Gene co-regulation networks: discover co-
dependent gene profiles that can aid in clustering! Statistical signal and image processing approaches
can have impact! References to UM work and software presented
here: http://www.eecs.umich.edu/~hero/bioinfo.html