fortum's q1 2015
TRANSCRIPT

Interim report January–March 2015 Fortum Corporation 29 April 2015

2
Disclaimer
This presentation does not constitute an invitation to underwrite, subscribe for, or otherwise acquire or dispose of any Fortum shares. Past performance is no guide to future performance, and persons needing advice should consult an independent financial adviser.

IFRS restatement relating to discontinued operations
Distribution segment has been reclassified as discontinued operations in Q1/2015. As a result, continuing operations and discontinued operations are presented separately for Fortum Group. Comparative period information for 2014 has been restated accordingly. Restated information for the interim periods of 2014 can be found in a stock exchange release published 15 April 2015
3

Q1 2015 Results
4
Key figures (MEUR) I/2015 I/2014 2014 LTM Sales, continuing operations 1,040 1,208 4,088 3,920
Comparable EBITDA, continuing operations 396 456 1,457 1,397
Operating profit:
Continuing operations 350 366 1,296 1,280 Discontinued operations 81 1,968 2,132 245 Fortum total 431 2,333 3,428 1,526
Comparable operating profit:
Continuing operations 343 358 1,085 1,070 Discontinued operations 82 119 266 229 Fortum total 425 477 1,351 1,299
Profit before taxes:
Continuing operations 350 374 1,232 1,208 Discontinued operations 80 1,968 2,128 240 Fortum total 431 2,341 3,360 1,450
Earnings per share:
Continuing operations 0.33 0.35 1.22 1.20 Discontinued operations 0.07 2.18 2.33 0.22 Fortum total 0.40 2.53 3.55 1.42
Net cash from operating activities, continuing operations 516 405 1,406 1,517
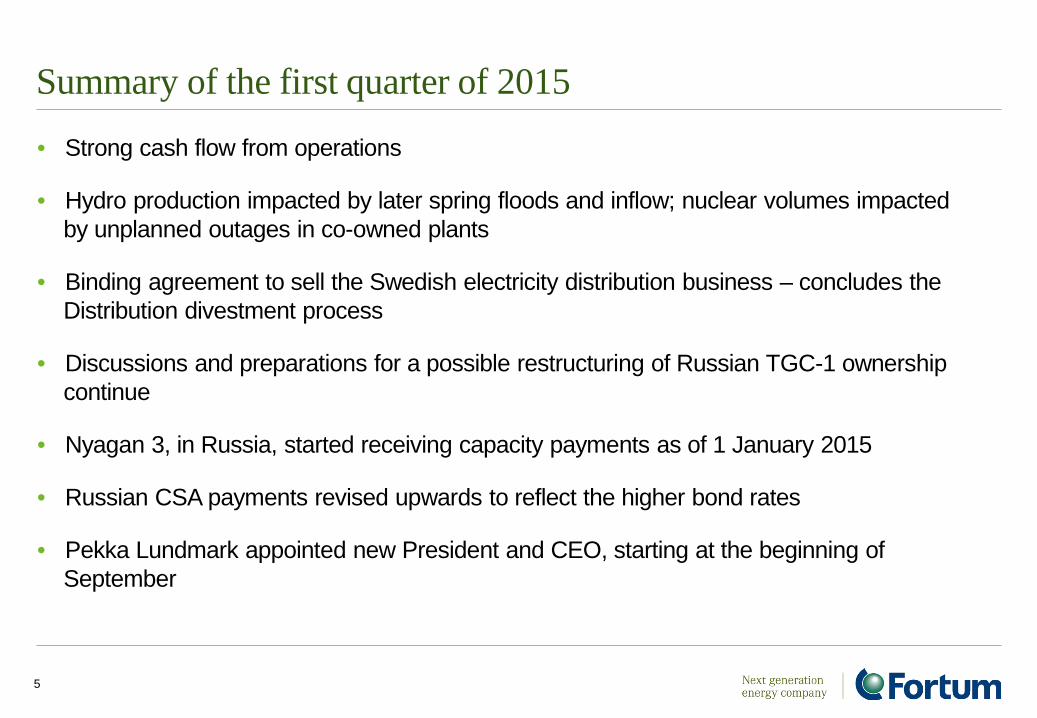
Summary of the first quarter of 2015
• Strong cash flow from operations
• Hydro production impacted by later spring floods and inflow; nuclear volumes impacted by unplanned outages in co-owned plants
• Binding agreement to sell the Swedish electricity distribution business – concludes the Distribution divestment process
• Discussions and preparations for a possible restructuring of Russian TGC-1 ownership continue
• Nyagan 3, in Russia, started receiving capacity payments as of 1 January 2015
• Russian CSA payments revised upwards to reflect the higher bond rates
• Pekka Lundmark appointed new President and CEO, starting at the beginning of September
5

Market conditions in the first quarter of 2015
Nordic countries • Power consumption in the Nordic countries at the same level as in Q1 2014 • Hydro reservoirs at long-term average level • Nordic system spot prices approximately EUR 2 per MWh lower than in Q1 2014,
while Finnish and Swedish area prices EUR1-3 per MWh lower
European business environment and carbon market • European Commission is developing a reference market model for countries
planning a capacity market • A market stability reserve of the EU emissions trading system is being negotiated
Russia • Power consumption in Fortum’s operating areas was on the same level as in Q1
2014 • Electricity spot price (in RUB) in the Urals hub was on same level as in Q1 2014 • RUB strengthened during the quarter
6
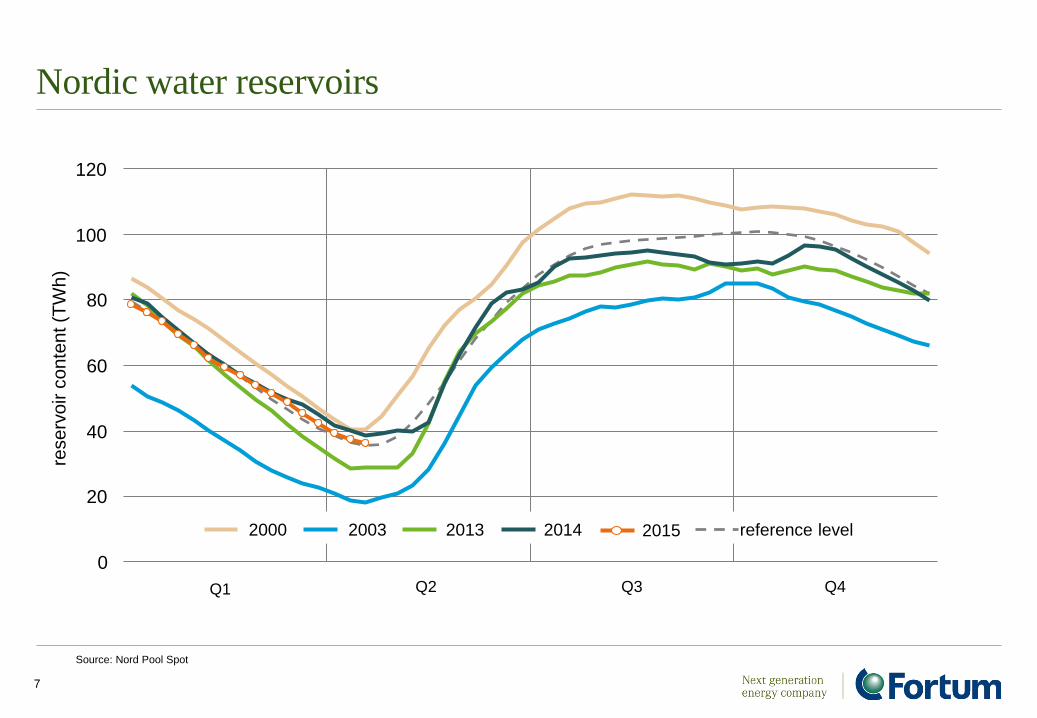
Nordic water reservoirs
7
Source: Nord Pool Spot
Q1 Q2 Q3 Q4
20
40
60
80
100
120
rese
rvoi
r con
tent
(TW
h)
0
2000 2003 2014 2013 reference level 2015

Wholesale price for electricity
8
Source: Nord Pool Spot, Nasdaq Commodities
EUR/MWh Nord Pool Spot System Price Forwards
27 April 2015
1995 1997 1999 2001 2003 2005 2007 2009 2011 2013 2015 2017 2019 2021 2023 2025 0
10
20
30
40
50
60
70
80
90
100
110

0
30
60
90
120
150
USD
/ bb
l
Crude oil price (ICE Brent)
2007 2008 20112009 2010 20132012 2014 2015 20160
7
14
21
28
35
EUR
/ tC
O2
CO2 price (ICE ECX EUA)
2007 2008 20112009 2010 20132012 2014 2015 2016
0
50
100
150
200
250
USD
/ t
Coal price (ICE Rotterdam)
2007 2008 20112009 2010 20132012 2014 2015 20160
20
40
60
80
100
GB
p / t
herm
Gas price (ICE NBP)
2007 2008 20112009 2010 20132012 2014 2015 2016
9
Source: ICE
Market prices 27 April 2015; 2015-2016 future quotations
Fuel and CO2 allowance prices

Price development in the Nordic region and Russia
10
Includes capacity income
-7% +3%
-5% -15%

Q1: Fortum’s market environment remained weak
11
Comparable operating profit, EUR million

Financials

Comparable and reported operating profit
I/2015 I/2014 I/2015 I/2014
Power and Technology 203 251 203 262
Heat, Electricity Sales and Solutions 58 48 64 45
Russia 97 73 98 73
Other -15 -14 -15 -14
Total, continuing operations 343 358 350 366
Discontinued operations 82 119 81 1,968
Total, Fortum 425 477 431 2,333
13
Comparable operating profit
Reported operating profit MEUR
• Sales gains, IFRS accounting treatment (IAS 39) of derivatives and nuclear fund adjustments had an impact EUR 7 (8) million on the reported operating profit for continuing operations

Power and Technology
MEUR I/2015 I/2014 2014 LTM
Sales 500 586 2,156 2,070
Comparable EBITDA 232 282 998 948
Comparable operating profit 203 251 877 829
Net assets 6,019 6,276 6,001
Comparable RONA % 14.2 13.6
Gross investments 28 35 198 191
14
Q1 2015 • Lower achieved power price, hydro and nuclear volumes
• Later spring floods • Several small unplanned outages in co-owned nuclear power plants

Heat, Electricity Sales and Solutions
15
Q1 2015 • Comparable operating profit improved mainly due to lower fuel costs and higher
heat prices during the period. In addition, the customer base in retail electricity continued to grow and sales margin improved.
• Heat sales volumes as well as power sales volumes on approximately same levels as Q1 2014
MEUR I/2015 I/2014 2014 LTM
Sales 406 446 1,332 1,292
Comparable EBITDA 82 74 204 212
Comparable operating profit 58 48 104 114
Net assets 2,164 2,365 2,112
Comparable RONA % 8.7 8.6
Gross investments 12 13 124 123

Russia Q1 2015 • Lower heat production volumes, due to warm weather, and bad debt provisions for
heat trade receivables impacted the result negatively • Russian rouble affected the result negatively by EUR 47 million • Result includes CSA provision release of EUR 29 million
16
* Excluding the net release of CSA provision
MEUR I/2015 I/2014 2014 LTM
Sales 263 333 1,055 985
Comparable EBITDA * 94 113 304 285
Comparable operating profit 97 73 161 185
Net assets 3,104 3,619 2,597
Comparable RONA % 5.6 6.5
Gross investments 45 59 367 353

Discontinued operations (Distribution)
17
Q1 2015 • Binding agreement signed to divest the Swedish electricity distribution business • Volumes in Sweden in line with last year
MEUR I/2015 I/2014 2014 LTM
Sales 180 300 751 631
Comparable EBITDA 112 171 416 357
Comparable operating profit 82 119 266 229
Net assets 2,634 2,872 2,615
Comparable RONA % 9.3 8.5
Gross investments 20 25 147 142
Table below includes January-March 2014 results for the Finnish, January-May 2014 results for the Norwegian and full year 2014 results as well as January-March 2015 for the Swedish distribution business
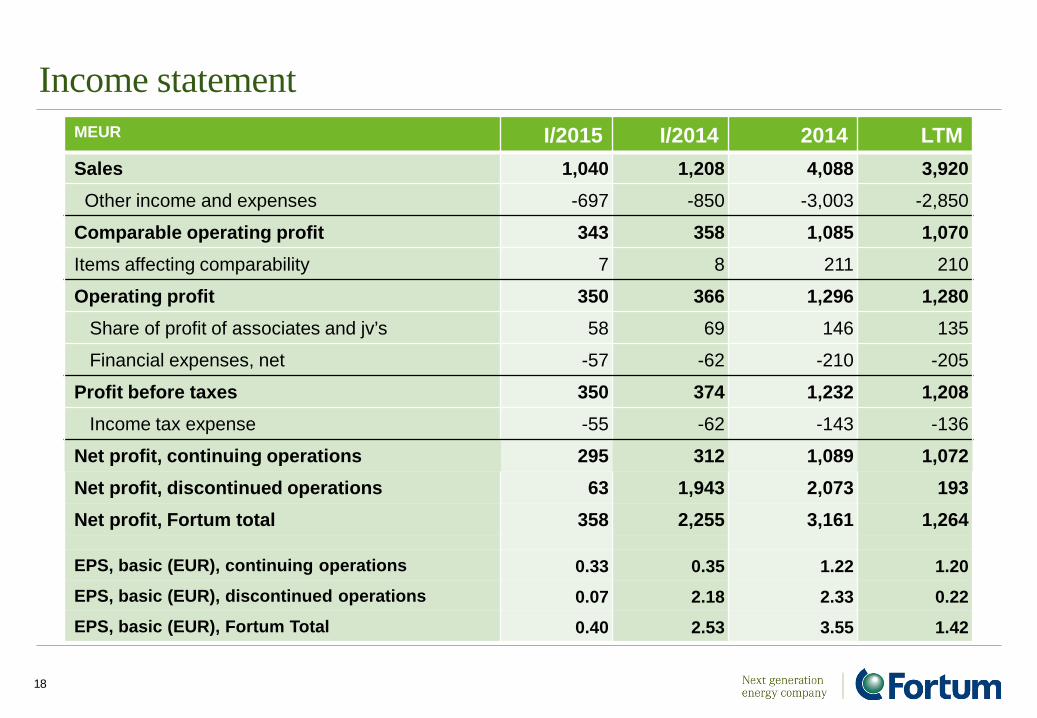
Income statement MEUR I/2015 I/2014 2014 LTM Sales 1,040 1,208 4,088 3,920 Other income and expenses -697 -850 -3,003 -2,850
Comparable operating profit 343 358 1,085 1,070 Items affecting comparability 7 8 211 210
Operating profit 350 366 1,296 1,280 Share of profit of associates and jv’s 58 69 146 135
Financial expenses, net -57 -62 -210 -205
Profit before taxes 350 374 1,232 1,208 Income tax expense -55 -62 -143 -136
Net profit, continuing operations 295 312 1,089 1,072 Net profit, discontinued operations 63 1,943 2,073 193 Net profit, Fortum total 358 2,255 3,161 1,264
EPS, basic (EUR), continuing operations 0.33 0.35 1.22 1.20 EPS, basic (EUR), discontinued operations 0.07 2.18 2.33 0.22 EPS, basic (EUR), Fortum Total 0.40 2.53 3.55 1.42
18

Cash flow statement MEUR I/2015 I/2014 2014 LTM Cash from operating activities:
Realised FX gains/losses 168 74 352 446 Other funds from operations (FFO) 314 371 1,096 1,039 Change in working capital 34 -40 -42 32
Cash from operating activities, continuing operations 516 405 1,406 1,517
Cash from operating activities, discontinued operations 87 161 356 282
Cash from operating activities, total Fortum 603 566 1,762 1,799
Cash used in investing activities: Paid capital expenditures -101 -123 -622 -600 Proceeds from divestments 36 3 499 532 Other investment activities 19 46 364 337
Total investing activities, continuing operations -46 -74 241 269
Total investing activities, discontinued operations
-43 2,461 2,574 70
Cash used in investing activities, total Fortum
-89 2,387 2,816 340
Cash flow before financing activities, total Fortum 514 2,953 4,578 2,139
19
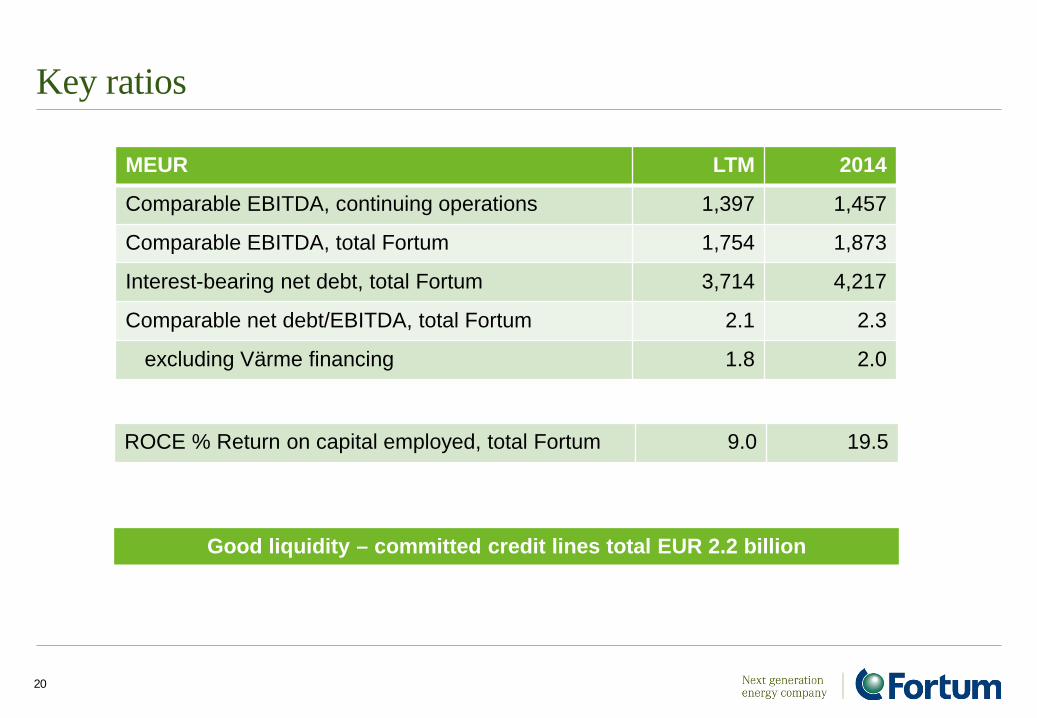
Key ratios
MEUR LTM 2014
Comparable EBITDA, continuing operations 1,397 1,457
Comparable EBITDA, total Fortum 1,754 1,873
Interest-bearing net debt, total Fortum 3,714 4,217
Comparable net debt/EBITDA, total Fortum 2.1 2.3
excluding Värme financing 1.8 2.0
20
ROCE % Return on capital employed, total Fortum 9.0 19.5
Good liquidity – committed credit lines total EUR 2.2 billion

Debt Maturity Profile 31 March 2015
0
250
500
750
1000
1250
1500
2015 2016 2017 2018 2019 2020 2021 2022 2023 2024 2025+
Bonds Financial institutions Other long-term debt Other short-term debt
MEUR
2015 1,036
2016 863
2017 538
2018 621
2019 821
2020 75
2021 549
2022 1,087
2023 110
2024 3
2025+ 1,279
TOTAL 6,982
21
per 31 March 2015 per 31 Dec, 2014 Average Interest Rate 4.3% 3.7% Portion of floating / fixed debt 47 / 53% 46 / 54%

Outlook

Outlook Nordic markets
• Fortum continues to expect that the average annual electricity demand growth will be on average approximately 0.5% in the coming years
• Electricity is expected to continue to gain share of total energy consumption Russia
• The run-rate operating profit (EBIT) level for the Russia Segment, RUB 18.2 billion, is targeted to be reached during 2015, but the euro result level will be volatile, due to the translation effect
Key drivers and risks
• Economic • Political • Currency • Wholesale price of electricity and volumes
• demand and supply • fuels • hydrological situation • power plant availability • CO2 emissions allowance prices
23

Outlook Annual capex estimate, excluding potential acquisitions
• 2015 approximately EUR 0.8 billion
Hedging • Rest of 2015 approx. 50% hedge ratio at approx. EUR 41/MWh • 2016 approx. 20% hedge ratio at approx. EUR 37/MWh
Taxation
• Effective tax rate for 2015 for the Group 19-21% • The Swedish Government decided to re-propose an increase of 17%
on the tax on installed nuclear capacity to the spring budget
24

For more information www.fortum.com/investors