for personal use only - australian securities exchange · financial information of dfl and dft...
TRANSCRIPT
1
2015 Results Presentation
21 August 2015
For
per
sona
l use
onl
y
2
Important Information
At 30 June 2015, the DUET Group comprised DUET Company Limited (ABN 93 163 100 061) (“DUECo”), DUET Investment Holdings Limited (“DIHL)” (ABN 22 120 456 573) and
DUET Finance Limited (ABN 15 108 014 062) (“DFL”) (AFSL 269287) in its personal capacity and as responsible entity of DUET Finance Trust (“DFT”) (ARSN 109 363 135)
(DUECo, DIHL, DFL and DFT are collectively referred to as “DUET” or “DUET Group”). As DUECo is the parent entity of the DUET Group, it and DIHL (as the Corporate Arm) are
responsible for all information contained in this presentation. DFL and DFT (as the Funding Arm) are only responsible for the general stapled securityholder information and
financial information of DFL and DFT incorporated into the statutory consolidated financial information contained and/or summarised in this presentation.
Not an offer nor investment advice
This presentation is not an offer or invitation for subscription or purchase of or a recommendation of securities. It does not take into account the investment objectives, financial
situation and particular needs of the investor. Before making an investment in DUET, the investor or prospective investor should consider whether such an investment is
appropriate to their particular investment needs, objectives and financial circumstances and consult an investment adviser if necessary. This presentation does not take into
account the investment objectives, financial situation and particular needs of the investor. Nor does it contain all the information necessary to fully evaluate any transaction or
investment and, as such, no reliance should be placed on its contents. Any investment decision should be made based solely upon appropriate due diligence and, if applicable,
upon receipt and careful review of relevant offering documents. Recipients of this presentation should neither treat nor rely on its contents as advice relating to legal, taxation or
investment matters and are advised to consult their own professional advisers.
Capital returns not guaranteed
Investment is subject to significant risks of loss of income and capital. To the maximum extent permitted by law, none of DUECo, DIHL, DFL, their directors, employees or agents,
accepts any liability for any loss arising from the use of this presentation or its contents or otherwise arising in connection with it, including, without limitation, any liability arising
from fault or negligence on the part of DUECo, DIHL, DFL or their directors, employees or agents. Information, including forecast financial information, in this presentation should
not be considered as a recommendation in relation to holding, purchasing or selling securities or other instruments in DUET Group.
Forecasts and forward-looking statements
Due care and attention has been used in the preparation of forecast information and forward-looking statements made in this presentation. However, actual results may vary from
forecasts and any variation may be materially positive or negative. Forecasts by their very nature, are subject to uncertainty and contingencies many of which are outside the
control of DUET Group. Past performance is not a reliable indication of future performance.
Distribution Guidance
The DUET Group’s distribution guidance and related statements in this presentation are subject to DUET’s forecast assumptions being met.
Policies
This presentation has been prepared using policies adopted by the directors of DUECo, DIHL and DFL and, unless stated otherwise in the Management Information Report, these
policies have been consistently applied to all periods presented in this presentation. Parts of this presentation have therefore been prepared on a different basis to the 2015
Financial Report of DUET Group. Certain information contained within this presentation does not, and cannot be expected to provide as full an understanding of the financial
performance, financial position and cash flows of DUET Group as in the 2015 Financial Report. This presentation should be read in conjunction with the 2015 Financial Report of
DUET Group, which can be found on the DUET website at www.duet.net.au
© DUET Group
Disclaimer
For
per
sona
l use
onl
y

3
Agenda
Page
Performance Highlights 4
Group Results 5
Operating Company Results 9
Outlook 16
Appendices 20
About DUET Group 21-22
Financial Reconciliations 23-27
About Energy Developments Limited 28-32
For
per
sona
l use
onl
y

4
United Energy lodged 2016-2020 EDPR submission
DBP lodged 2016-2020 Revised Access Arrangement
Multinet Gas submitted accelerated pipeworks pass-through application to the AER
$1.67b underwritten placement and entitlement offer completed in August 2015
- Strongly supported by both institutional and retail investors
- Substantial shareholder notice (10.7%) lodged by UniSuper on 7 August 2015
Over $2.1b of debt raised and refinanced on competitive terms
DDG commissioned its two pipeline projects (WAWP and FRGP)
- First full year earnings contribution in FY16
DDG is preparing a proposal to build, own and operate the North Eastern Gas Interconnector
(NEGI) pipeline; submission due 30 September 2015
Announced proposed acquisition of 100% of Energy Developments Limited (EDL)
Delivered 17.5 cpss FY15 guidance
- 8.75 cpss final FY15 distribution paid on 20 August 2015
18.0 cpss FY16 guidance, targeting growth to 19.0cpss in FY18
- Subject to completion of proposed EDL acquisition and forecast assumptions being met
Growth
Capital
Distributions
Regulatory
Highlights
For
per
sona
l use
onl
y

5
Group Results For
per
sona
l use
onl
y

6 1. The prior period did not include certain items. As these items are material during the current period, corresponding comparative figures have also been disclosed. The inclusion of these items increased the 2014 reported
Consolidated EBITDA from $796.0 million to $800.6 million and the NPAT excluding significant items from $81.2 million to $86.6 million. Refer to the 2015 Financial Report for full details
2. Adjusted EBITDA is EBITDA less customer contributions (net of margin)
Proportionate Results ($m)
Refer to Management Information Report (MIR) FY15 FY14 Change Commentary
Transmission and Distribution Revenue 748.6 743.6 0.7% $27.7m lower recontracted revenue at DBP offset by other operating companies
Total Revenue 854.7 850.8 0.5%
Opex 244.1 233.5 (4.6)% Opex increases: DBP $1.5m; UE $2.3m; MGH $3.1m; DDG $0.7m; Corporate $3m
EBITDA 610.6 617.3 (1.1)%
Adjusted EBITDA2 590.3 599.7 (1.6)%
Net External Interest Expense (“Interest”) 276.4 316.4 12.6% $38.1m lower interest costs at DBP post recontracting
Adjusted EBITDA less Interest 313.9 283.3 10.8% Driven by lower interest costs at DBP
NRD/SIB capex 101.2 90.7 (11.6)% $5.6m increase in NRD at Multinet Gas
Income tax paid 1.8 - n/a Head office tax payment
Proportionate Earnings 210.9 192.6 9.5% DUET will replace NRD with SIB capex in the calculation of proportionate earnings in
FY16 after completion of the proposed acquisition of EDL
Group Results
Consolidated Results ($m)
Extract from Appendix 4E FY15 FY141 Change
Revenues from ordinary activities 1,269.3 1,251.4 1.4%
EBITDA 783.5 800.6 (2.1)%
NPAT excluding significant items 77.0 86.6 (11.1)%
For
per
sona
l use
onl
y

7
329
131
83
20
83
54
Cashat 30-Jun-15
Final FY15distribution
UED investment(Jul-15)
Working cap. raisedas part of EDL acq.
UED investment(uncommitted)
Pro-forma Cash at 30-Jun-15
Equity Capital Management
Pro forma $m, per MIR FY15
DBP 92.5
United Energy 79.2
Multinet Gas 70.2
DBP Development Group 16.9
Head Office costs, tax and interest income (3.7)
Cash available for distribution 255.1
Weighted average securities on issue (m) 1,417.4
Cash available for distribution (pss) 18.0¢
Distributions declared (pss) 17.5¢
Distribution Coverage (%) 103%
Distribution Coverage Corporate Working Capital
1. Excludes $5m of Restricted Cash, primarily due to a deposit held to meet DFL’s AFSL obligations
DUET recently completed a $1.67 billion equity capital raising at
$2.02 per new stapled security to fund the proposed EDL
acquisition (10.3% discount to the theoretical ex-rights price)
• $550m institutional placement
- Cornerstone investors included UniSuper
• $1,122m accelerated non-renounceable entitlement offer
- 94% institutional holder take-up
- 82% retail holder take-up
July 2015 Placement and Entitlement Offer
(Pro forma, $m)
Source of Funds Proposed Use of Funds
Institutional placement 550 EDL acquisition 1,407
Entitlement offer 1,122 EDL degearing 150
Transaction costs 95
Working Capital 20
Total 1,672 Total 1,672
1
For
per
sona
l use
onl
y

8
73.2% 69.8%
Jun-14 Jun-15
(Proportionate Net Debt / RAB)
Group Gearing1 Debt Transactions (1 July 2014 to 20 August 2015, including EDL)
Debt Maturities Debt Facility Mix
($m)
(Pro forma as at 20 August 2015, $m, by facility limits, excluding working capital facilities and EDL) (Pro forma as at 20 Aug 2015, by facility limits, excluding working capital facilities and EDL)
Debt Capital Management
1. On completion of DUET’s proposed acquisition of EDL, Group gearing will be reported on a statutory consolidated net debt to net debt plus equity basis.
125
295
190
125 10 77
120 136
143
230
171
240
292
2,154
DBP6Yr
DBP7Yr
DBP3Yr
DBP8Yr
DDG1Yr
UED4.5Yr
UED5Yr
UED7Yr
UED10Yr
MGH5Yr
MGH7Yr
EDL3Yr
EDL5Yr
Total
Banks 50%
USPP Bonds 15%
Domestic Bonds 35%
540 700 621
125 295
125 - -
817 525
382
120
-
136
-
- 143 75
300
280
230
171
0
300
600
900
1,200
1,500
1,800
CY15 CY16 CY17 CY18 CY19 CY20 CY21 CY22 CY23 CY24 CY25
DBP UED MGH DDG
For
per
sona
l use
onl
y

9
Operating Company Results For
per
sona
l use
onl
y

10
$m, 100% per MIR FY15 FY14 Change
Throughput (TJ) 330,773 334,776 (1.2)%
Transport Revenue 381.1 415.3 (8.2)%
Total Revenue 396.7 428.8 (7.5)%
Opex 82.2 80.3 (2.4)%
EBITDA 314.5 348.5 (9.8)%
EBITDA margin 79.3% 81.3% (2.0)%
Adjusted EBITDA less Interest 128.6 121.5 5.8%
RAB 3,614.7 3,595.2 0.5%
Gearing 65.7% 69.6% 3.9%
Financial Summary Commentary
Throughput down 1.2%
• Reduced contracted capacity resulting from 2014 recontracting
• 3.7% uplift in back haul deliveries, serving Pilbara demand
Transport revenue down 8.2%
• ~9.5% reduction in SSC full-haul tariff, in line with guidance given at
the time of the recontracting last year
• Partly offset by one-off $13.6m positive adjustment from prior years
Opex up 2.4%
• Excluding fuel gas, opex was down 11.4%
20.8% reduction in Net External Interest Expense
• Reset of base interest rate hedges at the time of the recontracting
• $180m degearing; stable investment grade credit ratings
ERA draft determination on DBP 2016-2020 Access
Arrangement now expected not earlier than Q4 15
• Only applies to 15% of firm full-haul contracted volumes1
Dampier Bunbury Pipeline
$m, 100% per MIR data FY15A FY15F
Adjusted EBITDA2 308 295
Net External Interest Expense (“Interest”) (179) (183)
Adjusted EBITDA less Interest 129 112
Outperformed FY15 guidance
1. Contracted volumes include the Alcoa Exempt Contract
2. Adjusted EBITDA is EBITDA less customer contributions (net of margin)
For
per
sona
l use
onl
y

11
$m, 100% per MIR FY15 FY14
Total Revenue 12.7 4.4
Opex 3.4 2.7
EBITDA 9.3 1.7
Financial Summary1 Commentary
Two pipeline projects commissioned
Other projects:
- Constructing Ashburton Onslow Gas Pipeline
24km customer-funded pipeline project
- Maintenance role on Gorgon onshore pipeline
- Preparing proposal to build, own and operate the North
East Gas Interconnector (NEGI) pipeline
Proposal due 30 September 2015
- Continuing to investigate additional gas infrastructure
growth opportunities
DBP Development Group
FRGP Location WAWP Location
Pipeline DDG
Ownership
Length Commissioning
Wheatstone Ashburton West Pipeline
(WAWP)
100% 109km Dec 2014
Fortescue River Gas Pipeline
(FRGP)
57% 270km Mar 2015
1. First full year earnings contribution from WAWP and FRGP expected in FY16
For
per
sona
l use
onl
y
12
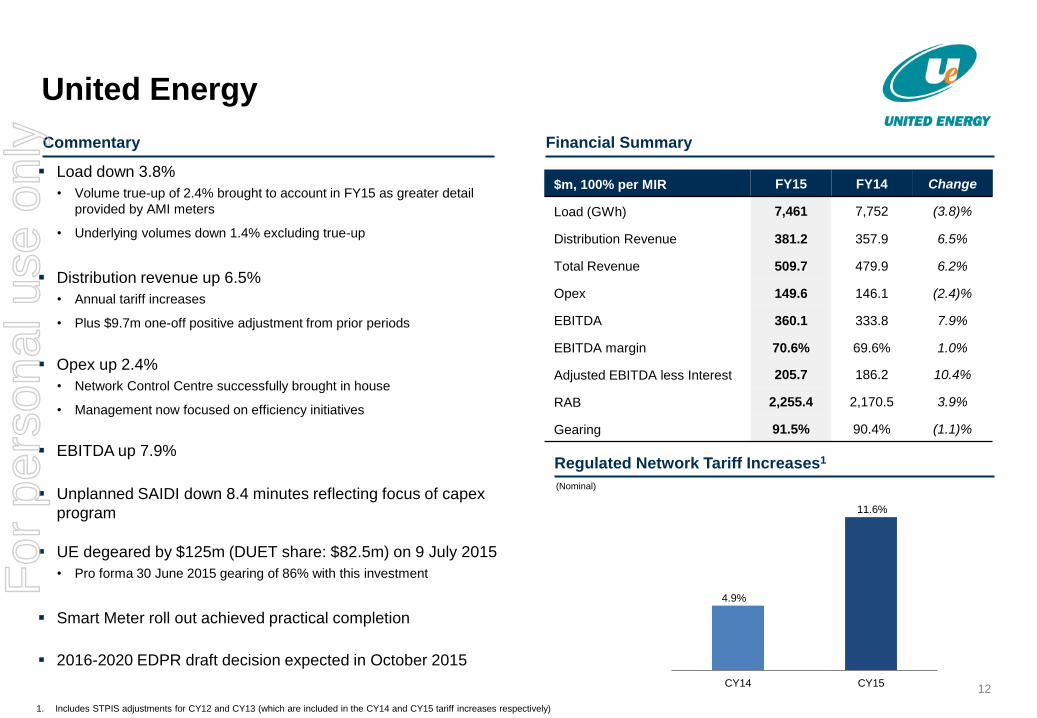
4.9%
11.6%
-%
2.0%
4.0%
6.0%
8.0%
10.0%
12.0%
14.0%
CY14 CY15
Regulated Network Tariff Increases1
Load down 3.8%
• Volume true-up of 2.4% brought to account in FY15 as greater detail
provided by AMI meters
• Underlying volumes down 1.4% excluding true-up
Distribution revenue up 6.5%
• Annual tariff increases
• Plus $9.7m one-off positive adjustment from prior periods
Opex up 2.4%
• Network Control Centre successfully brought in house
• Management now focused on efficiency initiatives
EBITDA up 7.9%
Unplanned SAIDI down 8.4 minutes reflecting focus of capex
program
UE degeared by $125m (DUET share: $82.5m) on 9 July 2015
• Pro forma 30 June 2015 gearing of 86% with this investment
Smart Meter roll out achieved practical completion
2016-2020 EDPR draft decision expected in October 2015
$m, 100% per MIR FY15 FY14 Change
Load (GWh) 7,461 7,752 (3.8)%
Distribution Revenue 381.2 357.9 6.5%
Total Revenue 509.7 479.9 6.2%
Opex 149.6 146.1 (2.4)%
EBITDA 360.1 333.8 7.9%
EBITDA margin 70.6% 69.6% 1.0%
Adjusted EBITDA less Interest 205.7 186.2 10.4%
RAB 2,255.4 2,170.5 3.9%
Gearing 91.5% 90.4% (1.1)%
Financial Summary Commentary
(Nominal)
United Energy
1. Includes STPIS adjustments for CY12 and CY13 (which are included in the CY14 and CY15 tariff increases respectively)
For
per
sona
l use
onl
y
13
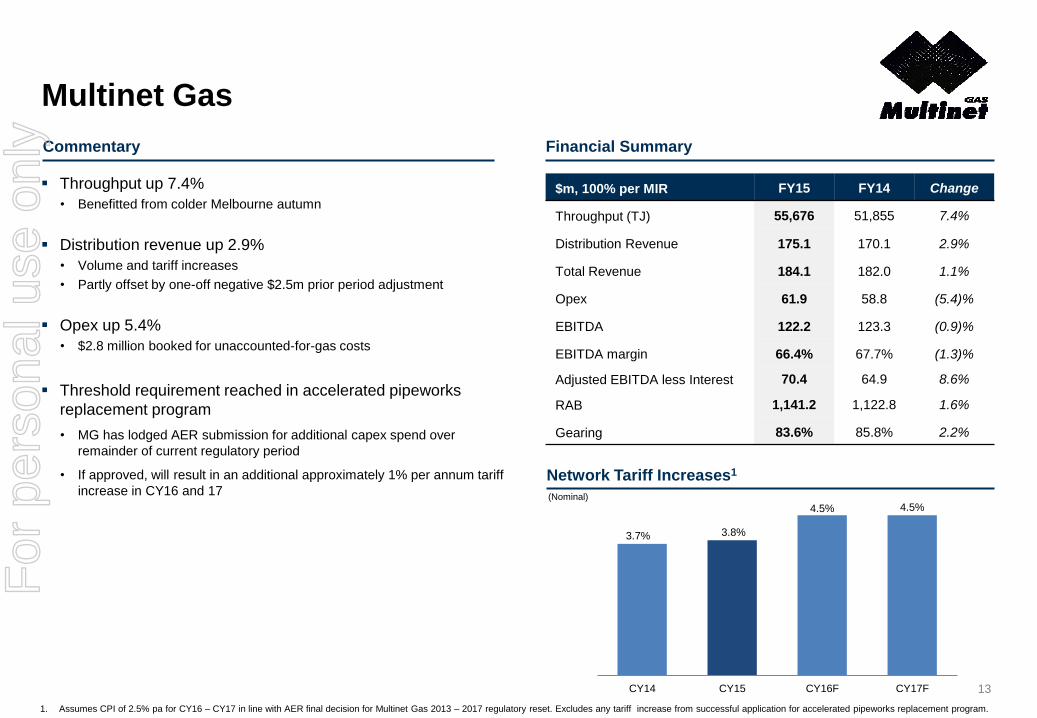
3.7% 3.8%
4.5% 4.5%
-%
1.0%
2.0%
3.0%
4.0%
5.0%
CY14 CY15 CY16F CY17F
Throughput up 7.4%
• Benefitted from colder Melbourne autumn
Distribution revenue up 2.9%
• Volume and tariff increases
• Partly offset by one-off negative $2.5m prior period adjustment
Opex up 5.4%
• $2.8 million booked for unaccounted-for-gas costs
Threshold requirement reached in accelerated pipeworks
replacement program
• MG has lodged AER submission for additional capex spend over
remainder of current regulatory period
• If approved, will result in an additional approximately 1% per annum tariff
increase in CY16 and 17
Network Tariff Increases1
$m, 100% per MIR FY15 FY14 Change
Throughput (TJ) 55,676 51,855 7.4%
Distribution Revenue 175.1 170.1 2.9%
Total Revenue 184.1 182.0 1.1%
Opex 61.9 58.8 (5.4)%
EBITDA 122.2 123.3 (0.9)%
EBITDA margin 66.4% 67.7% (1.3)%
Adjusted EBITDA less Interest 70.4 64.9 8.6%
RAB 1,141.2 1,122.8 1.6%
Gearing 83.6% 85.8% 2.2%
(Nominal)
Multinet Gas
Financial Summary Commentary
1. Assumes CPI of 2.5% pa for CY16 – CY17 in line with AER final decision for Multinet Gas 2013 – 2017 regulatory reset. Excludes any tariff increase from successful application for accelerated pipeworks replacement program.
For
per
sona
l use
onl
y

14
On 20 July, DUET announced proposal to acquire 100% of ASX-listed
Energy Developments Limited (EDL) via a Scheme of Arrangement for
$8.00 per EDL share1 payable in cash
• Implied EV multiple of 8.8 times EDL’s FY15 EBITDA2
EDL is a strong strategic fit with DUET:
• Long term, contracted energy infrastructure cash flows
• Further diversifies DUET’s cash flows
• EDL’s remote energy business is complementary to DDG
• Attractive growth platform
• Experienced management team with proven track record
Proposed Acquisition expected to deliver significant value to DUET
securityholders
• Immediately cashflow accretive3
• DUET’s FY16 distribution guidance upgraded to 18.0cpss
• DPS growth target established of 0.5 cpss p.a. to FY18
Proposed Acquisition of EDL
1. Refer Scheme Implementation Deed lodged with ASX on 20 July 2015
2. Excluding DUET’s transaction costs. Based on EDL’s FY15 EBITDA of $218m, acquisition equity value of $1,407 million including EDL management options and performance rights, and forecast (as
at 20 July 2015) unaudited net drawn debt of $512 million as at 30 June 2015 as adjusted for EDL’s expected transaction costs
3. From financial close, expected in October 2015, subject to EDL shareholder approval, court approval and other necessary approvals and conditions precedent
EVENT DATE*
DUET announcement of proposal to acquire EDL 20 Jul 2015
Completion of DUET’s $1.67b equity capital
raising 17 Aug 2015
Dispatch of EDL scheme booklet and Independent
Expert Report Early Sep 2015
EDL shareholder scheme meeting Early Oct 2015
Implementation date Late Oct 2015
Financial close of the Proposed Acquisition remains subject to EDL
shareholder approval, court approval and other necessary approvals
and conditions precedent
Transaction unanimously recommended by EDL’s board and a
number of the company’s largest shareholders (representing >85% of
EDL’s shares on issue)
*Final dates subject to ASIC and court approval
For
per
sona
l use
onl
y

15
123 135
177 182
218
0
50
100
150
200
250
300
FY11 FY12 FY13 FY14 FY15
Remote Energy Clean Energy
EDL Financial Performance
EBITDA
By business unit2, $m
1. As at 30 June
2. Corporate, development and operations support costs apportioned by business unit Operating EBITDA
EDL management continues to deliver strong financial
performance
EDL has announced a number of additional projects since
DUET’s proposed acquisition was announced on 20 July:
• Build, own and maintain high pressure gas skids at Tropicana and
Sunrise Dam for AGA
• New Gas Supply Agreement (GSA) with Anglo American for the
Grosvenor site and potential for construction of new 21MW WCMG
project
• 12 year extension to US-based Tessman Road LFG project
• 25 year GSA with US-based Rumpke’s Brown County, Ohio LFG
facility – potential for 5MW future project
• 11 year GSA extension to Glencore’s Oaky Creek site and potential
for future 15MW project expansion
$m, 100% per EDL FY15 FY14 Change
Revenue 448.7 422.8 6.1%
Opex 230.5 240.6 4.2%
EBITDA 218.2 182.2 19.8%
Installed capacity1 (MW) 900 883 1.9%
Financial Summary
For
per
sona
l use
onl
y

16
Outlook For
per
sona
l use
onl
y

17
17.5 18.0
18.5 19.0
5.00
7.00
9.00
11.00
13.00
15.00
17.00
19.00
FY15 FY16 FY17 FY18
Distributions to Stapled Securityholders
Forward looking statements by their very nature are subject to uncertainties and contingencies, many of which are outside the control of DUET
1. Subject to completion of DUET’s proposed acquisition of EDL and DUET’s forecast assumptions being met
DUET’s FY16 DPS guidance of 18.0cpss1
Guidance expected to be fully covered by forecast operating cash flows
DPS growth target re-established
DUET distributions
(cents per stapled security or cpss)1
FY18
Target
FY17
Target
FY16 guidance
post EDL
acquisition
announcement
FY 15
Actual For
per
sona
l use
onl
y
18
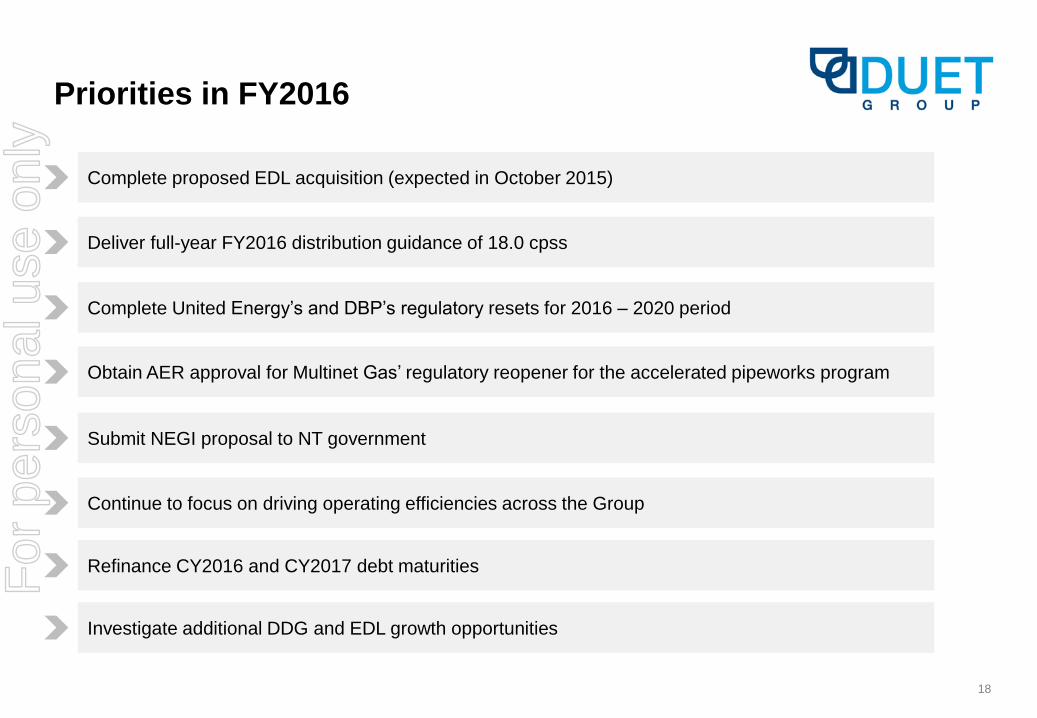
Deliver full-year FY2016 distribution guidance of 18.0 cpss
Complete United Energy’s and DBP’s regulatory resets for 2016 – 2020 period
Refinance CY2016 and CY2017 debt maturities
Investigate additional DDG and EDL growth opportunities
Obtain AER approval for Multinet Gas’ regulatory reopener for the accelerated pipeworks program
Continue to focus on driving operating efficiencies across the Group
Priorities in FY2016
Complete proposed EDL acquisition (expected in October 2015)
Submit NEGI proposal to NT government
For
per
sona
l use
onl
y

19
Questions For
per
sona
l use
onl
y
20
Appendix For
per
sona
l use
onl
y
21
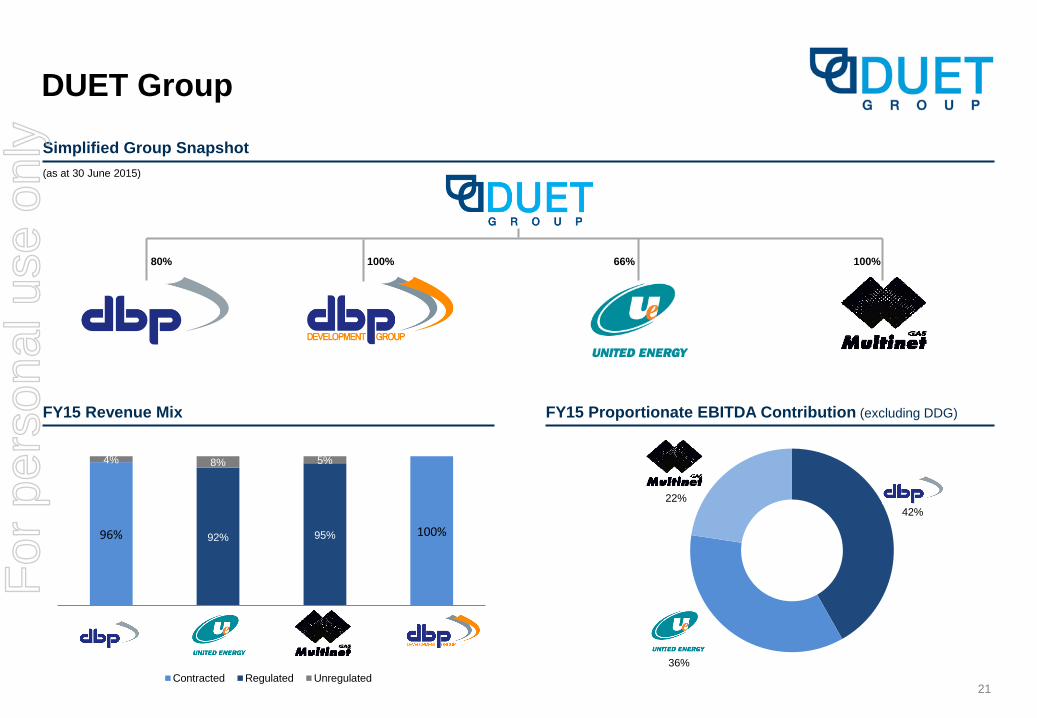
96% 100% 92% 95%
4% 8% 5%
DBP UED MGH DDG
Contracted Regulated Unregulated
42%
36%
22%
DUET Group
Simplified Group Snapshot
(as at 30 June 2015)
80% 100% 66% 100%
FY15 Proportionate EBITDA Contribution (excluding DDG) FY15 Revenue Mix
For
per
sona
l use
onl
y

22
DUET Group - Operating Company Locations
DBP Development Group
(DDG)
Dampier Bunbury Pipeline
(DBP)
United Energy
Multinet Gas
For
per
sona
l use
onl
y

23
$m
As at
30 Jun 15
As at
31 Dec 14
Cash Assets and Term Deposits 376 440
Other Current Assets 222 193
PP & E 6,003 5,966
Intangible Assets 2,034 2,051
Other Non-Current Assets 431 376
Total Assets 9,066 9,026
Interest Bearing Liabilities 5,731 5,579
Other Current Liabilities 492 514
Other Non-Current Liabilities 847 889
Total Liabilities 7,070 6,982
Net Assets 1,996 2,044
Total Equity 1,996 2,044
Consolidated Balance Sheet
For
per
sona
l use
onl
y

24
$m FY15 FY14
Net cash flows from operations 755 831
Payments for purchase of PP&E (466) (334)
Payments for purchase of software and other intangibles (35) (45)
Proceeds from /(Payments for) purchase of term deposits 28 (85)
Proceeds from asset sales 2 4
Net cash flows from investing (471) (460)
Cash flows from capital raising 411 239
Net payments to non-controlling interests (19) (28)
Borrowing (net of repayments) (142) 16
Finance costs paid (392) (437)
Dividends & distributions paid (243) (140)
Net cash flow from financing (387) (350)
Net increase / (decrease) in cash (103) 21
Consolidated Cash Flow Statement
For
per
sona
l use
onl
y

25
Reconciliation
$m DBP United Energy Multinet DDG Head Office Total
Proportionate EBITDA 255 238 122 9 (13) 611
Additional EBITDA from controlled assets 1 60 118 - - - 178
Net gain/(loss) on disposal of assets - (3) (6) - - (9)
Head Office project expenses - - - - (5) (5)
Changes in fair value of derivatives 7 (28) - - - (21)
Consolidated EBITDA 754
Controlled Assets
Interest income - 1 1 - - 2
Depreciation and amortisation (76) (150) (48) (2) - (276)
Finance costs (205) (162) (50) (5) - (422)
Head Office
Interest income 7 7
Depreciation and amortisation -
Profit before income tax expense 65
Proportionate EBITDA to Consolidated NPBT
1. To consolidate 100% of controlled energy utility EBITDA includes UEM EBITDA.
For
per
sona
l use
onl
y

26
1. Includes $201.2m of Redeemable Preference Shares owned by SGSPIAA, which are not eliminated on consolidation
2. This reconciliation item eliminates the fair value mark-to-market on the US$ denominated debt and includes the adjustment required to reflect fixed-rate debt at face value
3. Cash on Hand (including term deposits) for United Energy includes UE & Multinet Pty Limited cash of $0.6m
4. Includes $5m of Restricted Cash, primarily due to a deposit held to meet DFL’s AFSL obligations
5. Per the MIR
Reconciliation
$m DBP
United
Energy Multinet DDG Head Office DUET Group
Interest bearing liabilities 2,394.8 2,340.61
986.8 8.5 - 5,730.8
Add:
US$ Debt / Fair Value Adjustments2 - (78.6) (25.2) - - (103.9)
Capitalised Borrowing Costs 16.0 8.7 4.3 - - 29.0
Distribution Payable - - - - 130.7 130.7
(Less):
Cash on Hand3 (17.4) (5.8) (11.9) (6.7) (334.4)4
(376.2)
Finance Lease Liability (19.1) - - - - (19.1)
Minority share of RPS not eliminated on consolidation - (201.2) - - - (201.2)
DUET Group - Net debt 2,374.3 2,063.7 954.0 1.8 (203.6) 5,190.2
Less minority net debt (441.1) (701.8) - - - (1,142.9)
DUET Adjusted Proportionate Net External Debt5 1,933.2 1,361.9 954.0 1.8 (203.7) 4,047.3
Net Debt
For
per
sona
l use
onl
y

27
Reconciliation
$m DBP
United
Energy Multinet DDG Head
Office Total
Net Borrowing Costs per MIR (at 100%) 197.5 236.6 61.1 4.2 (7.0) 492.3
Less: RPS / Funding Arm Interest - (71.8) (11.5) (4.4) - (87.7)
Less: Capitalised Interest Income - - - (0.7) - (0.7)
Add/(Less): Fair Value Movement of Derivatives 7.2 (28.2) (0.2) - - (21.2)
Less: Debt Retirement Costs (2.4) - (0.9) - - (3.3)
Less: Blend and Extend Non-cash Interest Expense (21.4) - - - - (21.4)
Less: Interest on Decommissioning Charge (1.3) - - 0.2 - (1.2)
100% Net External Interest Expense 179.5 136.6 48.4 (0.7) (7.0) 356.8
Proportionate Net External Interest Expense per MIR 145.5 90.2 48.4 (0.7) (7.0) 276.4
Net External Interest Expense
For
per
sona
l use
onl
y

28
EDL: market leader in distributed generation
900MW of generation: #1 market position in core markets (focussed on sub 100MW market segment)
Predictable cash flows: tolling services agreements, long term offtake and gas supply agreements deliver predictable cash flows
Blue chip customer base: strong relationships with large scale customers
Recontracting track record: the value of incumbency and competitive advantage
Attractive growth prospects: experienced management team with proven ability to deliver growth
Remote Energy
• 381MW1 installed (43%)
• Power for mines and remote towns
• Mostly tolling arrangements or Fixed Price
Contracts with limited fuel or price risk at key
sites
• #1 market position in <100 MW sector in
Australia
Waste Coal Mine Gas
• 257MW1 installed (28%)
• Utilises waste gas from low-cost, long-life coking
coal mines
• Mostly Fixed Price Contracts (offtake) at key sites
• #1 market position in Australia with 100% market
share2
Landfill Gas
• 262MW1 installed (29%)
• Operations in Australia, US, UK/Europe
• Utilises waste gas from landfill sites
• Mostly Fixed Price Contracts (offtake) at key sites
• #1 Australian LFG generator with > 40% market
share
EDL Business Units
1. As at 30 June 2015. Remote Energy includes 22MW which are operated and maintained only. WCMG includes 5MW which are operated and maintained only. LFG includes 24MW that is 50%
owned via a Greece based joint venture
2. Excludes miners with self managed WCMG operations
For
per
sona
l use
onl
y

29
Take-or-Pay/Fixed
price1 86%
Variable Price 14%
EDL: Long dated contracts Expected to deliver highly predictable cashflow
EDL Weighted Average Contractual Years and Asset Life EDL FY15 revenue (%)
Power
Supply
Agreements
Gas Supply
Agreements
1. Refer to Appendix A (Key Risks) and Appendix H (Definition of Key Terms) for a definition of contract attributes
* As at 30 June 2015. Based on PPA maturity date for Remote Energy, GSA/LFGA maturity for WCMG and LFG
86% of revenues
Take-or-Pay/Fixed Price based
For
per
sona
l use
onl
y

30
EDL: Strong record of recontracting with bluechip
customers
Reflects the benefit of incumbency – assets and people on the ground
Strong relationships with large scale customers (26 in total)
147MW recontracted over the last 12 months1 with weighted average
contract extension of 11 years
• More than >550MW of contracts extended over the last 4 years
Recontracting actively pursued in advance of contract expiry
• EDL well advanced with negotiations regarding upcoming contract maturities
Remote Energy Waste Coal Mine Gas Landfill Gas
Investment Grade 84%
NEM2 10%
Not Rated 6%
1. 12 month period ended 31 December 2014
2. National Electricity Market
Counterparty credit ratings by
MW installed
For
per
sona
l use
onl
y
31
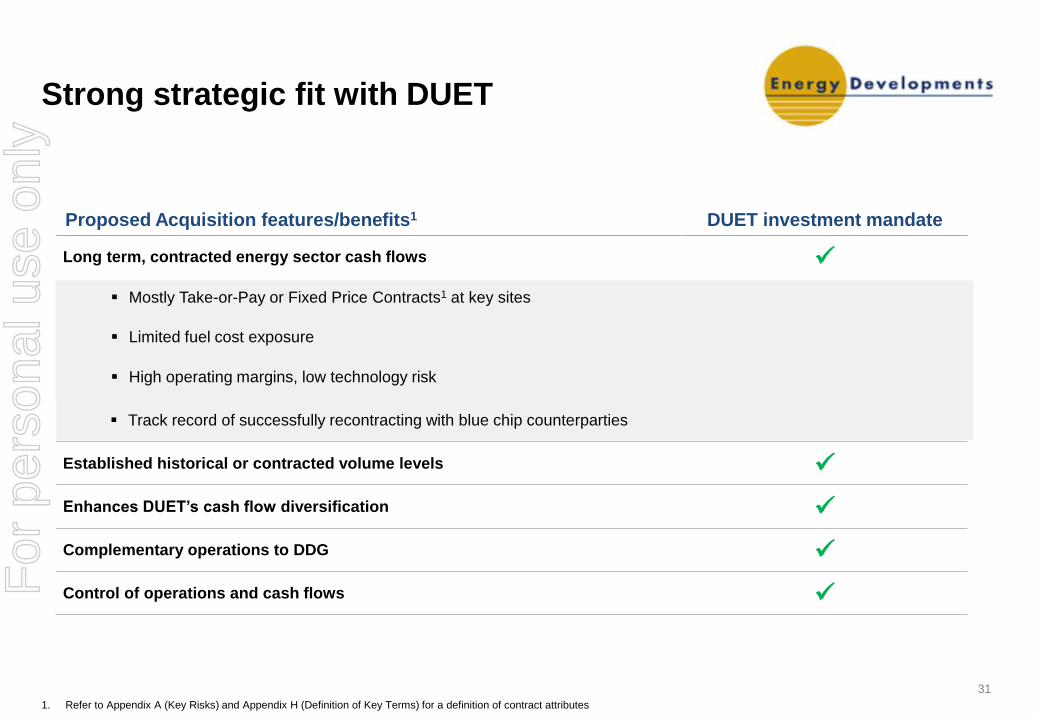
Proposed Acquisition features/benefits1 DUET investment mandate
Long term, contracted energy sector cash flows
Mostly Take-or-Pay or Fixed Price Contracts1 at key sites
Limited fuel cost exposure
High operating margins, low technology risk
Track record of successfully recontracting with blue chip counterparties
Established historical or contracted volume levels
Enhances DUET’s cash flow diversification
Complementary operations to DDG
Control of operations and cash flows
Strong strategic fit with DUET
1. Refer to Appendix A (Key Risks) and Appendix H (Definition of Key Terms) for a definition of contract attributes
.
For
per
sona
l use
onl
y
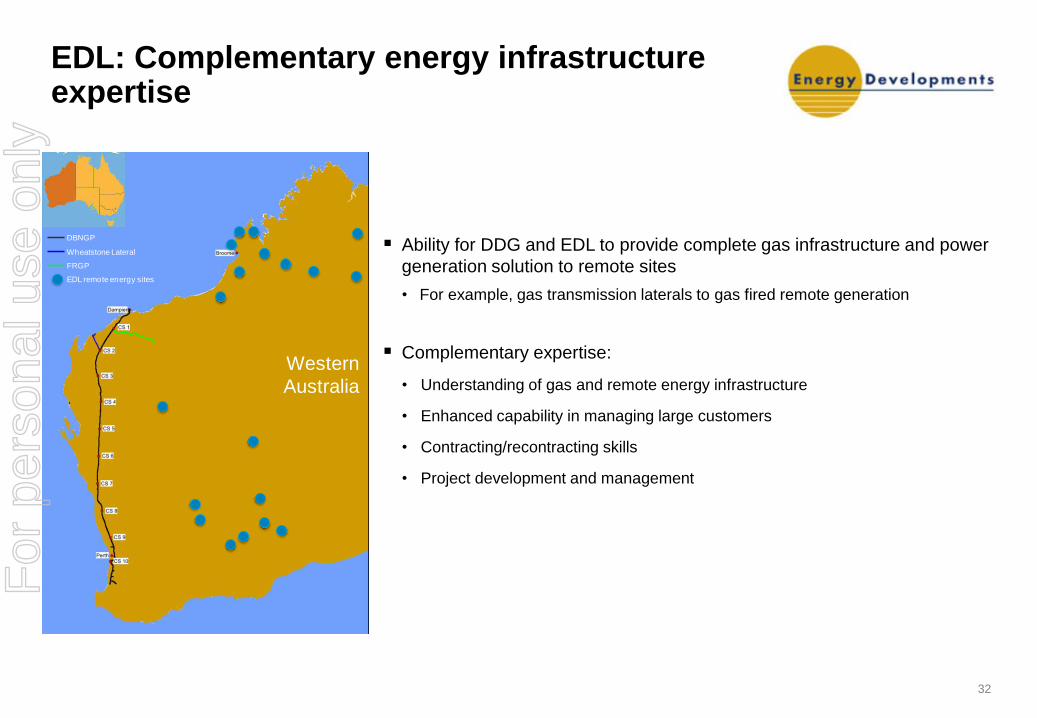
32
Ability for DDG and EDL to provide complete gas infrastructure and power
generation solution to remote sites
• For example, gas transmission laterals to gas fired remote generation
Complementary expertise:
• Understanding of gas and remote energy infrastructure
• Enhanced capability in managing large customers
• Contracting/recontracting skills
• Project development and management
EDL: Complementary energy infrastructure expertise
Western
Australia
DBNGP
Wheatstone Lateral
FRGP
EDL remote energy sites
For
per
sona
l use
onl
y