for electrochemical detection - university of surreyepubs.surrey.ac.uk/811032/1/thesis-final version...
TRANSCRIPT
Microelectrode Array Fabrication
for Electrochemical Detection
with Carbon Nanotubes
James Clark
Advanced Technology Institute
University of Surrey
This thesis is submitted for the degree of
Doctor of Philosophy
March 2016

I
Statement of Originality
This thesis and the work to which it refers are the results of my own efforts. Any ideas, data, images or
text resulting from the work of others (whether published or unpublished) are fully identified as such
within the work and attributed to their originator in the text, bibliography, or acknowledgements. This
thesis has not been submitted in whole or in part for any other academic degree or professional
qualification.
Guildford, 31st March 2016
II
Abstract
Understanding how the brain works remains one of the key challenges for scientists. To further this
understanding a wide variety of technologies and research methods have been developed. One such
technology is conductive electrodes, used to measure the electrical signals elicited from neuronal cells
and tissues. These electrodes can be fabricated as a singular electrode or as a multi-electrode array
(MEA). This permits bio-electrical measurements from one particular area or simultaneous
measurements from multiple areas, respectively. Studying electrical and chemical signals of individual
cells in situ requires the use of electrodes with ≤20 µm diameter. However, electrodes of this size
generally produce high impedance, perturbing recording of the small signals generated from individual
cells. Nanomaterials, such as carbon nanotubes (CNTs), can be deposited to increase the real surface
area of these electrodes, producing higher sensitivity measurements.
This thesis investigates the potential for using photo-thermal chemical vapour deposition grown CNTs
as the electrode material for a de novo fabricated MEA. This device aimed to measure electrochemical
signals in the form of dopamine, an important mammalian neurotransmitter, as well as conventional
bio-electrical signals that the device is designed for. Realising this aim began with improving CNT
aqueous wetting behaviour via oxygen plasma functionalisation. This procedure demonstrated grafting
of oxygen functional groups to the CNT structure, and dramatic improvements in aqueous wetting
behaviour, with CNTs attached to the device. Subsequently, oxygen plasma functionalised CNT-based
MEAs were fabricated and tested, allowing comparisons with a non-functionalised CNT MEA and a
state-of-the-art commercial MEA. The functionalised CNT MEA demonstrated an order of magnitude
improvement compared to commercial MEAs (2.75 kΩ vs. 25.6 kΩ), at the biologically relevant
frequency of 1 kHz. This was followed by measurement of one of the best sensitivity density values,
compared to the available literature, for the electrochemical detection of dopamine (9.48 µA µM-1 mm-
2). The functionalised CNT MEA then illustrated some selectivity compared to common interferents,
i.e. ascorbic acid, of a higher concentration. Nonetheless, imaging of the MEA revealed CNTs were
being removed from the electrode areas due to extensive use. Therefore, the final results chapter aimed
to develop a novel fabrication route for CNT-based MEAs that produced improved CNT retention on
the electrodes. This next-generation functionalised CNT-based MEA displayed improved CNT
retention, whilst also producing competitive electrochemical impedance values at 1 kHz (17.8 kΩ) and
excellent electrochemical selectivity for dopamine vs. ascorbic acid.
Overall, this thesis demonstrates the potential for using MEAs as electrochemical detectors of biological
molecules, specifically when using functionalised CNTs as the electrode material.

III
Acknowledgements
First and foremost I am sincerely grateful to my supervisors, Prof S. Ravi P. Silva & Dr Ying Chen. I
am thankful that they decided to offer me the chance to carry out my PhD in the first instance, in addition
to their continuous support throughout the project.
I am also indebted to my colleagues at the University of Surrey, specifically the Advanced Technology
Institute, for their time and effort in helping me with my project. I would also like to thank the Technical
Support Team, specifically Mr Anthony Corless and Dr Kostis Michelakis, for their help with CAD
design, developing key processes used in this work and general useful discussions.
I have been very lucky to have had the support of my partner in crime, Laura McEnaney, over the past
4 years. She has made every effort to pick me up when I have been down and I cannot thank her enough
for all she does every day. My friends Max Roberts & Darryl Kitney also deserve a special mention for
their help (and sometimes hindrance) in keeping me sane during my PhD.
Finally, I would like to thank my parents, as without their psychological (and financial) support I would
certainly not be where I am today.
On a scientific note, I would like to acknowledge Dr. Vlad Stolojan for operating and capturing the
transmission electron microscopy images used in Figure 4.5. I would also like to acknowledge Dr.
Steven Hinder for operation of the X-ray photoelectron spectrometer, where the data output has been
used to produce Figure 4.7 and Figure 4.8. Additionally, I would like to acknowledge Dr. Muhammad
Ahmad for his initial discussions and help in fabricating and characterising the device in Chapter 7.
Specifically, the metallic layer deposition on the device and CNT growth via photo-thermal chemical
vapour deposition, in addition to the scanning electron microscopy images used in Figure 7.2 and Figure
7.3.
Finally, the protective layer used to improve CNT retention, mentioned in Chapter 3 and Chapter 7, has
not been disclosed. This is because Dr Muhammad Ahmad and Prof S. Ravi P. Silva have submitted
this for Patent, and as such it is under the Patent review process.

IV
Table of Contents
Statement of Originality ....................................................................................................................... I
Abstract .............................................................................................................................................. II
Acknowledgements ........................................................................................................................... III
Table of Contents .............................................................................................................................. IV
List of Abbreviations ..................................................................................................................... VIII
List of Figures .................................................................................................................................... X
List of Tables ................................................................................................................................ XVII
List of Publications & Conference Presentations ....................................................................... XVIII
Chapter 1 – Introduction ......................................................................................................................... 1
Chapter 2 - Literature Review ................................................................................................................. 5
2.1. Introduction ................................................................................................................................ 5
2.2. Carbon Nanotubes ...................................................................................................................... 5
2.2.1. Definition ............................................................................................................................ 5
2.2.2. Synthesis ............................................................................................................................. 7
2.2.3. Properties ............................................................................................................................ 8
2.2.4. Functionalisation ............................................................................................................... 10
2.2.5. Nanomaterial Toxicology ................................................................................................. 12
2.3. Nanotechnology & Biological Detection ................................................................................. 15
2.3.1. Optical Based Biosensors .................................................................................................. 17
2.3.2. Electrochemical Based Biosensors ................................................................................... 20
2.3.3. Current Techniques for Neurotransmitter Detection ......................................................... 26
2.3.4. Microelectrode Arrays (MEAs) ........................................................................................ 30
2.3.4.1. Electrode Theory ........................................................................................................ 31
2.3.4.2. Electrode Materials .................................................................................................... 32
2.3.4.3. Transistor-based MEAs .............................................................................................. 35
2.3.4.4. Intracellular Recording Using MEAs......................................................................... 36
2.3.4.5. High-Density Electrode MEAs .................................................................................. 37

V
2.3.4.6. MEAs for Electrochemical Detection ........................................................................ 38
2.4. Summary .................................................................................................................................. 40
Chapter 3 – Experimental Techniques .................................................................................................. 42
3.1. Fabrication Techniques ............................................................................................................ 42
3.1.1. Substrate Cleaning ............................................................................................................ 42
3.1.2. Photolithography ............................................................................................................... 42
3.1.1.1. Sample Metallisation & Lift-Off ................................................................................ 44
3.1.3. Radio-Frequency Sputtering ............................................................................................. 45
3.1.4. Reactive-ion Etching ......................................................................................................... 45
3.1.5. Photo-Thermal Chemical Vapour Deposition – Carbon Nanotube Growth ..................... 46
3.2. Characterisation Techniques .................................................................................................... 48
3.2.1. Scanning Electron Microscopy ......................................................................................... 48
3.2.2. Transmission Electron Microscopy .................................................................................. 49
3.2.3. Contact Angle Measurements ........................................................................................... 49
3.2.4. X-ray Photoelectron Spectroscopy .................................................................................... 50
3.2.5. Raman Spectroscopy ......................................................................................................... 51
3.2.6. Electrochemical Impedance Spectroscopy ........................................................................ 52
3.2.7. Solutions Preparation ........................................................................................................ 54
3.2.8. Cyclic Voltammetry .......................................................................................................... 55
3.2.9. Differential Pulse Voltammetry ........................................................................................ 56
3.3. Summary .................................................................................................................................. 57
Chapter 4 - Functionalisation of CNTs by Oxygen Plasma .................................................................. 58
4.1. Introduction .............................................................................................................................. 58
4.2. Sample Preparation & Characterisation ................................................................................... 59
4.3. Imaging .................................................................................................................................... 61
4.4. Contact Angle Measurements .................................................................................................. 64
4.5. X-ray Photoelectron Spectroscopy Analysis ............................................................................ 65
4.6. Raman Spectroscopy Analysis ................................................................................................. 68
4.6.1. Raman Spectroscopy – Carbon Nanotube Sidewall Analysis ........................................... 71

VI
4.7. Summary .................................................................................................................................. 73
Chapter 5 - Fabrication and Characterisation of CNT-based MEAs .................................................... 75
5.1. Introduction .............................................................................................................................. 75
5.2. Device Production .................................................................................................................... 76
5.3. Device Characterisation ........................................................................................................... 78
5.3.1. Microscopy ....................................................................................................................... 78
5.3.2. Raman Spectroscopy ......................................................................................................... 80
5.3.3. Electrochemical Impedance Spectroscopy ........................................................................ 83
5.4. Summary .................................................................................................................................. 90
Chapter 6 - Electrochemical Detection Using Oxygen Plasma Functionalised CNT MEA ................. 93
6.1. Introduction .............................................................................................................................. 93
6.2. Solution & Equipment Preparation .......................................................................................... 93
6.3. Potassium Ferricyanide Electrochemistry ................................................................................ 94
6.3.1. Cyclic Voltammetry .......................................................................................................... 94
6.4. Dopamine Detection ................................................................................................................ 95
6.4.1. Cyclic Voltammetry .......................................................................................................... 95
6.4.2. Differential Pulse Voltammetry ........................................................................................ 98
6.4.3. Limit of Detection ........................................................................................................... 103
6.4.4. Repeatability ................................................................................................................... 103
6.5. Ascorbic Acid Detection ........................................................................................................ 104
6.5.1. Cyclic Voltammetry ........................................................................................................ 104
6.5.2. Differential Pulse Voltammetry ...................................................................................... 106
6.6. Interferents ............................................................................................................................. 107
6.7. Summary ................................................................................................................................ 109
Chapter 7 - Novel CNT-Based MEA Design and Characterisation .................................................... 113
7.1. Introduction ............................................................................................................................ 113
7.2. MEA Fabrication Procedure .................................................................................................. 113
7.3. Device Characterisation ......................................................................................................... 114
7.4. Imaging of CNT Growth & Device ....................................................................................... 115

VII
7.5. Raman Spectroscopy .............................................................................................................. 118
7.6. Electrochemical Characterisation .......................................................................................... 120
7.6.1. Impedance Spectroscopy ................................................................................................. 120
7.6.2. Wide-potential Window Scans ........................................................................................ 122
7.6.3. Response to Dopamine & Interferents ............................................................................ 124
7.7. Novel MEA Potential ............................................................................................................. 127
7.8. Summary ................................................................................................................................ 127
Chapter 8 – Conclusions & Future Work ............................................................................................ 129
8.1. Future Work ........................................................................................................................... 131
8.2. Summary ................................................................................................................................ 132
VIII
List of Abbreviations
AA Ascorbic Acid
AC Alternating Current
AuNP Gold Nanoparticle
BSA Bovine Serum Albumin
CCVD Catalytic Chemical Vapour Deposition
cDNA Complementary Deoxyribonucleic Acid
CMOS Complementary Metal Oxide Semiconductor
CNT Carbon Nanotube
CVD Chemical Vapour Deposition
DA Dopamine
DC Direct Current
DNA Deoxyribonucleic Acid
dsDNA Double Stranded Deoxyribonucleic Acid
EIS Electrochemical Impedance Spectroscopy
EP Pt Electroplated Platinum
FET Field Effect Transistor
FSCV Fast Scan Cyclic Voltammetry
GO Graphene Oxide
HPLC High Performance Liquid Chromatography
HR-TEM High Resolution Transmission Electron Microscopy
ITO Indium Tin-Oxide
LOD Limit of Detection
MEA Microelectrode Array
MEMS Micro-Electro Mechanical Systems
MIP Molecularly Imprinted Polymer
MMP Matrix Metalloproteinases
MWCNT Multi-Walled Carbon Nanotube
NIR Near Infra-red
NP Nanoparticle
PBS Phosphate Buffered Saline
PEDOT Poly(3,4-ethylenedioxythiophene)
PT-CVD Photo-Thermal Chemical Vapour Deposition
PVD Physical Vapour Deposition
QD Quantum Dot
RBM Radial Breathing Modes
RF Radio-Frequency
rGO Reduced Graphene Oxide
RIE Reactive Ion Etching
RNA Ribonucleic Acid
RSD Relative Standard Deviation
SEM Scanning Electron Microscopy

IX
ssDNA Single Stranded Deoxyribonucleic Acid
SWCNT Single-Walled Carbon Nanotube
TEM Transmission Electron Microscopy
UV Ultra-violet
XPS X-ray Photoelectron Spectroscopy

X
List of Figures
FIGURE 1.1: (A) IMAGE OF COMMERCIAL MEA, (B) OPTICAL MICROSCOPY IMAGE OF MOUSE HIPPOCAMPAL SLICE ON MEA, (C)
OUTPUT FROM IMAGE (B) AFTER STIMULATING ELECTRODE 45. (A) ADAPTED FROM 1. (B) AND (C) ADAPTED FROM 2. ............ 1
FIGURE 1.2: ILLUSTRATION OF A SYNAPSE IN THE NERVOUS SYSTEM, WHERE AN ELECTRICAL SIGNAL FROM THE FIRST NEURON IS
CONVERTED TO A CHEMICAL SIGNAL, THEN BACK INTO AN ELECTRICAL SIGNAL IN THE SECOND NEURON. ADAPTED FROM 3. ...... 2
FIGURE 2.1: ILLUSTRATION OF A HONEYCOMB LATTICE SINGLE GRAPHENE SHEET, WHICH CAN BE ROLLED UP TO FORM A SINGLE-
WALLED CARBON NANOTUBE. ADAPTED FROM 16. ..................................................................................................... 6
FIGURE 2.2: SCHEMATIC REPRESENTING SINGLE-WALLED CARBON NANOTUBES (SWCNT) AND MULTI-WALLED CARBON NANOTUBES
(MWCNT). MWCNT CONSIST OF CONCENTRIC SWCNTS. ADAPTED FROM 17. ............................................................. 7
FIGURE 2.3: SCHEMATIC OF THE CNT (MWCNT HERE) GROWTH PROCESS USING CHEMICAL VAPOUR DEPOSITION, WHERE M IS
METAL CATALYST & C IS CARBON. (A) DURING THE ANNEALING STAGE A REDUCED METALLIC NANOPARTICLE IS FORMED. (B)
WHEN THE CARBON GAS FEEDSTOCK IS INTRODUCED (C2H2 HERE) IT IS CATALYSED BY THE REDUCED METALLIC NANOPARTICLE
INTO SOLID GRAPHITIC CARBON. (C) THE PROCESS CONTINUES WITH GRAPHITIC CARBON BEING DEPOSITED, FORMING A TUBE.
(D) THE PROCESS ENDS WHEN THE CATALYST NANOPARTICLE IS ‘POISONED’ AND A CARBON SHELL COVERS THE NANOPARTICLE
SURFACE. ADAPTED FROM 14. ................................................................................................................................ 8
FIGURE 2.4: IMAGES OF A RNA-FUNCTIONALISED CNT. (B, C) ATOMIC FORCE MICROSCOPY IMAGES SHOWING HEIGHT AND PHASE
PROFILE, RESPECTIVELY. (D) THREE-DIMENSIONAL REPRESENTATION OF RNA-FUNCTIONALISED CNT SHOWING PEAKS (P),
VALLEYS (V) AND THE DISTANCES BETWEEN THEM. ADAPTED FROM 48. ........................................................................ 11
FIGURE 2.5: REPRESENTATIVE ILLUSTRATION OF A SWCNT NON-COVALENTLY FUNCTIONALISED WITH DOXORUBICIN, AND
COVALENTLY FUNCTIONALISED TO A BOVINE SERUM ALBUMIN (BSA)/FLUORESCEIN/ANTIBODY COMPLEX. ADAPTED FROM 28. 12
FIGURE 2.6: SCANNING ELECTRON MICROSCOPY AND OPTICAL MICROSCOPY IMAGES INDICATING THE GENERATION OF GRANULOMAS
WITH LONGER FIBRES. ADAPTED FROM 6. ............................................................................................................... 14
FIGURE 2.7: OVERVIEW OF THE MAIN COMPONENTS OF A NANO-BIOSENSOR. ....................................................................... 16
FIGURE 2.8: SCHEMATIC ILLUSTRATING COLOURMETRIC METHODS ASSOCIATED WITH AUNPS. (A) CROSSLINKING AGGREGATION AND
(B) NON-CROSSLINKING AGGREGATION. ADAPTED FROM 87. ...................................................................................... 17
FIGURE 2.9: DETECTION MECHANISM USING PEROXIDASE-LIKE ACTIVITY OF OXIDISED SWCNTS. ADAPTED FROM 47. .................... 19
FIGURE 2.10: ILLUSTRATION OF SYNAPTIC TRANSMISSION EVENT, INCLUDING THE ARRIVAL OF AN ELECTRICAL SIGNAL TO THE
PRESYNAPTIC TERMINAL, THE RELEASE OF CHEMICAL NEUROTRANSMITTERS INTO THE SYNAPTIC SPACE, AND BINDING OF THESE
CHEMICALS TO RECEPTORS ON THE POSTSYNAPTIC NEURON. ADAPTED FROM 105. .......................................................... 21
FIGURE 2.11: ILLUSTRATION OF A GRAPHENE OXIDE SHEET ON A GLASSY CARBON ELECTRODE, WHERE THE DOPAMINE (DA) IS
ELECTROSTATICALLY ATTRACTED AND THE ASCORBIC ACID (AA) IS ELECTROSTATICALLY REPELLED. ADAPTED FROM 109. .......... 22
FIGURE 2.12: DIFFERENTIAL PULSE VOLTAMMETRY RESPONSE OF A MWCNT-DIHEXADECYL HYDROGEN PHOSPHATE MODIFIED
ELECTRODE TO FOUR DIFFERENT ANALYTES, ASCORBIC ACID (AA), DOPAMINE (DA), URIC ACID (UA), AND SEROTONIN (5-HT).
ADAPTED FROM 107. .......................................................................................................................................... 23
FIGURE 2.13: (A) FABRICATION PROCEDURE TO PRODUCE A MOLECULARLY-IMPRINTED POLYMER (MIP). (B) RESPONSE, IN TERMS OF
PEAK CURRENT, OF MIP, NON-IMPRINTED POLYMER (NIP), AND AU ELECTRODE TO 15 µM OF DOPAMINE (DA), ASCORBIC
ACID (AA), AND URIC ACID (UA). ADAPTED FROM 115. ............................................................................................. 25

XI
FIGURE 2.14: REPRESENTATION OF MICRODIALYSIS PLACEMENT AND USE. (A) SCHEMATIC OF HOW A CANNULA WITH THE
MICRODIALYSIS PROBE INSIDE CAN BE INSERTED INTO A REGION OF INTEREST. (B) SCHEMATIC OF HOW ANALYTES OF INTEREST
DIFFUSE FROM THE TISSUES, AROUND BLOOD VESSELS (V), INTO THE MICRODIALYSIS PROBE. ADAPTED FROM 119. ............... 27
FIGURE 2.15: REPRESENTATION OF A HIGH-PERFORMANCE LIQUID CHROMATOGRAPHY (HPLC) SET-UP INDICATING HOW THE SAMPLE
IS INJECTED INTO THE SOLVENT PHASE JUST PRIOR TO THE HPLC COLUMN. THE SAMPLE INTERACTION WITH THE SOLVENT
(MOBILE PHASE) AND COLUMN (STATIONARY PHASE) DETERMINES THE ELUTION TIME. THE ELUTED SAMPLES ARE MEASURED BY
A DETECTOR AFTER THE HPLC COLUMN. ADAPTED FROM 121. .................................................................................... 28
FIGURE 2.16: SCANNING ELECTRON MICROSCOPY IMAGE OF A CARBON FIBRE MICROELECTRODE. ADAPTED FROM 125. .................. 29
FIGURE 2.17: EQUIVALENT CIRCUIT MODEL FOR PLANAR METAL ELECTRODE IN SOLUTION INDICATING A SINGLE TIME CONSTANT. CDL IS
THE DOUBLE LAYER CAPACITANCE OF THE ELECTRODE, RS IS THE SERIES RESISTANCE OF THE SOLUTION, RE IS THE RESISTANCE OF
THE ELECTRODE. ............................................................................................................................................... 31
FIGURE 2.18: (A) PHOTOGRAPH OF A FLEXIBLE ALL-CNT BASED MEA FABRICATED IN PARYLENE. ADAPTED FROM 147. (B) SCANNING
ELECTRON MICROSCOPY IMAGE OF A NANO BORON-DOPED DIAMOND/CNT ELECTRODE. ADAPTED FROM 145. ..................... 35
FIGURE 2.19: IMAGE OF A NEURON WHERE THE PROJECTIONS (AXON AND DENDRITE) ARE INDUCED TO GROW DIRECTLY ABOVE
SILICON NANOWIRE FIELD-EFFECT TRANSISTORS USED FOR ELECTRICAL MEASUREMENTS. ADAPTED FROM 152. ..................... 36
FIGURE 2.20: SCANNING ELECTRON MICROSCOPY IMAGE OF AN ELECTRODE IN A MEA SYSTEM WITH FIVE VERTICAL PT NANOWIRES
PROTRUDING FROM THE INSULATING MATERIAL (SI3N4), ADAPTED FROM 156. (B) TRANSMISSION ELECTRON MICROSCOPY IMAGE
OF A ‘GOLD MUSHROOM’ ELECTRODE ENGULFED BY AN APLYSIA NEURON, SCALE BAR: 500 NM, ADAPTED FROM 157. ........... 37
FIGURE 2.21: (A) OPTICAL MICROSCOPY IMAGE OF A LABELLED NEURON OVER A NUMBER OF ELECTRODES. (B) INDICATES TRAVEL OF
SIGNAL FROM STIMULATION (RED CROSS) ALONG AXON TO SOMA (LARGEST DEPOLARISATION) ONWARD TO THE DENDRITE. (C)
LATENCY OF SIGNAL, WITH T=0 AT THE LARGEST VOLTAGE SIGNAL (SOMA), AND STIMULATION OCCURRING AT RED CROSS.
ADAPTED FROM 159. .......................................................................................................................................... 38
FIGURE 2.22: (A) RESPONSE OF PPY-RGO ELECTRODE TO VARIOUS CONCENTRATIONS OF DOPAMINE USING CONSTANT POTENTIAL
AMPEROMETRY. (B) OPTICAL MICROSCOPE IMAGE OF PC12 CELL CULTURE ON MEA, WITH AN ELECTROCHEMICAL RESPONSE TO
A CELL AT ELECTRODE 56 DEMONSTRATED BELOW. ADAPTED FROM 163. ...................................................................... 40
FIGURE 3.1: SCHEMATIC ILLUSTRATING THE PROCESS OF PHOTOLITHOGRAPHY USING A ‘POSITIVE’-TYPE PHOTORESIST................... 43
FIGURE 3.2: PHOTOGRAPHS ILLUSTRATING AN EXAMPLE OF PHOTOLITHOGRAPHY, (A) PHOTOMASK USED AND (B) SAMPLE THAT HAS
UNDERGONE PHOTOLITHOGRAPHY USING THE PHOTOMASK IN (A) AND HAS BEEN METALLISED AND ‘LIFTED-OFF’. ................ 45
FIGURE 3.3: SIMULATED IMAGE OF THE INSIDE OF THE CHAMBER PROVIDING PT-CVD ASSISTED GROWTH OF CNTS. THE IR LAMPS
PROVIDE ENERGY DIRECTED AT THE SUBSTRATE THROUGH A QUARTZ PLATE. THE SUBSTRATE IS LOCATED ABOVE A SI WAFER AND
CARBON FIBRE (CF) MAT WITH CONVECTIONAL WATER COOLING APPLIED UNDERNEATH (WATER PLATE). ........................... 47
FIGURE 3.4: SCHEMATIC DEMONSTRATING THE ELECTRON PATH IN A SCANNING ELECTRON MICROSCOPE FROM EMISSION AT THE
ELECTRON SOURCE TO INTERACTION WITH THE SAMPLE, PRODUCING SECONDARY ELECTRONS WHICH ARE DETECTED TO PRODUCE
AN IMAGE. ADAPTED FROM 169. ........................................................................................................................... 48
FIGURE 3.5: CONTACT ANGLE MEASUREMENT OF A LIQUID DROPLET ON A SOLID MATERIAL SURFACE. (LEFT) DEMONSTRATING
PARAMETERS OF ΓLV (LIQUID-VAPOUR INTERFACE), ΓSV (SOLID-VAPOUR INTERFACE), AND ΓSL (SOLID-LIQUID INTERFACE), THE
ANGLE FORMED IS FOR FAVOURABLE WETTING AS THE CONTACT ANGLE IS LESS THAN 90º. (RIGHT) UNFAVOURABLE WETTING AS
THE CONTACT ANGLE IS HIGHER THAN 90º. ADAPTED FROM 171. ................................................................................. 50

XII
FIGURE 3.6: ILLUSTRATION OF THE X-RAY PHOTOELECTRON SPECTROSCOPY TECHNIQUE DEMONSTRATING HOW X-RAYS DIRECTED AT
THE SAMPLE CAN EJECT CORE SHELL ELECTRONS ALLOWING ELEMENTAL ANALYSIS. ADAPTED FROM 172. .............................. 51
FIGURE 3.7: PHOTOGRAPH, WITH ILLUSTRATIONS, OF THE EQUIPMENT SET-UP. THE ELECTRODE(S) ARE SET-UP IN THE FARADAY CAGE
AND CONNECTED TO THE POTENTIOSTAT. THE NOVA SOFTWARE RUNS AND ANALYSES THE RESPONSE FROM THE
POTENTIOSTAT. THE N2 LINE IS USED TO PURGE THE SOLUTIONS BEFORE MEASUREMENTS (OPTIONAL). ............................. 53
FIGURE 3.8: (A) PHOTOGRAPH AND (B) SCHEMATIC OF THE ELECTRODE SET-UP WITH THE MEA DEVICE. (A) PHOTOGRAPH OF THE
COMMERCIAL ELECTROPLATED PT MEA WITH THE REFERENCE ELECTRODE (RE) AND COUNTER ELECTRODE (CE) IN SOLUTION
INSIDE THE PLASTIC RING. A CROCODILE CLIP (BOTTOM) IS CONNECTED TO THE WORKING ELECTRODE BOND-PAD, THE BOND-PAD
HAS ALUMINIUM FOIL ATTACHED FOR PROTECTION AND TO INCREASE SURFACE AREA FOR CROCODILE CLIP ATTACHMENT. (B)
SCHEMATIC OF THE SET-UP INDICATING THE PERCOLATION PATH FROM THE CROC CLIP ON THE WORKING ELECTRODE (WE)
BOND-PAD, ALONG THE UNDERLYING TRACKING (ITO FOR COMMERCIAL MEA) TO THE WE IN RED. ................................. 54
FIGURE 3.9: GRAPHICAL REPRESENTATION OF THE TRIANGULAR WAVEFORM APPLIED DURING CYCLIC VOLTAMMETRY.................... 55
FIGURE 3.10: GRAPHICAL REPRESENTATION OF THE PULSE SYSTEM APPLIED DURING A DIFFERENTIAL PULSE VOLTAMMETRY SCAN. ... 56
FIGURE 4.1: ILLUSTRATION OF VARIOUS TYPES OF CNT FUNCTIONALISATION AND THE PROCESSES USED. ADAPTED FROM 42. .......... 59
FIGURE 4.2: TEMPERATURE PROFILE OF THE SUBSTRATE DURING THE CNT GROWTH PROCESS. THE SOLID LINE REPRESENTS THE
READING FROM THE PYROMETER (BOTTOM OF SUBSTRATE) AND THE DOTTED LINE REPRESENTS THE READING FROM THE
THERMOCOUPLE (TOP OF SUBSTRATE). * SHOWS THE CHANGE FROM ANNEAL STAGE TO GROWTH STAGE, • REPRESENTS END OF
GROWTH STAGE. ............................................................................................................................................... 60
FIGURE 4.3: SEM IMAGES OF CNT FOREST(S) THAT ARE (A) NON-FUNCTIONALISED, AND EXPOSED TO OXYGEN PLASMA FOR (B) 2
SECONDS, (C) 15 SECONDS, AND (D) 50 SECONDS. (A) SHOWS VERTICALLY-ALIGNED GROWTH WITH MINIMAL PERTURBATIONS
TO THE FOREST (TILT 45ᵒ), (B) SHOWS THAT THESE AREAS OF FUNCTIONALISATION ARE NUMEROUS AND ILLUSTRATES OBVIOUS
CHANGES AFTER SHORT FUNCTIONALISATION OF 2 SECONDS (TILT 45ᵒ). (C) MAGNIFIED VIEW OF AN AFFECTED AREA DUE TO
FUNCTIONALISATION (TILT 45ᵒ), AND (D) INDICATES THE DEPTH OF THE MORPHOLOGICAL CHANGES (TILT 70ᵒ). .................. 61
FIGURE 4.4: SEM IMAGES OF CNTS THAT ARE (A) NON-FUNCTIONALISED (TILT 45ᵒ), AND EXPOSED TO OXYGEN PLASMA FOR (B) 2
SECONDS (TILT 45ᵒ), (C) 15 SECONDS (TILT 45ᵒ), AND (D) 50 SECONDS (TILT 45ᵒ). NO DIFFERENCE IS READILY OBSERVED
BETWEEN (A) AND (B). SMALL MORPHOLOGICAL CHANGES IN CNT STRUCTURE ARE NOTICEABLE WITH 15 SECONDS
FUNCTIONALISATION I.E. (C), AND (D) ILLUSTRATES MORE APPARENT MORPHOLOGICAL CHANGES COMPARED TO NON-
FUNCTIONALISED CNTS. ..................................................................................................................................... 62
FIGURE 4.5: TEM IMAGES OF (A,B) NON-FUNCTIONALISED CNTS, AND (C,D) CNTS FUNCTIONALISED IN OXYGEN PLASMA FOR 15
SECONDS. (B) RED ARROWS INDICATE PRESENCE OF AMORPHOUS CARBON SHELL ON CNTS. ............................................ 63
FIGURE 4.6: CONTACT ANGLE IMAGES OF CNTS. (A) NON-FUNCTIONALISED - 135ᵒ. (B, C, D) EXPOSED TO OXYGEN PLASMA AT 50
WATTS FOR 2 SECONDS, 15 SECONDS AND 50 SECONDS, RESPECTIVELY. PRODUCING CONTACT ANGLES OF 0ᵒ, 0ᵒ AND 17ᵒ,
RESPECTIVELY. .................................................................................................................................................. 64
FIGURE 4.7: X-RAY PHOTOELECTRON SPECTRA OF (A) NON-FUNCTIONALISED CNT, AND OXYGEN PLASMA EXPOSED CNTS FOR (B) 2
SECONDS, (C) 15 SECONDS, AND (D) 50 SECONDS. ALL SPECTRA ARE ILLUSTRATED WITH THEIR IDENTIFIABLE PEAKS I.E. C1S,
N1S AND O1S, THE RESPECTIVE PERCENTAGES OF EACH ATOM FOR EACH SAMPLE ARE IN TABLE 4.1. ................................ 65
FIGURE 4.8: XPS SPECTRA OF CNTS, FOCUSING ON THE C1S PEAK AREA. (A) NON-FUNCTIONALISED. (B-D) OXYGEN PLASMA EXPOSED
CNTS AT 50 W FOR (B) 2 SECONDS, (C) 15 SECONDS, AND (D) 50 SECONDS. BLACK LINE IS ORIGINAL SPECTRUM, BLUE LINES

XIII
ARE THE FITTED PEAK AREAS (GAUSSIAN:LORENTZIAN 70:30) CORRESPONDING TO TABLE 4.2, AND RED LINE IS CUMULATIVE
FIT. ................................................................................................................................................................ 67
FIGURE 4.9: RAMAN SPECTRA OF (A) NON-FUNCTIONALISED CNTS AND CNTS THAT HAVE BEEN OXYGEN PLASMA FUNCTIONALISED
FOR (B) 2 SECONDS, (C) 15 SECONDS, AND (D) 50 SECONDS. THE MAIN PEAKS WHICH ARE DISCUSSED IN THE TEXT ARE
LABELLED, I.E. D PEAK ~1340 CM-1, G PEAK ~1585 CM-1, AND 2D PEAK ~2680 CM-1. ................................................. 69
FIGURE 4.10: RAMAN SPECTROSCOPY SPECTRA SHOWING THE D PEAK AND G PEAK REGION FOR (A) NON-FUNCTIONALISED CNTS AND
CNTS THAT HAVE BEEN OXYGEN PLASMA FUNCTIONALISED FOR (B) 2 SECONDS, (C) 15 SECONDS, AND (D) 50 SECONDS. ALL
SPECTRA HAVE THE ORIGINAL SPECTRUM (BLACK LINE), THE FITTED PEAKS (BLUE LINES) AND THE CUMULATIVE FIT PEAK (RED
LINE). ............................................................................................................................................................. 70
FIGURE 4.11: RAMAN ANALYSIS OF THREE DIFFERENT AREAS OF THE SIDE OF THE CLEAVED CNT FOREST, ALL GRAPHS SHOW NON-
FUNCTIONALISED (BLACK), AND FUNCTIONALISED FOR 2 SECONDS (BLUE), 15 SECONDS (RED), 50 SECONDS (GREEN). RAMAN
SIDE ON AT THE TOP (A-B), MIDDLE (C-D), AND BOTTOM (E-F) OF THE CNT FOREST, THIS IS ALSO SHOWN ON THE RIGHT SIDE OF
EACH GRAPH. ................................................................................................................................................... 72
FIGURE 5.1: SCHEMATIC OF THE MICROELECTRODE ARRAY FABRICATION PROCESS DISCUSSED IN SECTION 5.2. * REPRESENTS THE
BOND-PAD AREA FOR THE ELECTRODE. ................................................................................................................... 76
FIGURE 5.2: LAYOUT OF MEA MASK FOR PHOTOLITHOGRAPHY PURPOSES, BLUE AREAS ARE EXPOSED TO UV DURING THE FIRST
PHOTOLITHOGRAPHY STEP (STEP 1, FIGURE 5.1). BLUE AREAS ARE ALSO UNDERNEATH EVERY GREEN AREA IN THIS DESIGN, THE
BLUE AREAS ARE DESIGNED TO PROVIDE THE UNDERLYING TRACKING METAL. THE GREEN AREAS ARE FOR THE SECOND UV
EXPOSURE (STEP 3, FIGURE 5.1). ......................................................................................................................... 77
FIGURE 5.3: GRAPH TO DEMONSTRATE THE CHANGE IN TEMPERATURE OF THE MICROELECTRODE ARRAY SUBSTRATE(S) OVER THE CNT
GROWTH PERIOD. THE MICROELECTRODE ARRAY THAT WENT ON TO BE OXYGEN PLASMA FUNCTIONALISED IS THE BLACK LINE,
AND THE MICROELECTRODE ARRAY THAT STAYED NON-FUNCTIONALISED IS THE RED LINE. THE CONTINUOUS LINE IS THE
PYROMETER RECORDING (BOTTOM OF SUBSTRATE) AND THE DOTTED LINE IS THE THERMOCOUPLE RECORDING (TOP OF
SUBSTRATE). * INDICATES THE CHANGE FROM THE ANNEALING STAGE TO THE GROWTH STAGE. ........................................ 78
FIGURE 5.4: IMAGES OF MICROELECTRODE ARRAY AFTER COMPLETE FABRICATION PROCESS. (A,B) SEM IMAGES OF TWO SEPARATE
ELECTRODES ON THE NON-FUNCTIONALISED MICROELECTRODE ARRAY. (C) SEM IMAGE OF AN ELECTRODE AFTER OXYGEN
PLASMA FUNCTIONALISATION. (D) OPTICAL MICROSCOPE IMAGE OF THE MICROELECTRODE ARRAY, BLACK AREAS INDICATE CNTS
ONLY PRESENT ON ELECTRODES AND THERE IS NO SIGN OF CRACKS/PERTURBATIONS IN THE SIO2 PASSIVATION LAYER AFTER CNT
GROWTH. ........................................................................................................................................................ 79
FIGURE 5.5: RAMAN SPECTRA OF BOTH MICROELECTRODE ARRAYS BEFORE ANY POST-GROWTH TREATMENT WAS MEASURED FROM
FIVE SEPARATE ELECTRODES ON EACH MICROELECTRODE ARRAY, ARRAY I (A, C) AND ARRAY II (B, D). THE GRAPHS ILLUSTRATE
THE MAIN PEAKS DISCUSSED IN THE TEXT, I.E. RADIAL BREATHING MODES (RBM), D PEAK, G PEAK AND 2D PEAK. THE
RESPONSE OF BOTH MICROELECTRODE ARRAYS TO THE 514 NM WAVELENGTH LASER IS SHOWN (A, B), IN ADDITION TO A
MAGNIFIED VIEW OF THIS RESPONSE IN THE AREA OF THE D PEAK AND G PEAK (C, D). ..................................................... 80
FIGURE 5.6: RAMAN SPECTRA SPECIFICALLY ILLUSTRATING THE RADIAL BREATHING MODE REGION FOR BOTH CNT MEAS PRIOR TO
ONE BEING OXYGEN PLASMA FUNCTIONALISED (N=6 FOR BOTH, SPECTRA ARE OVERLAID). PEAKS LOCATED BETWEEN 140 CM-1
AND 210 CM-1 REPRESENT SEMICONDUCTING (SC) CNTS, THOSE LOCATED BETWEEN 210 CM-1 AND 280 CM-1 REPRESENT
METALLIC (M) CNTS. ........................................................................................................................................ 81

XIV
FIGURE 5.7: RAMAN SPECTRA OF FUNCTIONALISED MICROELECTRODE ARRAY I, THE GRAPHS ILLUSTRATE THE MAIN PEAKS DISCUSSED
IN THE TEXT, I.E. D PEAK, G PEAK AND 2D PEAK. (A) SPECTRUM OF FIVE SEPARATE ELECTRODES AFTER FUNCTIONALISATION AND
(B) MAGNIFIED VIEW OF SPECTRUM (A) FOCUSING ON D PEAK AND G PEAK, INDICATING GOOD CONSISTENCY BETWEEN
ELECTRODES ON THE SAME MICROELECTRODE ARRAY. (C) COMPARISON OF RAMAN SPECTRA OF THE SAME MICROELECTRODE
ARRAY BEFORE (BLACK LINE) AND AFTER (RED LINE) OXYGEN PLASMA FUNCTIONALISATION. (D) MAGNIFIED VIEW OF (C)
INDICATING CHANGE IN D PEAK AND G PEAK DUE TO OXYGEN PLASMA FUNCTIONALISATION. ............................................ 82
FIGURE 5.8: ELECTROCHEMICAL IMPEDANCE SPECTRA OF COMMERCIAL EP PT MICROELECTRODE ARRAY. (A, B) SEPARATED BODE
PLOT INDICATING HOW BOTH |Z| AND PHASE CHANGE WITH THE APPLIED FREQUENCY OF SIGNAL. (C) NYQUIST PLOT AND (D)
MAGNIFIED VIEW OF NYQUIST PLOT INDICATING HOW THE IMAGINARY COMPONENT OF IMPEDANCE (-IM(Z)) AND REAL
COMPONENT OF IMPEDANCE (RE(Z)) INTERACT. ..................................................................................................... 84
FIGURE 5.9: ELECTROCHEMICAL IMPEDANCE SPECTRA OF NON-FUNCTIONALISED CNT MICROELECTRODE ARRAY. (A, B) SEPARATED
BODE PLOT INDICATING HOW BOTH |Z| AND PHASE CHANGE WITH THE APPLIED FREQUENCY OF SIGNAL. (C) NYQUIST PLOT AND
(D) MAGNIFIED VIEW OF NYQUIST PLOT. ................................................................................................................ 85
FIGURE 5.10: ELECTROCHEMICAL IMPEDANCE SPECTRA OF FUNCTIONALISED CNT MICROELECTRODE ARRAY. (A, B) SEPARATED BODE
PLOT INDICATING HOW BOTH |IMPEDANCE| AND PHASE CHANGE WITH THE APPLIED FREQUENCY OF SIGNAL. (C) NYQUIST PLOT
AND (D) MAGNIFIED VIEW OF NYQUIST PLOT. ......................................................................................................... 86
FIGURE 5.11: ELECTROCHEMICAL IMPEDANCE SPECTROSCOPY SPECTRA, BODE PLOT ((A) AND (B)) OF ALL MEA TYPES TESTED I.E.
COMMERCIAL EP PT (BLACK), NON-FUNCTIONALISED CNT (RED) AND FUNCTIONALISED CNT (BLUE). ............................... 87
FIGURE 5.12: NYQUIST PLOT OF THE RESPONSE OF ALL THREE MEA TYPES, COMMERCIAL EP PT (BLACK), NON-FUNCTIONALISED CNT
(RED), AND FUNCTIONALISED CNT (BLUE). GRAPHS DECREASE IN TERMS OF SCALE FROM (A) DOWN TO (D). (A) ILLUSTRATES
THE LARGEST SEMICIRCLE FOR EVERY MEA, (B) SHOWS SMALLER NON-FUNCTIONALISED CNT SEMICIRCLE, (C) SHOWS SMALLER
EP PT SEMICIRCLE, AND (D) SHOWS SMALLER FUNCTIONALISED CNT SEMICIRCLE. ......................................................... 88
FIGURE 5.13: LIKELY EQUIVALENT CIRCUIT MODEL FOR THE ELECTRODES USED HERE. TAKEN FROM 27. ....................................... 88
FIGURE 5.14: GRAPHICAL REPRESENTATION OF TABLE 5.2, ILLUSTRATING THE ELECTRODE INTERFACIAL IMPEDANCE AT 1 KHZ AGAINST
GEOMETRIC SURFACE AREA FOR NUMEROUS LITERATURE AND COMMERCIAL MEAS. HERE, THE VALUES FOR ‘THIS WORK’
SHOWN BY GREEN STARS ARE FOR NON-FUNCTIONALISED CNT (HIGHER IMPEDANCE – DASHED ORANGE CIRCLE) AND OXYGEN
PLASMA FUNCTIONALISED CNT (LOWER IMPEDANCE – SOLID ORANGE CIRCLE). ............................................................. 89
FIGURE 6.1: CYCLIC VOLTAMMETRY RESPONSE TO POTASSIUM FERRICYANIDE (1 MM) IN 0.5M KNO3 USING (A) COMMERCIAL EP PT
ELECTRODE, AND (B) FUNCTIONALISED CNT MEA. .................................................................................................. 95
FIGURE 6.2: RESPONSE TO 50 µM DOPAMINE OF (A) COMMERCIAL EP PT MEA AND (D) FUNCTIONALISED CNT MEA, OVER A
RANGE OF SCAN RATES FROM 20 MV/S UP TO 100 MV/S IN 10 MV/S STEPS. ............................................................... 96
FIGURE 6.3: CYCLIC VOLTAMMOGRAMS SHOWING THE RESPONSE OF BOTH (A) COMMERCIAL EP PT MEA AND (C) FUNCTIONALISED
CNT MEA TO VARIOUS DOPAMINE CONCENTRATIONS. (A) CV MEASUREMENT OF PBS (BLACK LINE), 10 µM, 20 µM, 30 µM,
40 µM, 50 µM AND 100 µM OF DOPAMINE USING THE COMMERCIAL EP PT MEA AT 100 MV/S. (B) RELATIONSHIP BETWEEN
PEAK CURRENT AND CONCENTRATION OF DOPAMINE USING COMMERCIAL EP PT MEA, ANODIC RESPONSE (BLACK)
Y=0.0086X+0.1938 WITH R2 = 0.98, CATHODIC RESPONSE (BLUE) Y=-0.0076X-0.5106 WITH R2 = 0.96. (C) CV
MEASUREMENT OF PBS (BLACK LINE), 1 µM, 10 µM, 20 µM, 30 µM, 40 µM, 50 µM AND 100 µM OF DOPAMINE USING
THE FUNCTIONALISED CNT MEA AT 100 MV/S. (D) RELATIONSHIP BETWEEN PEAK CURRENT AND CONCENTRATION OF

XV
DOPAMINE USING FUNCTIONALISED CNT ELECTRODE, ANODIC RESPONSE (BLACK) Y=0.0074X-0.0183 WITH R2 = 0.99,
CATHODIC RESPONSE (BLUE) Y=-0.0035X-0.0049 WITH R2 = 0.99. .......................................................................... 97
FIGURE 6.4: DIFFERENTIAL PULSE VOLTAMMOGRAMS DEMONSTRATING THE RESPONSE OF THE COMMERCIAL EP PT MEA TO VARIOUS
CONCENTRATIONS OF DOPAMINE, THE RESPONSE OF ONE ELECTRODE WAS TESTED THREE TIMES. (A, B, C) RESPONSE OF THE
ELECTRODE TO PBS (BLACK LINE), 0.2 µM, 0.4 µM, 0.6 µM, 0.8 µM, 1 µM, 2 µM, 5 µM, 10 µM, 50 µM. .................. 99
FIGURE 6.5: DIFFERENTIAL PULSE VOLTAMMOGRAMS DEMONSTRATING THE RESPONSE OF THE FUNCTIONALISED CNT MEA TO
VARIOUS CONCENTRATIONS OF DOPAMINE. THE RESPONSE OF ONE ELECTRODE WAS TESTED THREE TIMES AND EACH TEST TIME
HAS TWO VOLTAMMOGRAMS (A & B), (C & D), (E & F). (A, C, E) RESPONSE OF THE ELECTRODE TO PBS (BLACK LINE), 1 µM, 2
µM, 5 µM, 10 µM, 50 µM. (B, D, F) RESPONSE OF THE ELECTRODE TO PBS (BLACK LINE), 0.2 µM, 0.4 µM, 0.6 µM, 0.8
µM, 1 µM, 2 µM, 5 µM, 10 µM. ..................................................................................................................... 100
FIGURE 6.6: GRAPH TO ILLUSTRATE THE SENSITIVITY OF BOTH MEAS TO VARYING DOPAMINE CONCENTRATIONS USING DIFFERENTIAL
PULSE VOLTAMMETRY (DPV). (A) GRAPH ILLUSTRATES HOW DPV PEAK CURRENT CHANGES LINEARLY WITH DOPAMINE
CONCENTRATION FOR BOTH FUNCTIONALISED CNT MEA (BLACK) AND COMMERCIAL EP PT MEA (BLUE). FUNCTIONALISED
CNT MEA REPORTS Y=3.79X-0.78 WITH R2 = 0.99, COMMERCIAL EP PT REPORTS Y=0.08X-0.05 WITH R2 = 0.99. (B)
ENLARGED VIEW OF COMMERCIAL EP PT MEA RESPONSE SHOWN ON GRAPH (A)........................................................ 101
FIGURE 6.7: REPEAT MEASUREMENTS (N=5) OF PBS USING (A) COMMERCIAL EP PT MEA AND (B) FUNCTIONALISED CNT MEA.
RSD WERE OBTAINED FOR EACH ELECTRODE FOR LIMIT OF DETECTION CALCULATIONS................................................... 103
FIGURE 6.8: DIFFERENTIAL PULSE VOLTAMMOGRAMS OF (A) COMMERCIAL EP PT MEA AND (B) FUNCTIONALISED CNT MEA, BOTH
SHOWING REPEATED MEASUREMENTS (N=10) OF 10 µM DOPAMINE. PBS IS THE BLACK LINE IN BOTH AND GRAPHS HAVE BEEN
PROCESSED SO THAT THE PEAK HEIGHT IS THE SAME FOR EACH RUN. .......................................................................... 104
FIGURE 6.9: VOLTAMMETRIC RESPONSE OF (A) COMMERCIAL EP PT MEA AND (B) FUNCTIONALISED CNT MEA TO 100 µM
ASCORBIC ACID USING SCAN RATES OF 20 MV/S UP TO 100 MV/S, IN 10 MV/S INCREMENTS. ....................................... 105
FIGURE 6.10: VOLTAMMETRIC RESPONSE OF (A) COMMERCIAL EP PT MEA AND (B) FUNCTIONALISED CNT MEA TO PBS (BLACK
LINE) AND VARIOUS CONCENTRATIONS OF ASCORBIC ACID (100 µM, 200 µM, 400 µM AND 500 µM). ......................... 105
FIGURE 6.11: DIFFERENTIAL PULSE VOLTAMMOGRAMS OF RESPONSE TO VARIOUS CONCENTRATIONS OF ASCORBIC ACID. (A, C, E)
RESPONSES OF ONE COMMERCIAL EP PT ELECTRODE, (B, D, F) RESPONSES OF ONE FUNCTIONALISED CNT ELECTRODE, TO PBS
(BLACK LINE), 100 µM, 200 µM, 300 µM, 400 µM, 500 µM ASCORBIC ACID. ........................................................ 106
FIGURE 6.12: RESPONSE OF FUNCTIONALISED CNT MEA TO VARIOUS CONCENTRATIONS OF ASCORBIC ACID, MEASURED USING
DIFFERENTIAL PULSE VOLTAMMETRY. A LINEAR RESPONSE WAS RECORDED WITH Y=0.00046X-0.00646 (R2 = 0.99). ...... 107
FIGURE 6.13: CYCLIC VOLTAMMOGRAMS ILLUSTRATING THE RESPONSE OF BOTH (A) COMMERCIAL EP PT MEA AND (B)
FUNCTIONALISED CNT MEA TO PBS (BLACK), ASCORBIC ACID (BLUE), URIC ACID (BROWN), NORADRENALINE (GREEN), AND
DOPAMINE (RED). ........................................................................................................................................... 108
FIGURE 6.14: DIFFERENTIAL PULSE VOLTAMMOGRAMS ILLUSTRATING THE RESPONSE OF BOTH (A) COMMERCIAL EP PT MEA AND (B)
FUNCTIONALISED CNT MEA TO PBS (BLACK), ASCORBIC ACID (BLUE), URIC ACID (BROWN), NORADRENALINE (GREEN), AND
DOPAMINE (RED). ........................................................................................................................................... 109
FIGURE 6.15: IMAGES OF FUNCTIONALISED CNT MEA (A) BEFORE AND (B) AFTER USE FOR ELECTROCHEMICAL DETECTION. THE
ELECTRODES IN USE APPEAR TO HAVE HAD THE CNTS REMOVED AS THEY ARE NOT BLACK ANY LONGER. ............................ 112
XVI
FIGURE 7.1: SCHEMATIC OF THE FABRICATION PROCESS OF THE NOVEL MICROELECTRODE ARRAY. * REPRESENTS THE WORKING
ELECTRODE BOND-PAD AREA. ............................................................................................................................ 114
FIGURE 7.2: SEM IMAGES OF CNT GROWTH (A,B), AND REACTION TO SUBSEQUENT SONICATION (C-F), EITHER USING A PROTECTIVE
CATALYST LAYER (B,D,F), OR NOT (A,C,E). ............................................................................................................ 116
FIGURE 7.3: SEM IMAGES OF VARIOUS AREAS OF THE CNT-BASED MEA PRIOR TO SU-8 PROCESSING STEP. ............................ 117
FIGURE 7.4: OPTICAL MICROSCOPE AND SEM IMAGES OF PATTERNED AREAS AFTER SU-8 PROCESSING INDICATING THE EXPOSURE OF
CNTS IN DESIRED ELECTRODE AREAS. (B) IMAGE TAKEN AT 16 µM DIAMETER ELECTRODE, (C) IMAGE TAKEN AT 150 µM
DIAMETER ELECTRODE, (D) IMAGE TAKEN IN BOND PAD AREA. .................................................................................. 118
FIGURE 7.5: RAMAN SPECTRA FROM SIX SEPARATE ELECTRODES FOR (A) BEFORE SU-8 PROCESSING AND (B) AFTER SU-8 PROCESSING.
THE MAIN PEAKS, I.E. D PEAK – 1348 CM-1, G PEAK – 1580 CM-1, AND 2D PEAK – 2700 CM-1. ................................... 119
FIGURE 7.6: RAMAN SPECTRA INDICATING THE DIFFERENCE IN CNT QUALITY BEFORE AND AFTER THE SU-8 PROCESSING STEP. (A)
DISPLAYS THE FULL RAMAN SPECTRA WITH IMPORTANT PEAKS, (B) MAGNIFIED VIEW OF THE D PEAK AND G PEAK AREA,
INDICATING THE CHANGE IN D PEAK INTENSITY DUE TO SU-8 PROCESSING. ................................................................. 119
FIGURE 7.7: ELECTROCHEMICAL IMPEDANCE SPECTRA OF THE NOVEL FUNCTIONALISED CNT MEA, SHOWING A SEPARATED BODE
PLOT INDICATING HOW BOTH (A) |IMPEDANCE| AND (B) PHASE CHANGE WITH THE APPLIED FREQUENCY OF SIGNAL. BLACK
SQUARES ARE RESPONSE OF THE 150 µM DIAMETER ELECTRODE AND RED CIRCLES ARE THE RESPONSE OF THE 16 µM DIAMETER
ELECTRODE. ................................................................................................................................................... 120
FIGURE 7.8: ELECTROCHEMICAL IMPEDANCE SPECTRA OF THE NOVEL FUNCTIONALISED CNT MEA, SHOWING THE NYQUIST PLOT FOR
(A) 150 µM DIAMETER ELECTRODE AND (B) 16 µM DIAMETER ELECTRODE. ................................................................ 121
FIGURE 7.9: POTENTIAL EQUIVALENT CIRCUIT MODELS TO DESCRIBE THE NYQUIST PLOT PRODUCED FROM THE NOVEL FUNCTIONALISED
CNT MEA PRESENTED HERE. ............................................................................................................................ 122
FIGURE 7.10: WIDE POTENTIAL WINDOW SCANS OF FOUR DIFFERENT ELECTRODES, COMMERCIAL EP PT (BLACK), FUNCTIONALISED
CNT MEA (20 µM DIAMETER ELECTRODE - RED), NOVEL FUNCTIONALISED CNT MEA (150 µM DIAMETER ELECTRODE - BLUE),
AND NOVEL FUNCTIONALISED CNT MEA (16 µM DIAMETER ELECTRODE - GREEN). SCANS IN PBS, RAN AT 1 V/S. ............. 123
FIGURE 7.11: RESPONSE TO 50 µM DOPAMINE BY NOVEL FUNCTIONALISED CNT MEA ELECTRODE OF 150 µM DIAMETER. (A) GRAPH
ILLUSTRATING INCREASING PEAK CURRENT WITH INCREASING SCAN RATE, FROM 10 MV/S TO 100 MV/S IN 10 MV/S STEPS. (B)
LINEAR RESPONSE OF PEAK ANODIC (BLACK) AND CATHODIC (BLUE) CURRENT TO SCAN RATE (R2 = 0.99), ANODIC RESPONSE
WAS Y=0.06006X+1.71603, CATHODIC RESPONSE WAS Y=-0.04568X-1.50403. (C) RESPONSE OF PEAK CURRENT TO
SQUARE ROOT OF SCAN RATE. ............................................................................................................................ 125
FIGURE 7.12: RESPONSE TO 50 µM DOPAMINE BY NOVEL FUNCTIONALISED CNT MEA ELECTRODE OF 16 µM DIAMETER. .......... 125
FIGURE 7.13: DPV RESPONSE OF (A) 150 UM AND (B) 16 UM TO PBS USED AS A CONTROL (BLACK), DOPAMINE (DA) 10 µM, AND
ASCORBIC ACID (AA) 1 MM. ............................................................................................................................. 126
FIGURE 7.14: SCHEMATIC ILLUSTRATING THE FUTURE EXPERIMENTS NEEDED TO VALIDATE THE NOVEL FUNCTIONALISED CNT MEA
FABRICATED HERE. DA – DOPAMINE, AA – ASCORBIC ACID, NA – NORADRENALINE, UA – URIC ACID, 5-HT – SEROTONIN,
DOPAC – 3,4-DIHYDROXYPHENYLACETIC ACID. ................................................................................................... 127

XVII
List of Tables
TABLE 2.1: OVERVIEW OF THE COMMERCIALLY AVAILABLE MICROELECTRODE ARRAYS FOR ELECTROPHYSIOLOGICAL DETECTION. ...... 30
TABLE 3.1: OVERVIEW OF THE METALLIC LAYERS DEPOSITED FOR SAMPLES IN EACH CHAPTER. INCLUDES THEIR THICKNESSES, AND
WHETHER PHOTOLITHOGRAPHY WAS USED TO DEFINE PATTERNS OR NOT. PL IS PROTECTIVE LAYER. ................................... 45
TABLE 3.2: OVERVIEW OF THE PARAMETERS USED IN PT-CVD ASSISTED GROWTH OF CNTS FOR EVERY SAMPLE THROUGHOUT THIS
THESIS. ........................................................................................................................................................... 46
TABLE 3.3: RESPONSE OF CIRCUIT COMPONENTS IN TERMS CURRENT VS. VOLTAGE, IN ADDITION TO THE PARAMETERS THAT AFFECT
IMPEDANCE FOR EACH CIRCUIT COMPONENT. ......................................................................................................... 52
TABLE 4.1: ATOMIC PERCENTAGES FOR EVERY ATOM IDENTIFIED ON THE XPS SPECTRA OF EACH SAMPLE. PERCENTAGES DEFINED BY
CALCULATING THE NORMALISED AREA UNDER THE CURVE, ALSO SENSITIVITY FACTORS HAVE BEEN USED TO DEFINE THESE ATOMIC
PERCENTAGES, OXYGEN=0.66 AND CARBON=0.25. SHIRLEY BACKGROUND USED FOR EVERY PEAK. ................................... 66
TABLE 4.2: XPS PEAK CHARACTERISTICS AND INTEGRATED PEAK AREAS FOR NON-FUNCTIONALISED AND OXYGEN PLASMA
FUNCTIONALISED SAMPLES. ................................................................................................................................. 68
TABLE 4.3: TABLE OF RAMAN PEAK FIT PARAMETERS FOR THE NON-FUNCTIONALISED CNTS AND OXYGEN PLASMA FUNCTIONALISED
CNTS. ............................................................................................................................................................ 71
TABLE 5.1: EQUIVALENT CIRCUIT FITTING VALUES OF A POROUS COATED METAL FOR ALL ELECTRODES TESTED. ............................. 89
TABLE 5.2: TABLE TO DEMONSTRATE THE VALUES OF IMPEDANCE AT 1 KHZ, AS DETERMINED BY ELECTROCHEMICAL IMPEDANCE
SPECTROSCOPY, FOR VARIOUS MATERIALS OF VARYING ELECTRODE SURFACE AREA. THESE ARE THE VALUES REPORTED IN FIGURE
5.14. ............................................................................................................................................................. 92
TABLE 6.1: AN OVERVIEW OF REPORTS INVESTIGATING THE SENSITIVITY OF THE FABRICATED SENSOR TO DOPAMINE. SPECIFICALLY
ILLUSTRATING THE SENSITIVITY DENSITY OF THE ELECTRODES AND HOW THE REPORTED VALUE IN THIS REPORT IS HIGHLY
COMPETITIVE WITH THOSE FOUND IN THE LITERATURE. THE REPORTS ARE LISTED FROM LOWEST SENSITIVITY DENSITY TO
HIGHEST, WITH THE ADDITION OF REPORTS WHICH DO NOT SPECIFY AN ELECTRODE AREA AND THUS CANNOT BE COMPARED. FOR
TECHNIQUE, DPV – DIFFERENTIAL PULSE VOLTAMMETRY, CPA – CONSTANT POTENTIAL AMPEROMETRY, CV – CYCLIC
VOLTAMMETRY, AND SWV – SQUARE WAVE VOLTAMMETRY. .................................................................................. 102
TABLE 7.1: EQUIVALENT CIRCUIT FITTING VALUES FOR BOTH ELECTRODE SIZES TESTED ON THE NOVEL FUNCTIONALISED CNT MEA.
................................................................................................................................................................... 124

XVIII
List of Publications & Conference Presentations
Papers
J. Clark*, J.V. Anguita*, Y. Chen, S.R.P. Silva, “Optical nanostructures in 2D for wide-
diameter and broadband beam collimation”, 2016, Scientific Reports, 6, 18767.
J. Clark, Y. Chen, S.R.P. Silva “Low impedance functionalised carbon nanotube electrode
arrays for electrochemical detection”, 2016, Electroanalysis 28, 1, 58-62.
Oral Presentations
J. Clark, Y. Chen, S.R.P. Silva “Low impedance functionalised carbon nanotube electrode
arrays for electrochemical detection”, eMRS Fall Meeting, Warsaw, Poland, September 2015.

Chapter 1 Introduction
1
Chapter 1 – Introduction
The aim of this thesis is to provide evidence for the use of functionalised carbon nanotubes (CNTs) as
an electrode material, primarily to improve the performance of microelectrode arrays (MEAs) as
electrochemical detectors for biological samples.
Understanding how the brain outputs complex behaviours, using a multitude of electrical and chemical
signals, is still not fully understood. A wide variety of techniques, including biological sensors and
imaging techniques, are used in an attempt to elucidate specific responses in the neural network. One
such sensor, which is the focus of this thesis, is electrodes used for sensing electrical signals from
biological cells or tissues. These are generally one of two types, either a singular electrode, such as a
patch-clamp or carbon-fibre electrode, which measures a signal from one specific area. Or a device that
has multiple individually-addressable electrodes, usually in the form of a MEA, measuring the response
to a stimulus at multiple locations simultaneously, in a cell culture or tissue (Fig. 1.1). MEAs are devices
that consist of a number of individually-addressable electrodes located in a specific pattern, e.g. an 8x8
grid of 64 electrodes. The electrodes are usually between 10 µm and 100 µm in diameter, their use is
almost exclusively by electrophysiologists who use them to measure electrical signals generated by
excitable cells.
Figure 1.1: (a) Image of commercial MEA, (b) optical microscopy image of mouse hippocampal slice on
MEA, (c) output from image (b) after stimulating electrode 45. (a) Adapted from 1. (b) and (c) Adapted from 2.
These devices are able to illustrate how a signal propagates around a system in response to a stimulus
at a given location. This is particularly useful in pharmacological research, where investigators may
want to observe how a system responds to the application of a drug. However, electrical signals are not
the only type of signal present in the nervous system. The brain has a number of different chemicals
which it uses as part of the signalling process, these are called neurotransmitters. These chemicals are
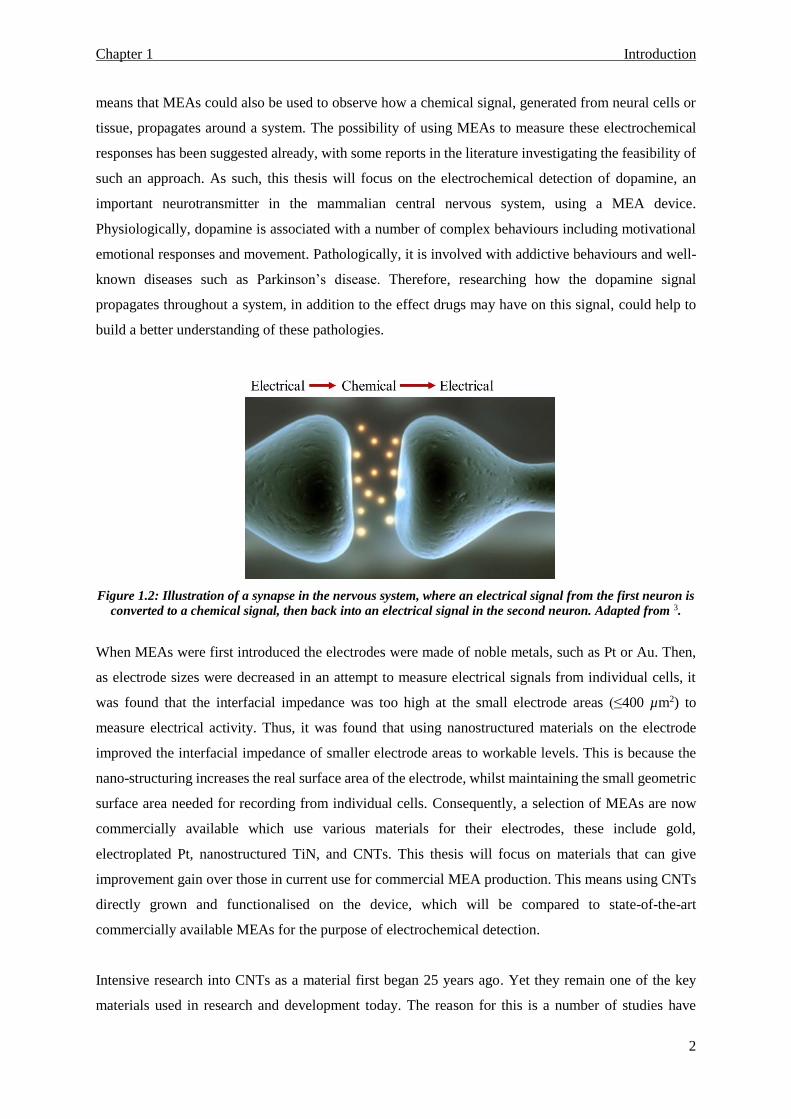
released in the nervous system when an electrical signal reaches a ‘synapse’ (Fig. 1.2). This potentially
Chapter 1 Introduction
2
means that MEAs could also be used to observe how a chemical signal, generated from neural cells or
tissue, propagates around a system. The possibility of using MEAs to measure these electrochemical
responses has been suggested already, with some reports in the literature investigating the feasibility of
such an approach. As such, this thesis will focus on the electrochemical detection of dopamine, an
important neurotransmitter in the mammalian central nervous system, using a MEA device.
Physiologically, dopamine is associated with a number of complex behaviours including motivational
emotional responses and movement. Pathologically, it is involved with addictive behaviours and well-
known diseases such as Parkinson’s disease. Therefore, researching how the dopamine signal
propagates throughout a system, in addition to the effect drugs may have on this signal, could help to
build a better understanding of these pathologies.
Figure 1.2: Illustration of a synapse in the nervous system, where an electrical signal from the first neuron is
converted to a chemical signal, then back into an electrical signal in the second neuron. Adapted from 3.
When MEAs were first introduced the electrodes were made of noble metals, such as Pt or Au. Then,
as electrode sizes were decreased in an attempt to measure electrical signals from individual cells, it
was found that the interfacial impedance was too high at the small electrode areas (≤400 µm2) to
measure electrical activity. Thus, it was found that using nanostructured materials on the electrode
improved the interfacial impedance of smaller electrode areas to workable levels. This is because the
nano-structuring increases the real surface area of the electrode, whilst maintaining the small geometric
surface area needed for recording from individual cells. Consequently, a selection of MEAs are now
commercially available which use various materials for their electrodes, these include gold,
electroplated Pt, nanostructured TiN, and CNTs. This thesis will focus on materials that can give
improvement gain over those in current use for commercial MEA production. This means using CNTs
directly grown and functionalised on the device, which will be compared to state-of-the-art
commercially available MEAs for the purpose of electrochemical detection.
Intensive research into CNTs as a material first began 25 years ago. Yet they remain one of the key
materials used in research and development today. The reason for this is a number of studies have

Chapter 1 Introduction
3
revealed the remarkable strength of CNTs, in addition to their excellent thermal and electrical
conductivity. Observations of their considerable aspect-ratio, as well as the properties already
mentioned, has helped to fuel their use in numerous research areas. One such area is nanobiotechnology,
where CNTs have been developed into drug delivery vectors, incorporated into biological assays, or
used as an integral part of biosensors. Despite these exceptional properties, CNTs are yet to be widely
adopted in commercial products. This is likely due to inherent limitations of CNTs, particularly as a
bio-material. The main drawback is that they are entirely insoluble in water, meaning their incorporation
into solution-processable devices and physiological-based devices is difficult. Furthermore,
manipulation to precisely place them is challenging at the best of times. This difficulty is manifested by
bundling of CNTs in solution-processed devices leading to poor output, and by air pockets being
generated at the interface between CNTs and aqueous solutions.4,5 Additionally, whilst a significant
amount of work has been carried out on improving the control over CNT growth, it is still difficult to
completely control CNT chirality, length, and defect density, all of which affect device characteristics
and physiological toxicology. This point leads on to the final limitation, the potential for CNTs to
generate a negative toxicological status in mammals due to their shape and aspect-ratio. Some studies
have highlighted the difficulty of eliminating CNTs from biological tissues in vivo. Additionally,
investigations into the nanotoxicology of CNTs has suggested their potential to cause cancer-like
profiles in animals exposed to them, similar to that of asbestos fibres.6 Some of these limitations
associated with CNTs have been circumvented, to some degree, by the implementation of CNT
functionalisation. A wide variety of functionalisation procedures including modifying CNTs with
proteins, oxygen functional groups, and other nanomaterials, have dramatically improved their
biocompatibility and aqueous wetting behaviour.
With all of this information in mind, this thesis aims to fabricate a complete MEA with photo-thermal
chemical-vapour-deposition grown and functionalised CNTs as the electrode material. Chapter 2
provides background information on CNTs and nanobiotechnology, with a particular focus on MEA
devices in the later section. The section on CNTs as a material focuses on their properties, synthesis
and the functionalisation techniques available, in addition to the current toxicological response to CNTs.
A review of biosensors follows, along with an in-depth look at MEAs, both commercially available and
those fabricated for a custom output, e.g. intracellular signal recording or electrochemical detection.
Chapter 3 details all of the materials and methods used to fabricate and characterise the devices
proposed in this thesis, in addition to discussing the background of certain techniques where necessary.
Chapter 4, the first results chapter in this thesis, investigates the potential for oxygen plasma exposure
to functionalise CNTs, thus modifying their wetting behaviour with aqueous solutions. As CNTs were
grown directly on the MEA device, in an effort to maximise the real electrode surface area, a
functionalisation technique that can be carried out and will not affect other device components was
Chapter 1 Introduction
4
needed. As such, oxygen plasma functionalisation was examined as it has been proven to modify CNTs
behaviour to become hydrophilic, whilst causing minimal damage to other device components. The
results demonstrated grafting of oxygen containing functional groups onto the CNT structure after only
a few seconds of exposure, dramatically improving the aqueous wetting behaviour of the CNTs.
Following on from these observations, Chapter 5 detailed the fabrication of a MEA with CNTs grown
specifically on the electrode areas by photo-thermal chemical-vapour deposition. These devices were
then exposed to oxygen plasma for a specified time according to results obtained in Chapter 4. The
electrochemical impedance was proven to reduce considerably due to functionalisation of the CNTs,
such that the functionalised CNT MEA recorded an order of magnitude improvement, in terms of
interfacial impedance, compared to the state-of-the-art commercial MEA tested. After investigating the
impedance of the fabricated functionalised CNT MEA, the electrochemical response was tested in
Chapter 6. Again, the results revealed an improvement by using the functionalised CNT MEA compared
to the state-of-the-art commercial MEA. This time the sensitivity for dopamine detection illustrated a
45-times improvement by using the functionalised CNT MEA compared to the commercial MEA, in
addition to a 115-times enhancement in the detection limit for dopamine. However, it was observed that
the CNTs were being removed from the electrode surface over successive experiments, perhaps due to
the weak bonding between the CNT and substrate. Consequently Chapter 7, the final results chapter,
outlines a novel fabrication method which aims to improve the adhesion of CNTs to the substrate, whilst
retaining the impressive impedance and electrochemical responses previously measured by the
functionalised CNT MEA. Results indicated that the fabricated novel functionalised CNT MEA
displayed impedance values similar to the commercial state-of-the-art MEA. Additionally, preliminary
results for this novel functionalised CNT MEA indicate the potential to measure physiologically
relevant concentrations of dopamine, whilst maintaining selectivity against common electrochemical
interfering molecules.
Finally, Chapter 8 concludes this thesis with a summary of the key achievements in terms of the
technologies put forward here. A critical assessment of the suitability for CNT-based MEAs to be used
as bio-electrochemical research tools is also undertaken, followed by ideas for possible areas of future
research.

Chapter 2 Literature Review
5
Chapter 2 - Literature Review
2.1. Introduction
This chapter aims to identify and review the existing literature that is associated with, and has been used
to shape, the current project. The first section analyses the research carried out on carbon nanotubes
(CNTs) to date, particularly reviewing the exceptional properties and functionalisation potential that
make them a suitable candidate material for the microelectrode array (MEA) devices proposed here.
The second section focuses on the area of nanobiotechnology, comparing the devices and sensors that
have been created to date, with respect to their signal output. Moreover, as the analyte of interest is a
neurotransmitter, the physiological mode of action of neurotransmitters, in addition to the current
techniques available to measure them, are described to ascertain the current state of technology. Finally,
this chapter closes with detailing the industrial and academic research to date investigating the type of
device fabricated in this project, i.e. MEAs. This final section details the extensive research effort aimed
at improving the parameters of bio-electrical detection in this device, whilst highlighting the limited
work conducted thus far in the field for bio-chemical sensors, the principal aim of this project.
2.2. Carbon Nanotubes
2.2.1. Definition
Nanocarbons have received considerable attention from the wider scientific community, particularly
over the last three decades since the discovery of the C60 buckminster-fullerene in 1985.7 Following the
theoretical probability and experimental observation of the C60 fullerene was the seminal paper on CNTs
by Iijima in 1991.8 This paper demonstrated the synthesis and observation of helical microtubules of
carbon, a material that is now called ‘multi-wall carbon nanotubes’ (MWCNT). Interestingly, these
MWCNT had been described and observed as early as 1952,9 yet this paper in 1991 followed by the
observation of single-wall carbon nanotubes (SWCNT) in 1993,10,11 sparked significant interest in this
carbon allotrope.
CNTs in the form of SWCNT, can be simply defined as a seamlessly rolled-up honeycomb graphene
sheet. In turn, graphene is determined to be a two-dimensional sheet of sp2 hybridised carbon with a
thickness of one-atom in its purest form. The unit cell OAB’B illustrated in Figure 2.1 is a diagram of
a graphene sheet which aids the description of a number of parameters of CNTs, which subsequently
govern its properties. The chiral vector, denoted by 𝐶ℎ in Figure 2.1, assigns the chirality of the
nanotube, which determines its electrical properties.12,13 𝐶ℎ is defined by two integers (n, m) such that

Chapter 2 Literature Review
6
𝐶ℎ = 𝑛𝑎1 + 𝑚𝑎2 allowing connection between two sites on the honeycomb lattice. This connection
on Figure 2.1 is between O and A, therefore the integers (n, m) are equal to (4, 2). The chiral vector
produces an angle termed the chiral angle (Θ on Fig. 2.1), this angle is used to define three different
types of SWCNTs, zigzag nanotubes (Θ = 0ᵒ), armchair nanotubes (Θ = 30ᵒ), and chiral nanotubes
(30ᵒ<Θ<0ᵒ). The chiral vector and chiral angle values determine the electronic properties of the CNT,
such that all armchair geometries, in addition to when 𝑛 − 𝑚 = 3𝑥 are metallic in nature. All other
types are semiconducting in nature and have bandgaps of up to 2 eV, these bandgaps are defined by
tube curvature effects and tube radius.14,15 Therefore, when considering electrical devices, CNTs may
be appealing as they can be tuned to be either semiconducting or metallic, depending on their chirality.
This makes the range of potential applications for CNTs extremely wide, particularly with respect to
electronic devices.
Figure 2.1: Illustration of a honeycomb lattice single graphene sheet, which can be rolled up to form a
single-walled carbon nanotube. Adapted from 16.
In addition to SWCNT which are one single graphene sheet rolled up into a tube, there are also MWCNT
which in essence are concentric tubes of SWCNT (Fig. 2.2). It is possible to selectively synthesise either
of these two types of CNTs depending on the final device requirements, which will be discussed in the
next section. Notably, it is assumed that MWCNT are always metallic in nature as one of the nanotube
walls is statistically likely to be metallic, this adds a further option when considering their use.

Chapter 2 Literature Review
7
Figure 2.2: Schematic representing single-walled carbon nanotubes (SWCNT) and multi-walled carbon
nanotubes (MWCNT). MWCNT consist of concentric SWCNTs. Adapted from 17.
2.2.2. Synthesis
Synthesis of CNTs falls into two broad categories, namely physical-vapour deposition (PVD) and
chemical vapour deposition (CVD). PVD includes both the laser ablation technique and arc discharge
method, the latter of which was used as the CNT synthesis technique in the papers by Iijima et al (1993)
and Bethune et al (1993).10,11 These techniques involve the vapourisation of graphite material by
physical heating to markedly high temperatures (>1000 ᵒC), following this the vapourised graphite
condensates as carbon nanotubes.18 Using arc discharge both SWCNTs and MWCNTs can be reliably
and reproducibly produced by varying the reaction conditions such as the gas mixture. SWCNTs
necessitate the presence of a catalyst (e.g. Fe, Ni, Co, etc.) but MWCNTs can be produced via this
process without a catalyst.8,19 Impurities are common and include carbon nanoparticles and metal filled
MWCNTs, these impurities are relatively hard to remove, nonetheless these PVD methods generally
produce high quality CNTs.
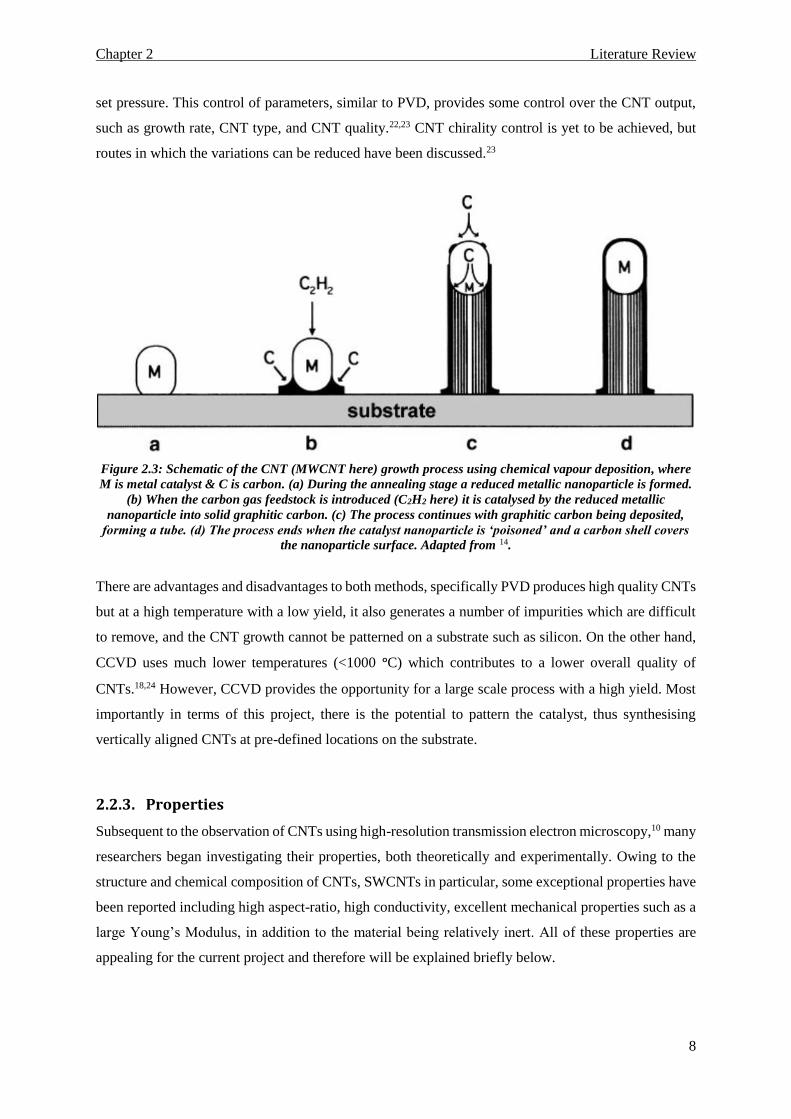
CVD methods for CNT synthesis rely on the use of a catalyst, thus CNT synthesis using CVD is usually
called catalytic CVD (CCVD). In contrast to PVD methods which use solid carbon in the form of
graphite as the carbon source, CCVD methods use a volatile gas with high carbon content such as
benzene, ethylene or acetylene as the carbon source.20 Simply put, the process involves the heating of
the metallic catalyst which has been deposited on a substrate, when under the correct conditions this
catalyst forms ‘nano-islands’ (Fig. 2.3(a)). Following this the carbon-containing gas reacts with the
(usually) reduced metallic catalyst (typically Fe, Ni or Co) to initiate and facilitate the production of
CNTs under a given set of conditions (Fig. 2.3(b-d)).18,21 This reaction occurs in a reactor chamber
where a number of parameters are controlled including gas selection, gas flow rate, set temperature, and
Chapter 2 Literature Review
8
set pressure. This control of parameters, similar to PVD, provides some control over the CNT output,
such as growth rate, CNT type, and CNT quality.22,23 CNT chirality control is yet to be achieved, but
routes in which the variations can be reduced have been discussed.23
Figure 2.3: Schematic of the CNT (MWCNT here) growth process using chemical vapour deposition, where
M is metal catalyst & C is carbon. (a) During the annealing stage a reduced metallic nanoparticle is formed.
(b) When the carbon gas feedstock is introduced (C2H2 here) it is catalysed by the reduced metallic
nanoparticle into solid graphitic carbon. (c) The process continues with graphitic carbon being deposited,
forming a tube. (d) The process ends when the catalyst nanoparticle is ‘poisoned’ and a carbon shell covers
the nanoparticle surface. Adapted from 14.
There are advantages and disadvantages to both methods, specifically PVD produces high quality CNTs
but at a high temperature with a low yield, it also generates a number of impurities which are difficult
to remove, and the CNT growth cannot be patterned on a substrate such as silicon. On the other hand,
CCVD uses much lower temperatures (<1000 ᵒC) which contributes to a lower overall quality of
CNTs.18,24 However, CCVD provides the opportunity for a large scale process with a high yield. Most
importantly in terms of this project, there is the potential to pattern the catalyst, thus synthesising
vertically aligned CNTs at pre-defined locations on the substrate.
2.2.3. Properties
Subsequent to the observation of CNTs using high-resolution transmission electron microscopy,10 many
researchers began investigating their properties, both theoretically and experimentally. Owing to the
structure and chemical composition of CNTs, SWCNTs in particular, some exceptional properties have
been reported including high aspect-ratio, high conductivity, excellent mechanical properties such as a
large Young’s Modulus, in addition to the material being relatively inert. All of these properties are
appealing for the current project and therefore will be explained briefly below.

Chapter 2 Literature Review
9
The diameter of CNTs varies, from ~0.4 nm for the thinnest SWCNTs, with the size increasing for
MWCNTs. This nanoscale diameter, coupled with the ability to produce CNTs on the millimetre length
scale, produces a staggeringly high aspect-ratio, with >106 reported in some papers.25 Consequently,
this property allows for substantial increase in the surface area of a substrate with CNTs attached,
particularly when the CNTs are CVD grown and vertically aligned. A high aspect-ratio generates a
relatively large surface area, which in turn provides a large number of sites for functionalisation,
meaning a large number of molecules can potentially be attached to a single nanotube, an important
consideration for drug delivery vehicles. Additionally, the extreme high aspect-ratio means that CNTs
can be used as a future material for vertical vias,26 in addition to an electrode material for
electrochemical biosensors, as the increased surface area has been demonstrated to improve the signal-
to-noise ratio, amongst other parameters.27,28
The electrical properties of CNTs have attracted significant attention, due to their size and structure.
SWCNTs are considered to be one-dimensional quantum wires. This has led to the observation and
theoretical predictions of ballistic conduction in CNTs,29,30 extremely high charge carrier mobilities
(~106 cm2/V·s),31 and a very large current carrying capacity (>109 A/cm2).29,32 It must be noted however
that many of the excellent electrical properties predicted for CNTs are often not reported
experimentally. This is largely due to the presence of defects in the structure, either generated during
the synthesis procedure or introduced purposefully via a functionalisation process. This purposeful
functionalisation is usually to improve their wettability with aqueous solutions, even though this
regularly produces a decrement in their electrical properties. CNTs still remain a key current and future
material for many devices such as photovoltaics,33 supercapacitors,34,35 and biomedical sensors.36
Another important intrinsic property of pristine CNTs is their mechanical strength (Young’s Modulus)
which has been measured at 1 TPa, five times larger than steel.37 In addition to the strength of this
material, it has been shown to be relatively elastic as well.38,39 This blend of properties has made CNTs
an ideal material for improving the strength of established materials in a composite, such as carbon fibre
meshes and cement.40,41
Material stability, in terms of inertness in various environments, is a crucial property to be considered
in materials used for biological applications. This is because unexpected reactions of a material with its
environment could alter molecules, such as oxidation of proteins in a tissue environment, in turn
producing potentially unwanted toxicological effects. In general CNTs are non-reactive to most
chemical environments, it requires harsh conditions such as strong acids or oxidising agents to initiate
reactions on the CNT structure.42 This behaviour means CNTs could be used as materials for biological
applications and this property is consistent with other materials used for bio-electrodes such as Au or
Pt.

Chapter 2 Literature Review
10
2.2.4. Functionalisation
Modifying the CNT structure, or functionalising as it is more frequently called, is a common procedure
when using CNTs for a number of reasons. Mainly, functionalisation is warranted for one of two
reasons, firstly it can allow attachment of functional groups, side chains or molecules which are
necessary for its function, e.g. attachment of a receptor protein for drug delivery. Secondly, the
functionalisation procedure alters the wettability of the CNT to allow use in certain applications, e.g.
introducing oxygen containing functional groups for increased wettability in aqueous solution. Broadly,
two types of CNT functionalisation can be used to attach the desired structure to the CNT, namely non-
covalent functionalisation and covalent functionalisation.
Non-covalent functionalisation commonly uses hydrophobic interactions, π-π stacking or Van der
Waals forces, to attach or ‘wrap’ molecules around the CNT. This usually involves amphipathic
molecules which contain a hydrophobic component which bonds with the CNT structure, in addition to
a hydrophilic part which faces outward into the aqueous solution, making the CNTs soluble and not
prone to aggregation. These non-covalent processes do little to no harm to the intrinsic CNT structure,
meaning the original carbon structure remains intact, which in turn generally means the good electrical
properties remain intact. A number of molecules, especially polymers, have been investigated for
various applications including sodium dodecylbenzene sulphonate for general dispersions,43 also
sodium dodecyl sulphate has been used to improve the detection of neurotransmitters in aqueous
solutions.44 Of particular note for biosensors is the use of SWCNT wrapped with deoxyribonucleic acid
(DNA) or ribonucleic acid (RNA) (Fig. 2.4) to improve aqueous solubility, inhibit aggregation of CNTs,
in addition to improving biocompatibility.45,46 Thus, non-covalent functionalisation exhibits an
exceptional advantage in that the CNT structure remains as it was prior to functionalisation. However
the stability between the CNT and functionalising molecule continues to be a key disadvantage of this
method. The bonding can be significantly affected by alterations to salt concentration in the solution,
temperature, pH of the environment, as well as analyte concentration, making non-covalent
functionalisation typically less reliable compared to covalent modification.47 This is notably important
in biological systems where varying salt concentrations and changing pH is common.
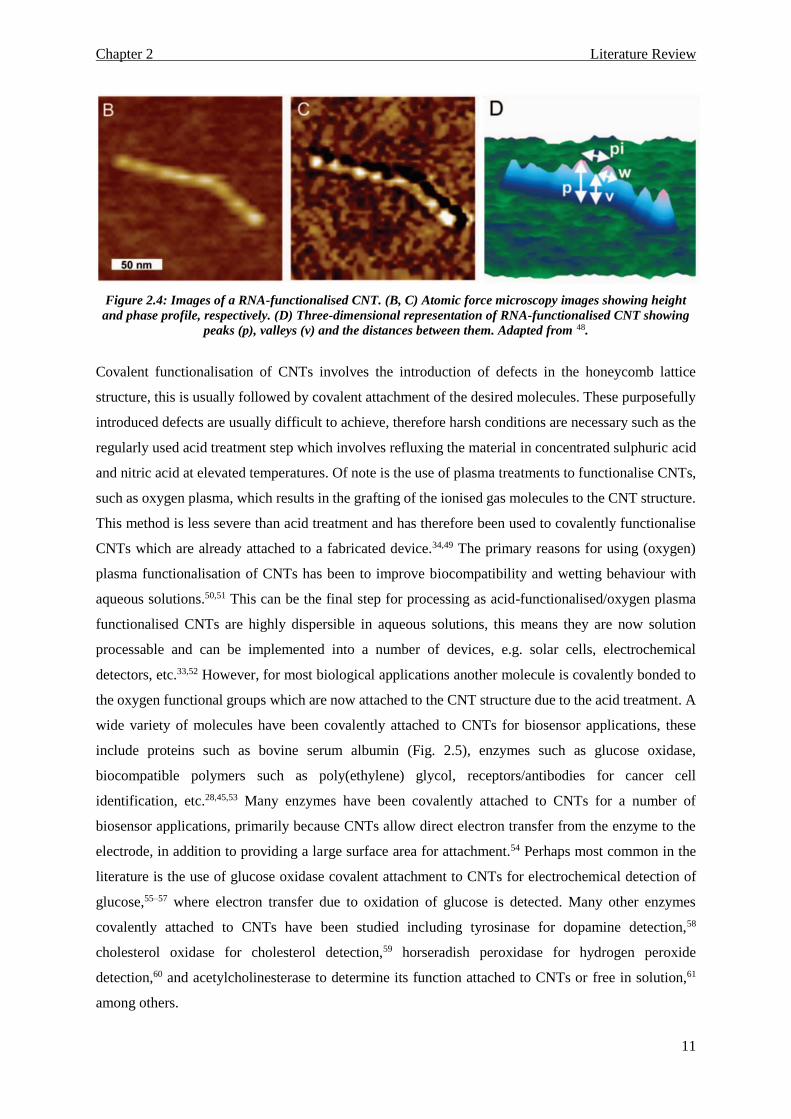
Chapter 2 Literature Review
11
Figure 2.4: Images of a RNA-functionalised CNT. (B, C) Atomic force microscopy images showing height
and phase profile, respectively. (D) Three-dimensional representation of RNA-functionalised CNT showing
peaks (p), valleys (v) and the distances between them. Adapted from 48.
Covalent functionalisation of CNTs involves the introduction of defects in the honeycomb lattice
structure, this is usually followed by covalent attachment of the desired molecules. These purposefully
introduced defects are usually difficult to achieve, therefore harsh conditions are necessary such as the
regularly used acid treatment step which involves refluxing the material in concentrated sulphuric acid
and nitric acid at elevated temperatures. Of note is the use of plasma treatments to functionalise CNTs,
such as oxygen plasma, which results in the grafting of the ionised gas molecules to the CNT structure.
This method is less severe than acid treatment and has therefore been used to covalently functionalise
CNTs which are already attached to a fabricated device.34,49 The primary reasons for using (oxygen)
plasma functionalisation of CNTs has been to improve biocompatibility and wetting behaviour with
aqueous solutions.50,51 This can be the final step for processing as acid-functionalised/oxygen plasma
functionalised CNTs are highly dispersible in aqueous solutions, this means they are now solution
processable and can be implemented into a number of devices, e.g. solar cells, electrochemical
detectors, etc.33,52 However, for most biological applications another molecule is covalently bonded to
the oxygen functional groups which are now attached to the CNT structure due to the acid treatment. A
wide variety of molecules have been covalently attached to CNTs for biosensor applications, these
include proteins such as bovine serum albumin (Fig. 2.5), enzymes such as glucose oxidase,
biocompatible polymers such as poly(ethylene) glycol, receptors/antibodies for cancer cell
identification, etc.28,45,53 Many enzymes have been covalently attached to CNTs for a number of
biosensor applications, primarily because CNTs allow direct electron transfer from the enzyme to the
electrode, in addition to providing a large surface area for attachment.54 Perhaps most common in the
literature is the use of glucose oxidase covalent attachment to CNTs for electrochemical detection of
glucose,55–57 where electron transfer due to oxidation of glucose is detected. Many other enzymes
covalently attached to CNTs have been studied including tyrosinase for dopamine detection,58
cholesterol oxidase for cholesterol detection,59 horseradish peroxidase for hydrogen peroxide
detection,60 and acetylcholinesterase to determine its function attached to CNTs or free in solution,61
among others.

Chapter 2 Literature Review
12
Figure 2.5: Representative illustration of a SWCNT non-covalently functionalised with doxorubicin, and
covalently functionalised to a bovine serum albumin (BSA)/fluorescein/antibody complex. Adapted from 28.
The number of functionalisation methods and attached molecules in CNT research is vast, this large
knowledge pool therefore allows appropriate selection of a functionalisation scheme which befits the
fabrication constraints and final device/material specifications.
2.2.5. Nanomaterial Toxicology
As the CNT based device which will be proposed here has biological applications, it seems prudent to
discuss the toxicology of nanomaterials and thus the field of nanotoxicology. The early investigations
and subsequent publication of results indicating increased toxicity and tissue distribution of ultrafine
particles, compared to fine particles, instigated a surge in the field of toxicology research with regards
to nanomaterials.62–64
Since these original papers there have been thousands of publications examining the effects of various
nanoscale materials on biological cell lines and organs. Research has indicated that nanoparticles with
the same chemical composition, yet with different diameters, have a negative size-dependent effect on
toxicological status, i.e. the smaller the diameter particle the more detrimental the toxicological
response. This has been demonstrated on cell lines for silver, gold, and silica nanoparticles to name a
few, where smaller diameter nanoparticles demonstrated a significantly increased toxicity, e.g. reduced
cell viability.65–67 What is particularly interesting, and may be difficult for policy makers, is that such a
small difference in size of the same material appears to have a huge impact on physiology. This is

Chapter 2 Literature Review
13
exemplified by Carlson et al (2008) who reported a drop from 80% cell viability with 55 nm diameter
silver nanoparticles of 50 µg mL-1 to ~25% with 30 nm silver nanoparticles of the same concentration.65
In addition to toxicology, the distribution of nanoparticles has been putatively demonstrated to depend
on nanoparticle diameter. Reports have concluded that smaller diameter nanoparticles can be distributed
to many, if not all, organs of the body whereas larger diameter nanoparticles mainly stay in the blood,
liver, and spleen.68 Size is the primary parameter when discussing nanotoxicology as it provided the
initial interest in the field. However, it must be noted that other parameters such as surface area, surface
charge, and solubility all have an influence on the toxicology of nanoparticles.69,70
In terms of nanotoxicology, CNTs have received considerable attention since Donaldson et al (2006)
observed the structural similarities between CNTs and asbestos fibres, the latter of which is
carcinogenic in the lung when inhaled.71 Following this observation many reports attempted to
investigate the toxicology and distribution of CNTs in vitro and in vivo using instillation and inhalation
methods. One of the major findings is the observation of frustrated phagocytosis in alveolar
macrophages with CNTs above a certain length using an instillation method, shown to be >20 µm,6 this
response has toxic and carcinogenic potential. Importantly however, no study thus far has accurately
determined the threshold length of CNT which elicit the frustrated phagocytosis response, indicating
that the threshold may be lower than 20 µm. This frustrated phagocytosis is often accompanied by a
pulmonary inflammatory response, which includes the formation of granulomas (Fig. 2.6), a chronic
inflammatory condition.6,72 In addition to the observation of frustrated phagocytosis via the instillation
method, a number of experiments have used an in vivo inhalation method to investigate the toxicology
and distribution of CNTs. Correctly performed inhalation methods are deemed to be the most realistic
scenario of CNT attainment in biological tissue, as aerosolised CNTs from manufacturing of CNTs or
composite material breakage containing CNTs are a legitimate route of exposure. A number of key
observations have been made using this method, one of the most interesting is the range of toxicological
responses, from airway inflammation and no systemic toxicity in a 90-day study (Ma-Hock et al, 2009)
to a 4 day study which noted interstitial fibrosis, oxidative stress and mutagenesis of pulmonary tissue
(Shvedova et al, 2008).73,74 In addition to this wide range of toxicological responses, the issue of
biopersistance has been noted by Mercer et al (2013), where short (5-10 µm) CNTs translocated to
pleural tissue and extrapulmonary tissues. These CNTs maintained a persistent fibrotic response 336
days after the 3-week exposure study, indicating the potential long-term persistence of CNTs in
biological systems.75 A final inhalation study, which was unique in its experimental hypothesis,
investigated the ability of CNTs to proliferate carcinogenic cells which are already present, i.e. does the
presence of CNTs increase a carcinogenic profile.76 The results demonstrated that 90.5% of mice that
had mutated cells already, and then were exposed to MWCNT, went on to produce lung
adenocarcinomas. This is compared to 51.9% of MCA-exposed (produces carcinogenic cells
purposefully) which went on to produce lung adenocarcinomas, and 26.5% of animals which were only

Chapter 2 Literature Review
14
exposed to MWCNT. This piece of research highlights an interesting role CNTs may have in increasing
an already present carcinogenic profile and the potential need for screening of workers in CNT
manufacturing.
Figure 2.6: Scanning electron microscopy and optical microscopy images indicating the generation of
granulomas with longer fibres. Adapted from 6.
Another concern for toxicologists is the effect of the catalyst nanoparticle on biological tissue. Nickel
and Iron are probably the most widely used catalyst materials for CVD-growth of CNTs, where Ni
nanoparticles would most likely be of toxicological concern. However, no reports to date have
categorically demonstrated a negative toxicological effect determined to be from the catalyst
nanoparticle itself, under representative environmental conditions.77 This result is most likely due to
one of four reasons, either there is no toxicological issues associated with the nanoparticle itself, the

Chapter 2 Literature Review
15
experimental design is flawed, the nanoparticle is not released from the CNT, or the adverse toxicology
of the CNTs overshadows the biological response to the catalyst nanoparticles.
Overall, there is a wealth of literature available on the subject of nanotoxicology, yet there is still a great
deal of unknowns in terms of the response of biological tissues to nanomaterials. There are many
reasons for this knowledge gap including, but not limited to, a lack of material characterisation and an
experimental protocol that does not reflect real-life exposure conditions. The lack of material
characterisation makes it difficult to ascertain reliable conclusions from results, particularly in the case
of CNTs where parameters such as material length, diameter, and surface functionalisation may
potentially have a dramatic effect on toxicology. Many experimental protocols investigating CNT
toxicology use high concentrations of CNTs which are not applicable to real world situations of
inhalation. Therefore, many studies have demonstrated adverse pathologies such as fibrosis and
mutagenesis using aerosolised CNTs at concentrations of ≥2.5 mg/m3 (Shedova 2008, Ma-Hock et al
2009, Mercer et al 2013).73,74,78 In contrast, Erdely et al (2013) made personal breathing zone
measurements of workers in MWCNT manufacturers and extrapolated these measurements to reveal an
exposure equivalent of 2 ng/day in mice, a number far lower than other experiments have been using.79
Following this extrapolation mice were exposed to 19.7 ng/day and the authors found that at this
exposure only a low-grade inflammatory response was noted, indicating a substantial number of years
of exposure would be needed to generate adverse pathology. Overloading is another common problem
with nanotoxicology reports, where the amount of material exceeds a threshold such that the
macrophages cannot clear the resulting material. This leads to non-specific immune responses which
then do not reflect the toxicity of the material, only the abundance of it.70
The majority of the toxicology reports for CNTs either focus on the response of lung tissue(s) to
inhalation of CNTs or the response of cultured cell lines to introduced CNTs via the instillation method.
However, the results from these experiments, whilst important in their own right, have minimal impact
in terms of this study. Primarily, this is because the CNTs will be bound to a device which would
primarily be used for research purposes. On the other hand, if an implantable MEA device with CNT
electrodes was constructed, this stance may have to be re-evaluated.
2.3. Nanotechnology & Biological Detection
Nanobiotechnology is an ever expanding field which in itself defines the juncture between
nanotechnology and biology. Nanoscale materials and devices have been researched, and in some cases
used in commercial or industrial products, for numerous biological applications, e.g. TiO2 nanoparticles
in sun-cream. At the nanoscale many materials exhibit interesting properties, these can have beneficial
effects in a biological context such as reduced invasiveness, improved biocompatibility, and enhanced

Chapter 2 Literature Review
16
sensitivity. These properties are attractive for many biological applications such as drug delivery,
sensing, and implantable/wearable technology.
The quantity of research into biosensors and bio-devices is immense, such that industrial and academic
research on the subject is continuous and intense, aiming to provide improved detection parameters and
enhanced function of devices for alleviating pathological symptoms. These detection parameters for
biosensors include sensitivity, selectivity and response time, all of which aid clinicians and researchers
in the certainty of their diagnosis. Bio-device development focuses on improved biocompatibility,
reduced invasiveness of the device, and better sensitivity for devices. These devices include implantable
technology such as deep-brain stimulation electrodes for easing of Parkinson’s disease symptoms, e.g.
tremors.
In general, nano-biosensors which have been fabricated over the last two decades incorporate three
main components (Fig. 2.7).
1. A nanoscale material which usually provides an enhanced sensitivity compared to
conventional materials.
2. A target, usually biological in nature, which is bound to the nanomaterial and provides
selectivity.
3. A detectable, quantifiable signal which occurs when the target is incorporated into the nano-
biosensor.
Figure 2.7: Overview of the main components of a nano-biosensor.

Chapter 2 Literature Review
17
The molecule of interest determines the composition of the nano-biosensor and the choice of signal
output. Typically, an optical signal has been chosen for determination of DNA, RNA, or proteins, and
an electrochemical signal has been preferred for small biomolecules, i.e. neurotransmitters. For optical
detection of DNA or RNA sequences a number of different nanomaterials and targets have been
combined to provide excellent sensitivity and selectivity.
2.3.1. Optical Based Biosensors
Gold nanoparticles (AuNPs) have received considerable attention in many areas of science including
biological detection. Their interesting properties include local surface plasmon resonance, fluorescence
quenching, ability for functionalisation (particularly thiol bonds) and perceived biocompatibility, which
have then facilitated various sensor types to be fabricated.80–83 One of the breakthrough tests with
AuNPs was investigating hybridisation of oligonucleotides with a colourmetric detection system.84 This
system used the size dependent absorption spectra of AuNPs, and their propensity to aggregate in
solution due to Van der Waals forces etc. The researchers functionalised the AuNPs with
oligonucleotides up to 28 bases long, after which the electrostatic repulsion due to the charge on the
oligonucleotides was ample to keep the nanoparticles dispersed. However, hybridisation due to addition
of the complementary oligonucleotide removed this charge and caused the AuNPs to aggregate (Fig.
2.8(a)). This aggregation was observed as a colour shift from red to blue as being spotted on thin-layer
chromatography paper. Although early days, this study reported detection limits of femtomoles of
oligonucleotide with a single-base pair discrimination (most likely due to the small number of bases).
This is called crosslinking aggregation, the Mirkin group have since used similar detection mechanisms
and magnetic-based separation techniques to reach fM and aM detection limits for proteins.85,86
Figure 2.8: Schematic illustrating colourmetric methods associated with AuNPs. (a) Crosslinking
aggregation and (b) non-crosslinking aggregation. Adapted from 87.
Non-crosslinking aggregation is another technique available with AuNPs. When the AuNPs are
wrapped in a citrate layer, they stayed dispersed until high salt concentrations diminish the electrostatic
repulsion and they aggregate. ssDNA bonds to the AuNP capped with citrate quite readily, again aiding
dispersion. However, when the cDNA is added and the DNA hybridises, at the correct salt concentration
the ssDNA dissociates from the AuNPs which causes aggregation (Fig. 2.8(b)). This causes a change
in the optical properties which is quantitatively measureable by UV-Vis spectroscopy.88 Variations of
(a) (b)

Chapter 2 Literature Review
18
this main method have been used for biological detection including HIV-1 ribonuclease activity,89 and
telomerase which is overexpressed in breast cancer cells.87
AuNPs intrinsic ability to quench fluorescence, i.e. stop fluorescent molecules emitting, has also been
used to good effect. AuNPs are conjugated with a molecule capable of fluorescence, whilst this
molecule stays tightly bound to the AuNP no fluorescence will occur. When the biomolecule of interest
interacts with the fluorescent molecule it liberates it from the AuNP surface, consequently the molecule
begins to fluoresce. This method has produced in vivo results with a near infra-red (NIR) fluorescent
molecule attached to a AuNP with iron(III) oxide NPs also attached.90 Matrix metalloproteinases
(MMP) are highly expressed in tumours, therefore the probe was engineered so that MMP would cleave
a bond attaching the AuNP to the fluorescent molecule. The experiment was successful as the tumour
was located, yet there was high NIR fluorescence in the liver and spleen also, indicating some non-
specificity. It is unlikely that this technique could surpass MRI in terms of detection sensitivity, however
the cost would most likely be significantly reduced. Local surface plasmon resonance is also a technique
in which AuNPs are being used. Its use has become commercially available with the Lamdagen
LightPath System™ which uses silica nanoparticles, coated with gold, as the material which produces
resonance peaks. This system has a plasmonic enzyme-linked immunosorbent assay which allows fM
detection limits of the specified antigen. This technique is label-free as the detection relies on a resonant
peak due to the AuNP, which is an improvement over many of the current detection systems which rely
on staining or fluorescent dyes.
Graphene and graphene oxide (GO) have many properties which are of significant interest to the
scientific community, particularly in terms of device or probe design. As with AuNPs, GO is also able
to quench fluorescence. It has been called a ‘super-quencher’ due to its ability to quench fluorescent
molecules which are up to 50 nm from its surface.91 This is due to strong interactions usually promoted
by π-π stacking of the corresponding molecular orbitals with the graphene sheet due to the presence of
aromatic rings. Additionally, GO has been reported to have significant fluorescent capabilities from the
UV to the NIR region, potentially allowing tuneable responses.92 In the first instance, fluorescent
molecules can bind to the GO due to strong interactions (π-π, electrostatic etc.) and thus the GO
quenches fluorescence. Then the target molecule facilitates a change in that bonding, e.g. DNA
hybridisation or conformational changes due to antibody-antigen binding, and the fluorescence is
recovered. This was demonstrated using cyclin-A2, an early stage cancer biomarker, which was
detected down to 0.5 nM by the GO-FRET (fluorescence energy transfer) technique.93 Other research
has shown the ability for this method to be used in vivo for recording intracellular fluorescence.94
Although the concentration of adenosine tri-phosphate could only be measured on the mM scale in the
experiment, the method was successful in situ with no apparent cytotoxicity. Moreover, the aptamer
probe used on the GO nanosheet in this study was not cleaved by intracellular enzymes as may be

Chapter 2 Literature Review
19
expected. This is in line with previous research which demonstrates ssDNA adsorbed onto graphene
sheets was protected against enzymatic cleavage by DNase I.95 Strong molecular interactions between
the flexible ssDNA (compared to dsDNA) and the GO appeared to inhibit the DNase I from approaching
the attached ssDNA. GO can also be used as the fluorescent element in the design of a biosensor. For
instance, groups have taken advantage of using AuNPs as the fluorescent quencher and GO itself as the
fluorescent molecule.96 In this report the researchers reported relatively sensitive detection of rotavirus
down to 1000 pfu mL-1 using a fluorescence emission at 547 nm. However, due to GO fluorescence in
the NIR this could potentially be altered for in vivo detection. Finally, carboxyl-modified GO (GO-
COOH) also shows peroxidase-like activity, i.e. it can oxidise tetramethyl-benzidine in the presence of
H2O2, in addition to converting H2O2 itself.97 Conventionally, this is a step in the ELISA technique
performed by horseradish-peroxidase for the detection of various antigens. Additionally, peroxidase is
one of the enzymes used in many glucose sensors. There are many advantages to GO-COOH instead of
H2O2, namely it is stable against biodegradation and denaturation and it is easy to obtain. However, its
lack of intrinsic activity at pH 7.0 may be an issue when incorporating it into testing kits.87
Figure 2.9: Detection mechanism using peroxidase-like activity of oxidised SWCNTs. Adapted from 47.
Optical detection of nucleic acids with CNTs is a limited field, particularly in comparison to metallic
nanoparticles and graphene/GO. However, carboxylate functionalised SWCNTs have proven
peroxidase-like activity, similar to GO.47 This was used to detect single-nucleotide polymorphisms via
a salt-induced aggregation mechanism. ssDNA non-covalently wraps SWCNTs tightly due to π-π
stacking of aromatic rings, however dsDNA is more rigid and does not prevent salt-induced aggregation
of SWNTs (Fig. 2.9). Thus, ssDNA wrapped SWCNTs were introduced to either their complementary
DNA (cDNA), which would cause complete DNA hybridisation, or they were introduced to ssDNA
with a one base-pair mismatch (M-DNA). After this the solutions were precipitated and tested with
tetramethyl-benzidine and H2O2. The cDNA addition would cause SWCNTs to precipitate out and thus

Chapter 2 Literature Review
20
would produce a stronger absorbance, compared to the SWCNTs still wrapped in ssDNA which would
be well dispersed. This detection was reliable down to 1 nM which is the threshold for expected DNA
and RNA detection limits.98
Currently, optical based biosensors are used for the determination of larger biological molecules such
as DNA, RNA, proteins and glycoproteins, as demonstrated by this short review of the literature. When
investigating smaller biomolecules such as hormones and neurotransmitters, an electrochemical based
detection mechanism is favoured in the literature, which will subsequently be discussed in more detail
due to its applicability to the current project.
2.3.2. Electrochemical Based Biosensors
Electrochemical based biosensors are primarily used for the detection of relatively small biomolecules
and analytes such as hormones, amino acids, and neurotransmitters. Some electrochemical-based
biosensors have shown promise in the detection of DNA/RNA fragments via electrochemical
impedance spectroscopy (EIS),99–102 yet these are still a minority compared to the detection of small
biomolecules. Here, the focus is on neurotransmitters where electrochemical sensors have proved
excellent research tools already, but much improvement can be made to these devices to significantly
enhance the knowledge pool on neurotransmitter determination and action. Neurotransmitters are
biomolecules which are released from neurons and specifically bind to receptors located on an adjacent
neuronal membrane. They are essential in the complex transfer of signals, and therefore information,
across the entire neural network but most importantly in the brain. Their ability to be either excitatory
or inhibitory depending on the neurotransmitter, in addition to amplifying and integrating signals,
means extremely complex information can be transported across the network.103 Briefly, the mode of
action is illustrated in Figure 2.10, it begins with an electrical signal in the form of a depolarised
membrane arriving at the axon terminal of the presynaptic neuron. This signal triggers the attachment
of vesicles containing discrete amounts of neurotransmitters to the axon terminal membrane, following
this the neurotransmitters are released into the synaptic cleft (also called synaptic space). The
neurotransmitter molecules diffuse across the synaptic cleft, where other molecules and ions reside such
as ascorbic acid and Na+/Cl-, and bind to their respective receptors on the membrane of the postsynaptic
neuron. This complementary binding, usually to receptors operating ion channels, causes the channels
to open and Na+ located in the extracellular space to diffuse into the postsynaptic neuron. The response
of the postsynaptic neuron is complex and is dependent on the neurotransmitter released from the
presynaptic neuron. These electrical and chemical signals can be measured using electrophysiology and
electrochemistry set-ups, respectively. The subsequent section will focus on the sensing and
determination of the chemical signals generated by neurotransmitters, in particular dopamine which is
physiologically involved in complex functions such as movement and emotion. Imbalance in the

Chapter 2 Literature Review
21
dopaminergic systems in the brain are also a topic of interest as a chronic reduction in the release of
dopamine in the nigrostriatal pathway can lead to Parkinson’s Disease.104
Figure 2.10: Illustration of synaptic transmission event, including the arrival of an electrical signal to the
presynaptic terminal, the release of chemical neurotransmitters into the synaptic space, and binding of these
chemicals to receptors on the postsynaptic neuron. Adapted from 105.
The increasingly wide availability of nanomaterials has led to their application in electrodes in
electrochemical set-ups designed for the detection of neurotransmitters, with the aim of improving the
sensitivity and/or selectivity of detection. The primary methodology in this area of research focuses on
modifying existing electrodes, such as glassy carbon electrodes, with nanomaterials to elicit signal
enhancement. One such nanomaterial is CNTs, with a simple drop-casting method onto pre-existing
electrodes demonstrating a superior response to dopamine compared to the unmodified electrode.106–108
This superior response was proven by an increase in the sensitivity (Amperes per analyte concentration),
an improvement in the limit of detection down to 11 nM for one type of CNT electrode,107 and a decrease
in the peak potential difference of the anodic and cathodic current peaks indicating an enhancement in
electrochemical reversibility. In all cases the CNTs were acid functionalised which enabled a good
dispersion and thus drop-casting, this is due to the production of oxygen functional groups on the CNT
structure which improves aqueous wetting.

Chapter 2 Literature Review
22
Figure 2.11: Illustration of a graphene oxide sheet on a glassy carbon electrode, where the dopamine (DA) is
electrostatically attracted and the ascorbic acid (AA) is electrostatically repelled. Adapted from 109.
The presence of the oxygen functional groups also generates a net negative charge on the CNT structure,
this can provide electrostatic interactions between the electrode and charged molecules, potentially
allowing some selectivity. This electrostatic interaction is the likely reason for the selective
determination of dopamine in the presence of ascorbic acid that has been reported by these experiments.
Figure 2.11 demonstrates the discrimination between dopamine and ascorbic acid, which is due to
electrostatic interactions of the electrode and analytes, where the negative charge on the electrodes
attracts dopamine but repels ascorbic acid. Moreover, one report managed to convincingly separate four
important biological analytes in the form of ascorbic acid, dopamine, uric acid and serotonin (Fig. 2.12),
using a glassy carbon electrode modified with MWCNT-dihexadecyl hydrogen phosphate. This report
demonstrates selectivity without the need for a target as part of the nano-biosensor, such as those used
as part of the optical nano-biosensors (Fig. 2.7).
CNTs can also be grown onto existing electrodes via a CVD method, as demonstrated by Zheng et al
(2008).44 In this report the CNTs were then non-covalently functionalised by wrapping of sodium-
dodecyl sulphate (a negatively charged polymer) around the CNT structure. This allowed selective
detection of dopamine in the presence of ascorbic acid determined by a peak potential separation of 200
mV between analytes using differential pulse voltammetry. This electrode also displayed a limit of
detection of 3.75 µM, it must be noted that this detection limit is substantially higher than that observed
by drop-casting of acid-functionalised CNTs.

Chapter 2 Literature Review
23
Figure 2.12: Differential pulse voltammetry response of a MWCNT-dihexadecyl hydrogen phosphate
modified electrode to four different analytes, ascorbic acid (AA), dopamine (DA), uric acid (UA), and
serotonin (5-HT). Adapted from 107.
Graphene oxide (GO), in addition to its reduced form (rGO), are also prime examples of nanomaterials
which have been demonstrated to improve analyte detection, particularly dopamine. Gao et al (2013)
stated that the oxygen containing functional groups present on the GO can provide selectivity when
measuring dopamine, in the presence of ascorbic acid, in the same way as acid-functionalised CNTs
(Fig. 2.11). This discrimination was not possible with an unmodified glassy carbon electrode which is
a common electrode currently used for these measurements. In addition to this, a limit of detection for
dopamine was measured to be 270 nM for this electrode in a buffer solution of pH 5.0. The use of rGO,
a material which re-captures some of the sp2 C=C hybridisation and expends oxygen functionality in
return, has also revealed exceptional promise for the selective detection of dopamine.110,111 This material
has proven to be stable in solution, conductive, have a large electrochemical window, and be highly
electrochemically active which has led to detection limits of 20 nM for dopamine in the presence of
ascorbic acid and uric acid of higher concentration. Moreover, a peak potential difference of 10 mV for
dopamine indicates ideally reversible electrochemistry at the electrode surface.110
In addition to these carbon nanomaterials being used solely as the electrode nanomaterial, they can also
perform as a conductive, stable support for other nanomaterials such as metallic and metal oxide
nanoparticles. The bonding of copper nanoparticles to the MWCNT/glassy carbon electrode revealed
an increased sensitivity to dopamine compared to the MWCNT/glassy carbon electrode alone, most
likely due to the increased electrochemically active surface area.112 Metal oxide nanoparticles, namely

Chapter 2 Literature Review
24
RuO2 and ZrO2, have been deposited or synthesised on glassy carbon electrodes already modified with
acid-functionalised CNT or rGO supports, producing excellent electrochemical detection of
dopamine.113,114 Anodic and cathodic currents increased for both electrodes compared to the carbon
nanomaterial alone, moreover both electrodes were able to distinguish between dopamine and its
common electrochemical interferents ascorbic acid and uric acid with high accuracy. Finally, the limit
of detection for dopamine of both electrodes was impressive with RuO2 electrode reaching 100 nM and
the ZrO2 electrode was slightly better at 60 nM.
The use of electrostatic interactions has been proven to allow selective detection of dopamine in the
presence of common electrochemical interferents such as ascorbic acid and uric acid. Other methods
can also be used to provide selectivity, in particular the use of molecularly-imprinted polymers (MIPs)
or enzymes as part of the nano-biosensor, similar to the optical-based biosensors in Section 2.3.1. MIPs
are synthetically produced materials which are designed to be selective based on conformation and
surface charge. Figure 2.13(a) demonstrates how a MIP specific for dopamine has been fabricated on a
gold electrode, using an electropolymerisation method in the presence of the dopamine biomolecule.
Figure 2.13(b) then provides evidence of its selectivity, with 15 µM of each analyte (dopamine, ascorbic
acid, and uric acid) measured at the unmodified gold electrode, a non-imprinted polymer, and a
molecularly imprinted polymer. The selectivity of the MIP, in addition to the dopamine peak current at
15 µM, is far higher than for the non-imprinted polymer and the unmodified gold electrode.115
Additionally, there is some selectivity observed with the non-imprinted polymer, this is due to
negatively charged functional groups on the polymer electrostatically attracting dopamine and repelling
uric acid/ascorbic acid. However, the decreased peak current at the unmodified gold electrode has not
been satisfactorily explained, as the gold electrode would have a much larger electrochemically active
surface area, yet it produces roughly four times less current than the MIP modified electrode. Finally, a
detection limit of 130 nM was determined by using this MIP electrode, yet this value was improved
upon by a group which incorporated graphene into a MIP electrode for dopamine based on chitosan as
the polymer.116 The incorporation of graphene vastly improved the electrochemical properties of the
electrode, including peak current and peak potential difference, furthermore the electrode revealed a
theoretical limit of detection of 10 pM for dopamine. This detection limit is below that which is
necessary for basal dopamine release detection at neuronal synapses and, if found to be reliable, could
be incorporated as a detector in various analytical systems.117 In addition to the excellent detection limit,
the selectivity against common electrochemical interferents such as uric acid, ascorbic acid, and creatine
demonstrated near 100% selectivity. Interestingly, this near perfect selectivity was also reported against
noradrenaline, a neurotransmitter which only differs in chemical structure from dopamine by a single
hydroxyl group. This result was not supported by the associated differential pulse voltammogram for
noradrenaline and dopamine in the same solution, unlike the other interferents, therefore it is difficult
to comment on the validity of this result.

Chapter 2 Literature Review
25
Figure 2.13: (a) Fabrication procedure to produce a molecularly-imprinted polymer (MIP). (b) Response, in
terms of peak current, of MIP, non-imprinted polymer (NIP), and Au electrode to 15 µM of dopamine (DA),
ascorbic acid (AA), and uric acid (UA). Adapted from 115.
Along with synthetically produced materials which have been used to provide selectivity, enzymes have
also been incorporated into electrodes for the detection of dopamine. One such report investigated the
use of laccase for a sequential reaction which involved dopamine as the starting biomolecule and 5,6-
dihydroxyindoline quinone as the final product, where one dopamine molecule would react to
eventually produce one 5,6-dihydroxyindoline quinone molecule.118 The 5,6-dihydroxyindoline
quinone was then electrochemically reduced at a potential of -0.15 V, meaning there is no interference
from ascorbic acid or dopamine redox reactions which occur at higher potentials. This system generated
a detection limit of 400 nM, in addition to providing good selectivity against ascorbic acid. A different
electrode system which consisted of tyrosinase bound to a carbon fibre electrode via chitosan, in
addition to CeO2/TiO2 nanoparticles being bound to the electrode, was used for dopamine detection.58
This system used tyrosinase to convert dopamine to o-dopaquinone, subsequently the o-dopaquinone is
measured electrochemically at -0.15 V which removes interference from other biomolecules such as
(a)
(b)

Chapter 2 Literature Review
26
ascorbic acid, DOPAC, uric acid, and crucially noradrenaline which is a difficult signal to separate
electrochemically from dopamine. This electrode system reported a limit of detection of 1 nM, in
addition to being used in vivo to measure dopamine released from the striatum. However, both studies
demonstrated a common problem associated with enzyme-based electrodes, namely the poor stability
and reproducibility over time as the enzyme degrades. With a 10% reduction in sensitivity only one
week after initial fabrication and use, the repeatability of using such an electrode over time is called
into question.
These reports illustrate the on-going research into improving the sensitivity and selectivity of
neurotransmitter detection, particularly dopamine, which is the focus of this work. The next section will
review the current techniques used for neurotransmitter detection, both ex situ and in vivo, including
their advantages and limitations, thus highlighting the need for this ongoing research into improving
biosensors.
2.3.3. Current Techniques for Neurotransmitter Detection
Measuring the concentration of neurotransmitters is important, in terms of both physiology and
responses to abnormal environments. A prime example which has been briefly described is dopamine,
which is the biomolecule/neurotransmitter of interest for detection using the fabricated devices here.
Dopamine is a catecholamine neurotransmitter that is stored and released in certain areas of the brain,
such as the ventral tegmental area, to modulate complex functions such as emotion and movement.
Understanding how, when, and the concentration of dopamine released will help elucidate its role in
physiology. This information can likely allow researchers to understand what happens to dopamine
release in abnormal circumstances, e.g. upon addition of cocaine, or in Parkinson’s disease (or
Parkinson’s-like symptoms).
Detection of neurotransmitters, such as dopamine, is usually carried out by one of two known methods.
One of the methods involves a combination of microdialysis and high-performance liquid
chromatography (HPLC). Microdialysis put simply is the insertion of a tube with a permeable
membrane into a tissue of interest. This permeable membrane allows passage of low molecular-weight
molecules between the surrounding tissue and the tube (Fig. 2.14), meaning this tissue can be ‘sampled’
and tested at a later time point.119

Chapter 2 Literature Review
27
Figure 2.14: Representation of microdialysis placement and use. (a) Schematic of how a cannula with the
microdialysis probe inside can be inserted into a region of interest. (b) Schematic of how analytes of interest
diffuse from the tissues, around blood vessels (V), into the microdialysis probe. Adapted from 119.
This post-microdialysis testing can be performed using HPLC, chromatography in general is a technique
of separating molecules based on physical or chemical differences between them. Here we focus on
HPLC which is commonly used to separate biomolecules such as dopamine, serotonin, DOPAC,
noradrenaline etc. The process involves pumping a liquid sample, supported by a solvent (mobile phase)
through a HPLC column (stationary phase). The sample interaction with the mobile and stationary
phases determines the elution time (time taken for sample to go from injection point to the detector).
This elution time is then compared to previously determined standards to ascertain what the biomolecule
is (Fig. 2.15). Additionally, the response at the detector allows quantification of the biomolecule(s), this
detector may be optical, electrical or electrochemical in nature.
In the case of measuring dopamine, the system is reverse-phase partition chromatography where the
stationary phase is non-polar and the mobile phase is polar. When the dopamine elutes its concentration
is usually measured electrochemically at the detector stage. A working electrode is held constant, at a
potential difference high enough to completely oxidise all biomolecules of interest that may elute. The
current produced is then compared to a standard plot produced beforehand to work out the
concentration.120

Chapter 2 Literature Review
28
Figure 2.15: Representation of a high-performance liquid chromatography (HPLC) set-up indicating how
the sample is injected into the solvent phase just prior to the HPLC column. The sample interaction with the
solvent (mobile phase) and column (stationary phase) determines the elution time. The eluted samples are
measured by a detector after the HPLC column. Adapted from 121.
The other popular method involves implantation of a microelectrode into the tissue area of interest,
followed by an electrochemical detection technique. Commonly this is a carbon fibre microelectrode
(Fig. 2.16) which can be as narrow as 5 µm diameter at the tip, with fast-scan cyclic voltammetry
(FSCV) deployed as the electrochemical detection technique. The microelectrode is fabricated by
pulling a carbon fibre through thin glass tubing so that the end of the fibre protrudes from the end of
the glass tube, the space between the carbon fibre and the glass tube is then sealed with epoxy.
Following fabrication the microelectrode can be used to probe brain areas of interest either in vivo or in
vitro and measure responses by FSCV. This method generates a large background charging current
which needs to be subtracted in order to reveal the faradaic current produced from the oxidation of the
analyte of interest. The technique can provide measurements on the millisecond timescale making it
appropriate for real-time measurements of neurotransmitter release. The majority of experiments thus
far have focused on the measurement of dopamine concentration fluctuations, as parameters including
applied waveform and potential window have been optimised for this.122 However, recently the number
of analytes being detected has increased to include adenosine, serotonin, and norepinephrine among
others.117,119,123,124

Chapter 2 Literature Review
29
Figure 2.16: Scanning electron microscopy image of a carbon fibre microelectrode. Adapted from 125.
These two predominant techniques can be described as complimentary, such that the disadvantages of
one technique are an advantage of the other. Namely, one of the main disadvantages of microdialysis
(+HPLC) is the time resolution which is limited to ≥1 minute.119 However, the use of a carbon fibre
microelectrode with FSCV means real-time measurements can be recorded every 10 ms to 100 ms.126
The other main disadvantage is the tissue damage caused by the invasive nature of the microdialysis
probe, mainly due to its relatively large diameter. This problem is not so apparent with the carbon fibre
microelectrode as the diameter of the electrode is substantially smaller, thus causing less tissue
damage.122
The use of the carbon fibre electrode and FSCV does have some disadvantages which are primarily due
to the use of the electrochemical detection technique. Specifically, this technique cannot measure non-
electroactive substances, the detection limit for these electroactive substances is not sufficient to
measure basal neurotransmitter dynamics, and only one analyte can be sampled at a time as the set-up
(waveforms etc.) are optimised for a specific analyte, e.g. dopamine. As the detection with microdialysis
plus HPLC is dependent on the type of detector used for quantification of the elutent, all of the stated
disadvantages of voltammetry can be circumvented by microdialysis plus HPLC.
Yet, there is currently one limitation with using both of these techniques for biochemical detection in
neural tissue, this is the inability to measure the biochemical response from multiple locations
simultaneously. This limitation can be overcome by the use of multiple electrodes at defined locations.

Chapter 2 Literature Review
30
MEAs are devices which have the capability of measuring responses from multiple locations at the
same time, as such they will be discussed next in more detail with regards to the current project.
2.3.4. Microelectrode Arrays (MEAs)
MEAs are devices that contain a number of individually addressable electrodes, which consequently
allows complex spatial information to be attained. These devices are currently a key tool for
electrophysiologists, these specialists use this device to record bioelectrical responses of either
myocardial or neuronal cells in a variety of biological environments (in vivo, in situ, in vitro). The
electrodes used in these devices were described and defined for use in recording electrophysiological
responses in biological cells in the late 1960’s, in an attempt to consolidate the then current knowledge
base.127 The issue of electrode interfacial impedance was discussed in that report, it is well known that
electrode interfacial impedance increases as the surface area of the electrode decreases, this made
recording the small currents generated from single cells challenging using traditional noble metal (Au
or Pt) electrodes. This issue was somewhat resolved in the mid-1990’s, such that MEAs became
commercially available with an electrode diameter of 30 µm, allowing single-cell measurements of
some cell types due to its relatively small electrode area (Multi Channel Systems MCS GmbH). These
electrodes used nanostructured TiN as the electrode material, the nanostructure meant that the geometric
surface area of the electrode could remain small, yet the real surface area of the electrode was much
larger which in turn kept the impedance at workable levels. Other commercially available MEAs have
been produced by taking on the concept of using nanomaterials to reduce electrode interfacial
impedance, these include both Pt black (Alpha MED Scientific Inc.) and CNT-PEDOT (poly(3,4-
ethylenedioxythiophene)) composite (Multi Channel Systems MCS GmbH). Action potentials in
neurons last roughly one millisecond, therefore the modular impedance (|Z|) of the electrode at 1 kHz
is used as a standard measurement to compare the electrodes ability to record from neuronal cells, a
comparison of commercially available electrodes is made in Table 2.1.
Diameter
(µm)
Interelectrode
Distance
(µm)
No. of
electrodes Material
Impedance
@ 1 kHz
(kΩ)
Company
20 100 ≤64 Pt Black <40 Alpha MED
Scientific Inc.
50 100/300/450 ≤64 Pt Black <22 Alpha MED
Scientific Inc.
10 100/200 ≤60 TiN 250 – 400 Multichannel
Systems
30 200 ≤60 TiN 30 – 50 Multichannel
Systems
30 200 ≤60 PEDOT-CNT 20 Multichannel
Systems
Table 2.1: Overview of the commercially available microelectrode arrays for electrophysiological detection.

Chapter 2 Literature Review
31
2.3.4.1. Electrode Theory
Prior to discussion of MEAs that have been fabricated in a research environment as well as
commercially, it is important to describe some of the theory that drives the modification and alteration
of these devices. Ideally, an electrode used for the application of electrophysiological and
electrochemical sensing needs a small enough surface area to measure signals from a single cell.
Commonly for these types of measurements an electrode, usually planar metal in nature, is placed into
solution. Charges on the metal electrode attract the opposite charges in solution, with a space-charge
region between them, this sets up what is known as the electrolytic double layer.128 The electrode is also
at this point, in terms of a circuit, a parallel resistor-capacitor (RC component) in series with the solution
(Fig. 2.17).
Figure 2.17: Equivalent circuit model for planar metal electrode in solution indicating a single time constant.
Cdl is the double layer capacitance of the electrode, Rs is the series resistance of the solution, Re is the
resistance of the electrode.
If an AC potential is applied between this electrode and another electrode in solution then the interfacial
impedance of an electrode can be measured. Here, the lowest interfacial impedance possible at a given
electrode area is preferred, this is because the signals from biological cells are notoriously minute.
Currently, planar metal electrodes of 400 µm2 for example, a common electrode area for single cell
measurements, produce very high impedances which do not allow direct biological measurements.27
Phase responses indicate that they act purely as a capacitor over a wide frequency range with a large
double layer.27,129 When the electrodes are roughened, or nanomaterials are used, the real surface area
of the electrode increases whilst the geometric surface area remains the same. This increase in area
reduces the reactance by altering the phase to become more resistive, as well as ‘spreading’ the double
layer and reducing its thickness (see Eq. 2.1), which in turn has a hand in reducing the electrode
interfacial impedance, as has been demonstrated many times previously.27,129–131 Thus, an increased
surface area is advantageous for reducing the interfacial impedance of electrodes.
𝐶 =𝜀𝑟𝜀0𝐴
𝑑 Eq. 2.1

Chapter 2 Literature Review
32
C is capacitance (double layer), ɛr is dielectric permittivity of the material, ɛ0 is dielectric permittivity
of air, A is area (electrode area), and d is the thickness of the insulator between the two conductors.
Increasing the real surface area of the electrode is also advantageous as it can improve the sensitivity of
detection of analytes in solution, e.g. dopamine. As can be observed, the current through the electrode
scales proportionally with real surface area (Cottrell equation – Eq. 2.2), as more electrons cross the
interface between the solid electrode and ionic solution per time period. Moreover, the signal-to-noise
ratio in electrochemical detection usually refers to the faradaic current compared to the non-faradaic
(charging) current. This is the ratio of electrons being transferred from the ions in solution to the
conduction band of the metal electrode, compared to the discharge of the double layer at the electrode-
electrolyte interface. As discussed previously increased surface area due to roughening of the electrode
or the use of nanomaterials increases the real surface area, while maintaining a small geometric surface
area. This in turn causes spreading of the double layer as well as increasing the faradaic current through
the electrode, thus improving the signal-to-noise ratio in electrochemical detection. This improvement
of signal-to-noise is key when attempting to measure biomolecules accurately due to their low
physiological concentration, which is between µM and pM.
𝑖 =𝑛𝐹𝐴𝐷
12⁄ 𝐶∗
(𝜋𝑡)1
2⁄ Eq. 2.2
i is current, n is number of electrons transferred, F is Faradays constant (96 487 C mol-1), D is
diffusion coefficient of analyte, C* is bulk concentration of analyte, t is time.
Finally, the polarisable range of an electrode is an important characteristic to consider. This process
begins with submerging the electrode in an ‘inert’ solution where ions have a large decomposition
potential. When a potential is applied to the electrode a double layer forms, this makes the electrode
‘polarised’, the potential is then increased to a threshold where the ions decompose and charge flows
between the ionic solution and the electrode.128 This potential range when the electrode is polarisable is
known as the ‘potential window’ for an electrode. As some molecules, such as nucleotide bases, have
a high oxidation potential then a large potential window is beneficial in electrochemical detection using
electrodes.132
2.3.4.2. Electrode Materials
A number of reports have attempted to improve upon the commercial MEA design(s) to address certain
limitations, or the design has been altered so the MEA can be used for a new function. Variation in
electrode materials has demonstrated improvements to various aspects of MEA function, particularly

Chapter 2 Literature Review
33
interfacial impedance. Pt black is a material which is used to reduce the interfacial impedance of
electrodes by increasing the active surface area of the electrode. Generally this is achieved by
electroplating a chloroplatinic acid based solution onto an electrode, which deposits particles of Pt,
producing a high surface-to-volume ratio.133 Pt black is successfully used commercially on indium tin-
oxide (ITO) electrodes to reduce electrode interfacial impedance for electrophysiological detection
(Alpha MED Scientific Inc.). However, there are two main problems with Pt black, specifically its
mechanical stability and tendency for rapid performance reductions after multiple uses. Kim et al (2015)
developed a layer-by-layer method of applying Pt black with poly-dopamine which substantially
improved the mechanical adhesion, such that the measured impedance only increased by 50% after 30
minutes of sonication.134 Additionally, Qiang et al (2010) have demonstrated that activation of the Pt
black by potentiostatic cycling using cyclic voltammetry can increase the signal response by up to 33
times; they state this can be performed once per day to improve the measurement.133 Pt black is still a
common material used to reduce electrode interfacial impedance, in spite of these results the mechanical
stability and performance reduction are still considered an issue.
CNT based electrodes have been investigated for MEAs as their properties, as discussed in Section
2.2.3., are of interest for biosensor applications. Using a simple drop-cast method Gabriel et al (2009)
demonstrated an improvement, in terms of impedance and average noise, when using SWCNT instead
of Pt electrodes.135 Additionally, these experiments reported minimal SWCNT removal from electrodes
and an observed absence of cytotoxicity with this method. Other methods in the literature, such as the
electrodeposition of CNT-PEDOT composite, indicates the ability to deposit CNTs on MEAs. Again
this electrode registered reduced impedance and improved signal-to-noise ratio compared to Au
electrode alone.136 This study also demonstrated an improved charge injection for CNT-PEDOT
compared to PEDOT alone and Au electrode, this is a very important parameter when considering
materials for deep brain stimulation devices.
Along with deposition based techniques, a number of research papers have explored the possibility of
using CVD-grown CNTs, grown directly on the device, as the electrode material for MEA devices.
Vertically aligned CNTs can provide a huge aspect ratio, for example double-walled CNTs of only 2
µm height have a theoretical aspect ratio of 300,137 thus permitting a large active surface area for the
electrode whilst maintaining a small geometric surface area. This property has been used to describe
the higher specific capacitance of CNT electrodes,138,139 in addition to the improvement in the signal-
to-noise ratio in electrophysiological recordings compared to noble metal electrodes and nanostructured
TiN.138,140,130 Other reports have indicated that functionalisation of CNTs, which improves their
wettability with aqueous solutions, could result in a larger active surface area of the CNTs contacting
the solution. Treatments including exposure to cell culture medium,139 steam plasma,130 oxygen
plasma,27,141 or buffered hydrofluoric acid142 have all displayed improvements in impedance and/or

Chapter 2 Literature Review
34
electrophysiological recordings due to functionalisation, believed to be due to improvement of the
wettability of CNTs with aqueous solutions. Worth noting is the CNT height in the majority of the
CVD-grown reports, which is ≤2 µm. In theory the taller the CNTs, the higher the aspect-ratio and thus
the larger the surface area, which in turn would likely improve the signal-to-noise ratio and therefore
the impedance. However, Nick et al (2015) indicated that ≤2 µm tall CNTs are the most appropriate for
implementation in devices which will come into contact with biological samples, as CNTs taller than
this are easily removed from the substrate.137
CNTs quasi-one-dimensionality coupled with its flexibility have enabled incorporation of the material
into flexible devices, a desirable property for potential in vivo applications. Chen et al (2011) directly
grew CNTs on patterned electrode areas, on a polyimide substrate, by plasma-enhanced CVD. This
study indicated improvements in both impedance and specific capacitance vs. using Au electrode, in
addition to demonstrating the feasibility of recording electrophysiological signals using CNTs grown
on plastics, albeit with relatively poor signal-to-noise ratio.143 Other studies have transferred vertically
aligned CNTs into a flexible substrate (e.g. polydimethylsiloxane) and used CNTs as the electrode,
conducting track, and bond pad area. Lin et al (2009) established the feasibility of using this approach
to fabricate devices capable of electrophysiological recordings from a Crayfish nerve cord.144 David-
Pur et al (2014) used the same approach yet demonstrated the potential of using multiple substrates,
such as parylene, to produce the devices (Fig. 2.17(a)). In addition, they demonstrated impedance values
of 55 kΩ at 1 kHz for a 100 µm diameter electrode. These are still some way off commercial values
(Table 2.1), but they did show electrophysiological recording capabilities with embryonic chick retina.
A potential drawback of replicating the CNTs into a polymer matrix is that the majority of the surface
area of the CNTs is now not available to the environment, meaning the excellent properties displayed
with CVD-grown CNTs by themselves are not demonstrated in these flexible devices.
A material that has been used to a lesser extent, although is attracting increasing interest, is boron-doped
diamond. Boron-doped diamond has been demonstrated to be biocompatible and can be selectively
grown onto specific electrode areas, making its application in MEAs plausible.145,146 Hébert et al (2015)
fabricated boron-doped diamond MEAs with a planar geometry, these electrodes recorded a particularly
high electrochemical impedance (0.6 MΩ at 1 kHz) which would be unsuitable for electrophysiological
detection.146 Piret et al (2015) used an approach to create a 3-D boron-doped diamond electrode, namely
they grew boron-doped diamond on CNTs (Fig. 2.17(b)). This electrode indicated increased capacitance
and a decrease in impedance (50 kΩ at 1 kHz) compared to planar boron-doped diamond electrodes of
the same geometric surface area.

Chapter 2 Literature Review
35
Figure 2.18: (a) Photograph of a flexible all-CNT based MEA fabricated in parylene. Adapted from 147. (b)
Scanning electron microscopy image of a nano boron-doped diamond/CNT electrode. Adapted from 145.
2.3.4.3. Transistor-based MEAs
Changing the material is not the only option, the electrode design can also be altered, this is particularly
true for MEAs which can have individually addressable transistors as the electrodes. A substantial
amount of work has been carried out on the production of transistor based electrodes for
electrophysiology, particularly nanowire based field-effect transistors (FET).148–151 Within this research
area, a small number of studies have investigated the potential of using multiple transistors for sensing
purposes. Reports have illustrated the use of nanomaterial-based FETs for electrophysiology with some
successes. The FET device is composed of a few main structures, namely the source and drain
electrodes, which are connected together by a channel which is normally semiconducting in nature.
Above this channel is a thin dielectric layer (usually called the gate oxide), in electrophysiological
recording the cell attaches to this oxide and when the membrane of the cell depolarises, this change in
electric field affects the charge carriers in the semiconducting channel, thus altering the current between
the source and drain electrodes. Neuronal cells have been cultured and patterned onto FETs which use
silicon nanowires as the channel and silicon dioxide as the gate oxide dielectric layer. These FETs were
fabricated next to each other at a set distance, and then specific growth factors were used to initiate
growth of projections above the FETs (Fig. 2.18). This in turn allowed measurement of the signal speed
in unmyelinated axons and dendrites, 0.43 m/sec and 0.16 m/sec, respectively.152

Chapter 2 Literature Review
36
Figure 2.19: Image of a neuron where the projections (axon and dendrite) are induced to grow directly above
silicon nanowire field-effect transistors used for electrical measurements. Adapted from 152.
Transistors based on organic polymers, called organic electrochemical transistors, have been fabricated
for the purpose of measuring electrical brain activity in individuals with epilepsy. As such, these
transistor electrodes have been shown to record brain activity at 4-14 Hz in vivo. Additionally, these
electrodes demonstrate a much improved signal-to-noise ratio of 52.7 dB compared to PEDOT:PSS
surface electrodes of 30.2 dB, and Ir-based penetrating electrodes of 32.0 dB.153 The device was
fabricated on flexible substrates and thus can conform to the shape of the brain tissue, potentially
inferring measurements of entire intact brain areas.
2.3.4.4. Intracellular Recording Using MEAs
In terms of electrophysiology recording using MEAs, the ability to detect intracellular signals generated
from cells would be advantageous. With current commercially available MEAs intracellular signal
recording is not possible, thus subthreshold changes in membrane potential are not observed. These
changes could be a key component in identifying the type of signal, i.e. inhibitory or excitatory.154
Researchers have attempted to tackle this issue with varying degrees of success. Vertical nanowire
based electrodes have been used to measure intracellular membrane potentials of neurons (Si
nanowire)155 and myocardial cells (Fig. 2.19(a)) (Pt nanowire).156 These two reports used
electroporation to permeabilise the membrane, which could affect general cell functioning as there is a
loss in membrane integrity. Additionally, the signal decays substantially over time due to membrane
resealing, such that it resembles extracellular recording after a few minutes or less. This means that
long-term effects of drugs on cell function may be difficult to determine.
A separate study into intracellular electrophysiology recordings investigated the use of mushroom-
shaped gold protrusions on an electrode to improve contact with cells (Fig. 2.19(b)).157,158 The key
process step in this design is the functionalisation of the gold spines with a peptide titled engulfment
promoting peptide. This peptide facilitated interaction with receptors on the cell membrane to initiate
phagocytosis of the spine by the cell, thus increasing the coupling between the electrode and the cell
membrane. The recorded improvement in signal-to-noise ratio was put down to a decrease in the cleft
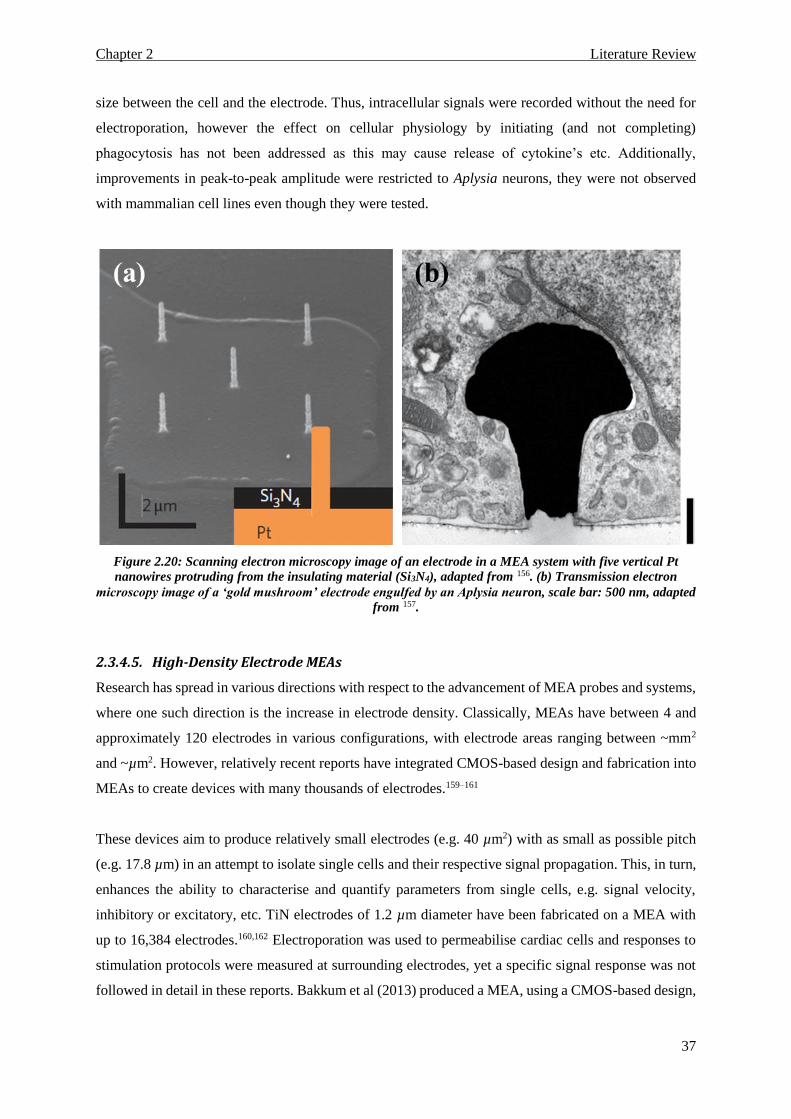
Chapter 2 Literature Review
37
size between the cell and the electrode. Thus, intracellular signals were recorded without the need for
electroporation, however the effect on cellular physiology by initiating (and not completing)
phagocytosis has not been addressed as this may cause release of cytokine’s etc. Additionally,
improvements in peak-to-peak amplitude were restricted to Aplysia neurons, they were not observed
with mammalian cell lines even though they were tested.
Figure 2.20: Scanning electron microscopy image of an electrode in a MEA system with five vertical Pt
nanowires protruding from the insulating material (Si3N4), adapted from 156. (b) Transmission electron
microscopy image of a ‘gold mushroom’ electrode engulfed by an Aplysia neuron, scale bar: 500 nm, adapted
from 157.
2.3.4.5. High-Density Electrode MEAs
Research has spread in various directions with respect to the advancement of MEA probes and systems,
where one such direction is the increase in electrode density. Classically, MEAs have between 4 and
approximately 120 electrodes in various configurations, with electrode areas ranging between ~mm2
and ~µm2. However, relatively recent reports have integrated CMOS-based design and fabrication into
MEAs to create devices with many thousands of electrodes.159–161
These devices aim to produce relatively small electrodes (e.g. 40 µm2) with as small as possible pitch
(e.g. 17.8 µm) in an attempt to isolate single cells and their respective signal propagation. This, in turn,
enhances the ability to characterise and quantify parameters from single cells, e.g. signal velocity,
inhibitory or excitatory, etc. TiN electrodes of 1.2 µm diameter have been fabricated on a MEA with
up to 16,384 electrodes.160,162 Electroporation was used to permeabilise cardiac cells and responses to
stimulation protocols were measured at surrounding electrodes, yet a specific signal response was not
followed in detail in these reports. Bakkum et al (2013) produced a MEA, using a CMOS-based design,

Chapter 2 Literature Review
38
with 11,011 Pt black electrodes and cultured it with cortical cells.159 The authors were then able to
stimulate electrodes of their choosing and measure/record the responses at surrounding electrodes,
allowing them to monitor a specific signal response in detail. This, combined with overlaying
fluorescent images, allowed the researchers to observe which areas of the cells were producing the
largest signal and where certain cell projections were in real space (Fig. 2.20). Increasing the electrode
density has provided novel information in terms of signal velocity, in both cardiac cells and
unmyelinated neurons, however challenges still remain in this area. Even though the electrode number
has dramatically increased only 128 electrodes at a time were able to be stimulated and recorded from.
Additionally, the reduction in electrode size coincided with a poor signal-to-noise ratio for all reports,
in spite of the use of Pt black the signals needed to be averaged up to 1000 times and bandpass filtered
between 200 Hz and 3 kHz for resolution purposes.
Figure 2.21: (a) Optical microscopy image of a labelled neuron over a number of electrodes. (b) Indicates
travel of signal from stimulation (red cross) along axon to soma (largest depolarisation) onward to the
dendrite. (c) Latency of signal, with t=0 at the largest voltage signal (soma), and stimulation occurring at red
cross. Adapted from 159.
2.3.4.6. MEAs for Electrochemical Detection
Overall, MEAs have thus far been used almost exclusively for the detection of bioelectrical signals at
multiple locations on a device, giving rise to spatial electrophysiological information. Yet, its ability to
record responses at various locations simultaneously makes it an attractive option for measuring
biochemical signals, such as neurotransmitters released at the synapse between neurons. A small
number of reports have investigated the feasibility of using MEAs as electrochemical sensors for
(a) (b) (c)

Chapter 2 Literature Review
39
neurotransmitters, dopamine in particular. Dopamine is a well-studied molecule in electrochemistry
where it ideally exhibits a two-electron redox process with most electrodes, this makes it possible to
draw comparisons from separate papers about this neurotransmitter.
One such research paper uses acid functionalised MWCNTs micro-contact printed onto a custom made
MEA, compared to nanostructured TiN, to investigate their respective abilities to record extracellular
electrophysiological responses, in addition to responses of controlled dopamine concentrations.131
MWCNT electrodes displayed a lower detection limit of dopamine (1 µM) and improved signal-to-
noise ratio for electrophysiological signals compared to the nanostructured TiN. However, the MWCNT
electrodes were 80 µm in diameter producing a surface area which is too high for single cell detection.
Moreover, no interferents were tested in addition to the dopamine during electrochemical detection,
thus reducing the validity when testing on biological samples. Suzuki et al (2013) also demonstrated
the possibility of using CNTs as the electrode material in a MEA aimed at electrophysiological, as well
as electrochemical, detection.129 A detection limit of 1 nM was reported for a 200 µm diameter
electrode, in addition to in situ recordings from coronal and sagittal brain slices using the striatal area
of a mouse. Again, this paper does not address the problem of interferents in the extracellular solution.
Additionally, the peak current of 14.7 pA measured by the electrode upon release of dopamine would
indicate that under 10 nM concentration of dopamine was released after stimulation. Other reports
indicate that release of dopamine in this area would cause a much larger increase in dopamine
concentration.126 Recently, Wang et al (2015) established a method of electrodepositing an overoxidised
polypyrrole-rGO (ox-Ppy/rGO) composite onto electrodes of a MEA for selective detection of
dopamine.163 A limit of detection of 4 nM for dopamine was claimed and a linear range from 0.8 µM
up to 10 µM in the presence of ascorbic acid (Fig. 2.21(a)). Additionally, a dopamine response was
recorded from PC12 cells using this MEA, however the released dopamine concentration was not
measured (Fig. 2.21(b)).
The results in the reports demonstrate the feasibility of using MEAs as biochemical detectors, at least
for neurotransmitters, with physiologically relevant (nM) detection limits reached for dopamine along
with some selectivity against electrochemical interferents. However, improvements can be made in
terms of sensitivity, selectivity and detection limits. Thus, the aim of this body of work is to fabricate
and test a CNT-based MEA for selective biochemical detection of dopamine. The subsequent chapters
will describe the methods used to achieve the device fabrication, in addition to analysing the results
gained in pursuing this objective.
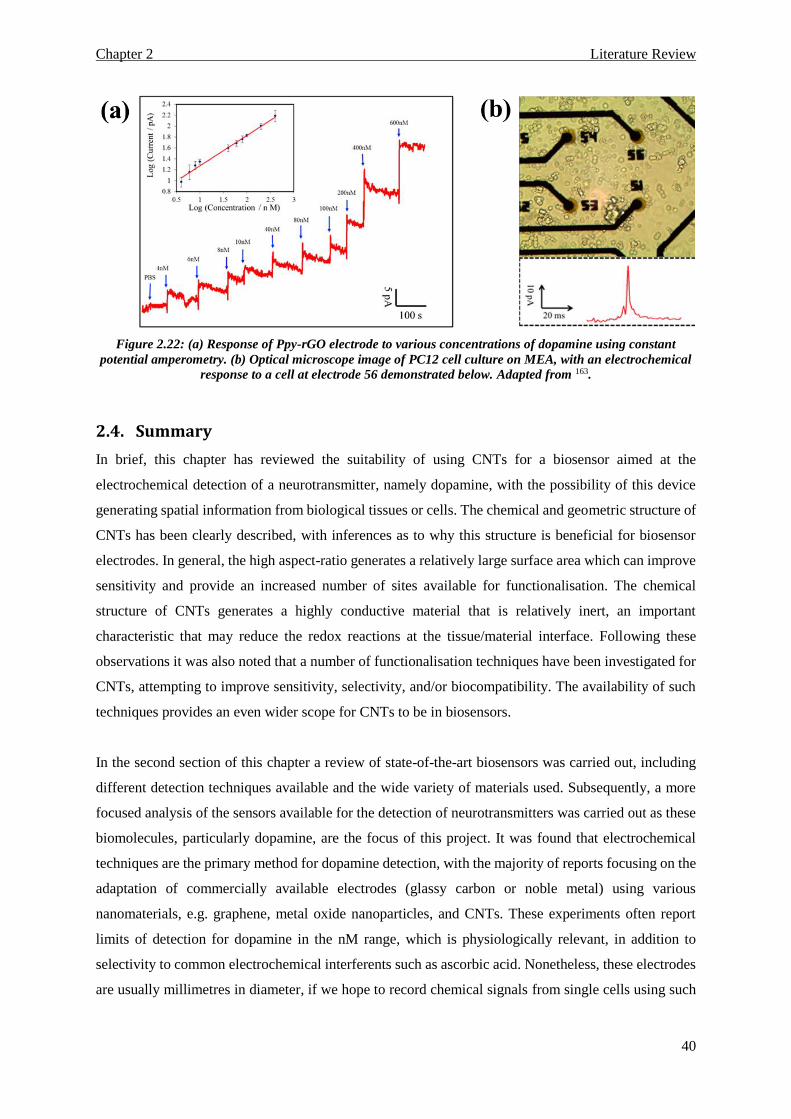
Chapter 2 Literature Review
40
Figure 2.22: (a) Response of Ppy-rGO electrode to various concentrations of dopamine using constant
potential amperometry. (b) Optical microscope image of PC12 cell culture on MEA, with an electrochemical
response to a cell at electrode 56 demonstrated below. Adapted from 163.
2.4. Summary
In brief, this chapter has reviewed the suitability of using CNTs for a biosensor aimed at the
electrochemical detection of a neurotransmitter, namely dopamine, with the possibility of this device
generating spatial information from biological tissues or cells. The chemical and geometric structure of
CNTs has been clearly described, with inferences as to why this structure is beneficial for biosensor
electrodes. In general, the high aspect-ratio generates a relatively large surface area which can improve
sensitivity and provide an increased number of sites available for functionalisation. The chemical
structure of CNTs generates a highly conductive material that is relatively inert, an important
characteristic that may reduce the redox reactions at the tissue/material interface. Following these
observations it was also noted that a number of functionalisation techniques have been investigated for
CNTs, attempting to improve sensitivity, selectivity, and/or biocompatibility. The availability of such
techniques provides an even wider scope for CNTs to be in biosensors.
In the second section of this chapter a review of state-of-the-art biosensors was carried out, including
different detection techniques available and the wide variety of materials used. Subsequently, a more
focused analysis of the sensors available for the detection of neurotransmitters was carried out as these
biomolecules, particularly dopamine, are the focus of this project. It was found that electrochemical
techniques are the primary method for dopamine detection, with the majority of reports focusing on the
adaptation of commercially available electrodes (glassy carbon or noble metal) using various
nanomaterials, e.g. graphene, metal oxide nanoparticles, and CNTs. These experiments often report
limits of detection for dopamine in the nM range, which is physiologically relevant, in addition to
selectivity to common electrochemical interferents such as ascorbic acid. Nonetheless, these electrodes
are usually millimetres in diameter, if we hope to record chemical signals from single cells using such

Chapter 2 Literature Review
41
techniques the electrode diameter must be reduced to reflect the diameter of a single neuronal cell
(between 4 and 20 µm). Current techniques either focus on ‘offline’ measurements (microdialysis and
HPLC), or in vivo electrochemical detection using carbon fibre electrodes and fast-scan cyclic
voltammetry. The ‘offline’ measurements generate selectivity between biomolecules but cannot
observe real-time changes, the exact opposite to the in vivo electrochemical techniques. Yet, neither
technique can provide spatial information in terms of neurotransmitter release, i.e. how are the
neurotransmitters released in a tissue slice or cell culture in terms of the neuronal circuitry. To address
the limitations of electrode size and current available techniques MEA devices can potentially be used,
these devices are already used in electrophysiology to aid mapping of electrical signals in biological
systems. Much work has been performed aiming to improve the parameters of current MEAs, such as
fabricating them for intracellular signal detection or increasing the electrode density to more accurately
follow an electrical signal along a single neuron. However, to date, minimal work has been carried out
to illustrate the potential for electrochemical detection, using MEA devices, in biological systems. As
such, the subsequent chapters will focus on production of a CNT-based MEA device capable of
selectively detecting dopamine at physiologically relevant concentrations. This begins with the next
chapter which will focus on the techniques used to fabricate and characterise the MEA devices
developed here.
Chapter 3 Experimental Techniques
42
Chapter 3 – Experimental Techniques
This chapter provides information on the methods used to fabricate the samples/devices in this project,
in addition to the techniques employed to characterise their output. The manner in which each method
and technique delivers their output is discussed, along with the accurate procedure followed which
resulted in the finished sample or data production. Where appropriate an error analysis has been
performed to show limits as to the accuracy of results.
3.1. Fabrication Techniques
3.1.1. Substrate Cleaning
In all cases, the substrate undergoes a cleaning procedure which involves sonicating the sample in
various organic solvents and/or DI water. This is to remove any particulate debris from the surface of
the substrate which may interfere with later processes. Following this, substrates are exposed to oxygen
plasma to remove organic contaminants from the substrate surface. In the final cleaning step, the
substrates are dehydrated at 150 ⁰C (or higher) for several minutes to desorb the remaining H2O on the
surface, this step is to increase photoresist adhesion in the photolithography process.164
Here, this cleaning procedure involves ultrasonication in subsequent acetone, iso-propanol and
methanol for 5 minutes each. The substrates were then thoroughly dried with a N2 air gun and the
remaining organic residue removed via an oxygen plasma exposure at 0.15 Torr, using 100 W for three
minutes, to complete the substrate cleaning stage (Emitech K-1050X).
3.1.2. Photolithography
Photolithography is a well characterised process which allows the transfer of a pattern from a mask to
a substrate. It is used extensively to define metallic contacts and tracks, in the micrometer and
nanometer scale, on substrates such as silicon or glass. An overview of the photolithography procedure
is detailed in Figure 3.1 and will be discussed in detail in this section. Following the substrate cleaning
stage the substrate is allowed to cool, with an adhesion promoter very often used to increase the
photoresist wetting with the substrate surface.
Here, hexamethyldisilazane was spin-coated onto the substrate surface at 3500 rpm for 10 seconds, this
was to improve adhesion. It works by bonding its Si atom to oxygen atoms on the oxidised substrate
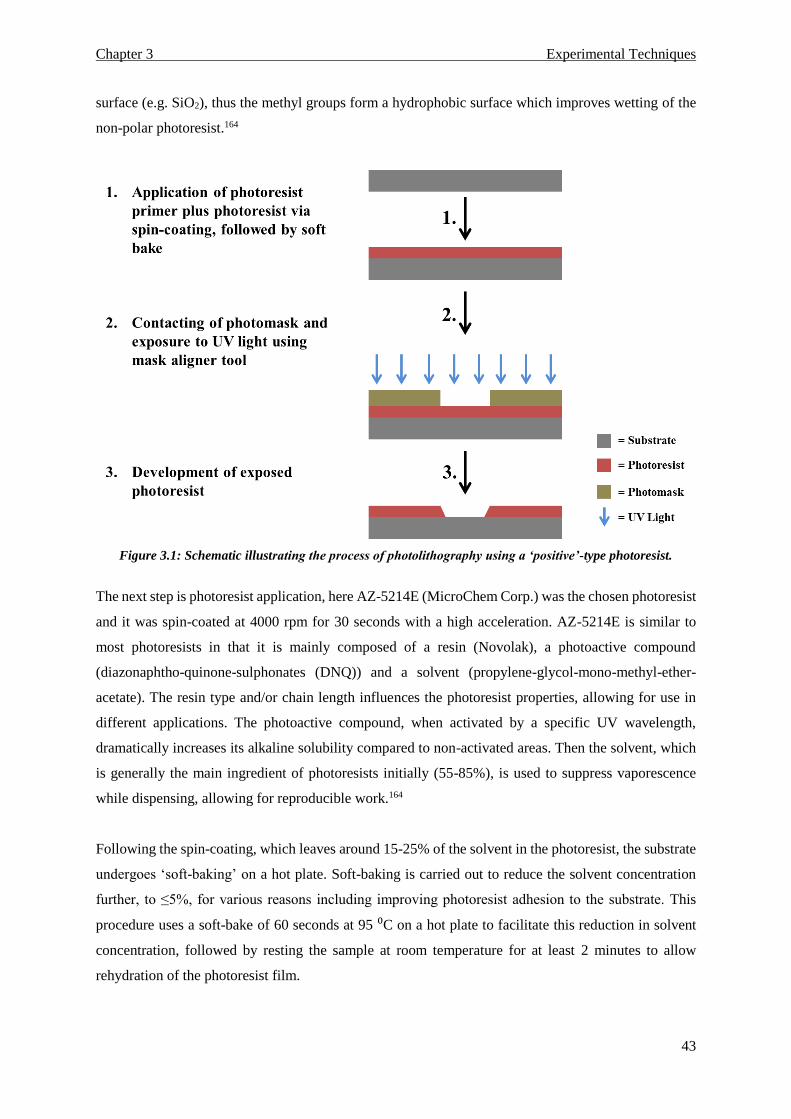
Chapter 3 Experimental Techniques
43
surface (e.g. SiO2), thus the methyl groups form a hydrophobic surface which improves wetting of the
non-polar photoresist.164
Figure 3.1: Schematic illustrating the process of photolithography using a ‘positive’-type photoresist.
The next step is photoresist application, here AZ-5214E (MicroChem Corp.) was the chosen photoresist
and it was spin-coated at 4000 rpm for 30 seconds with a high acceleration. AZ-5214E is similar to
most photoresists in that it is mainly composed of a resin (Novolak), a photoactive compound
(diazonaphtho-quinone-sulphonates (DNQ)) and a solvent (propylene-glycol-mono-methyl-ether-
acetate). The resin type and/or chain length influences the photoresist properties, allowing for use in
different applications. The photoactive compound, when activated by a specific UV wavelength,
dramatically increases its alkaline solubility compared to non-activated areas. Then the solvent, which
is generally the main ingredient of photoresists initially (55-85%), is used to suppress vaporescence
while dispensing, allowing for reproducible work.164
Following the spin-coating, which leaves around 15-25% of the solvent in the photoresist, the substrate
undergoes ‘soft-baking’ on a hot plate. Soft-baking is carried out to reduce the solvent concentration
further, to ≤5%, for various reasons including improving photoresist adhesion to the substrate. This
procedure uses a soft-bake of 60 seconds at 95 ⁰C on a hot plate to facilitate this reduction in solvent
concentration, followed by resting the sample at room temperature for at least 2 minutes to allow
rehydration of the photoresist film.

Chapter 3 Experimental Techniques
44
After the soft-bake the substrate is exposed to UV light of a specified wavelength. This is dependent on
the photoresist used, for AZ-5214E this is 365 nm, also called i-line exposure. As discussed, exposure
to UV light photoactivates DNQ in the photoresist film, thus dramatically increasing the alkaline
solubility of the exposed photoresist. This is the stage where patterning of the substrate is possible, prior
to exposure the substrate is put into tight contact with a photomask. This photomask has areas which
are transparent to UV light, meaning the DNQ is photoactivated in these areas. The photomask also has
other areas where the UV light is blocked from reaching the photoresist on the substrate, meaning DNQ
in those areas is not photoactivated (Fig. 3.2(a)). Therefore, after UV exposure of the substrate through
a photomask there are now areas which are significantly more soluble in alkaline solution compared to
others. Here, an exposure of 6.2 seconds at 7 mW cm-2 on the Suss MA1006 mask aligner (Karl Suss)
was used, producing an energy density of 43.4 mJ cm-2.
The final step of the photolithography procedure is the post-exposure development of the photoresist
film on the substrate. During this step the whole substrate is exposed to an alkaline ‘developer’ solution
for a pre-determined time. Because the photoresist has been selectively exposed, the areas where
photoactivated DNQ is present will dissolve significantly faster than non-photoactivated DNQ areas.
The ‘development time’ is the time taken for all of the photoactivated DNQ areas to dissolve completely
leaving no photoresist in those areas. Hence, after development a photoresist pattern will be realised
which mimics the photomask used during the exposure step, which is also called ‘positive-resist
photolithography’. Here, the NaOH-based AZ-351B developer (MicroChemicals) was used (diluted 1:4
with DI water) and a development time of 40 to 55 seconds was chosen. Immediately following the
development the substrate was washed thoroughly in DI water to halt the reaction and dried using a N2
air gun.
3.1.1.1. Sample Metallisation & Lift-Off
Following on from photolithography various processes can now be performed on this patterned
substrate. Here we perform a lift-off process which involves depositing metal over the whole substrate,
followed by dissolving the remaining photoresist on that substrate. Thus, when the metal is deposited
(DC sputtered using JLS-MPS 500) it will contact both developed areas i.e. the substrate, and
undeveloped areas i.e. the photoresist (Table 3.1 for overview of metal layers for each sample described
in this report). Therefore, when the remaining photoresist is dissolved after metallisation, the metal in
contact with the substrate will remain adhered and the metal in contact with the photoresist will be
removed. Accordingly, a metallic pattern will be realised on the substrate which mimics the transparent
areas on the photomask used during the exposure step (Fig. 3.2(b)).

Chapter 3 Experimental Techniques
45
Samples Metallic Films Film Thickness
(nm)
Use of Photolithography
& Lift-Off
Chapter 4 Al/Fe 8/2 x
Chapter 5 & 6 Ti/Pd/Al/Fe 4/95/8/2
Chapter 7 - Test TiN/Al/Fe/PL 50/8/4/10 x
Chapter 7 - Device Ti/Pd/TiN/Al/Fe/PL 4/60/50/8/4/10
Table 3.1: Overview of the metallic layers deposited for samples in each chapter. Includes their thicknesses,
and whether photolithography was used to define patterns or not. PL is protective layer.
Following metal deposition the photoresist needs to be removed, for this removal N-methyl-2-
pyrrolidone (NMP)-1165 was used. The substrate is completely submerged in this organic solvent for
at least four hours on a hot plate at 70 ⁰C to facilitate the lift-off procedure. The elevated temperature,
along with a short ultrasonication (<30 seconds) after the substrate has been removed from the hot plate,
produced a clean lift-off. The substrates were washed thoroughly in subsequent acetone, DI water and
iso-propanol, then dried with a N2 air gun, to remove NMP-1165 residuals.
Figure 3.2: Photographs illustrating an example of photolithography, (a) photomask used and (b) sample that
has undergone photolithography using the photomask in (a) and has been metallised and ‘lifted-off’.
3.1.3. Radio-Frequency Sputtering
Following lift-off, when fabriating the MEA device, the whole substrate was passivated (Fig. 5.1 – step
2) by RF-sputtering of a SiO2 target (Noriko 2000 RF magnetron sputterer ), producing a film of 250
nm thickness. The deposition values were as follows, chamber pressure of 5 mTorr, Ar/O2 flow of 50/5
sccm, magnetron power density of 1.23 W cm-2 at a 100% separation and 4 rpm rotation.
3.1.4. Reactive-ion Etching
Reactive-ion etching (RIE) is a ‘dry’ etching technique, i.e. it uses ionised gases as the etchant. This is
the main alternative to ‘wet’ etching which uses a liquid or aqueous solution as the etchant. RIE was
preferred here as it produces a relatively controlled anisotropic etch compared to wet etching which
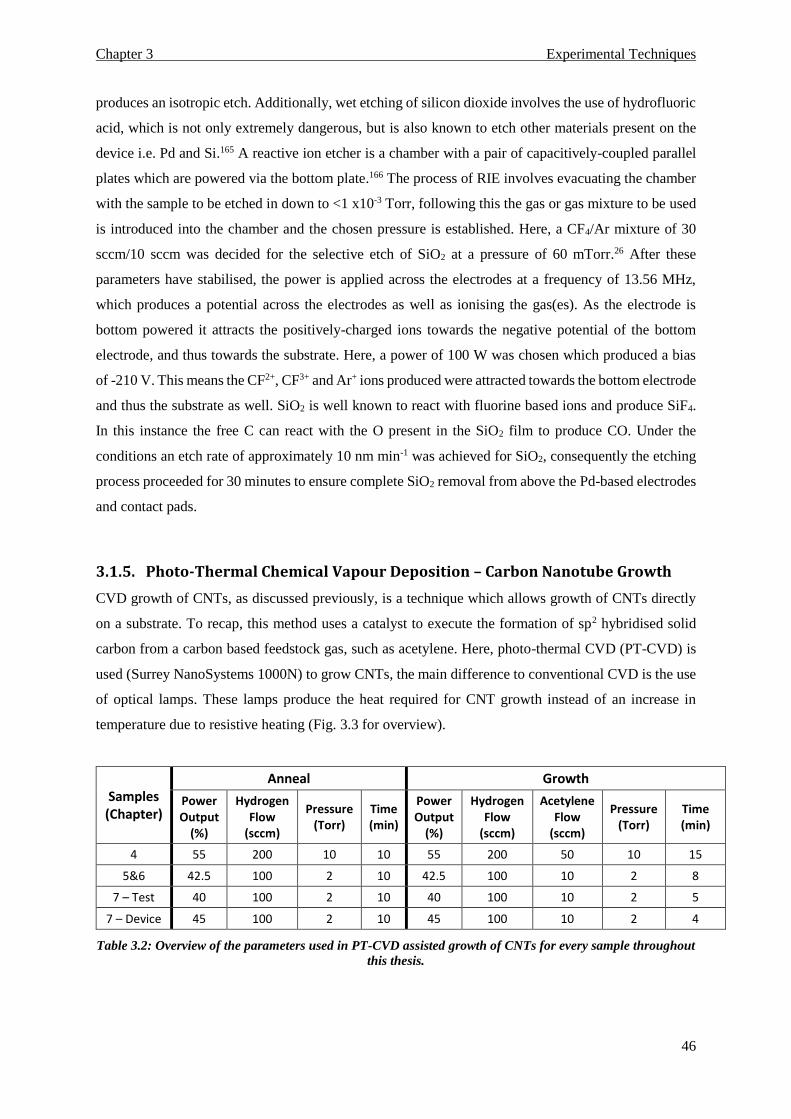
Chapter 3 Experimental Techniques
46
produces an isotropic etch. Additionally, wet etching of silicon dioxide involves the use of hydrofluoric
acid, which is not only extremely dangerous, but is also known to etch other materials present on the
device i.e. Pd and Si.165 A reactive ion etcher is a chamber with a pair of capacitively-coupled parallel
plates which are powered via the bottom plate.166 The process of RIE involves evacuating the chamber
with the sample to be etched in down to <1 x10⁻³ Torr, following this the gas or gas mixture to be used
is introduced into the chamber and the chosen pressure is established. Here, a CF4/Ar mixture of 30
sccm/10 sccm was decided for the selective etch of SiO2 at a pressure of 60 mTorr.26 After these
parameters have stabilised, the power is applied across the electrodes at a frequency of 13.56 MHz,
which produces a potential across the electrodes as well as ionising the gas(es). As the electrode is
bottom powered it attracts the positively-charged ions towards the negative potential of the bottom
electrode, and thus towards the substrate. Here, a power of 100 W was chosen which produced a bias
of -210 V. This means the CF2+, CF3+ and Ar+ ions produced were attracted towards the bottom electrode
and thus the substrate as well. SiO2 is well known to react with fluorine based ions and produce SiF4.
In this instance the free C can react with the O present in the SiO2 film to produce CO. Under the
conditions an etch rate of approximately 10 nm min-1 was achieved for SiO2, consequently the etching
process proceeded for 30 minutes to ensure complete SiO2 removal from above the Pd-based electrodes
and contact pads.
3.1.5. Photo-Thermal Chemical Vapour Deposition – Carbon Nanotube Growth
CVD growth of CNTs, as discussed previously, is a technique which allows growth of CNTs directly
on a substrate. To recap, this method uses a catalyst to execute the formation of sp2 hybridised solid
carbon from a carbon based feedstock gas, such as acetylene. Here, photo-thermal CVD (PT-CVD) is
used (Surrey NanoSystems 1000N) to grow CNTs, the main difference to conventional CVD is the use
of optical lamps. These lamps produce the heat required for CNT growth instead of an increase in
temperature due to resistive heating (Fig. 3.3 for overview).
Samples (Chapter)
Anneal Growth
Power Output
(%)
Hydrogen Flow
(sccm)
Pressure (Torr)
Time (min)
Power Output
(%)
Hydrogen Flow
(sccm)
Acetylene Flow
(sccm)
Pressure (Torr)
Time (min)
4 55 200 10 10 55 200 50 10 15
5&6 42.5 100 2 10 42.5 100 10 2 8
7 – Test 40 100 2 10 40 100 10 2 5
7 – Device 45 100 2 10 45 100 10 2 4
Table 3.2: Overview of the parameters used in PT-CVD assisted growth of CNTs for every sample throughout
this thesis.

Chapter 3 Experimental Techniques
47
The specific parameters for CNT growth on each sample or device are stated in Table 3.2. In detail, the
process begins by placing the sample, which is fabricated to have a thin catalyst layer (Fe here), inside
the vacuum chamber and pumping down to a pressure of ~5 x10⁻⁵ Torr. A reducing gas is then
introduced at a set flow rate, here it was hydrogen at either 100 or 200 sccm, and a chamber pressure is
also set which is either 2 or 10 Torr here. Once these parameters have settled the 8 optical lamps in the
roof of the equipment are turned on to a set power, each lamp produces a power of 1 kW at maximum
power output, here power outputs of between 42.5% and 55% were used (between 3.2 and 4.4 kW).
The equipment is then left with these parameters for a set time, which here is 10 minutes. This is known
as the annealing process. This part of the process is exacted for two main reasons. First, the relatively
high temperature causes the thin metal catalyst film (Fe) to produce a nanoparticle-like morphology,
where these nanoparticles will catalyse the production of CNTs. Secondly, the hydrogen acts to reduce
the catalyst film, which has more than likely oxidised in the ambient air prior to CNT growth, as metallic
catalyst oxidation state is considered a requirement for high quality CNT growth.21,167
Figure 3.3: Simulated image of the inside of the chamber providing PT-CVD assisted growth of CNTs. The
IR lamps provide energy directed at the substrate through a quartz plate. The substrate is located above a Si
wafer and carbon fibre (CF) mat with convectional water cooling applied underneath (water plate).
Following the anneal stage the carbon feedstock gas, which is acetylene here, is introduced without
altering any of the other parameters. Now, the nanoparticle-like metallic Fe catalyst particles catalyse
the production of solid sp2 hybridised carbon in the form of a nanotube, from the pyrolysed acetylene,
this is called the growth stage. This growth stage continues for a set time which is varied depending on
the requirements. At the termination of CNT growth the lamps are turned off, in addition to the gases

Chapter 3 Experimental Techniques
48
being switched off and the pressure valve fully opened. The chamber is then allowed to cool to room
temperature, vented, and the sample removed for further processing or characterisation.
3.2. Characterisation Techniques
3.2.1. Scanning Electron Microscopy
Scanning electron microscopy (SEM) is a non-destructive imaging technique which permits a resolution
limit on the order of 10 nm for solid samples using secondary electrons.168 The technique involves
accelerating electrons from an electron source (or gun) which is metallic in nature into a sample,
followed by measurement of the electrons released from the sample. To be more specific, the electrons
are accelerated from the source towards the condenser lens, where it is converged via electromagnetic
coils. Following this the beam then passes through an objective lens with the purpose of focusing the
beam onto the sample. There are also scan coils present between the condenser lens and objective lens
which use magnetic fields to allow movement of the beam in the x and y directions (Fig. 3.4).
Figure 3.4: Schematic demonstrating the electron path in a scanning electron microscope from emission at
the electron source to interaction with the sample, producing secondary electrons which are detected to
produce an image. Adapted from 169.
When the incident electrons collide with the sample they can produce a number of signals such as
secondary electron emission, backscattered electron emission, and X-rays, among others. Secondary
electron emission is the signal used for SEM, when an incident electron collides with the sample the
energetic interaction generates the emission of a loosely bound electron close to the sample surface.
This secondary electron interacts with the secondary electron detector, which in turn generates an
image, allowing topographical and morphological qualitative analysis of the sample. Beyond secondary

Chapter 3 Experimental Techniques
49
electrons, other sample emissions such as backscattered electrons, X-rays, and cathodoluminescence
excitations are possible depending on the accelerating voltage of the electron column and the interaction
volume with the sample. These emissions can provide semi-quantitative information on relative density
and elemental composition of the sample.
In this project, samples were prepared for SEM by adhering them to a metallic stub using carbon tape.
The stub was placed in its holder in the vacuum chamber and the chamber pumped down to a vacuum
of ≤1 x10⁻⁴ mbar. Images were then obtained using the FEI Quanta ESEM. A range of parameters were
used for each image, with an accelerating voltage range from 5 kV to 30 kV and a spot size of between
3.0 and 4.0. The images were then post-processed using ImageJ analysis where the contrast/brightness
was altered, in addition to pasting an accurate scale bar on each image.
3.2.2. Transmission Electron Microscopy
Transmission electron microscopy (TEM) is a microscopy technique which involves focusing a high
energy electron beam, e.g. 100 keV, onto an ultrathin sample. Consequently, as the beam passes through
the sample an image is produced via a diffraction contrast mechanism. This technique is able to image
at higher resolutions than SEM and can provide structural information about a sample. In the case of
CNTs, TEM has been used extensively to provide information about the number of walls, chirality,
length, and diameter.28,170
In this project, samples were prepared by removing the CNTs (both functionalised and non-
functionalised) from their substrate via a scalpel, and depositing them in acetone. The CNTs were then
dispersed in acetone via ultrasonication for 5 minutes. 2-3 drops of this dispersion was then deposited,
via a capillary tube, onto a 300 mesh copper TEM grid. Finally, images were taken by Dr. Vlad Stolojan
at the University of Surrey Materials Science Department using a Hitachi HD-2300A Scanning
Transmission Electron Microscope.
3.2.3. Contact Angle Measurements
Measurement of the wettability of a solid material with a liquid or aqueous solution can be determined
by investigation of the contact angle. This contact angle is defined as the angle produced at the
intersection between the solid/liquid interface and the liquid/vapour interface (Fig. 3.5). For favourable
wetting conditions the liquid will increase its contact area with the solid, producing a reduced contact
angle. If this liquid is water and the contact angle is <90º then the material is thought of as hydrophilic.
For unfavourable wetting conditions the liquid droplet remains tight and reduces its contact area with

Chapter 3 Experimental Techniques
50
the solid, producing a higher contact angle. If this liquid is water and the contact angle is >90º then the
material is thought of as hydrophobic, this is observed naturally via the lotus effect.
Figure 3.5: Contact angle measurement of a liquid droplet on a solid material surface. (Left) demonstrating
parameters of γlv (liquid-vapour interface), γsv (solid-vapour interface), and γsl (solid-liquid interface), the
angle formed is for favourable wetting as the contact angle is less than 90º. (Right) Unfavourable wetting as
the contact angle is higher than 90º. Adapted from 171.
Experimental contact angle measurements in this project were determined using a Kruss Microdrop
system. This system is composed of a flat stage which can be manoeuvred in the Z-direction, in addition
to a 5 mL capacity syringe perpendicular to the centre of the stage. The syringe was filled with DI water
and the sample (CNTs PT-CVD grown on a Si substrate) placed on the stage, where subsequently the
stage was moved upwards so it was located close to the syringe. A droplet of DI water was slowly
extracted from the syringe, with the sample placed so that the distance the droplet fell from the syringe
until it touched the sample was minimal. Immediately after the DI water droplet contacted the sample
an image was captured, following this a line was drawn from the corner of one side of the droplet to the
other. The Sessile method was then used to calculate the contact angle for DI water on the PT-CVD
grown CNTs.
3.2.4. X-ray Photoelectron Spectroscopy
X-ray photoelectron spectroscopy (XPS) is an analytical technique which uses incident X-ray photons
to excite, and thus emit, core energy-level electrons from the surface of a material (Fig. 3.6). The X-
rays are focused onto the material and the output is extracted in terms of the binding energy of the
emitted core shell electrons. This concept allows quantitative analysis of the elements present on the
surface of the material, their respective atomic percentage, and their chemical state (i.e. bonding status).
Notably, this technique is carried out in ultra-high vacuum to increase the mean free path of electrons.
This is in order to allow the maximum possible collection at the hemi-spherical analyser (detector)
which is located close to the sample surface.

Chapter 3 Experimental Techniques
51
Figure 3.6: Illustration of the X-ray photoelectron spectroscopy technique demonstrating how X-rays
directed at the sample can eject core shell electrons allowing elemental analysis. Adapted from 172.
XPS was carried out by Dr. Steven Hinder (University of Surrey – Materials Science Department) on a
ThermoScientific ThetaProbe with an Al K-α X-ray monochromated source (1486.6 eV) (MXR1),
where the source was 37ᵒ from the surface, with a spot size of 400 µm radius on the sample. The binding
energy spectrum was then produced using a 0.2 eV step, following this full spectrum investigation,
smaller binding energy ranges were analysed and 20 accumulations were produced for each range thus
increasing the signal-to-noise ratio.
3.2.5. Raman Spectroscopy
Raman spectroscopy has fast become one of the main techniques for characterisation of nano-carbon
materials, particularly graphene and CNTs.173,174 This non-destructive technique allows characterisation
of symmetrical bonds and molecules via probing of lattice vibrations, i.e. phonons, via inelastic
scattering of light. More specifically, a photon from a laser light source of a given wavelength interacts,
and excites, an electron from the valence band to the conduction energy band in the material being
investigaed. The excited electron is then scattered by emitting (Stokes) or absorbing (Anti-Stokes)
phonon(s), finally the electron relaxes back to the valence energy band by emitting a photon. The output
is the measurement of the intensity of scattered light as a function of the frequency downshift (assuming
a Stokes interaction) of the scattered light, called Raman Shift.16
There are a number of peaks in the Raman spectrum of CNTs which can provide information that is of
interest to this project. At the lower Raman Shift values (between 100 cm-1 and 500 cm-1) are the radial
breathing modes (RBM). The RBM reflects the in-phase vibration of the A symmetry phonons in the
radial direction, its presence is a direct confirmation of CNTs (usually SWCNTs) in the sample as no
other known material generates these modes.15 Material information such as electronic structure and
tube radius can be determined from RBM. However, MWCNT do not generate RBM as interference
effects diminish its intensity, this is due to the increased number of walls. The G peak is a first-order
Raman scattering event that is due to the emission of the E2G optical phonon, it is present in all graphitic-
based materials at ~ 1582 cm-1.173 The D peak is a second-order Raman scattering event present at ~1350

Chapter 3 Experimental Techniques
52
cm-1 that involves the inelastic emission of a phonon, in addition to elastic scattering at a defect point
in the lattice. The ratio of the intensity of the D peak compared to the intensity of the G peak is
commonly used as an indicator of the quality of the CNT sample, with smaller ratios indicating less
defects in the lattice.174 The other peak of interest on the Raman spectrum for this project is the 2D
peak, again a second-order Raman scattering event which is an overtone of the D peak and is located at
~2700 cm-1. However, even though this is an overtone of the D peak it involves phonon emission from
two inelastic scattering events as it does not require a defect. The relative intensity of the 2D peak has
been associated with long-range ordering of the crystal structure of CNTs.26
The Renishaw System 2000 Raman Microscope was used to produce the Raman spectroscopy
measurements evaluated in this report. The sample was initially placed on the stage and the area to be
assessed was located using the 50x magnification lens. The 514 nm wavelength laser (EL = 2.41 eV)
was employed for all Raman measurements in this report, with a laser power of 5 mW and a spot size
on the sample of ~5 µm2, again for all measurements.
3.2.6. Electrochemical Impedance Spectroscopy
Electrochemical impedance spectroscopy (EIS) is a technique which permits the recording of the
interfacial impedance of a solid sample as part of an electrochemical cell (i.e. in an aqueous
environment). This technique involves applying a small AC potential signal (between 1 mV and 10
mV) at various frequencies to the working electrode, which is normally the sample being investigated.
The application of a small sinusoidal excitation potential means the cells response is pseudo-linear, i.e.
the response is a sinusoidal signal only shifted in phase. This pseudo-linear response at various
frequencies is generally output in two main graphical forms, a Nyquist plot and a Bode plot. The Nyquist
plot graphs the real component of the impedance output on the x-axis against the imaginary component
of impedance on the y-axis, with each data point generated at a particular frequency. The Bode plot
represents the relationship between the modular impedance and input signal frequency, in addition to
the phase shift associated with input signal frequency.
Component Current vs. Voltage Impedance
Resistor V = IR Z = R
Inductor V = L*dI/dt Z = jωL
Capacitor I = C*dV/dt Z = 1/jωC
Table 3.3: Response of circuit components in terms current vs. voltage, in addition to the parameters that
affect impedance for each circuit component.
Taking the response of common circuit elements into account (Table 3.3), the Nyquist and Bode plots
can aid in determining an equivalent circuit model for the solid electrode being investigated

Chapter 3 Experimental Techniques
53
electrochemically. These equivalent circuit models are commonly simulated to provide information
about dynamic systems, a prime example is corrosion of an insulating material on a conductive surface.
Electrochemical impedance measurements were made using an AutoLab PGSTAT 12 potentiostat, with
a FRA2 module, connected to a PC running the NOVA 1.11 software for interface and recording
purposes. The electrode set-up was placed inside a custom faraday cage to reduce the influence of
external noise on the measurements (Fig. 3.7).
Figure 3.7: Photograph, with illustrations, of the equipment set-up. The electrode(s) are set-up in the faraday
cage and connected to the potentiostat. The NOVA software runs and analyses the response from the
Potentiostat. The N2 line is used to purge the solutions before measurements (optional).
In all cases a 3-electrode set-up was used, as demonstrated in Figure 3.8. Initially, the MEA was placed
on a flat surface inside a custom Faraday cage. Then, a Pt counter electrode (Metrohm), and Ag/AgCl
reference electrode (Metrohm) (which is stored at 4 °C when not in use), were placed inside the plastic
ring above the working electrode, the plastic ring is designed to hold the solution being tested. The
working electrode was either a CNT or electroplated Pt electrode (Fig. 3.8(b)) and is connected to the
potentiostat via a clip which attaches to the bond pad at the edge of the device, this produces a
percolation path from the working electrode at the centre of the device to the potentiostat. The plastic
ring is then filled with ~3 mL of phosphate buffered saline (PBS) solution (pH 7.4) and then left to
settle. When the experiment begins a 10 mV AC sinusoidal potential signal is applied to the working
electrode with 13 measurements per decade over a frequency range of 10-1 Hz to 106 Hz.

Chapter 3 Experimental Techniques
54
Figure 3.8: (a) Photograph and (b) schematic of the electrode set-up with the MEA device. (a) Photograph of
the commercial electroplated Pt MEA with the reference electrode (RE) and counter electrode (CE) in
solution inside the plastic ring. A crocodile clip (bottom) is connected to the working electrode bond-pad, the
bond-pad has aluminium foil attached for protection and to increase surface area for crocodile clip
attachment. (b) Schematic of the set-up indicating the percolation path from the croc clip on the working
electrode (WE) bond-pad, along the underlying tracking (ITO for commercial MEA) to the WE in red.
3.2.7. Solutions Preparation
Solutions were prepared on the day of the measurements by making up a stock solution of the
biomolecule to be investigated, followed by dilution to the correct concentrations, apart from PBS
which was made up and then completely used over a number of days. For the PBS solution one tablet
(Sigma-Aldrich Co.) was fully dissolved in 200 mL of ultrapure water (18.2 MΩ) to yield 0.01 M
phosphate buffer, 0.0027 M potassium chloride and 0.137 M sodium chloride, pH 7.4, at 25 °C. For
potassium nitrate (KNO3) the stock solution was 0.5 M, prepared by dissolving completely 5.65 g in
100 mL of ultrapure water (18.2 MΩ). For potassium ferricyanide the stock solution was 1 mM,
prepared by dissolving completely 3.29 x10⁻² g of potassium ferricyanide in 100 mL of pre-prepared
0.5 M KNO3 solution. For dopamine the stock solution was 100 µM, prepared by dissolving completely
1.89 x 10⁻³ g of dopamine hydrochloride (Sigma-Aldrich Co.) in 100 mL of pre-prepared PBS solution.
For ascorbic acid the stock solution was 500 µM, prepared by dissolving completely 8.81 x 10⁻³ g of
ascorbic acid (Sigma-Aldrich Co.) in 100 mL of pre-prepared PBS solution. For noradrenaline the stock
solution was 100 µM, prepared by dissolving completely 3.19 x 10⁻³ g of noradrenaline bitartrate
(Sigma-Aldrich Co.) in 100 mL of pre-prepared PBS solution. For uric acid the stock solution was 500
µM, prepared by dissolving completely 8.41 x 10⁻³ g of uric acid (Sigma-Aldrich Co.) in 100 mL of
pre-prepared PBS solution. These were then diluted to the required concentrations and the solutions
stored at 4 °C until they were needed that day. When the solutions are required they are removed from
the refrigerator, warmed to room temperature and sonicated to remove as many air bubbles as possible.

Chapter 3 Experimental Techniques
55
3.2.8. Cyclic Voltammetry
Cyclic voltammetry is an electrochemical technique that permits characterisation of phenomena
occurring at the electrode/electrolyte solution interface, that includes oxidation, reduction of
electroactive species, adsorption, desorption, and metal dissolution.175 Classically, the cell is set-up in
a three-electrode arrangement, where the electrodes are the working electrode, reference electrode, and
counter electrode. This technique involves applying a voltage between the counter electrode and the
working electrode, with the desired potential of the working electrode attained respective to the
reference electrode potential.
Figure 3.9: Graphical representation of the triangular waveform applied during cyclic voltammetry.
A cyclic triangular waveform (Fig. 3.9) is then applied between the working electrode and counter
electrode, with the anodic/cathodic potential limits pre-determined (for aqueous solutions the minimum
and maximum will usually be determined as the potential at which oxygen and hydrogen are evolved,
respectively). Thus, the output is a plot of the applied potential range vs. the recorded current at the
working electrode.
The electrode set-up for these measurements is the same as discussed in Section 3.2.6. Before each
experiment the MEA would be tested with PBS via cyclic voltammetry for the presence of oxidation
peaks. If none were found the experiment would continue, if they were found the electrode would be
rinsed with ultrapure water (18.2 MΩ) and cycled in PBS from -0.4 V to +0.55 V until the peaks
disappeared. For most cyclic voltammetry measurements a range of -0.1 V to +0.5 V (vs. Ag/AgCl) has
been used at a scan rate of 100 mV/s. However, for potential window scans (Fig. 7.10) a range from -
2.0 V to +2.0 V (vs. Ag/AgCl) has been used at a scan rate of 1 V/s. Following the experiment the
electrode was cleaned, the cleaning process involved rinsing the electrode two to three times with

Chapter 3 Experimental Techniques
56
ultrapure water (18.2 MΩ), followed by leaving the electrode to soak in clean ultrapure water for 12
hours. The electrode would then be rinsed again two to three times with ultrapure water and placed in
a sealed plastic container ready for its next use.
3.2.9. Differential Pulse Voltammetry
Differential pulse voltammetry uses the same 3-electrode set-up as EIS and cyclic voltammetry,
however the scan technique is not triangular as it is in cyclic voltammetry. This technique employs a
pulse of a defined period and amplitude at specified potential intervals (Fig. 3.10). The current is
sampled twice per pulse, once directly before the pulse and once at the end of the pulse, the difference
between the current is then plotted as a function of the potential step. This technique aims to reduce the
influence of the charging current (non-faradaic) on the measured current output, therefore facilitating
lower detection limits and higher sensitivities for electroactive species.
Figure 3.10: Graphical representation of the pulse system applied during a differential pulse voltammetry
scan.
The electrode set-up for these measurements is the same as detailed in Section 3.2.6. Before each
experiment the MEA would be tested with PBS via cyclic voltammetry and differential pulse
voltammetry for the presence of oxidation peaks. If none were found the experiment would continue, if
they were found the electrode would be rinsed with ultrapure water (18.2 MΩ) and cycled in phosphate
buffered saline from -0.4 V to +0.55 V until the peaks disappeared. For differential pulse voltammetry
the parameters were the same for every measurement, pulse amplitude of 50 mV, pulse width of 50 ms,
Chapter 3 Experimental Techniques
57
and pulse period of 0.2 s. However, the concentrations used for measuring the sensitivity of each
biomolecule varied as discussed with each separate result. Following the experiment the electrode was
cleaned, the cleaning process involved rinsing the electrode two to three times with ultrapure water
(18.2 MΩ), followed by leaving the electrode to soak in clean ultrapure water for 12 hours. The
electrode would then be rinsed again two to three times with ultrapure water and placed in a sealed
plastic container ready for its next use.
3.3. Summary
To summarise, this chapter has outlined the fabrication procedure for the samples and devices
investigated in this project, in addition to the characterisation techniques used. The fabrication
procedure involved a number of steps aimed at producing electrically contacted CNTs at the electrode
areas for the MEA devices. Once the final device was realised a variety of characterisation techniques
were carried out to measure the properties of the PT-CVD grown CNTs, such as their height, electrical
type, and quality. Furthermore, electrochemical characterisation techniques were undertaken to provide
results which allowed comparison to state-of-the-art devices, in addition to devices reported in the
literature. These comparisons help to provide an informed decision on whether PT-CVD grown
functionalised CNT MEAs could be a useful research tool for neurotransmitter detection. The next
chapter, which is the first results chapter, investigates the potential for oxygen plasma functionalisation
to be used for CNTs. This is an important step in the realisation of a functionalised CNT MEA, with
CNTs directly grown on the device, as oxygen plasma functionalisation is one of the only techniques
where the procedure does not harm the rest of the device.

Chapter 4 Functionalisation of CNTs by Oxygen Plasma
58
Chapter 4 - Functionalisation of CNTs by Oxygen
Plasma
4.1. Introduction
Carbon nanotubes (CNTs) exhibit a significant aspect ratio, which in turn provides a large surface area
with respect to the volume it takes up for this material.137 To take full advantage of this large surface
area, it is advantageous for the CNTs to be grown, for example by CVD, and produce many vertically
aligned CNTs in an ordered manner. This method allows almost the entire surface of the CNT to be
exposed to the environment of interest. Therefore, in accordance with the aims of the project, which is
to produce a sensitive and selective biosensor for dopamine in the form of a MEA, the CNTs need to
be grown by PT-CVD directly onto the device at pre-determined sites. Additionally, after the CNTs
have been grown it is necessary to functionalise them with oxygen containing functional groups for two
reasons. Firstly, this type of functionalisation has been demonstrated extensively to improve the wetting
characteristics of CNTs with aqueous solutions.27,34,49–51,176 Secondly, the oxygen containing functional
groups on the CNT which has predominantly sp2 bonding, will potentially allow separation of dopamine
and ascorbic acid based on electrostatic interactions at pH 7.4, as has been demonstrated in the
literature.109
There are many available routes to functionalise CNTs for various purposes (Fig. 4.1), however this
project requires a functionalisation procedure which will alter the CNT chemical structure yet leave the
rest of the device undamaged. Thus, oxygen plasma functionalisation was chosen as it has been shown
to dramatically improve CNT wetting characteristics by bonding of oxygen containing functional
groups,34 in addition to causing minimal to no damage to silicon based devices.27
Consequently, this chapter focuses on how varying the exposure time to oxygen plasma, at a set power,
affects the structure and behaviour of CNT forests grown by PT-CVD. A power of 50 W was set as it
has been previously shown to cause the largest increase in the atomic percentage of oxygen bonded to
CNTs, with higher power settings having caused etching of the CNT structure.177 Additionally, a
maximum experimental time of 50 seconds at 50 W has been set, which is close to the threshold where
CNTs will again begin to be etched significantly.177 The change in morphology, structure, and behaviour
for non-functionalised CNTs and CNTs functionalised in oxygen plasma for various exposure times,
has been extensively characterised. SEM was used to determine large scale observable differences in
the CNT forest, as well as differences in CNT morphology. TEM was undertaken to observe alterations
to the individual CNT structures. Contact angle measurements were made to determine variations in

Chapter 4 Functionalisation of CNTs by Oxygen Plasma
59
wetting behaviour of the CNTs with de-ionised water. Furthermore, XPS and Raman spectroscopy
measurements and analysis were carried out to determine how the functionalisation changed the
chemical and physical structure of the CNTs. Finally, Raman spectroscopy measurements performed
along the side-wall of CNTs allowed for the determination of how deep into the CNT forest the oxygen
plasma functionalisation reached.
Figure 4.1: Illustration of various types of CNT functionalisation and the processes used. Adapted from 42.
4.2. Sample Preparation & Characterisation
Si/SiO2 samples were cleaved to size (~1 cm2) using a diamond scribe, after which they underwent the
substrate cleaning procedure outlined in Section 3.1.1.
The catalyst was then deposited on the substrate (Table 3.1) by DC-sputtering, then CNTs were grown
on the samples by PT-CVD as described in Section 3.1.5. Temperatures were measured by a pyrometer
located underneath the substrate and a thermocouple placed above the substrate, which reported a
maximum of 450 ᵒC and 722 ᵒC, respectively (Fig. 4.2).

Chapter 4 Functionalisation of CNTs by Oxygen Plasma
60
Figure 4.2: Temperature profile of the substrate during the CNT growth process. The solid line represents
the reading from the pyrometer (bottom of substrate) and the dotted line represents the reading from the
thermocouple (top of substrate). * shows the change from anneal stage to growth stage, • represents end of
growth stage.
Samples were then either left non-functionalised or they were functionalised by further using an oxygen
plasma process. Samples were placed in a RF chamber (Emitech K-1050X) and the chamber was
evacuated to 0.15 Torr, 15 sccm of O2 was constantly introduced into the chamber for 1 minute before
ionisation. A power of 50 W (13.56 MHz) was set and the exposure time was either 2 seconds, 15
seconds or 50 seconds. The process took roughly 10 minutes to complete.
Samples were characterised qualitatively using SEM (FEI Quanta ESEM) to investigate initial CNT
growth and alterations to the CNTs due to oxygen plasma functionalisation. Contact angle
measurements were made to investigate how the wetting of the CNT forest changed with
functionalisation. XPS was used to report on the changes in C:O ratio at the surface, in addition to
changes in the functional groups present due to functionalisation times. Raman spectroscopy was used
to examine the quality/defects present in the CNTs before and after functionalisation. Six measurements
were taken from separate areas and then mean averaged to produce each spectrum.
0 300 600 900 1200 15000
100
200
300
400
500
600
700
Time [s]
Tem
per
atu
re [
ᵒC]
*
*
•
•

Chapter 4 Functionalisation of CNTs by Oxygen Plasma
61
4.3. Imaging
SEM provides an opportunity to observe how, in detail, the CNT forest reacts to functionalisation using
oxygen plasma post processing. Figure 4.3(a) displays an area of a non-functionalised CNT forest with
vertically-aligned growth and minimal infringements to the top of the CNT forest.
Figure 4.3: SEM images of CNT forest(s) that are (a) non-functionalised, and exposed to oxygen plasma for
(b) 2 seconds, (c) 15 seconds, and (d) 50 seconds. (a) Shows vertically-aligned growth with minimal
perturbations to the forest (tilt 45ᵒ), (b) shows that these areas of functionalisation are numerous and
illustrates obvious changes after short functionalisation of 2 seconds (tilt 45ᵒ). (c) Magnified view of an
affected area due to functionalisation (tilt 45ᵒ), and (d) indicates the depth of the morphological changes (tilt
70ᵒ).
However, some very small defective areas can be observed. With only 2 seconds of exposure to oxygen
plasma the landscape at the top of CNT forest changes dramatically (Fig. 4.3(b)). Areas of reduced CNT
density appear (Fig. 4.3(c)), they are characterised by a change in the morphology from individual
vertically-aligned CNTs to a collective mass where individual tubes are difficult to distinguish. These
areas, in particular, penetrate some way into the forest as demonstrated in Figure 4.3(d), which is a

Chapter 4 Functionalisation of CNTs by Oxygen Plasma
62
sample that has been cleaved at the centre of the forest and imaged side-on. These areas of dramatically
altered CNTs have not been discussed in previous reports involving oxygen plasma functionalisation of
CNTs.34,50,176 Perhaps imperfect areas of CNT growth provide space where gaseous oxygen can
penetrate into the forest, prior to ionisation.
SEM imaging was also used to view how, if at all, CNTs were morphologically altered in other areas
on a more individual basis. Figure 4.4(a-d) provides evidence to show how functionalisation has
affected the CNTs, a clear change can be observed between the non-functionalised CNTs (Fig. 4.4(a))
and the CNTs which have been oxygen plasma functionalised for 50 seconds (Fig. 4.4(d)). This
alteration in CNT morphology is demonstrated by a reduction in density due to oxygen plasma
exposure, in addition to a ‘frayed’ effect at the top of the CNT forest.
Figure 4.4: SEM images of CNTs that are (a) non-functionalised (tilt 45ᵒ), and exposed to oxygen plasma for
(b) 2 seconds (tilt 45ᵒ), (c) 15 seconds (tilt 45ᵒ), and (d) 50 seconds (tilt 45ᵒ). No difference is readily observed
between (a) and (b). Small morphological changes in CNT structure are noticeable with 15 seconds
functionalisation i.e. (c), and (d) illustrates more apparent morphological changes compared to non-
functionalised CNTs.

Chapter 4 Functionalisation of CNTs by Oxygen Plasma
63
Following SEM imaging of CNTs before and after functionalisation, TEM was carried out to determine
any morphological changes due to oxygen plasma exposure. Specifically, TEM provides higher
resolution images compared to SEM allowing any structural differences to be observed. The non-
functionalised CNTs display graphitic tubules (Fig. 4.5(a) & Fig. 4.5(b)) with a wall number varying
between 1 and 4. Also, on some of the non-functionalised CNTs there appears to be an amorphous shell,
demonstrated by the red arrows in Figure 4.5(b), which is likely to have been deposited during the PT-
CVD growth procedure.
Figure 4.5: TEM images of (a,b) non-functionalised CNTs, and (c,d) CNTs functionalised in oxygen plasma
for 15 seconds. (b) Red arrows indicate presence of amorphous carbon shell on CNTs.
Clearly, this amorphous shell was not noticed for every non-functionalised CNT as it is not present in
Figure 4.5(a). Following oxygen plasma exposure for 15 seconds it has been noticed in the SEM images

Chapter 4 Functionalisation of CNTs by Oxygen Plasma
64
that areas of non-tubular structure arise (Fig. 4.3(c)). These areas were also noted in the HR-TEM
images taken (Fig. 4.5(c) & Fig. 4.5(d)). The material appeared to have lost its tubular shape, but still
had some graphitic-like structures present demonstrated by the dark lines in the image (Fig. 4.5(c)).
Thus, the non-functionalised CNTs demonstrated high-quality graphitic tubular structures grown in a
vertically-aligned manner. Following functionalisation there were morphological changes to the CNT
structure in select areas, these areas retained some graphitisation yet the tubular structure was lost.
Following this imaging of the CNTs, contact angle measurements were made to determine the change,
if any, in aqueous wetting behaviour of the CNTs.
4.4. Contact Angle Measurements
The measurement of the contact angle between a sample surface and a droplet of liquid/aqueous solution
(DI water here) can provide information on how well the surface wets with the solution, where the lower
the contact angle is the better the wetting between surface and solution. The contact angle for the non-
functionalised CNTs was measured to be 135ᵒ (Fig. 4.6(a)), which is highly hydrophobic and agrees
with the literature values on this material.176
Figure 4.6: Contact angle images of CNTs. (a) non-functionalised - 135ᵒ. (b, c, d) Exposed to oxygen plasma
at 50 Watts for 2 seconds, 15 seconds and 50 seconds, respectively. Producing contact angles of 0ᵒ, 0ᵒ and 17ᵒ,
respectively.

Chapter 4 Functionalisation of CNTs by Oxygen Plasma
65
However, after only 2 seconds of exposure to oxygen plasma at 50 W the material becomes fully wetting
(superhydrophilic), with a contact angle of 0ᵒ (Fig. 4.6(b)). The result is identical after 15 seconds with
0ᵒ contact angle, yet after 50 seconds of exposure the contact angle decreases to a lesser degree, to 17ᵒ
(Fig 4.6(d)). Whilst this is still hydrophilic, the material has displayed less of an increase in
hydrophilicity after a longer exposure time (2/15 seconds vs. 50 seconds). This result, in general, does
not agree with previous literature,176 thus XPS and Raman spectroscopy were used to determine any
changes in chemical bonding and defect concentration due to exposure to oxygen plasma.
4.5. X-ray Photoelectron Spectroscopy Analysis
Analysis of the XPS survey scans reveals a dramatic increase in the oxygen content of the material after
functionalisation (Fig. 4.7). After only 2 seconds of functionalisation the atomic oxygen percentage
increased from 0.84% to 35.14%, this remained at ~35% at 15 seconds but dropped to <30% at 50
seconds (Table 4.1).
Figure 4.7: X-ray photoelectron spectra of (a) non-functionalised CNT, and oxygen plasma exposed CNTs
for (b) 2 seconds, (c) 15 seconds, and (d) 50 seconds. All spectra are illustrated with their identifiable peaks
i.e. C1s, N1s and O1s, the respective percentages of each atom for each sample are in Table 4.1.
0 200 400 600 800 1000 1200
0
1x10⁴
2x10⁴
3x10⁴
4x10⁴
nfCNT
Binding Energy [eV]
Co
un
ts [
a.u
.]
C1s
O1s
(a)
0 200 400 600 800 1000 1200
0
1x10⁴
2x10⁴
3x10⁴
4x10⁴
Binding Energy [eV]
Co
un
ts [
a.u
.]
C1s
O1s
N1s
fCNT - 2 s(b)
0 200 400 600 800 1000 1200
0
1x10⁴
2x10⁴
3x10⁴
4x10⁴
Binding Energy [eV]
Co
un
ts [
a.u
.]
C1s
O1s
N1s
fCNT - 15 s(c)
0 200 400 600 800 1000 1200
0
1x10⁴
2x10⁴
3x10⁴
4x10⁴
Binding Energy [eV]
Co
un
ts [
a.u
.]
C1s
O1s
N1s
fCNT - 50 s(d)

Chapter 4 Functionalisation of CNTs by Oxygen Plasma
66
This reduction in atomic oxygen percentage at the CNT surface during longer functionalisation times,
i.e. 50 seconds, may be why the contact angle decreases to a lesser degree, i.e. 17 ᵒ for 50 seconds
instead of 0 ᵒ for 15 seconds. Additionally, a small quantity of nitrogen was found in the functionalised
CNT survey scans, which is most likely due to a relatively high pressure (0.15 Torr) during the process
which may have ionised some remaining nitrogen in the chamber which was not fully evacuated. It is
worth noting that XPS is a surface technique, generating most of its core shell electrons from the upper
most 10 nm of the material.178 This is an important point to consider when investigating CNTs, where
the CNT height can exceed 0.5 mm.
Atom
Atomic percentage for each sample (%)
Non-functionalised Functionalised
2 s
Functionalised
15 s
Functionalised
50s
C1s 99.16 64.11 64.04 69.95
N1s 0 0.75 0.94 0.5
O1s 0.84 35.14 35.04 29.55
Table 4.1: Atomic percentages for every atom identified on the XPS spectra of each sample. Percentages
defined by calculating the normalised area under the curve, also sensitivity factors have been used to define
these atomic percentages, oxygen=0.66 and carbon=0.25. Shirley background used for every peak.
Analysis of the XPS spectra in the binding energy range of the C1s peak revealed six major components
in all of the spectra (Fig. 4.8) which are summarised in Table 4.2. The two peaks at 284.5 ±0.2 eV and
285.1 ±0.2 eV were attributed to sp2 C=C bonding and sp3 C-C bonding, respectively. The next three
peaks are associated with carbon bonded to oxygen containing functional groups, peaks at 286.2 ±0.2
eV, 287.2 ±0.2 eV, and 288.9 ±0.2 eV representing hydroxyl, carbonyl and carboxyl groups,
respectively.177 The final shake-up satellite peak at 290.3 ±0.2 eV is attributed to the π→π* transitions
in aromatic compounds.177,179
The relative bonding in the CNT structure changes with different exposure times to oxygen plasma,
such that the oxygen functional groups dominate the spectra and CNT graphitisation (sp2 C=C)
dramatically decreases with all exposure times. This is exemplified by 2 seconds of exposure, as this
produced the lowest percentage of C=C sp2 bonding and π→π* bonding. Of note is previous work
which investigated CNT functionalisation, their modelling demonstrated a trend in interaction bonding
energies as such: hydroxyl(116 kcal/mol)>carboxyl(80 kcal/mol)>carbonyl(70 kcal/mol).177 This trend
is observed for all CNT functionalised samples created here, with carbonyl bonding dominating over
the carboxyl and hydroxyl bonding. In addition to increasing the number of oxygen functional groups,
the exposure to oxygen plasma also decreased the concentration of sp3 C-C bonding. This bonding is
present in amorphous carbons which may be located either as a defect area of the CNT, or surrounding

Chapter 4 Functionalisation of CNTs by Oxygen Plasma
67
the CNT walls. This decrease in sp3 C-C by itself would increase the purity of the sample, however this
improvement is likely to be overshadowed by the dramatic induction of defects in the CNT structure,
in the form of oxygen functional groups.
Figure 4.8: XPS spectra of CNTs, focusing on the C1s peak area. (a) non-functionalised. (b-d) oxygen
plasma exposed CNTs at 50 W for (b) 2 seconds, (c) 15 seconds, and (d) 50 seconds. Black line is original
spectrum, blue lines are the fitted peak areas (Gaussian:Lorentzian 70:30) corresponding to Table 4.2, and
red line is cumulative fit.
Overall, any oxygen plasma exposure time increased the concentration of oxygen containing functional
groups, however no clear trend between specific groups and functional times was noticed, except that
the longest exposure time reported higher C=C sp2 bonding compared to the other exposure times.
Interestingly, the sample which was exposed to oxygen plasma for 50 seconds had a much higher
percentage of sp2 C=C bonding (27.78 %) compared to 15 seconds (15.15 %) and 2 seconds (11.47 %).
Concurrently, the carbonyl (C=O) integrated peak area decreases by roughly the same value as the sp2
C=C increases from the 15 second to the 50 second oxygen plasma functionalised sample. Felten et al
(2005) modelled the interaction energies of various functionalisation groups and found that CNT=C=O
required much less energy (-36 kcal/mol) compared to CNT=O (70 kcal/mol) to form.177 This indicates
that the C=C bond from the CNT to the carbon in the functional group requires much less energy to
form compared to bonding from the CNT to the oxygen alone. This may indicate that the C=O bonds
formed may be broken and replaced by C=C bonds between 15 seconds and 50 seconds of oxygen
282 284 286 288 290 292 294 296
Peak Analysis
BaseLine:Tougaard
Adj. R-Square=9.98518E-001 # of Data Points=111.
Degree of Freedom=106.SS=8.16804E+004
Chi^2=7.70570E+002
Date:05/10/2015Data Set:[A30W60sO1s]30W20s-C1s!B
Fitting Results
Max Height
1450
2570
1072.76293
76.9946
412.51555
91.48049
48.86586
Area IntgP
15.14459
51.67178
18.20735
1.4073
9.15564
2.62755
1.78579
FWHM
143.93051
147.07286
145.3952
146.20714
148.32296
150.18265
152.76429
Center Grvty
-289.6333
-289.63366
-289.63354
-289.63359
-289.63374
-289.63399
-289.63429
Area Intg
1465.56371
5000.35176
1761.95098
136.1868
886.00456
254.27161
172.81344
Peak Type
Gaussian_LorenCross
Gaussian_LorenCross
Gaussian_LorenCross
Gaussian_LorenCross
Gaussian_LorenCross
Gaussian_LorenCross
Gaussian_LorenCross
Peak Index
1.
2.
3.
4.
5.
6.
7.
Binding Energy [eV]
Inte
nsi
ty [
a.u
.]
Binding Energy [eV]
Inte
nsi
ty [
a.u
.]
Binding Energy [eV]
Inte
nsi
ty [
a.u
.]
Binding Energy [eV]
Inte
nsi
ty [
a.u
.]
(a) (b)
(c) (d)

Chapter 4 Functionalisation of CNTs by Oxygen Plasma
68
plasma exposure, as broken carbon bonds formed due to the etching process have an available electron
each which may bond with one another. This does not necessarily mean the bonds are being re-
established in the CNT structure, yet this increase in sp2 C=C bonding coupled with a decrease in atomic
oxygen concentration, may well explain the increase in contact angle measurements between the 15
second and 50 seconds oxygen plasma functionalised samples. It is important at this point to consider
the uncertainty associated with fitting XPS peaks, such as the C1s, with their constituent components.
As the binding energies of these bonds differ only slightly, less than 1 eV in most cases, in addition to
variation in these binding energies quoted in the literature,50,177,180 there is potential for error in the
fitting. Therefore, whilst XPS provides valuable results, the ambiguity of the peak fitting always needs
to be considered.
Binding Energy
(eV)
Peak
Definition
Integrated Peak Area (%)
nf-CNT fCNT - 2 s fCNT - 15 s fCNT - 50 s
284.6 C=C sp2 40 11.47 15.15 27.78
285.1 C-C sp3 19.29 12.62 18.21 14.17
286.2 Hydroxyl 10.28 2.54 1.41 1.67
287.2 Carbonyl 6 46.19 51.67 38.98
288.9 Carboxyl 6.6 23.37 9.16 11.61
290.3 π→π* 13.6 1.56 2.63 2.84
Table 4.2: XPS peak characteristics and integrated peak areas for non-functionalised and oxygen plasma
functionalised samples.
4.6. Raman Spectroscopy Analysis
Raman spectroscopy is a non-destructive technique which allows the investigation of some structural
components of CNTs. Raman spectroscopy can provide information on various CNT parameters,
specifically its ability to determine CNT quality (i.e. defect density) is of interest to this project. The
ratio of intensity of the D peak to G peak (ID/IG) is a widely used indicator of CNT quality.23,27,176,181 It
compares the intensity signal from defects to the intensity signal from graphitic carbon, thus the lower
the ratio the higher the CNT quality. Here, the ID/IG for non-functionalised CNTs was 0.08, indicating
high quality CNTs with a high degree of graphitisation in the sp2 carbon lattice (Fig. 4.9(a)). Following
exposure to oxygen plasma for 2 seconds the ID/IG increased to 0.99 (Fig. 4.9(b)), indicating a significant
increase in defects in the CNT structure. This increase in defects is most likely because of the substantial
increase in oxygen functional bonding to the carbon in the CNT structure, as demonstrated by the XPS
spectrum. This increase in C-O/C=O bonding will concomitantly cause a decrease in C=C sp2 bonding,
resulting in an increase in the D peak intensity. Increasing the oxygen plasma exposure time increases
the ID/IG such that 15 seconds of exposure produces ID/IG = 1.03 (Fig. 4.9(c)), and 50 seconds exposure

Chapter 4 Functionalisation of CNTs by Oxygen Plasma
69
time causes ID/IG = 1.25 (Fig. 4.9(d)). Hence, longer oxygen plasma exposure times result in more highly
defective CNT structures, according to the ID/IG. This is interesting as XPS analysis demonstrated that
the 50 second exposure time had a higher sp2 C=C surface content compared to the 2 second and 15
second exposures, perhaps meaning its ID/IG should be comparably lower. However, as mentioned in
the previous section this C=C bonding is most likely not in the CNT structure, meaning it is not in the
ordered graphitic lattice and thus may output as a defect.
Another parameter that is commonly analysed when investigating CNT quality is ID/I2D. The 2D peak
is associated with the ‘long-range ordering’ of CNTs, and thus the ratio of defects to long-range ordering
can provide information about CNT quality, again the lower the ratio the higher the CNT quality. The
non-functionalised CNTs recorded a value of 0.21 for ID/I2D, this indicates good long-range ordering
and minimal defects, which reinforces the ID/IG for these CNTs. As before, exposure to oxygen plasma
for only 2 seconds substantially increased the ID/I2D to 3.03, signifying a decrease in long-range order
most likely due to a higher number of defects in the graphitic lattice. Again, an increase in oxygen
plasma exposure time resulted in an increase in ID/I2D to 3.04 for 15 seconds and 3.51 for 50 seconds.
Figure 4.9: Raman spectra of (a) non-functionalised CNTs and CNTs that have been oxygen plasma
functionalised for (b) 2 seconds, (c) 15 seconds, and (d) 50 seconds. The main peaks which are discussed in
the text are labelled, i.e. D peak ~1340 cm-1, G peak ~1585 cm-1, and 2D peak ~2680 cm-1.
500 1000 1500 2000 2500 3000 3500
0.0
0.2
0.4
0.6
0.8
1.0
1.2
Raman Shift [cm-1]
Inte
nsi
ty [
a.u
.]
G
2D
D
500 1000 1500 2000 2500 3000 3500
0.0
0.2
0.4
0.6
0.8
1.0
1.2
Raman Shift [cm-1]
Inte
nsi
ty [
a.u
.]
G
2D
D
500 1000 1500 2000 2500 3000 3500
0.0
0.2
0.4
0.6
0.8
1.0
1.2
Raman Shift [cm-1]
Inte
nsi
ty [
a.u
.]
G
2D
D
500 1000 1500 2000 2500 3000 3500
0.0
0.2
0.4
0.6
0.8
1.0
1.2
Raman Shift [cm-1]
Inte
nsi
ty [
a.u
.]
G
2D
D
(a) (b)
(c) (d)

Chapter 4 Functionalisation of CNTs by Oxygen Plasma
70
A spectrum can also be ‘fitted’, to reveal the individual peaks which summate to form the original
spectrum. Carrying out this fitting can help to identify and quantify peaks which may be difficult to
determine in the original spectrum, in addition to providing other values which can be analysed such as
the integrated peak area. Peak fitting of the spectra revealed peaks that were not initially present in the
non-functionalised CNTs (Fig. 4.10), but were present in the oxygen plasma exposed samples, these
peaks were located at ~1120 cm-1 and 1250 cm-1.
Figure 4.10: Raman spectroscopy spectra showing the D peak and G peak region for (a) non-functionalised
CNTs and CNTs that have been oxygen plasma functionalised for (b) 2 seconds, (c) 15 seconds, and (d) 50
seconds. All spectra have the original spectrum (black line), the fitted peaks (blue lines) and the cumulative
fit peak (red line).
The peak at 1120 cm-1 is most likely the D’’ peak which is associated with highly defective CNTs.16
The appearance of this peak in the oxygen plasma functionalised CNTs is logical, and fits with the
notion that oxygen plasma functionalisation incurs defects in the CNT structure. The presence of the
peak at 1250 cm-1 has been noted in previous investigations into oxygen plasma functionalised CNTs,
where it is associated with defective CNT structures.176 Table 4.3 gives an overview of the relative
integrated peak areas for each of the samples investigated, to allow accurate comparison. The non-
functionalised CNT fitting differs slightly as the G peak has four separate peaks contained within it
(related to E2G and E1G symmetrical vibrational modes) compared to the functionalised CNTs G peak
1000 1100 1200 1300 1400 1500 1600 1700
0.0
0.2
0.4
0.6
0.8
1.0
1.2
1000 1100 1200 1300 1400 1500 1600 1700
0.0
0.2
0.4
0.6
0.8
1.0
1.2
Peak Analysis
BaseLine:None
Adj. R-Square=7.82110E-001 # of Data Points=1507.
Degree of Freedom=1495.SS=1.38095E+001
Chi^2=9.23711E-003
Date:28/10/2015Data Set:[Book5]Sheet1!B
Fitting Results
Max Height
0.02856
0.04442
1.20786
0.14278
0.89465
0.29284
Area IntgP
1.37868
1.70468
52.08608
8.81819
32.44662
3.56575
FWHM
117.18794
93.17526
72.00414
149.94054
60.3672
29.56156
Center Grvty
1130
1245
--
1492
--
1613
Area Intg
3.56287
4.40533
134.6037
22.78845
83.85032
9.21481
Peak Type
Gaussian
Gaussian
Lorentz
Gaussian
Lorentz
Gaussian
Peak Index
1.
2.
3.
4.
5.
6.
Raman Shift [cm-1]
Inte
nsi
ty [
a.u
.]
Raman Shift [cm-1]
Inte
nsi
ty [
a.u
.]
Raman Shift [cm-1]
Inte
nsi
ty [
a.u
.]
Raman Shift [cm-1]
Inte
nsi
ty [
a.u
.]
(a) (b)
(c) (d)

Chapter 4 Functionalisation of CNTs by Oxygen Plasma
71
which contains one.182 Therefore, the G peak area for the non-functionalised CNTs is the summation of
the G+ and G- peaks (E2G) at 1561 cm-1 and 1590 cm-1, respectively. The integrated peak areas illustrate
the decrease in G peak area and increase in D’’, D, and D’ for the functionalised CNTs compared to
non-functionalised, which in turn demonstrates the increase in defects due to functionalisation (Table
4.3). Again, the ratio of the D peak to G peak can be analysed, however this time it is in respect to area,
AD/AG. A similar trend is noted with the area as with the intensity, i.e. the non-functionalised CNT
displaying a very low AD/AG of 0.21. Following exposure to oxygen plasma for only 2 seconds, this
value increases sharply to AD/AG = 1.48, then 15 seconds reports a value of AD/AG = 1.43 which is
broadly similar to 2 seconds of exposure. After 50 seconds of exposure AD/AG = 1.61, again indicating
that oxygen plasma exposure enhances defect density in the CNT structure, and that longer exposure
times increase this defect density.
Peak Characteristics Integrated Peak Area (%)
Centre (cm-1) Nomenclature nf-CNT fCNT - 2 s fCNT - 15 s fCNT - 50 s
1120 D’’ 0 1.62 2.99 1.38
1250 n/a 0.66 0.84 1.70
1345 D 12.3 52.05 49.81 52.09
1480 9.23 8.15 9.19 8.82
1587 G 58.1 35.14 34.82 32.45
1615 D’ 0.9 2.37 2.36 3.57
Table 4.3: Table of Raman peak fit parameters for the non-functionalised CNTs and oxygen plasma
functionalised CNTs.
4.6.1. Raman Spectroscopy – Carbon Nanotube Sidewall Analysis
Whilst other processes cause functionalisation ubiquitously along the entire CNT structure, such as acid
functionalisation, the extent of oxygen plasma functionalisation along the CNT structure is contested.49
Figure 4.3(d) indicates that the functionalisation may be limited to the tip area of the CNT forest, even
with the longest functionalisation time. This is most likely because acid functionalisation, as with many
other functionalisation procedures, is achieved by using CNTs suspended in solution, unlike oxygen
plasma functionalisation which can be performed on vertically-aligned CNTs attached to a substrate. In
an attempt to resolve this issue, both non-functionalised and functionalised CNT samples were cleaved
down the middle of the sample, and then the CNT forest was placed perpendicular (side-on) to the laser
beam and Raman spectroscopy performed. Three measurements were made along the side-walls of the
cleaved CNT forest, one at the CNT tip, one near the middle and one measurement at the bottom where
the CNTs contact the substrate. The measurements at the tips of the CNTs (Fig. 4.11(a-b)) resemble the
Raman spectra in Figure 4.9(a-d), in terms of peak shapes and intensities, where the ID/IG rises with

Chapter 4 Functionalisation of CNTs by Oxygen Plasma
72
increasing functionalisation time. However, measurements from near the middle (Fig. 4.11(c-d)) and
bottom (Fig. 4.11(e-f)) of the CNT sidewalls do not follow this trend. In fact, the spectra for all samples
are almost identical as they demonstrate very similar peaks over the whole spectra, particularly the D
and G peaks (Fig. 4.11(d) and 4.11(f)). This similarity between the non-functionalised and
functionalised samples of all time scales infers that the modification of the CNT structure due to
functionalisation only reaches a definite depth into the CNT forest. This is possibly because the oxygen
does not permeate into the relatively dense CNT forest, and therefore when it is ionised it is still close
to the CNT tips and outer forest CNT sidewalls.
Figure 4.11: Raman analysis of three different areas of the side of the cleaved CNT forest, all graphs show
non-functionalised (black), and functionalised for 2 seconds (blue), 15 seconds (red), 50 seconds (green).
Raman side on at the top (a-b), middle (c-d), and bottom (e-f) of the CNT forest, this is also shown on the
right side of each graph.
500 1000 1500 2000 2500 3000 3500
0.0
0.2
0.4
0.6
0.8
1.0
1.2 n.f.
2 s
15 s
50 s
Raman Shift [cm-1]
Inte
nsi
ty [
a.u
.]
1000 1200 1400 1600 1800
0.0
0.2
0.4
0.6
0.8
1.0
1.2 n.f.
2 s
15 s
50 s
Raman Shift [cm-1]
Inte
nsi
ty [
a.u
.]
500 1000 1500 2000 2500 3000 3500
0.0
0.2
0.4
0.6
0.8
1.0 n.f.
2 s
15 s
50 s
Raman Shift [cm-1]
Inte
nsi
ty [
a.u
.]
1000 1200 1400 1600 1800
0.0
0.2
0.4
0.6
0.8
1.0 n.f.
2 s
15 s
50 s
Raman Shift [cm-1]
Inte
nsi
ty [
a.u
.]
500 1000 1500 2000 2500 3000 3500
0.0
0.2
0.4
0.6
0.8
1.0 n.f.
2 s
15 s
50 s
Raman Shift [cm-1]
Inte
nsi
ty [
a.u
.]
1000 1200 1400 1600 1800
0.0
0.2
0.4
0.6
0.8
1.0 n.f.
2 s
15 s
50 s
Raman Shift [cm-1]
Inte
nsi
ty [
a.u
.]
(a) (b)
(c) (d)
(e) (f)
TOP
MIDDLE
BOTTOM

Chapter 4 Functionalisation of CNTs by Oxygen Plasma
73
4.7. Summary
Conclusively, the results in this chapter have demonstrated that exposure to oxygen plasma, even for a
few seconds, can dramatically affect the CNT structure. Research in the literature indicates the highly
hydrophobic nature of non-functionalised CNTs, this is corroborated by the contact angle of 137°
recorded here. Additionally, reports have demonstrated that water does not penetrate into CNT forests,
even if left for many days on the material surface.4 This highlights the likelihood of an air gap between
the CNTs (where the inter-CNT distance is roughly 100 nm) as the high contact angle means there is a
small area of contact between the water and tips of the non-functionalised CNTs. Following oxygen
plasma exposure the number of oxygen functional groups chemically bonded to the CNT structure rises
dramatically. This in turn affects the wettability of the now functionalised CNTs with water, such that
the surface energy of the material has been increased due to oxygen plasma functionalisation and thus
the contact angle with water decreases. This allows the water to penetrate, via capillary forces,5 between
the CNTs thus largely increasing the surface area of the CNTs in contact with the liquid compared to
when the CNTs were non-functionalised.
Interestingly, the increase in atomic percentage of oxygen in the CNT structure reported here is
substantially larger than the highest percentage reported in the literature, 35.14% here vs. 20% in
literature.177 This is coupled with a complete wetting behaviour with DI water, i.e. contact angle of 0ᵒ,
again the best wetting behaviour with water observed for plasma functionalised CNTs thus far is
5ᵒ.34,130,176 Other research has generally reported that longer functionalisation times produce higher
atomic oxygen concentration and lower contact angles, until a threshold time where the CNT structure
begins to be etched.177 The results here indicate that, using the parameters in this experiment, the atomic
oxygen concentration in the CNT structure reaches a maximum after just 2 seconds of exposure to
oxygen plasma. This concentration then decreases with relatively longer exposure times of 50 seconds,
which is parallel with an increase in contact angle and a higher degree of disorder, as determined by
contact angle and Raman spectroscopy measurements, respectively. The use of RF generated oxygen
plasma compared to a pulsed DC method, in addition to a lower relative pressure, may aid in the
differences between the results in this chapter and the literature, where the atomic oxygen concentration
is lower after similar exposure times.176,177 Raman spectroscopy along the sidewall of the CNTs from
the centre of the CNT forest also revealed that the oxygen plasma only functionalises the top of the
CNTs. The oxygen is therefore likely to only diffuse to a certain depth in the CNT forest before it is
ionised and exerts its effect on the CNT structure. Other reports have noted ubiquitous functionalisation
along the entire CNT structure which is in contrast to the results presented here.49 It is noteworthy that
the CNTs in the literature report a maximum height of 10 µm compared to a forest height of 500 µm
used here. Therefore the oxygen may have been able to diffuse completely into the CNT forest. Overall,
exposure to oxygen plasma has been demonstrated to dramatically improve the surface wetting of CNTs

Chapter 4 Functionalisation of CNTs by Oxygen Plasma
74
with aqueous solutions. However, this functionalisation has also been shown to increase the defects and
thus the disorder within the CNT structure. The knowledge gained from these experiments of using a
fast and effective functionalisation technique will be taken forward and applied to CNTs PT-CVD
grown on a complete MEA device.

Chapter 5 Fabrication & Characterisation of CNT-Based MEAs
75
Chapter 5 - Fabrication and Characterisation of
CNT-based MEAs
5.1. Introduction
MEAs are currently an important research tool, for electrophysiologists in particular. This is due to their
ability to simultaneously measure bioelectrical signals, generated from a number of spatially separated
‘excitable’ cells such as neurons and myocardial cells, upon depolarisation of their membrane. With
multiple electrodes which can themselves be multifunctional and multiplexed, this response can be
measured at multiple locations over an area covered by a number of these cells. Furthermore,
researchers can observe where signals propagate over a network of cells and measure dynamic changes
to this network over time.
Currently, there are a number of commercially available MEAs manufactured for use as
electrophysiological detectors. A range of electrode diameters are available from 10 µm up to 200 µm
with varying interelectrode distance depending on the tissue/cell culture being investigated. The
electrochemical impedance for a commercial electrode of 20 µm diameter, roughly equivalent to a
single large cell, is approximately 30 kΩ (Table 2.1) where the electrode material is Pt black.
Improvements have been made to MEAs in terms of interfacial impedance by altering the electrode
material, as has been discussed previously in Section 2.3.4.2. However, improvements such as
decreasing the electrode interfacial impedance and improving its mechanical stability, an important
parameter when using Pt black as the electrode material, can be made. These improvements can
potentially be realised by the use of CNTs as the electrode material, which provides increased signal-
to-noise, allowing smaller changes in membrane potentials to be analysed over a longer time period.
Moreover, MEAs can be utilised as electrochemical detectors aiming at tracking the chemical signal
over a cell culture or tissue slice, an application that has barely been researched (Section 2.3.4.6). As
such, this chapter describes the fabrication and characterisation of a novel MEA using CNTs grown in
situ, with a view for use as a biochemical detector with higher sensitivity compared to conventional
materials, which will be discussed in subsequent chapters. Here, the complete fabrication procedure of
the MEA is conveyed including CNT growth on the patterned electrode area and oxygen plasma
functionalisation of those CNTs. The device layout was designed to be a replica of a commercial MEA
layout, allowing direct comparison between the custom CNT MEA and a state-of-the-art commercial
MEA. Following fabrication, the devices were characterised by various techniques including
microscopy, Raman spectroscopy and electrochemical impedance spectroscopy to investigate CNT
height, CNT type, integrity of substrate, etc. Additionally, the electrochemical impedance spectra of the

Chapter 5 Fabrication & Characterisation of CNT-Based MEAs
76
non-functionalised and functionalised CNTs is comprehensively compared to a commercially available
MEA, which has electroplated Pt as the electrode material with the same electrode geometric surface
area (Panasonic MED-P210A Probe™).
5.2. Device Production
Two MEA devices were fabricated by the procedure outlined in Figure 5.1. Firstly, 3” silicon wafers
with a 230 nm silicon dioxide layer were thoroughly cleaned following the substrate cleaning procedure
outlined in Section 3.1.1. This was followed by a photolithography step, where the photomask is
outlined by the blue areas in Figure 5.2, this step also included sample metallisation and lift-off (Section
3.1.2). The Ti was used to improve adhesion between the Pd and SiO2 substrate, Pd was chosen as the
main track metal for its relative oxidation resistance, high conducivity and high temperature resistance.
Figure 5.1: Schematic of the microelectrode array fabrication process discussed in Section 5.2. * represents
the bond-pad area for the electrode.
Following lift-off, the whole substrate was passivated (Fig. 5.1 – step 2) by RF-sputtering of a SiO2
target, producing a film of 250 nm thickness (Section 3.1.3). After passivation of the whole substrate,
a second round of photolithography was completed (Fig. 5.1 – step 3). The procedure was exactly the
same except the pattern of the mask was different (Fig. 5.2 – green areas).

Chapter 5 Fabrication & Characterisation of CNT-Based MEAs
77
Figure 5.2: Layout of MEA mask for photolithography purposes, blue areas are exposed to UV during the
first photolithography step (step 1, Figure 5.1). Blue areas are also underneath every green area in this
design, the blue areas are designed to provide the underlying tracking metal. The green areas are for the
second UV exposure (step 3, Figure 5.1).
This pattern exposed specific areas of the SiO2 upon development which were etched away in the
subsequent process, i.e. electrode areas and bond pad areas. The photolithographically defined
substrates were reactive-ion etched (Section 3.1.4), then bond pads areas were covered and the
substrates were metallised by DC sputtering of Al/Fe targets. This was followed by a lift-off procedure,
consequently producing 8 nm/2 nm (Al/Fe) on the electrode areas (Fig. 5.1 – step 4). Finally, CNTs
were grown on the substrates (Fig. 5.1 – step 5) using the PT-CVD method (Section 3.1.5).
Temperatures reached 641 ᵒC and 644 ᵒC according to the thermocouple, for the two MEA devices
produced, respectively (Fig. 5.3). Similar fabrication protocols, which are also MEMS-compatible, have
been proven to produce functioning CNT-based MEA devices.27,137,142 Here, the use of PT-CVD is
unique in reducing the substrate temperature to reduce the environmental stress on the device during
CNT growth.
After CNT growth and characterisation, one of the MEA devices was functionalised using an oxygen
plasma (Emitech K-1050X) generated at 0.15 Torr with 50 W for 12 seconds with an O2 flow of 15
sccm. The other MEA device was left non-functionalised for comparative purposes.
20 µm
50 mm
150 µm

Chapter 5 Fabrication & Characterisation of CNT-Based MEAs
78
Figure 5.3: Graph to demonstrate the change in temperature of the microelectrode array substrate(s) over the
CNT growth period. The microelectrode array that went on to be oxygen plasma functionalised is the black
line, and the microelectrode array that stayed non-functionalised is the red line. The continuous line is the
pyrometer recording (bottom of substrate) and the dotted line is the thermocouple recording (top of
substrate). * indicates the change from the annealing stage to the growth stage.
5.3. Device Characterisation
Characterisation of the CNT growth included SEM and optical microscopy (Leica DM2500 optical
microscope) to investigate presence of CNTs. Raman spectroscopy was employed to investigate
quality/type of CNTs, in addition to EIS to examine the electrode interfacial impedance. The Bode plot
which includes how phase and modulus impedance change with frequency, and the Nyquist plot which
indicates the relationship between the real and imaginary impedance, were obtained. All values showing
an error in this chapter are mean average ±standard error of mean.
5.3.1. Microscopy
Following fabrication of the MEA the device was characterised to reveal various aspects of the CNT
electrodes and the surrounding areas. Initially, SEM was used to determine the presence of CNTs on
the electrodes.
0 200 400 600 800 10000
100
200
300
400
500
600
700
Time [s]
Tem
per
atu
re [
ᵒC]
*
*

Chapter 5 Fabrication & Characterisation of CNT-Based MEAs
79
Figure 5.4: Images of microelectrode array after complete fabrication process. (a,b) SEM images of two
separate electrodes on the non-functionalised microelectrode array. (c) SEM image of an electrode after
oxygen plasma functionalisation. (d) Optical microscope image of the microelectrode array, black areas
indicate CNTs only present on electrodes and there is no sign of cracks/perturbations in the SiO2 passivation
layer after CNT growth.
Figure 5.4(a-b) shows two electrodes on the non-functionalised MEA device after the full fabrication
procedure. The images demonstrate the presence of short CNTs (≤1 µm) which appear ubiquitous across
the electrode area. The CNTs were slightly shorter than expected, however CVD-grown CNTs which
are short (≤2 µm) have been reported to be more practical for biological applications.137 This is primarily
because longer CNTs, whilst providing a higher surface area, are more easily removed from the
substrate by electrode cleaning procedures and interactions with biological samples e.g. brain slices.
Even though the CNTs were short, Figure 5.4(c) indicates that the oxygen plasma functionalisation step
did not remove the CNTs from the electrode. This is because the functionalisation time was kept short
to prevent etching the sp2 carbon structure, as discussed in Chapter 4 and the literature.176,177 Optical
microscopy (Fig. 5.4(d)) demonstrates black areas over the electrodes only, this indicates that the CNTs
grew solely where the catalyst was deposited, i.e. on the electrodes. Moreover, the image confirms that

Chapter 5 Fabrication & Characterisation of CNT-Based MEAs
80
no damage had occurred to the passivating SiO2 layer in response to the rapid heating and cooling
involved during CNT growth.
5.3.2. Raman Spectroscopy
Following the CNT growth step and initial application of microscopy techniques to confirm the
presence of CNTs, more information about the CNT quality, type and consistency across electrodes was
examined. Raman spectroscopy is a well characterised, non-destructive technique for assessing
nanocarbons, specifically CNTs in this case. The Raman spectra (Fig. 5.5(a-b)) shows the distinctive
peaks associated with CNTs, i.e. D peak at ~1340 cm-1, G peak at ~1590 cm-1 and 2D peak at ~ 2680
cm-1. In addition, the spectra also report the presence of radial breathing modes (RBM) (140 cm-1 to 280
cm-1), which will be discussed in more detail shortly.
Figure 5.5: Raman spectra of both microelectrode arrays before any post-growth treatment was measured
from five separate electrodes on each microelectrode array, Array I (a, c) and Array II (b, d). The graphs
illustrate the main peaks discussed in the text, i.e. radial breathing modes (RBM), D peak, G peak and 2D
peak. The response of both microelectrode arrays to the 514 nm wavelength laser is shown (a, b), in addition
to a magnified view of this response in the area of the D peak and G peak (c, d).
(a)
(c)
(b)
(d)
514 nm 514 nm
514 nm 514 nm
D D
D D
2D 2D
G G
GG
RBM RBM
1200 1400 1600 1800
0.0
0.2
0.4
0.6
0.8
1.0
Raman Shift [cm-1]
Inte
nsi
ty [
a.u
.]
1200 1400 1600 1800
0.0
0.2
0.4
0.6
0.8
1.0
Raman Shift [cm-1]
Inte
nsi
ty [
a.u
.]
500 1000 1500 2000 2500 3000 3500
0.0
0.2
0.4
0.6
0.8
1.0
Raman Shift [cm-1]
Inte
nsi
ty [
a.u
.]
500 1000 1500 2000 2500 3000 3500
0.0
0.2
0.4
0.6
0.8
1.0
Raman Shift [cm-1]
Inte
nsi
ty [
a.u
.]Array I Array II

Chapter 5 Fabrication & Characterisation of CNT-Based MEAs
81
Firstly, the ID/IG ratio can be calculated to give an indication of the quality of the CNTs. Figure 5.5(a-
b) illustrates the response of two separate MEA devices. The device in Figure 5.5(a), and Figure 5.5(c)
which is a magnified view of Figure 5.5(a), reported an ID/IG of 0.35 ±0.01 which indicates good
consistency between electrodes due to the low error. Moreover, the device in Figure 5.5(b), and Figure
5.5(d), which is a magnified view of Figure 5.5(b), revealed an ID/IG of 0.36 ±0.01, indicating
consistency between electrodes in terms of CNT quality. An ID/IG of 0.35 ±0.01 is among the best of
those reported in the literature for the PT-CVD method at a comparable temperature.23,26
Additionally, the ID/I2D is another important parameter to measure when characterising CNTs via Raman
spectroscopy, as it also provides information about the extent of graphitisation in the CNT structure.
The ID/I2D values for the two devices in Figure 5.5(a) and Figure 5.5(b) are 0.52 ±0.04 and 0.54 ±0.01,
respectively. Again the results show both consistency (difference is <5%) between electrodes in the
same device, and uniformity between the two devices. Additionally, these values broadly agree with
previous reports into growing CNTs via the PT-CVD method, however some variation would be
expected as the materials and layer thicknesses are not identical.26
Figure 5.6: Raman spectra specifically illustrating the radial breathing mode region for both CNT MEAs
prior to one being oxygen plasma functionalised (N=6 for both, spectra are overlaid). Peaks located between
140 cm-1 and 210 cm-1 represent semiconducting (SC) CNTs, those located between 210 cm-1 and 280 cm-1
represent metallic (M) CNTs.
The presence of RBM indicates that the CNTs are single-walled or few-walled CNTs, instead of multi-
walled CNTs.13,15 Moreover, when using the 514 nm wavelength laser for Raman spectroscopy this
provides information on the electrical types of CNT present i.e. semiconducting or metallic.23 Using
this information, peaks found between 140 cm-1 and 210 cm-1 are the response from semiconducting
CNTs, and peaks found between 210 cm-1 and 280 cm-1 demonstrate metallic CNTs. Figure 5.6(a-b)
demonstrates six different Raman spectra in the RBM area for both MEAs. In both, peaks are observed
in semiconducting (SC) and metallic (M) regions, yet the most prominent and larger peaks are found in
the metallic region, particularly at ~260 cm-1. This result would suggest that the CNTs grown in the
120 160 200 240 280
Raman Shift [cm-1]
Inte
nsi
ty [
a.u
.]
SC M
120 160 200 240 280
Raman Shift [cm-1]
Inte
nsi
ty [
a.u
.]
SC M(a) (b)

Chapter 5 Fabrication & Characterisation of CNT-Based MEAs
82
electrode areas of the MEA are a mixture of semiconducting and metallic single-walled to few-walled
CNTs, with metallic CNTs dominating. A higher percentage of metallic SWCNTs is consistent with
previously demonstrated results using PT-CVD growth at the relatively lower temperatures reported
here (<650 ᵒC) with the same acetylene/hydrogen ratio.23
After characterising the CNTs on both MEA devices via Raman spectroscopy, one of the devices (Array
I) was subjected to oxygen plasma functionalisation and then re-examined with Raman spectroscopy to
assess changes to the CNTs. Figure 5.7(a-b) shows the Raman spectra of the oxygen plasma
functionalised CNTs, and Figure 5.7(c-d) illustrates how the spectra has changed before (black line)
and after (red line) oxygen plasma functionalisation.
Figure 5.7: Raman spectra of functionalised microelectrode array I, the graphs illustrate the main peaks
discussed in the text, i.e. D peak, G peak and 2D peak. (a) Spectrum of five separate electrodes after
functionalisation and (b) magnified view of spectrum (a) focusing on D peak and G peak, indicating good
consistency between electrodes on the same microelectrode array. (c) Comparison of Raman spectra of the
same microelectrode array before (black line) and after (red line) oxygen plasma functionalisation. (d)
Magnified view of (c) indicating change in D peak and G peak due to oxygen plasma functionalisation.
As before, Figure 5.7(a) illustrates the consistency of the CNT quality across five electrodes as the
spectra closely overlap. Additionally, the D peak and G peak are magnified in Figure 5.7(b) and the
ID/IG ratio of the oxygen-plasma functionalised CNTs is 0.93 ±0.02, again demonstrating regularity
(a) (b)
(c) (d)
D D
2D
2D
G G
DG
D G
500 1000 1500 2000 2500 3000 3500
0.0
0.2
0.4
0.6
0.8
1.0
Raman Shift [cm-1]
Inte
nsi
ty [
a.u
.]
1200 1400 1600 1800
0.0
0.2
0.4
0.6
0.8
1.0
Raman Shift [cm-1]
Inte
nsi
ty [
a.u
.]
1200 1400 1600 1800
0.0
0.2
0.4
0.6
0.8
1.0
Raman Shift [cm-1]
Inte
nsi
ty [
a.u
.]
Pre-O2
Post-O2
500 1000 1500 2000 2500 3000 3500
0.0
0.2
0.4
0.6
0.8
1.0
Raman Shift [cm-1]
Inte
nsi
ty [
a.u
.]
Pre-O2
Post-O2

Chapter 5 Fabrication & Characterisation of CNT-Based MEAs
83
across the electrodes. The overall Raman spectra changed considerably after oxygen plasma
functionalisation, as shown in Figure 5.7(c), namely both the ID/IG and ID/I2D ratios increase
considerably from 0.35 ±0.01 to 0.93 ±0.02 and 0.54 ±0.01 to 2.87 ±0.04, respectively. Figure 5.7(d)
magnifies the D peak and G peak area and displays the alterations to the CNTs due to functionalisation.
Namely, an increase in the D peak intensity and area in addition to a broadening of the G peak, which
indicates a substantial increase in defects in the CNT structure.181,183 These defects in the sp2 carbon
structure are likely to be due to chemically bonded oxygen-containing functional groups, as indicated
by results in the previous chapter. These oxygen functional groups are important for this application as
they have been shown to reduce the electrochemical interfacial impedance of CNTs, in addition to
allowing discrimination between biomolecules due to electrostatic interactions.27,109
5.3.3. Electrochemical Impedance Spectroscopy
After establishing the presence of CNTs via microscopy and determining the CNT quality/type before
and after oxygen plasma functionalisation by Raman spectroscopy, the electrochemical impedance was
examined. This parameter is particularly important in bioelectrical (electrophysiological) detection
because of the relatively small currents associated with neuronal action potential firing.184 Here, three
separate devices were compared via EIS, first a commercially available MEA that has ITO underlying
tracking and electroplated Pt black (EP Pt) as the electrode material. Second, one novel MEA (Array
II) that has Pd underlying tracking and ‘non-functionalised’ CNTs as the electrode material, and third,
one novel MEA (Array I) that has Pd underlying tracking and oxygen plasma functionalised CNT
electrodes. For all MEAs tested a separated Bode plot and a Nyquist plot was produced. This allowed
analysis of how the modular impedance (|Z|) and phase changes with frequency (Bode plot).
Additionally, it permitted observation of the interaction between the real and imaginary components of
impedance (Nyquist plot), which in turn aids in understanding and producing an equivalent circuit
model for each MEA.
Initially, the commercial EP Pt MEA was examined and it was found that the response of the |Z| to
frequency was linear from 10-1 up to ~102 and 105 to 106 (Fig. 5.8(a)). Between 102 and 105 it was almost
frequency independent. This can be coupled to the phase response with frequency as where the response
was more resistive (particularly between 103 and 105) the |Z| was more frequency independent. This is
because the impedance in a resistor is not frequency dependent (Z=R), whereas the impedance in an
ideal capacitor, which is represented by a -90ᵒ phase response, is frequency dependent (Z=1/jωc) where
ω=radial frequency. The Nyquist plot (Fig. 5.8(c-d)) indicates the presence of two time constants (τ =
RC), as demonstrated by the observation of two semicircles,27 these will be discussed in detail shortly.

Chapter 5 Fabrication & Characterisation of CNT-Based MEAs
84
Figure 5.8: Electrochemical impedance spectra of commercial EP Pt microelectrode array. (a, b) Separated
Bode plot indicating how both |Z| and phase change with the applied frequency of signal. (c) Nyquist plot and
(d) magnified view of Nyquist plot indicating how the imaginary component of impedance (-Im(Z)) and real
component of impedance (Re(Z)) interact.
Next, the ‘non-functionalised’ CNT MEA was subjected to the same experimental protocol as the
commercial EP Pt electrode MEA (Fig. 5.9). Here, the results show a more linear relationship between
the |Z| and frequency for the majority of electrodes, compared to the commercial EP Pt MEA.
Additionally, the phase response to frequency is variable between electrodes, however there are
similarities between electrodes with two capacitive peaks at 100 Hz and ~104 Hz. The Nyquist plot for
the ‘non-functionalised’ CNT MEA does exhibit two time constants for most of the electrodes tested
(Fig. 5.9(c) for largest and Fig. 5.9(d) for smaller), this is again similar to the response from the
commercial EP Pt MEA.
(a) (b)
(c) (d)
0 1x10⁴
2x10⁴
3x10⁴
4x10⁴
0
1x10⁴
2x10⁴
3x10⁴
4x10⁴
Re(Z) [Ω]
-Im
(Z)
[Ω]
0 5x10⁶
1x10⁷
2x10⁷
0
3x10⁶
6x10⁶
9x10⁶
Re(Z) [Ω]
-Im
(Z)
[Ω]
10-1
100
101
102
103
104
105
106
0
10
20
30
40
50
60
70
80
90
Frequency [Hz]
-Ph
ase
[ᵒ]
10-1
100
101
102
103
104
105
106
102
103
104
105
106
107
Frequency [Hz]
|Im
ped
an
ce| [Ω
]

Chapter 5 Fabrication & Characterisation of CNT-Based MEAs
85
Figure 5.9: Electrochemical impedance spectra of non-functionalised CNT microelectrode array. (a, b)
Separated Bode plot indicating how both |Z| and phase change with the applied frequency of signal. (c)
Nyquist plot and (d) magnified view of Nyquist plot.
Finally, the same experimental protocol was exacted upon the functionalised CNT MEA, with the
production of a Bode plot and Nyquist plot (Fig. 5.10). Here, an almost completely linear relationship
is revealed between the |Z| and the frequency, apart from between 105 and 106 Hz where it is frequency
independent. The phase response with frequency indicates a more capacitive response overall from the
functionalised CNTs, as it remains >45ᵒ for the majority of the spectrum (Fig. 5.10(b)). As before, the
Nyquist plot exhibits two time constants for the functionalised CNT MEA, yet the two semicircles have
a larger separation, in terms of impedance, compared to the non-functionalised CNT MEA and the
commercial EP Pt MEA.
10-1
100
101
102
103
104
105
106
102
103
104
105
106
107
Frequency [Hz]
|Im
ped
an
ce| [Ω
]
0 1x10⁶
2x10⁶
3x10⁶
0.0
5.0x10⁵
1.0x10⁶
1.5x10⁶
2.0x10⁶
2.5x10⁶
Re(Z) [Ω]
-Im
(Z)
[Ω]
10-1
100
101
102
103
104
105
106
0
10
20
30
40
50
60
70
80
90
Frequency [Hz]
-Ph
ase
[ᵒ]
(a) (b)
(c) (d)
0 1x10⁵
2x10⁵
3x10⁵
0
1x10⁵
2x10⁵
3x10⁵
Re(Z) [Ω]
-Im
(Z)
[Ω]

Chapter 5 Fabrication & Characterisation of CNT-Based MEAs
86
Figure 5.10: Electrochemical impedance spectra of functionalised CNT microelectrode array. (a, b)
Separated Bode plot indicating how both |impedance| and phase change with the applied frequency of signal.
(c) Nyquist plot and (d) magnified view of Nyquist plot.
Figure 5.11 and Figure 5.12 provide a direct comparison by using a representative response from each
of the three MEAs tested, namely the commercial EP Pt, non-functionalised CNT and functionalised
CNT MEAs. The separated Bode plot (Fig. 5.11) indicates distinct differences between the responses,
the most notable of which is the lesser modular impedance of both CNT based electrodes at higher
frequencies (>103 Hz). This is particularly true for the functionalised CNTs which remain over an order
of magnitude smaller, in terms of |Z|, compared to the commercial EP Pt MEA between 103 Hz and 106
Hz. However, at impedances ≤102 Hz there was minimal difference between all MEAs, in terms of
interfacial impedance. This suggests that CNT electrodes, specifically oxygen plasma functionalised
CNT electrodes, may be beneficial for detection of biological signals generated/recorded at frequencies
>102 Hz, due to their relatively low interfacial impedance. This finding will be discussed in more detail
shortly as it is particularly interesting for bioelectrical signals, such as action potentials which have a
frequency of ~103 Hz.
10-1
100
101
102
103
104
105
106
0
10
20
30
40
50
60
70
80
90
Frequency [Hz]
-Ph
ase
[ᵒ
]
0 1x10⁶
2x10⁶
3x10⁶
4x10⁶
0
1x10⁶
2x10⁶
3x10⁶
4x10⁶
5x10⁶
6x10⁶
Re(Z) [Ω]
-Im
(Z)
[Ω]
10-1
100
101
102
103
104
105
106
102
103
104
105
106
107
Frequency [Hz]
|Im
ped
an
ce| [Ω
](a) (b)
(c) (d)
0 3x10²
6x10²
9x10²
0
3x10²
6x10²
9x10²
Re(Z) [Ω]
-Im
(Z)
[Ω]

Chapter 5 Fabrication & Characterisation of CNT-Based MEAs
87
Figure 5.11: Electrochemical impedance spectroscopy spectra, Bode plot ((a) and (b)) of all MEA types tested
i.e. commercial EP Pt (black), non-functionalised CNT (red) and functionalised CNT (blue).
Figure 5.12 demonstrates the response of all MEA types tested in the form of a Nyquist plot, allowing
observable comparisons to be made. The images illustrate the largest time constant (i.e. largest
semicircle) for every electrode (Fig. 5.12(a)), in addition to the smaller time constant for every
electrode. This begins with the non-functionalised CNT (Fig. 5.12(b)), followed by commercial EP Pt
(Fig. 5.12(c)), then the smallest time constant is recorded by the functionalised CNT (Fig. 5.12(d)).
There are a number of equivalent circuit models that can be used when there is an observation of two
time constants in the Nyquist plot, as has been detected for all three electrode types here. Literature
searches of similar electrode set-ups revealed a likely equivalent circuit model which is demonstrated
in Figure 5.13. This fitting is commonly used for insulating coatings covering metal electrodes, as if the
coating fails a gap/pore is created where the conductive solution can interact with the metal electrode
underneath the coating. These pores could reasonably be similar to the spaces between CNTs grown on
metal electrodes, hence the use of this equivalent circuit model.27,185–187 Here, Rs represents solution
resistance, which is in series with the time constant associated with the porosity (RpoCc) and the time
constant of the underlying metal electrode (RctCdl). Rpo is the pore resistance of the CNT or EP Pt, in
addition to the contact resistance between underlying metal and CNT or EP Pt. Cc is the capacitance of
the coating, which is the capacitance of the CNT or EP Pt in this equivalent circuit. The other time
constant represents the underlying electrode resistance (Rct) and the double layer capacitance of the
electrode (Cdl). Rpo illustrates the most dramatic decrease due to oxygen plasma functionalisation, this
reduction in resistance is most likely due to a change in wetting behaviour of the CNTs. Non-
functionalised CVD-grown CNTs are known to trap air between the CNTs in aqueous solutions, this is
due to their highly hydrophobic nature, and the trapped air will increase the interfacial impedance of
the CNT electrode.27,188 Upon functionalisation, which has been proven to dramatic improve the CNT
wetting with aqueous solutions (see Chapter 4), the pore resistance decreases dramatically. This is most
(a) (b)
10-1
100
101
102
103
104
105
106
102
103
104
105
106
107
EP Pt
nf-CNT
f-CNT
Frequency [Hz]
|Im
ped
an
ce| [Ω
]
10-1
100
101
102
103
104
105
106
0
10
20
30
40
50
60
70
80
90 EP Pt
nf-CNT
f-CNT
Frequency [Hz]
-Ph
ase
[ᵒ]

Chapter 5 Fabrication & Characterisation of CNT-Based MEAs
88
likely due to a substantially increased area of the CNT structure available to the solution, a similar
improvement due to oxygen plasma functionalisation has been reported previously.27
Figure 5.12: Nyquist plot of the response of all three MEA types, commercial EP Pt (black), non-
functionalised CNT (red), and functionalised CNT (blue). Graphs decrease in terms of scale from (a) down to
(d). (a) Illustrates the largest semicircle for every MEA, (b) shows smaller non-functionalised CNT
semicircle, (c) shows smaller EP Pt semicircle, and (d) shows smaller functionalised CNT semicircle.
Figure 5.13: Likely equivalent circuit model for the electrodes used here. Taken from 27.
0 1x10⁶
2x10⁶
3x10⁶
0
1x10⁶
2x10⁶
3x10⁶ nf-CNT
f-CNT
EP Pt
Re(Z) / Ω
-Im
(Z)
/ Ω
0 1x10⁵
2x10⁵
3x10⁵
0
1x10⁵
2x10⁵
3x10⁵
nf-CNT
f-CNT
EP Pt
Re(Z) / Ω
-Im
(Z)
/ Ω
Re(Z) [Ω]
-Im
(Z)
[Ω]
0 1x10⁴
2x10⁴
3x10⁴
4x10⁴
0
1x10⁴
2x10⁴
3x10⁴
4x10⁴
nf-CNT
f-CNT
EP Pt
Re(Z) [Ω]
-Im
(Z)
[Ω]
0 3x10²
6x10²
9x10²
0
3x10²
6x10²
9x10²
nf-CNT
f-CNT
EP Pt
(a)
(c) (d)
(b)

Chapter 5 Fabrication & Characterisation of CNT-Based MEAs
89
MEA Type Rs (Ω) Rpo (Ω) Cc (F) Rct (Ω) Cdl (F)
Commercial EP Pt n/a 1.97 ±0.29 x 10⁴ 5.11 ±0.41 x 10⁻¹¹ 1.06 ±0.19 x 10⁷ 7.52 ±1.4 x 10⁻⁸
Non-Functionalised
CNT n/a 4.05 ±0.55 x 10⁵ 8.96 ±0.78 x 10⁻⁹ 2.32 ±0.41 x 10⁶ 4.62 ±0.89 x 10⁻⁸
Functionalised
CNT n/a 2.4 ±0.07 x 10² 8.23 ±0.22 x 10⁻¹⁰ 2.25 ±0.49 x 10⁷ 9.11 ±1.58 x 10⁻⁸
Table 5.1: Equivalent circuit fitting values of a porous coated metal for all electrodes tested.
Another important value that can be extracted from the electrochemical impedance spectra is the
interfacial impedance (|Z|) at 1 kHz. As discussed previously this is the frequency of an action potential
firing in a neuron.189 Upon evaluation of the spectra the |Z| at 1 kHz for the commercial EP Pt MEA
was found to be 25.6 ±3.82 kΩ (N=8). A slight improvement was made using the non-functionalised
CNTs as a value of 20.4 ±2.5 kΩ (N=8) was recorded. Better still, the oxygen plasma functionalised
CNTs yielded a |Z| value at 1 kHz of 2.75 ±0.19 kΩ (N=8), an improvement of just under an order of
magnitude compared to the commercial EP Pt MEA with electrodes of the same geometric surface area.
Moreover, the value established for the oxygen plasma functionalised CNT MEA electrode compares
favourably with some of the best reported value of other MEAs in the literature.
Figure 5.14: Graphical representation of Table 5.2, illustrating the electrode interfacial impedance at 1 kHz
against geometric surface area for numerous literature and commercial MEAs. Here, the values for ‘this
work’ shown by green stars are for non-functionalised CNT (higher impedance – dashed orange circle) and
oxygen plasma functionalised CNT (lower impedance – solid orange circle).
101
102
103
104
105
106
101
102
103
104
105
106
107
Au
Pt
Pt Black
CNT
This Work
TiN
BDD
PEDOT-CNT
IrOx
Electrode Geometric Surface Area / µm2
|Im
ped
an
ce| a
t 1
kH
z /
Ω

Chapter 5 Fabrication & Characterisation of CNT-Based MEAs
90
This is demonstrated in Figure 5.14, which is a graphical representation of how the electrode interfacial
impedance at 1 kHz changes with geometric surface area for various materials recorded in the literature,
where generally the interfacial impedance increases with decreasing surface area. The figure also
demonstrates that nanomaterials, such as CNTs, show much lower interfacial impedance at the same
geometric surface area, compared to noble metal electrodes such as gold and platinum. In Figure 5.14,
the green star and blue circle enclosed by the dashed orange circle show the response of the non-
functionalised CNT and the commercial EP Pt MEA electrodes, respectively. These values generally
agree with others in the graph for Pt black and CNTs. The green star enclosed by the solid orange circle
is the response for the oxygen plasma functionalised CNTs, which gives one of the lowest values
available in the literature for an electrode of that geometric area.
5.4. Summary
This chapter reports a fabrication procedure for a PT-CVD grown CNT-based MEA, designed with
electrode areas capable of detecting signals from single cells with future experimental designs in mind.
This custom functionalised CNT-based MEA has illustrated improvement compared to other MEAs
reported in the literature, including CVD-grown CNT-based MEAs.27,137,130,141 Namely, the quality of
the CNTs grown on the patterned electrode areas was much better than previously attained, what’s more
is the maximum temperature used here was lower than other reports.27,141 This high quality CNT growth
with relatively lower temperatures using the PT-CVD process has been described in the literature on
numerous occasions,23,26,181,190 but its application to the production of a MEA device has not been
accomplished prior to this report. In addition to the high quality CNTs, the measured |Z| value at 1 kHz
for the functionalised CNT MEA electrodes is one of the lowest recorded when compared to the
reported data in the literature, for an electrode of its geometric surface area. The potential for reducing
the interfacial impedance further is noteworthy, as in electrophysiology the sampling rate can be
anywhere between 20 kHz and 100 kHz. If the impedance values at these frequencies were compared
then the functionalised CNT MEA demonstrates a 30 times improvement in impedance at 20 kHz (5.36
±0.13 x10² Ω vs. 1.64 ±0.20 x10⁴ Ω), and a 40 times improvement at 100 kHz (2.99 ±0.07 x10² Ω vs.
1.24 ±0.89 x10⁴ Ω), compared to the commercial EP Pt MEA. This reduction in interfacial impedance
is concurrent with an increase in defects in the CNT structure, demonstrated by an increase in the ID/IG
which is due to grafting of oxygen functional groups. Functionalisation of the CNT which results in the
disruption of the sp2 C=C bonding, similar to acid treated CNTs or plasma functionalised CNTs, usually
demonstrates an increase in solid-state resistance measurements. This is not the case here, with
electrochemical interfacial impedance, as the dramatic improvement in material wetting behaviour
outweighs the loss in conductivity of the CNT due to disruption of the sp2 C=C bonding. This low
electrochemical interfacial impedance value would likely aid in recording bioelectrical signals, which
are notoriously minute.2 Potentially, this interfacial impedance value could be decreased further still by

Chapter 5 Fabrication & Characterisation of CNT-Based MEAs
91
increasing the height of the CNTs, which will provide a larger actual surface area for interaction with
the solution. However, considering potential future biological applications the CNT height should
remain low, as even though higher surface area may reduce interfacial impedance the taller CNTs are
far more easily removed from the substrate.137 Following on from these results, the electrochemical
response of the functionalised CNT MEA will now be tested against the commercial EP Pt MEA.
Specifically, Chapter 6 will investigate the response to dopamine and determine the sensitivity and
selectivity of both MEAs for this vital neurotransmitter.

Chapter 5 Fabrication & Characterisation of CNT-Based MEAs
92
Electrode Material Geometric Electrode Area
(µm2)
|Z| at 1 kHz
(Ω) Ref.
Au 56.25 6.45 x10⁶ 191
Au 114 1.3 x10⁶ 27
Au 200 5 x10⁶ 192
Au 400 9.4 x10⁵ 193
Au 707 1.3 x10⁶ 136
Au 707 6.43 ± 2.21 x10⁵ 140
Au 2400 3.84 x10⁵ 194
Au 2500 3.35 x10⁵ 130
Au 6400 3.3 x10⁵ 195
Pt/Au coated Si 10 ~3 x10⁶ 196
Pt 900 5.5 x10⁵ 197
Pt 1100 1.5 x10⁵ 198
Pt 1257 4 x10⁶ 135
Pt 1257 2.2 x10⁵ 199
Pt 70686 1.4 x10⁴ 199
Pt Black 56.25 4.3 x10⁴ 191
Pt Black 200 5 x10⁴ 192
Electroplated Pt 900 3.8 x10⁴ 197
Pt Black 1257 7 x10⁴ 199
Pt Black 1600 1.35 x10⁴ 200
Pt black 4417 3.5 x10³ 201
Pt Black 70686 2 x10³ 199
TiN 707 3.65 ± 0.17 x10⁴ 140
As-Grown CNT 114 2.6 x10⁵ 27
As-Grown CNT 491 ~5 x10³ 142
As-Grown CNT 707 2.25 ± 0.19 x10³ 140
As-grown CNT 1257 2.5 x10⁴ 135
As-Grown CNT 2500 5.12 x10⁴ 130
As-grown CNT 5027 1 x10⁴ 138
O2 – Plasma CNT 114 7.94 x10⁴ 27
Steam Plasma f-CNT 2500 3.49 x10³ 130
PEDOT-MWCNT 707 1.2 x10⁴ 136
CNT-Au 400 3.8 x10⁴ 193
SWNT 1257 2.5 x10⁴ 199
MWCNT LbL 502 655 2.77 x10² 52
SWNT 70686 2.1 x10³ 199
CNT in flexible 1962.5 1.1 x10⁴ 144
All-MWCNT 10000 5.5 x10⁴ 147
Boron-doped Diamond 962 3.8 x10³ 145
ITO 2240 5.35 x10⁵ 194
Ir 2750 6 x10⁵ 202
W wire 4417 1.7 x10⁴ 201
PEDOT 502 655 3.96 x10² 52
IrOx 502 655 6.92 x10² 52
Table 5.2: Table to demonstrate the values of impedance at 1 kHz, as determined by electrochemical
impedance spectroscopy, for various materials of varying electrode surface area. These are the values
reported in Figure 5.14.

Chapter 6 Electrochemical Detection Using Oxygen Plasma Functionalised CNT MEA
93
Chapter 6 - Electrochemical Detection Using
Oxygen Plasma Functionalised CNT MEA
6.1. Introduction
This chapter focuses on the development of the fabricated functionalised CNT MEA as an
electrochemical sensor for the selective detection of dopamine. Dopamine is an important
neurotransmitter in the mammalian nervous system, it is involved with motivational emotional
responses and movement, amongst other complex behaviours.203 Concentrations of dopamine available
in the synaptic cleft have been measured to be in the range of <100 nM to 10 µM upon release from
vesicles in the presynaptic bulb.125,126 Electrochemical measurement of dopamine in biological systems
is challenging due to these relatively low concentrations. The difficulty is further enhanced by the
presence of interfering biomolecules, which are electrochemically oxidised at a similar potential, a
notable example is ascorbic acid. Ascorbic acid is present extracellularly in the mammalian brain at
concentrations far exceeding dopamine (up to 100 times higher during a dopamine release event).108
Ascorbic acid is also known to be oxidised electrochemically at the same or similar potentials to
dopamine, thus making dopamine concentration measurements problematic.125 The aim of this chapter
is to determine how the commercial EP Pt MEA, in comparison to the fabricated oxygen plasma
functionalised CNT MEA, responds to physiologically relevant concentrations of both dopamine and
ascorbic acid at ~pH 7.4. We expect the charge associated with the molecules at pH 7.4 to allow some
selectivity using the functionalised CNT MEA. This is due to dopamine being positively charged (pKa
= 8.9) and ascorbic acid being negatively charged (pKa = 4.1). Thus, there is likely to be electrostatic
attraction and repulsion, respectively, with the functionalised CNT MEA which has a negative charge
due to its oxygen functionality.
6.2. Solution & Equipment Preparation
Solutions were prepared and maintained according to Section 3.2.7., following this electrochemical
testing was performed on both the oxygen plasma functionalised CNT MEA and the commercial EP Pt
MEA. This testing involved voltammetric analysis of solutions containing potassium ferricyanide,
dopamine, or ascorbic acid at various concentrations. The voltammetric techniques used were cyclic
voltammetry and differential pulse voltammetry (Section 3.2.8. and 3.2.9.) in order to investigate
electrode/electrolyte interface phenomena and electrode sensitivity, respectively.

Chapter 6 Electrochemical Detection Using Oxygen Plasma Functionalised CNT MEA
94
6.3. Potassium Ferricyanide Electrochemistry
6.3.1. Cyclic Voltammetry
Initially, cyclic voltammetry was performed using a commonly used electroactive analyte to assess the
electrochemical response of both MEAs (commercial EP Pt and functionalised CNT). This electroactive
analyte was potassium ferricyanide which is a well-known molecule that is redox active via an inner-
sphere reaction, eliciting a one-electron oxidation or reduction.204 The response of both MEAs to 1 mM
potassium ferricyanide at varying scan rates is shown in Figure 6.1, with oxidation and reduction peaks
apparent and the peak current increasing with increasing scan rates, as would be expected. Parameters
such as the peak potential difference (Eq. 6.1) and the formal reduction potential (Eq. 6.2) can aid in
understanding the electrochemical system.
∆𝐸𝑝 = 𝐸𝑝𝑎 − 𝐸𝑝𝑐 Eq. 6.1
𝐸°′ = 𝐸𝑝𝑎 + 𝐸𝑝𝑐
2 Eq. 6.2
In these equations ΔEp represents peak potential difference, Eᵒ’ is the formal reduction potential, Epa is
the anodic peak potential (oxidation of molecule), and Epc is the cathodic peak potential (reduction of
molecule). The peak potential difference can help to determine the electrochemical reversibility of the
electroactive species at the particular electrode, the smaller the peak potential difference the higher the
reversibility at the electrode (i.e. the electrochemical rate of oxidation/reduction). Ideally, the peak
potential difference is equal to 59 mV divided by n where n is the number of electrons transferred in
the reaction, which for potassium ferricyanide is one electron. Here, for the commercial EP Pt MEA the
Epa was +246 mV and the Epc was +187 mV, producing a ΔEp equal to 59 mV indicating ideal
reversibility with this molecule at this electrode. The functionalised CNT MEA produced an Epa of +308
mV and a Epc of +67 mV, generating a ΔEp equal to 241 mV, thus indicating slower charge transfer
kinetics between this electrode and the potassium ferricyanide compared to the commercial EP Pt MEA.
Additionally, the formal reduction potential (Eᵒ’) can be determined from these values (Eq. 6.2), with
a Eᵒ’ equal to +217 mV for the commercial EP Pt MEA and +188 mV for the functionalised CNT MEA.
This indicates the overpotential necessary for redox reactions of potassium ferricyanide is slightly lower
at the functionalised CNT MEA compared to the commercial EP Pt MEA. Potassium ferricyanide has
a net negative charge on the molecule due to the presence of the cyanide ligands, as the functionalised
CNT MEA also has a net negative charge due to its oxygen functionality, this may explain the slow
electrochemical transfer rates at the electrode due to electrostatic repulsion.

Chapter 6 Electrochemical Detection Using Oxygen Plasma Functionalised CNT MEA
95
Figure 6.1: Cyclic voltammetry response to potassium ferricyanide (1 mM) in 0.5M KNO3 using (a)
commercial EP Pt electrode, and (b) functionalised CNT MEA.
Following these results which indicate that both electrodes are capable of producing electrochemical
responses using a standard system (potassium ferricyanide), experiments on dopamine and its common
electrochemical interferents were undertaken.
6.4. Dopamine Detection
6.4.1. Cyclic Voltammetry
The response to dopamine of both MEAs, commercial EP Pt and fabricated functionalised CNT, was
measured by cyclic voltammetry via two methodologies. These are separate experiments, the first
involves maintaining a constant concentration of dopamine and varying the scan rate, and then the
second involves maintaining a constant scan rate and varying the dopamine concentration. Figure 6.2
demonstrates the response of the commercial EP Pt MEA (Fig. 6.2(a)) and the functionalised CNT
MEA (Fig. 6.2(d)) to 50 µM dopamine with varying scan rates from 20 mV/s up to 100 mV/s in 10
mV/s steps.
Using Figure 6.2 the peak potential difference (ΔEp), and formal reduction potential (Eᵒ’), for dopamine
can be determined (Eq. 6.1 & Eq. 6.2). As the dopamine redox reaction is a two-electron process the
peak potential difference should ideally be 30 mV. Here, the commercial EP Pt MEA reported a ΔEp =
103 mV, and Eᵒ’ = +130 mV. The functionalised CNT MEA recorded a ΔEp = 200 mV, and Eᵒ’ = +169
mV. This result indicates that neither electrode exhibits ideal electrochemical reversibility, with the
ideal rarely obtained experimentally for many electrode types. The electrochemical reversibility appears
to be higher at the commercial EP Pt MEA compared to the functionalised CNT MEA for dopamine,
which indicates faster charge transfer kinetics at the commercial EP Pt MEA. Moreover, the commercial
Potential [V (vs. Ag/AgCl)]
Cu
rren
t [n
A]
20
↓
100
mV/s
-0.1 0.0 0.1 0.2 0.3 0.4 0.5
-30
-20
-10
0
10(a) (b)
Potential [V (vs. Ag/AgCl)]
Cu
rren
t [µ
A]
20
↓
100
mV/s
-0.1 0.0 0.1 0.2 0.3 0.4 0.5
-20
-15
-10
-5
0
5
10

Chapter 6 Electrochemical Detection Using Oxygen Plasma Functionalised CNT MEA
96
EP Pt MEA demonstrates a lower formal reduction potential, indicating a low overpotential needed to
oxidise dopamine.
Figure 6.2: Response to 50 µM dopamine of (a) commercial EP Pt MEA and (d) functionalised CNT MEA,
over a range of scan rates from 20 mV/s up to 100 mV/s in 10 mV/s steps.
With both MEAs the peak current increases with increasing scan rate. Investigating whether this
increase is linearly proportional with scan rate or the [scan rate]1/2 can allow determination of the
mechanism of charge transfer between electrode and dopamine in solution. For the commercial EP Pt
-0.1 0.0 0.1 0.2 0.3 0.4 0.5
-4
-2
0
2
4
Potential [V (vs. Ag/AgCl)]
Cu
rren
t [n
A]
100
↑
20
mV/s
-0.1 0.0 0.1 0.2 0.3 0.4 0.5
-0.1
0.0
0.1
0.2
0.3
0.4
Potential [V (vs. Ag/AgCl)]
Cu
rren
t [µ
A]
100
↑
20
mV/s
4 5 6 7 8 9 10
0.4
0.5
0.6
0.7
0.8
0.9
Scan Rate1/2 [mV1/2]
-P
eak
Cu
rren
t [n
A]
20 40 60 80 100
0.4
0.5
0.6
0.7
0.8
0.9
Scan Rate [mV]
-P
eak
Cu
rren
t [n
A]
4 5 6 7 8 9 10
0.17
0.18
0.19
0.20
0.21
Scan Rate1/2 [mV1/2]
-P
eak
Cu
rren
t [µ
A]
20 40 60 80 100
0.17
0.18
0.19
0.20
0.21
Scan Rate [mV]
-P
eak
Cu
rren
t [µ
A]
(a)(b)
(c)
(e)
(f)
(d)

Chapter 6 Electrochemical Detection Using Oxygen Plasma Functionalised CNT MEA
97
MEA a graph of the cathodic peak current, determined from the reverse scan, is plotted against both
[scan rate]1/2 (Fig. 6.2(b)) and scan rate (Fig. 6.2(c)). A linear response using the scan rate is recorded
over the entire range, this is in contrast to scan rate1/2, indicating that the process is adsorption based
instead of diffusion based.112 The same response is generated by the functionalised CNT MEA, where
the response is linear with the scan rate but not with the [scan rate]1/2, again indicating an adsorption
mechanism instead of diffusion. Electrochemistry involving dopamine, which is an inner sphere
reaction, is generally reported to be adsorption based particularly when using carbon based
electrodes.205 As stated previously, the response of the electrode to varying dopamine concentration
using a constant scan rate of 100 mV/s was also investigated in order to obtain a sensitivity value using
this technique.
Figure 6.3: Cyclic voltammograms showing the response of both (a) commercial EP Pt MEA and (c)
functionalised CNT MEA to various dopamine concentrations. (a) CV measurement of PBS (black line), 10
µM, 20 µM, 30 µM, 40 µM, 50 µM and 100 µM of dopamine using the commercial EP Pt MEA at 100 mV/s.
(b) Relationship between peak current and concentration of dopamine using commercial EP Pt MEA, anodic
response (black) y=0.0086x+0.1938 with R2 = 0.98, cathodic response (blue) y=-0.0076x-0.5106 with R2 =
0.96. (c) CV measurement of PBS (black line), 1 µM, 10 µM, 20 µM, 30 µM, 40 µM, 50 µM and 100 µM of
dopamine using the functionalised CNT MEA at 100 mV/s. (d) Relationship between peak current and
concentration of dopamine using functionalised CNT electrode, anodic response (black) y=0.0074x-0.0183
with R2 = 0.99, cathodic response (blue) y=-0.0035x-0.0049 with R2 = 0.99.
30 60 90
-1.5
-1.0
-0.5
0.0
0.5
1.0
1.5
C
urr
ent
[nA
]
ipa
ipc
Concentration [µM]
30 60 90
-0.8
-0.6
-0.4
-0.2
0.0
0.2
0.4
0.6
0.8
Cu
rren
t [µ
A]
ipa
ipc
Concentration [µM]Potential [V (vs. Ag/AgCl)]
Cu
rren
t [µ
A]
-0.1 0.0 0.1 0.2 0.3 0.4 0.5-0.2
0.0
0.2
0.4
0.6
0.8
100 µM
↑
1 µM
Potential [V (vs. Ag/AgCl)]
Cu
rren
t [n
A]
-0.1 0.0 0.1 0.2 0.3 0.4 0.5
-6
-4
-2
0
2
4
6
100 µM
↑
10 µM
(a) (b)
(c) (d)

Chapter 6 Electrochemical Detection Using Oxygen Plasma Functionalised CNT MEA
98
Figure 6.3(a) demonstrates the response of the commercial EP Pt MEA to various concentrations of
dopamine, from 10 µM up to 100 µM. The oxidation and reduction peak currents were then measured
using NOVA 1.11 software analysis and a plot of dopamine concentration vs. peak current was obtained
(Fig. 6.3(b)). Both anodic and cathodic responses are linear, with sensitivity values of 8.6 pA µM-1 and
7.6 pA µM-1, respectively.
The same experiment was performed on the functionalised CNT MEA, however this time the
concentration range displayed is from 1 µM up to 100 µM (Fig. 6.3(c)). The difference is due to the
functionalised CNT MEA displaying measurable anodic and cathodic peaks in response to 1 µM
dopamine, whereas the commercial EP Pt MEA did not. Again, a plot of dopamine concentration vs.
peak current was obtained and this response was also seen to be linear (Fig. 6.3(d)). The anodic
sensitivity was 7.4 nA µM-1 and the cathodic sensitivity was 3.5 nA µM-1, this is an increase in
sensitivity of ~860 times and ~460 times for the anodic and cathodic peak currents, respectively,
compared to the commercial EP Pt MEA. Even though the functionalised CNT MEA displayed a
substantial increase in sensitivity and observable detection limit compared to the commercial EP Pt
MEA, the resolvable limit was 1 µM. This limit needs improvement as many dopamine synaptic release
events in the mammalian central nervous system involve sub-µM concentrations.117,125
6.4.2. Differential Pulse Voltammetry
The need for improvement of the observable dopamine concentration resolution limit resulted in
investigating various concentrations of dopamine using differential pulse voltammetry. Differential
pulse voltammetry provides an improved sensitivity compared to cyclic voltammetry and is regularly
used as an electrochemical biosensor technique (Table 6.1). Figure 6.4 illustrates the response of the
commercial EP Pt MEA to various concentrations of dopamine ranging from 0.2 µM to 50 µM. Three
measurements of each concentration were taken and mean averaged to assign each dopamine
concentration a peak current value, the peak position i.e. the oxidation potential, was calculated to be
+0.13 V. From observing the spectra and using the NOVA 1.11 software analysis the lowest
concentration of dopamine which produces a measureable response, using the commercial EP Pt MEA,
is 1 µM. In addition, after plotting the concentration of dopamine against its respective peak current
value (Fig. 6.6(b)), a sensitivity value for dopamine of 8.3 x10⁻² nA µM-1 was obtained for the
commercial EP Pt MEA over a range of 1 µM up to 10 µM.

Chapter 6 Electrochemical Detection Using Oxygen Plasma Functionalised CNT MEA
99
Figure 6.4: Differential pulse voltammograms demonstrating the response of the commercial EP Pt MEA to
various concentrations of dopamine, the response of one electrode was tested three times. (a, b, c) Response
of the electrode to PBS (black line), 0.2 µM, 0.4 µM, 0.6 µM, 0.8 µM, 1 µM, 2 µM, 5 µM, 10 µM, 50 µM.
Following on from this experiment, the functionalised CNT MEA response to the same concentrations
of dopamine was investigated. Figure 6.5, which shows three measurements but each of these three
measurements is split into two figures for scaling purposes, illustrates the response of the functionalised
CNT MEA to dopamine concentrations ranging from 0.2 µM up to 50 µM. An oxidation potential of
+0.15 V is reported by this electrode and the lowest observable concentration of dopamine is 0.6 µM,
an improvement from 1 µM using the commercial EP Pt MEA. Moreover, if the concentration of
dopamine is plotted against its respective peak current value as before, the functionalised CNT MEA
demonstrates a response of 3.79 nA µM-1. This is an increase in sensitivity of 45 times compared to the
commercial EP Pt MEA (Fig. 6.6(a)).
0.0 0.1 0.2 0.3 0.45
6
7
8
9
10
Potential [V (vs. Ag/AgCl)]
Cu
rren
t [n
A]
50 µM
↑
0.2 µM
0.0 0.1 0.2 0.3 0.4
5
6
7
8
9
10
11
12
Potential [V (vs. Ag/AgCl)]
Cu
rren
t [n
A]
50 µM
↑
0.2 µM
(a)
(c)
(b)
0.0 0.1 0.2 0.3 0.4
6
7
8
9
10
11
Potential [V (vs. Ag/AgCl)]
Cu
rren
t [n
A]
50 µM
↑
0.2 µM

Chapter 6 Electrochemical Detection Using Oxygen Plasma Functionalised CNT MEA
100
Figure 6.5: Differential pulse voltammograms demonstrating the response of the functionalised CNT MEA to
various concentrations of dopamine. The response of one electrode was tested three times and each test time
has two voltammograms (a & b), (c & d), (e & f). (a, c, e) response of the electrode to PBS (black line), 1 µM,
2 µM, 5 µM, 10 µM, 50 µM. (b, d, f) response of the electrode to PBS (black line), 0.2 µM, 0.4 µM, 0.6 µM,
0.8 µM, 1 µM, 2 µM, 5 µM, 10 µM.
0.0 0.1 0.2 0.3 0.4
60
70
80
90
100
110
120
Potential [V (vs. Ag/AgCl)]
Cu
rren
t [n
A]
10 µM
↑
0.2 µM
0.0 0.1 0.2 0.3 0.4
60
70
80
90
100
110
120
Potential [V (vs. Ag/AgCl)]
Cu
rren
t [n
A]
10 µM
↑
0.2 µM
0.0 0.1 0.2 0.3 0.4
80
120
160
200
240
280
320
Potential [V (vs. Ag/AgCl)]
Cu
rren
t [n
A]
50 µM
↑
1 µM
0.0 0.1 0.2 0.3 0.440
80
120
160
200
240
280
320
Potential [V (vs. Ag/AgCl)]
Cu
rren
t [n
A]
50 µM
↑
1 µM
0.0 0.1 0.2 0.3 0.4
40
50
60
70
80
90
Potential [V (vs. Ag/AgCl)]
Cu
rren
t [n
A]
10 µM
↑
0.2 µM
0.0 0.1 0.2 0.3 0.4
40
80
120
160
200
240
280
Potential [V (vs. Ag/AgCl)]
Cu
rren
t [n
A]
50 µM
↑
1 µM
(a)
(c)
(e)
(b)
(d)
(f)

Chapter 6 Electrochemical Detection Using Oxygen Plasma Functionalised CNT MEA
101
Figure 6.6: Graph to illustrate the sensitivity of both MEAs to varying dopamine concentrations using
differential pulse voltammetry (DPV). (a) Graph illustrates how DPV peak current changes linearly with
dopamine concentration for both functionalised CNT MEA (black) and commercial EP Pt MEA (blue).
Functionalised CNT MEA reports y=3.79x-0.78 with R2 = 0.99, commercial EP Pt reports y=0.08x-0.05 with
R2 = 0.99. (b) Enlarged view of commercial EP Pt MEA response shown on graph (a).
This sensitivity value is also analysed against reports available in the literature to determine its ability
to compete with other fabricated electrodes. Table 6.1 provides an overview of the sensitivities of
dopamine sensors available in the literature. As noted the electrode sizes vary immensely, making direct
sensitivity comparison unfair. Thus, the sensitivity density is calculated, i.e. sensitivity per area (µA
µM-1 mm-2), to allow accurate comparison of devices. It must be noted that there are a number of other
reports into dopamine detection which were not able to be included. This is because information on
electrode area and/or sensitivity was not disclosed and therefore no direct comparison could be made
(e.g. bottom four reports in Table 6.1). Table 6.1 indicates that the sensitivity densities recorded for the
functionalised CNT MEA compare favourably with those reported in the literature. In fact, only one
report demonstrated a higher sensitivity density than this novel functionalised CNT MEA. The report
that recorded a sensitivity density of 26.5 µA µM-1 mm-2 used a molecularly imprinted polymer system
that required a six minute accumulation time before measurements. Therefore, whilst the sensitivity
density is impressive, its application would most likely be limited to offline detection (i.e. serum
samples taken from subjects) as measurements in vivo and in vitro need to be made within seconds of
dopamine release from synapses.
Cu
rren
t [n
A]
Concentration [µM]
f-CNT
EP Pt
0 2 4 6 8 100
10
20
30
40(a) (b)
Cu
rren
t [n
A]
Concentration [µM]
0 2 4 6 8 100.0
0.2
0.4
0.6
0.8
1.0

Chapter 6 Electrochemical Detection Using Oxygen Plasma Functionalised CNT MEA
102
Electrode Technique Electrode area
(mm2) Sensitivity (µA µM-1)
Sensitivity/Area (µA µM-1 mm-2)
LOD (nM)
Ref.
SDS-MWNT DPV 7.1 0.148 2.08 x10⁻² 3.75 x10³ 44
AuNP CPA 4.91 x10⁻⁴ 1.15 x10⁻⁵ 2.34 x10⁻² 10 83
Laccase-MWNT DPV 7.1 0.61 8.59 x10⁻² 400 118
rGO MEA Sensor DPV 0.017 1.91 x10⁻³ 0.11 260 206
EC rGO DPV 3.14 0.482 0.15 500 111
PEDOT DPV 4.91 x10⁻⁴ 9 x10⁻⁵ 0.18 1000 207
EP Pt DPV 4 x10⁻⁴ 8.3 x10⁻⁵ 0.21 770 This Work
MIP-PPy DPV 6 1.33 0.22 8.3 x10⁻³ 208
Nano-Cu/MWNT CV ≥12.6 3.786 0.3 50 112
CNT Paste DPV 0.79 0.26 0.33 500 209
PEDOT-CNT DPV 4.91 x10⁻⁴ 1.8 x10⁻⁴ 0.37 500 207
Partially-EC rGO SWV 7.1 3.33 0.47 20 110
PPy-Gr CPA 3.14 x10⁻⁴ 1.61 x10⁻⁴ 0.51 4 163
DHP-MWNT DPV 7.1 11.33 1.6 11 107
Tyrosinase-CeO2/ TiO2
CPA 7.854 x10⁻³ 1.42 x10⁻² 1.81 1 58
MWCNT CV 5.03 x10⁻³ 1.9 x10⁻² 3.78 1000 131
Acid f-MWNT DPV 0.78 5 6.41 200 108
RuO2-MWNT DPV 9 83.8 9.31 60 113
f-FWCNT DPV 4 x10⁻⁴ 3.79 x10⁻³ 9.48 7 This Work
MIP-Gr-Chit DPV 7.1 188 26.5 0.01 116
MIP DPV - 0.14 - 130 115
GO DPV - 0.55 - 270 109
ZrO2-rGO DPV - 4.01 - 100 114
CNT nanoweb DPV - 14.69 - 1000 210
Table 6.1: An overview of reports investigating the sensitivity of the fabricated sensor to dopamine.
Specifically illustrating the sensitivity density of the electrodes and how the reported value in this report is
highly competitive with those found in the literature. The reports are listed from lowest sensitivity density to
highest, with the addition of reports which do not specify an electrode area and thus cannot be compared.
For technique, DPV – differential pulse voltammetry, CPA – constant potential amperometry, CV – cyclic
voltammetry, and SWV – square wave voltammetry.

Chapter 6 Electrochemical Detection Using Oxygen Plasma Functionalised CNT MEA
103
6.4.3. Limit of Detection
The theoretical limit of detection (LOD) was calculated for each electrode to allow comparison to other
electrode types in the literature. This value is the equivalent of three times the signal-to-noise ratio and
is determined by Eq. 6.3, where Sb is the relative standard deviation (RSD) of the electrode response in
the control solution (PBS here) and m is the slope of the linear calibration plot for the redox species of
interest (dopamine in this case).58
𝐿𝑂𝐷 = 3𝑆𝑏 𝑚⁄ Eq. 6.3
Here, five measurements of the blank solution were taken for each MEA type, commercial EP Pt (Fig.
6.7(a)) and functionalised CNT (Fig. 6.7(b)). The RSD of the commercial EP Pt MEA was determined
to be 2.1 x10⁻² nA, the linear calibration plot for the dopamine response was 8.3 x10⁻² nA µM-1, thus
the LOD for the commercial EP Pt MEA was found to be 770 nM. Using the same approach, the RSD
of the functionalised CNT MEA was determined to be 8 x10⁻³ nA, the linear calibration plot for the
dopamine response was 3.79 nA µM-1, thus the LOD for the functionalised CNT MEA was found to be
6.71 nM. This is roughly an improvement of 115-fold using the functionalised CNT MEA compared to
the commercial EP Pt MEA.
Figure 6.7: Repeat measurements (N=5) of PBS using (a) commercial EP Pt MEA and (b) functionalised
CNT MEA. RSD were obtained for each electrode for limit of detection calculations.
6.4.4. Repeatability
Consistency in terms of measurement of dopamine concentration by MEAs is important, and therefore
each MEA was subjected to repeat measurements of 10 µM dopamine (Fig. 6.8(a-b)) to determine errors
in the measurements. This particular concentration was chosen as it is near physiological range and is
detectable for both MEA types. The electrodes were rinsed twice with ultrapure water (18.2 MΩ)
between runs and were allowed a three minute ‘settling’ time before each measurement to ensure
(a) (b)
-0.1 0.0 0.1 0.2 0.3 0.4 0.5
4
6
8
10
Potential [V (vs. Ag/AgCl)]
Cu
rren
t [n
A]
-0.1 0.0 0.1 0.2 0.3 0.4 0.5
40
60
80
100
Potential [V (vs. Ag/AgCl)]
Cu
rren
t [n
A]

Chapter 6 Electrochemical Detection Using Oxygen Plasma Functionalised CNT MEA
104
evenness. The peak currents were calculated for each run (N=10 for each), then the mean and the
standard deviation for the response was computed. From this the RSD for the response to 10 µM
dopamine for each MEA was determined, this value can give an indication of the consistency (precision)
for measuring near physiological concentrations of dopamine for both MEAs. The commercial EP Pt
MEA recorded a mean of 0.13 nA with a standard deviation of 0.05 nA resulting in a RSD of 40%. The
functionalised CNT electrode recorded a mean response of 49.8 nA with a SD of 1.45 nA resulting in a
RSD of 3%. This result indicates a high degree of repeatability when using the functionalised CNT
MEA for dopamine detection that appears to be far superior compared to the commercially available
EP Pt MEA.
Figure 6.8: Differential pulse voltammograms of (a) commercial EP Pt MEA and (b) functionalised CNT
MEA, both showing repeated measurements (N=10) of 10 µM dopamine. PBS is the black line in both and
graphs have been processed so that the peak height is the same for each run.
6.5. Ascorbic Acid Detection
6.5.1. Cyclic Voltammetry
Similar to investigations into the response of both MEAs to dopamine, the response to ascorbic acid
was measured in two ways. Firstly, the response to ascorbic acid by both MEAs was determined by
varying the scan rate at a fixed concentration of 100 µM. Secondly, the response was examined by
varying the concentration of ascorbic acid at a fixed scan rate of 100 mV/s.
Figure 6.9(a) demonstrates the response of the commercial EP Pt MEA to 100 µM ascorbic acid over a
range of scan rates from 20 mV/s to 100 mV/s, increased in 10 mV/s steps. No discernible oxidation or
reduction peaks are observed over the scanned potential window for any scan rate used here. In contrast,
the functionalised CNT MEA reports a more substantial response to 100 µM in the same potential
window (Fig. 6.9(b)). Again, no recognisable oxidation peak is present in the scanned potential window,
-0.1 0.0 0.1 0.2 0.3 0.4 0.5
40
60
80
100
Potential [V (vs. Ag/AgCl)]
Cu
rren
t [n
A]
(a) (b)
0.0 0.1 0.2 0.3 0.43
4
5
6
7
Potential [V (vs. Ag/AgCl)]
Cu
rren
t [n
A]

Chapter 6 Electrochemical Detection Using Oxygen Plasma Functionalised CNT MEA
105
however the substantial increase in current in the forward scan from +0.25 V to +0.5 V indicates
oxidation of the ascorbic acid.
Figure 6.9: Voltammetric response of (a) commercial EP Pt MEA and (b) functionalised CNT MEA to 100
µM ascorbic acid using scan rates of 20 mV/s up to 100 mV/s, in 10 mV/s increments.
The commercial EP Pt MEA did not display any oxidation or reduction peak as the concentration of
ascorbic acid increased (Fig. 6.10(a)). Although an increase in current is seen with increasing ascorbic
acid concentration in the forward scan from ~+0.1 V to +0.5 V, there is no recognisable oxidation peak
present. This may be because the concentration of ascorbic acid is not high enough to register a peak,
or the oxidation potential is higher than the potential window scanned here. Figure 6.10(b) demonstrates
that the functionalised CNT MEA displays a considerable increase in anodic current in response to
increasing concentrations of ascorbic acid, even though no distinct oxidation or reduction peaks are
discernible. As has been stated, an increase of this magnitude was not observed with the commercial
EP Pt MEA.
Figure 6.10: Voltammetric response of (a) commercial EP Pt MEA and (b) functionalised CNT MEA to PBS
(black line) and various concentrations of ascorbic acid (100 µM, 200 µM, 400 µM and 500 µM).
(a) (b)
Potential [V (vs. Ag/AgCl)]
Cu
rren
t [n
A]
20
↓
100
mV/s
-0.1 0.0 0.1 0.2 0.3 0.4 0.5
-8
-6
-4
-2
0
2
4
-0.1 0.0 0.1 0.2 0.3 0.4 0.5-200
0
200
400
600
Potential [V (vs. Ag/AgCl)]
Cu
rren
t [n
A]
100
↓
20
mV/s
-0.1 0.0 0.1 0.2 0.3 0.4 0.5-12
-9
-6
-3
0
3
6
Potential [V (vs. Ag/AgCl)]
Cu
rren
t [n
A]
500 µM
↑
100 µM
-0.1 0.0 0.1 0.2 0.3 0.4 0.5-0.5
0.0
0.5
1.0
1.5
2.0
2.5
Potential [V (vs. Ag/AgCl)]
Cu
rren
t [µ
A]
500 µM
↑
100 µM
(a) (b)

Chapter 6 Electrochemical Detection Using Oxygen Plasma Functionalised CNT MEA
106
6.5.2. Differential Pulse Voltammetry
Differential pulse voltammetry was performed to confirm the response of both electrodes to ascorbic
acid, i.e. a diminished response by the commercial EP Pt MEA and a substantial response by the
functionalised CNT MEA.
Figure 6.11: Differential pulse voltammograms of response to various concentrations of ascorbic acid. (a, c,
e) Responses of one commercial EP Pt electrode, (b, d, f) Responses of one functionalised CNT electrode, to
PBS (black line), 100 µM, 200 µM, 300 µM, 400 µM, 500 µM ascorbic acid.
0.0 0.1 0.2 0.3 0.4 0.50.0
0.1
0.2
0.3
0.4
0.5
0.6
0.7
Potential [V (vs. Ag/AgCl)]
Cu
rren
t [µ
A]
500 µM
↑
100 µM
(a)
(c)
(e)
(b)
(d)
(f)
0.0 0.1 0.2 0.3 0.4 0.50.0
0.1
0.2
0.3
0.4
0.5
0.6
0.7
Potential [V (vs. Ag/AgCl)]
Cu
rren
t [µ
A]
500 µM
↑
100 µM
0.0 0.1 0.2 0.3 0.4 0.50.0
0.1
0.2
0.3
0.4
0.5
0.6
0.7
Potential [V (vs. Ag/AgCl)]
Cu
rren
t [µ
A]
500 µM
↑
100 µM
0.0 0.1 0.2 0.3 0.4 0.5
3
4
5
6
7
8
9
Potential [V (vs. Ag/AgCl)]
Cu
rren
t [n
A]
500 µM
↑
100 µM
Potential [V (vs. Ag/AgCl)]
Cu
rren
t [n
A]
500 µM
↑
100 µM
0.0 0.1 0.2 0.3 0.4 0.5
3
4
5
6
7
8
9
Potential [V (vs. Ag/AgCl)]
Cu
rren
t [n
A]
500 µM
↑
100 µM
0.0 0.1 0.2 0.3 0.4 0.5
3
4
5
6
7
8
9

Chapter 6 Electrochemical Detection Using Oxygen Plasma Functionalised CNT MEA
107
Figures 6.11(a), (c) and (e) illustrate the response of the commercial EP Pt MEA to the same ascorbic
acid concentrations that were tested by cyclic voltammetry. As with cyclic voltammetry, there is no
discernible oxidation peaks in the potential scan window tested, although the current increases
marginally with increasing ascorbic acid concentration. Figures 6.11(b), (d) and (f) clarify the response
of the functionalised CNT MEA to ascorbic acid, in terms of its ability to oxidise the biomolecule.
Substantial and broad oxidation peaks are observed at an oxidation potential of ~+0.4 V for ascorbic
acid, with increasing anodic peak current in response to increasing ascorbic acid concentration.
These peak currents were measured and a linear relationship is observed for increasing peak current in
response to increasing ascorbic acid concentration (Fig. 6.12). The functionalised CNT MEA recorded
a sensitivity of 0.46 nA µM-1 for the oxidation of ascorbic acid, whereas no oxidation peaks were
identifiable using the commercial EP Pt MEA therefore no sensitivity measurements were made.
Figure 6.12: Response of functionalised CNT MEA to various concentrations of ascorbic acid, measured
using differential pulse voltammetry. A linear response was recorded with y=0.00046x-0.00646 (R2 = 0.99).
6.6. Interferents
Other biochemical interferents for dopamine, besides ascorbic acid, which oxidise at a similar potential
are present in biological systems. There are many examples of these such as L-DOPA, serotonin,
noradrenaline, uric acid etc. Here, we investigated the response of both MEAs to noradrenaline and uric
acid using both cyclic voltammetry and differential pulse voltammetry. Noradrenaline was used as it is
a neurotransmitter alike to dopamine, with only an additional hydroxyl group on noradrenaline the
difference between the two biomolecules. Because of this similarity it has been particularly difficult to
0 100 200 300 400 5000.00
0.04
0.08
0.12
0.16
0.20
0.24
Concentration [µm]
Cu
rren
t [µ
A]
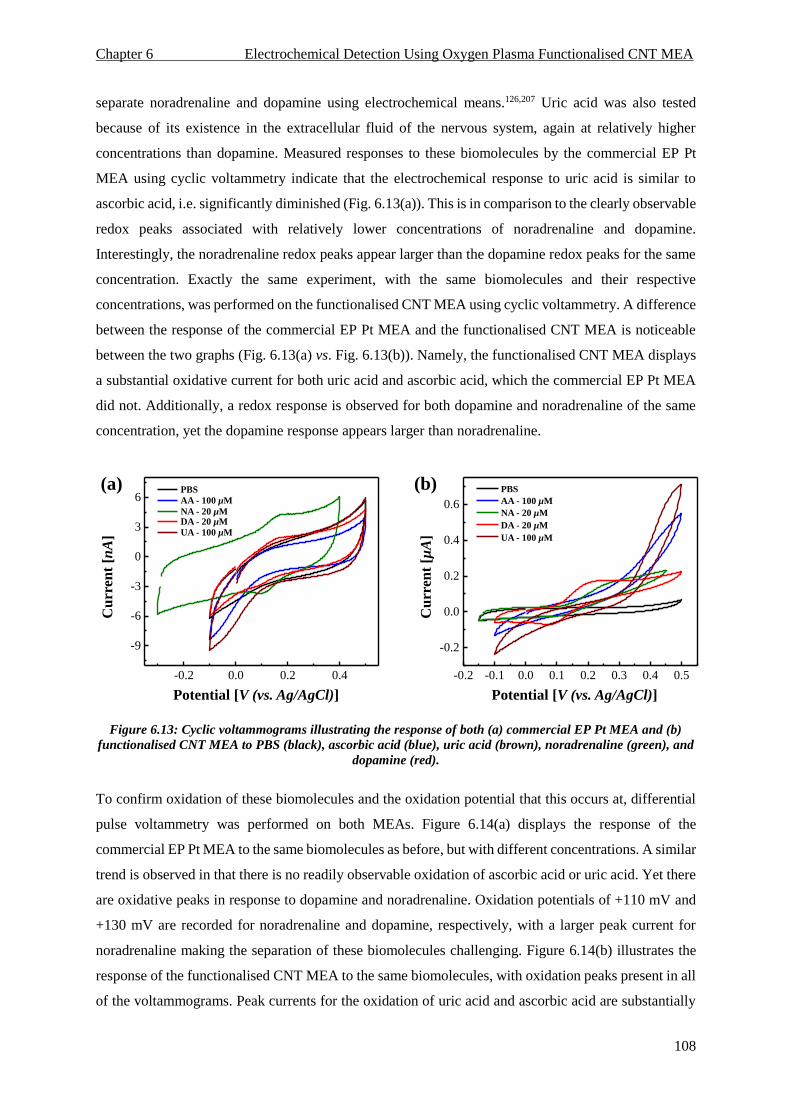
Chapter 6 Electrochemical Detection Using Oxygen Plasma Functionalised CNT MEA
108
separate noradrenaline and dopamine using electrochemical means.126,207 Uric acid was also tested
because of its existence in the extracellular fluid of the nervous system, again at relatively higher
concentrations than dopamine. Measured responses to these biomolecules by the commercial EP Pt
MEA using cyclic voltammetry indicate that the electrochemical response to uric acid is similar to
ascorbic acid, i.e. significantly diminished (Fig. 6.13(a)). This is in comparison to the clearly observable
redox peaks associated with relatively lower concentrations of noradrenaline and dopamine.
Interestingly, the noradrenaline redox peaks appear larger than the dopamine redox peaks for the same
concentration. Exactly the same experiment, with the same biomolecules and their respective
concentrations, was performed on the functionalised CNT MEA using cyclic voltammetry. A difference
between the response of the commercial EP Pt MEA and the functionalised CNT MEA is noticeable
between the two graphs (Fig. 6.13(a) vs. Fig. 6.13(b)). Namely, the functionalised CNT MEA displays
a substantial oxidative current for both uric acid and ascorbic acid, which the commercial EP Pt MEA
did not. Additionally, a redox response is observed for both dopamine and noradrenaline of the same
concentration, yet the dopamine response appears larger than noradrenaline.
Figure 6.13: Cyclic voltammograms illustrating the response of both (a) commercial EP Pt MEA and (b)
functionalised CNT MEA to PBS (black), ascorbic acid (blue), uric acid (brown), noradrenaline (green), and
dopamine (red).
To confirm oxidation of these biomolecules and the oxidation potential that this occurs at, differential
pulse voltammetry was performed on both MEAs. Figure 6.14(a) displays the response of the
commercial EP Pt MEA to the same biomolecules as before, but with different concentrations. A similar
trend is observed in that there is no readily observable oxidation of ascorbic acid or uric acid. Yet there
are oxidative peaks in response to dopamine and noradrenaline. Oxidation potentials of +110 mV and
+130 mV are recorded for noradrenaline and dopamine, respectively, with a larger peak current for
noradrenaline making the separation of these biomolecules challenging. Figure 6.14(b) illustrates the
response of the functionalised CNT MEA to the same biomolecules, with oxidation peaks present in all
of the voltammograms. Peak currents for the oxidation of uric acid and ascorbic acid are substantially
-0.2 0.0 0.2 0.4
-9
-6
-3
0
3
6
PBS
AA - 100 µM
NA - 20 µMDA - 20 µM
Potential [V (vs. Ag/AgCl)]
Cu
rren
t [n
A] UA - 100 µM
-0.2 -0.1 0.0 0.1 0.2 0.3 0.4 0.5
-0.2
0.0
0.2
0.4
0.6
Potential [V (vs. Ag/AgCl)]
Cu
rren
t [µ
A]
PBS
AA - 100 µM
NA - 20 µM
DA - 20 µM
UA - 100 µM
(a) (b)
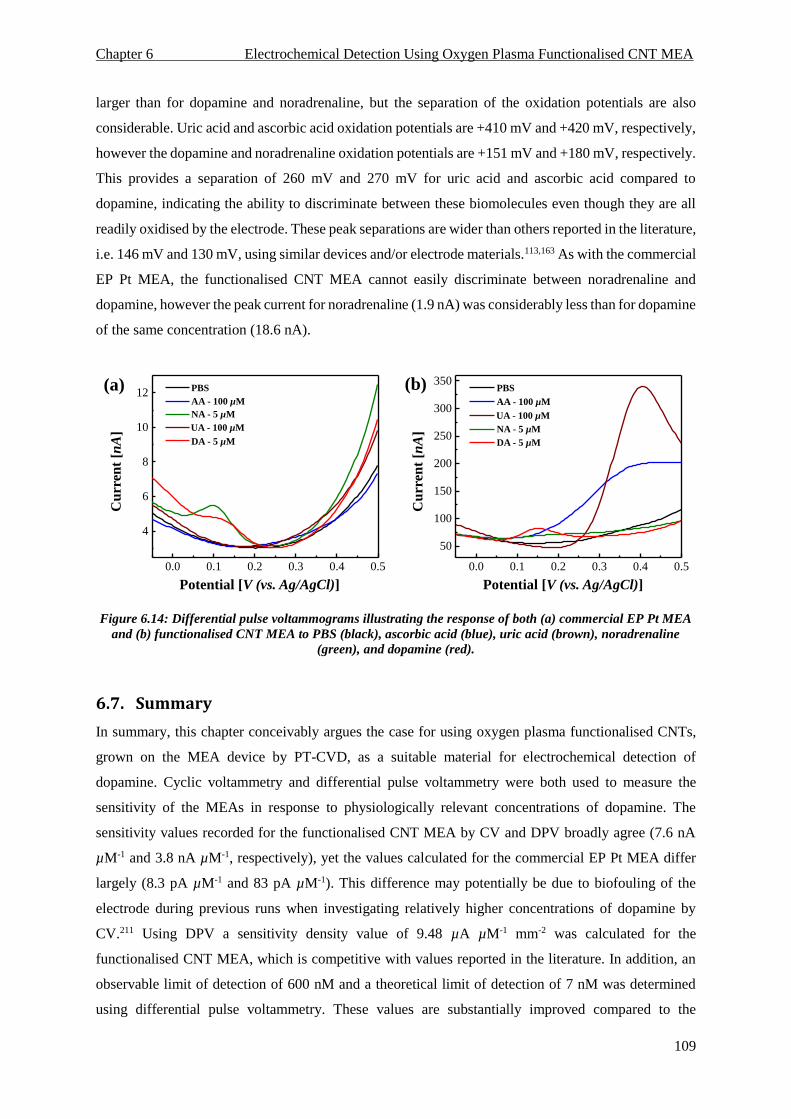
Chapter 6 Electrochemical Detection Using Oxygen Plasma Functionalised CNT MEA
109
larger than for dopamine and noradrenaline, but the separation of the oxidation potentials are also
considerable. Uric acid and ascorbic acid oxidation potentials are +410 mV and +420 mV, respectively,
however the dopamine and noradrenaline oxidation potentials are +151 mV and +180 mV, respectively.
This provides a separation of 260 mV and 270 mV for uric acid and ascorbic acid compared to
dopamine, indicating the ability to discriminate between these biomolecules even though they are all
readily oxidised by the electrode. These peak separations are wider than others reported in the literature,
i.e. 146 mV and 130 mV, using similar devices and/or electrode materials.113,163 As with the commercial
EP Pt MEA, the functionalised CNT MEA cannot easily discriminate between noradrenaline and
dopamine, however the peak current for noradrenaline (1.9 nA) was considerably less than for dopamine
of the same concentration (18.6 nA).
Figure 6.14: Differential pulse voltammograms illustrating the response of both (a) commercial EP Pt MEA
and (b) functionalised CNT MEA to PBS (black), ascorbic acid (blue), uric acid (brown), noradrenaline
(green), and dopamine (red).
6.7. Summary
In summary, this chapter conceivably argues the case for using oxygen plasma functionalised CNTs,
grown on the MEA device by PT-CVD, as a suitable material for electrochemical detection of
dopamine. Cyclic voltammetry and differential pulse voltammetry were both used to measure the
sensitivity of the MEAs in response to physiologically relevant concentrations of dopamine. The
sensitivity values recorded for the functionalised CNT MEA by CV and DPV broadly agree (7.6 nA
µM-1 and 3.8 nA µM-1, respectively), yet the values calculated for the commercial EP Pt MEA differ
largely (8.3 pA µM-1 and 83 pA µM-1). This difference may potentially be due to biofouling of the
electrode during previous runs when investigating relatively higher concentrations of dopamine by
CV.211 Using DPV a sensitivity density value of 9.48 µA µM-1 mm-2 was calculated for the
functionalised CNT MEA, which is competitive with values reported in the literature. In addition, an
observable limit of detection of 600 nM and a theoretical limit of detection of 7 nM was determined
using differential pulse voltammetry. These values are substantially improved compared to the
0.0 0.1 0.2 0.3 0.4 0.5
4
6
8
10
12
Potential [V (vs. Ag/AgCl)]
Cu
rren
t [n
A]
PBS
AA - 100 µM
NA - 5 µM
DA - 5 µM
UA - 100 µM
(a) (b)
0.0 0.1 0.2 0.3 0.4 0.5
50
100
150
200
250
300
350
Potential [V (vs. Ag/AgCl)]
Cu
rren
t [n
A]
PBS
AA - 100 µM
NA - 5 µM
DA - 5 µM
UA - 100 µM

Chapter 6 Electrochemical Detection Using Oxygen Plasma Functionalised CNT MEA
110
commercially available EP Pt MEA. This is most likely due to the dramatically increased surface area
available for electrochemical reactions associated with the use of vertically grown CNTs.137 The
repeatability, in terms of measuring dopamine, was determined to be acceptable for the functionalised
CNT MEA with a RSD of 3% between measurements of 10 µM dopamine. However, the repeatability
between 10 measurements of 10 µM dopamine using the commercial EP Pt MEA was poor, with a RSD
of 40% between measurements. This relatively large difference between measurements could have a
number of explanations, however most likely is the small signal produced in response to 10 µM
dopamine. This, in turn, means the effect of dissolved oxygen in the solution and biofouling via the
oxidised dopamine product is more significant and can affect the peak current measurements by
manipulating the baseline and reducing the peak current.
The response of both electrodes to ascorbic acid was also measured because it is the main interferent of
dopamine detection by the electrochemical oxidation method.109,163,212,213 The commercial EP Pt MEA
recorded no observable redox response, in the potential window tested, to ascorbic acid concentrations
that far exceeded those tested for dopamine. On the other hand, the functionalised CNT MEA displayed
large peak currents for the oxidation of ascorbic acid. This is contrary to results demonstrated in the
literature for both materials, where electroplated Pt has been reported to oxidise ascorbic acid, and
CNTs with high oxygen functionality have been shown not to oxidise ascorbic acid. The main reason
for this may be biofouling of the commercial EP Pt MEA by ascorbic acid oxidation products, as the
concentrations of ascorbic acid tested here are relatively high. Also, the functionalised CNT MEA
reveals oxidation of ascorbic acid yet there should be electrostatic repulsion at neutral pH, meaning the
ascorbic acid oxidation should be limited. However, the relatively large areas, compared to the CNT
diameter, between the grown-CNTs potentially means the solution can penetrate between the CNTs and
reach the metal underlying electrode where the ascorbic acid could get oxidised, this is also possibly
the case for dopamine.
In addition to testing ascorbic acid, others interferents, noradrenaline and uric acid, were also tested and
compared in the same graph to responses from dopamine and ascorbic acid. The commercial EP Pt
MEA oxidised both dopamine and noradrenaline, but did not appear to oxidise ascorbic acid and uric
acid of a higher concentration. The functionalised CNT MEA oxidised all biomolecules tested. Yet, it
demonstrated a peak separation between dopamine and ascorbic acid/uric acid of ~250 mV, indicating
the potential for separation of these biomolecules in a mixture. Neither MEA was able to separate the
signals of dopamine and noradrenaline, while the commercial EP Pt MEA showed higher oxidative
current for noradrenaline compared to dopamine, the functionalised CNT MEA illustrated the opposite
trend. This inability to discriminate between these biomolecules is common for oxidation based
electrochemical sensors, most likely due to their very similar chemical structure.207 Although some
reports have demonstrated selectivity between these two biomolecules, these experiments have used

Chapter 6 Electrochemical Detection Using Oxygen Plasma Functionalised CNT MEA
111
either molecularly imprinted polymers or have measured the response of a downstream product of
dopamine oxidation.58,116 Selectivity between these biomolecules is only a challenge when the area of
the brain being tested has co-localisation of noradrenaline and dopamine releasing neurons. Yet,
selectivity against ascorbic acid and uric acid is a more common problem due to their ubiquity in the
extracellular fluid of the central nervous system, and at much higher concentrations than dopamine.
Therefore, the selective response for dopamine demonstrated by the commercial EP Pt MEA is useful,
however the relatively high detection limit and lack of repeatability means this MEA may not be
appropriate for electrochemical detection purposes. The functionalised CNT MEA revealed a good
detection limit for dopamine and a very high sensitivity considering its geometric surface area. In
addition, it showed reasonable selectivity for dopamine against both ascorbic acid and uric acid, in
terms of the separation of oxidation potentials. These results indicate that the functionalised CNT MEA
may be appropriate for use as an electrochemical sensor for dopamine, with the possibility for in vitro
or in situ detection.
However, some limitations were recorded when using the functionalised CNT MEA, these were the
structural integrity of CNTs on the device and the onset of the oxidation potential of ascorbic acid. The
structural integrity of CNTs on the device refers to the ease with which the CNTs were removed from
the electrode areas. Figure 6.15 demonstrates the functionalised CNT MEA before (Fig. 6.15(a)) and
after (Fig. 6.15(b)) use for electrochemical detection, where after use is defined as ≥100 experimental
runs. In Figure 6.15(a) all the electrodes are black due to the presence of CNTs. After continual use
these CNTs seem to be removed from the electrode as demonstrated by the lightening of the electrode
colour as demonstrated in Figure 6.15(b). The removal of these CNTs could have been due to one of
two reasons, firstly the washing steps which are necessary to clean the electrodes could have
mechanically removed them from the surface after a number of washes. Secondly, the aluminium
interlayer which is exposed to the solution could have been dissolved, thus releasing the CNTs from the
electrode surface. Reports have demonstrated the electrochemical dissolution of aluminium, in solutions
containing sodium chloride, at potentials between 0.1 V and 0.8 V.214,215
Additionally, as discussed the onset of the oxidation potential for ascorbic acid could be a challenge.
This is because even though the oxidation potential for ascorbic acid using the functionalised CNT
MEA was ~420 mV, the biomolecule started oxidising at ~130 mV. This means that low concentrations
of dopamine (<1 µM) may be difficult to determine in a mixture containing a relatively high
concentration of ascorbic acid.

Chapter 6 Electrochemical Detection Using Oxygen Plasma Functionalised CNT MEA
112
Figure 6.15: Images of functionalised CNT MEA (a) before and (b) after use for electrochemical detection.
The electrodes in use appear to have had the CNTs removed as they are not black any longer.
Thus, in an attempt to circumvent these issues a novel MEA design was realised which used a new
material structure for growing CNTs, this in turn promoted adhesion of the CNTs to the substrate. This
microelectrode array design, along with the device characterisation, is discussed in detail in Chapter 7.
Chapter 7 Novel CNT–Based MEA Design and Characterisation
113
Chapter 7 - Novel CNT-Based MEA Design and
Characterisation
7.1. Introduction
This final results chapter aims to improve the design of the CNT microelectrode in terms of its
robustness, whilst maintaining as far as possible, the electrochemical properties displayed in Chapter 6.
The excellent mechanical properties of CNTs are well known, as they display a larger Young’s modulus
than steel in addition to flexibility.37,39 Despite these exceptional properties, CNTs that are CVD-grown
on a substrate are relatively easy to remove as their bonding to the substrate is weak. This, in turn,
makes re-using a device with CVD-grown CNTs challenging, and if the sample is biological in nature
(i.e. brain slice) the detached CNTs may interact with the cells or tissue in adverse ways. Thus, a novel
method which involves the use of a thin (<10 nm) protective layer deposited on top of the catalyst layer,
prior to CVD-assisted CNT growth, was incorporated to improve CNT adhesion to the substrate.
Additionally, the process steps were altered to shorten the fabrication procedure (by removing the
insulation etching step), hence hopefully improving the ease of production.
7.2. MEA Fabrication Procedure
Many of the process steps involved in fabricating this MEA are similar to those used in Chapter 5,
although this procedure uses a passivation step at the end which will be described in detail here. Firstly,
3” silicon wafers with a 230 nm silicon dioxide layer were thoroughly cleaned following the substrate
cleaning procedure outlined in Section 3.1.1. This was followed by a photolithography step, where the
photomask is outlined by the blue areas in Figure 5.2. This step also included sample metallisation and
lift-off, thus completing step 1 in Figure 7.1 (Section 3.1.2). It must be noted during sample
metallisation a protective layer was also DC sputtered on top of the Fe catalyst, it is used to promote
adhesion of the PT-CVD-grown CNTs to the substrate. After patterning of the substrate with the correct
metal layers, CNT growth by PT-CVD was performed as per Figure 7.1 – step 2 (Section 3.1.5).
Following successful CNT growth the sample was ready for the final stage of processing, which was
the deposition of SU-8 (MicroChem Corp.), an insulating layer. SU-8 2015 was spin-cast onto the
substrate in a two-step regime, an initial ‘spreading’ at 500 rpm for 10 seconds was exacted with an
acceleration of 100 rpm/s, followed by a spin-coating at 2000 rpm for 30 seconds, with a 300 rpm/s
acceleration for the second step. Following a 30 minute rest period on a level surface, the sample was
placed on a hot plate and the temperature slowly increased (~18ᵒC min-1) until it reached 95ᵒC where it

Chapter 7 Novel CNT–Based MEA Design and Characterisation
114
remained for 4 minutes, and the sample was then slowly cooled to room temperature (-5ᵒC min-1). After
this ‘soft-bake’ stage, the sample underwent the UV exposure stage (Karl Suss MA1006 Mask Aligner
– i line) for 22 seconds at 7 mW/cm2 (154 mJ/cm2), this was followed by an immediate ‘post-exposure
bake’. The post-exposure bake used the same slow ramping as the soft-bake stage to reach 95ᵒC where
it remained for 5 minutes, again followed by the same slow cooling procedure to room temperature.
The sample was developed in EC solvent (Microposit™) for 4 minutes, followed by gentle washing in
iso-propanol and carefully dried using a N2 air gun to remove the remaining solvent on the sample. The
final step in this process was to hard-bake the SU-8, which involved slowly heating the sample on a
hotplate to a temperature of 170 ᵒC where it remained for 10 minutes, followed by a slow cooling to
room temperature. These parameters generated an insulating layer of ~28 µm, with the electrode and
bond pad areas exposed (Fig. 7.1 – step 3).
Following this SU-8 deposition step, the CNT MEA device was functionalised using an oxygen plasma
(Emitech K1050X) generated at 0.15 Torr with 50 W for 12 seconds with an O2 flow of 15 sccm.
Figure 7.1: Schematic of the fabrication process of the novel microelectrode array. * represents the working
electrode bond-pad area.
7.3. Device Characterisation
There were a number of characterisation procedures carried out at various places during the device
fabrication. SEM imaging and Raman spectroscopy was performed after CNT growth, and prior to the
SU-8 spin-casting, for a number of reasons. Firstly, SEM imaging provides information on the presence
and height of CNTs, this in turn dictates the SU-8 thickness necessary for the device. Secondly, Raman
spectroscopy provides information on the CNT quality prior to SU-8 spin-casting, therefore Raman
spectroscopy can also be carried out after the SU-8 procedure to observe any changes in CNT quality.

Chapter 7 Novel CNT–Based MEA Design and Characterisation
115
Following the functionalisation step, this novel functionalised CNT MEA was then characterised using
similar techniques to those described in Chapter 5 and Chapter 6. Namely, SEM images (Section 3.2.1)
and Raman spectroscopy (Section 3.2.5) spectra were taken to observe changes in CNT morphology
and quality. Furthermore, electrochemical impedance spectroscopy (Section 3.2.6), cyclic voltammetry
(Section 3.2.8), and differential pulse voltammetry (Section 3.2.9) were carried out on two different
electrode sizes to determine the interfacial impedance of the electrodes, in addition to their
electrochemical response to dopamine and its interferents. All values stated with regards to Raman
spectroscopy and electrochemical impedance spectroscopy are the mean average ±standard error of
mean.
7.4. Imaging of CNT Growth & Device
The first step was to observe whether the protective layer used would indeed improve the retention of
the CVD-grown CNTs onto the substrate. To do this metallic interlayers plus a catalyst layer were
deposited on a substrate using the same architecture, with one of the substrates also having a thin
protective layer deposited on top of the catalyst (Section 3.1.1.1 for details). The samples then
underwent PT-CVD-assisted CNT growth under exactly the same conditions. Following this both
samples with CNTs grown on them were subjected to ultrasonication in DI water at 400 W (Ultrawave
Qi-400) for a sustained period of one minute. Figure 7.2 demonstrates the CNT growth on both samples,
in addition to images of the samples after the sonicating procedure. The first observation is that the use
of the protective layer on top of the catalyst still permitted CNT growth (Fig. 7.2(a-b)). The CNTs on
both samples were vertically aligned, yet the CNTs grown on the sample with the protective layer were
substantially smaller (~5 µm) than the CNTs grown without a protective layer (~35 µm). This may be
due to the interaction of the protective layer with the incident light from the IR lamps providing energy
to the catalyst layer in the PT-CVD system. This interaction may reduce the energy reaching the
catalyst, consequently either delaying the onset of growth or reducing the diffusion of acetylene to the
catalyst surface. Interestingly, following the sonication procedure the sample with no protective layer
had the CNTs almost completely removed from the surface (Fig. 7.2(c,e)). However, the sample with
the protective layer above the catalyst retained what appeared to be the majority of the CNTs on the
sample surface. These CNTs appear packed/bundled in Figure 7.2(d) as the Van der Waals forces
between the CNTs, in addition to their hydrophobicity, causes the air space between them to be reduced
as the solution dries.216

Chapter 7 Novel CNT–Based MEA Design and Characterisation
116
Figure 7.2: SEM images of CNT growth (a,b), and reaction to subsequent sonication (c-f), either using a
protective catalyst layer (b,d,f), or not (a,c,e).
Following on from this initial finding, the devices were fabricated as described in Section 7.2 and
images were taken before the SU-8 spin-casting, in addition to after the process. Figure 7.3(a) conveys
that CNTs were grown ubiquitously on electrode and track areas for both electrode sizes tested (150
µm diameter circular and 20 µm diameter square) where the metallic catalyst layers were patterned.
Figures 7.3(b-d) provide a closer investigation of the CNT growth on the sample, indicating a relatively
uniform height between electrodes and tracks of ~18 µm. The CNTs have also grown taller at the edges
of the tracks and electrodes compared to the centre, this is potentially because of higher surface area
available for catalytic activity of the formed Fe nanoparticles during CNT growth.217

Chapter 7 Novel CNT–Based MEA Design and Characterisation
117
Figure 7.3: SEM images of various areas of the CNT-based MEA prior to SU-8 processing step.
Imaging was again employed after SU-8 processing to observe the quality of the SU-8 insulating and
patterning process, in addition to whether the CNTs survived the procedure and if they were exposed
in the desired locations, i.e. electrode areas. Figure 7.4(a) demonstrates, via optical microscopy, a
continuous SU-8 layer above the tracks with openings in the electrode areas. These openings are black,
most likely due to the presence of exposed CNTs where the SU-8 has been removed. Measurements of
electrode diameter using ImageJ analysis revealed a diameter of 16 µm, considering the electrode is
also not a perfect square this produces a geometric surface area for the electrode of <256 µm2. Figure
7.4(b-d) confirms the retention of CNTs after the SU-8 processing step, but these CNTs are no longer
vertically aligned because as the solution has evaporated during the SU-8 processing, the strong Van
der Waals interactions caused the hydrophobic CNTs to ‘bundle’.216

Chapter 7 Novel CNT–Based MEA Design and Characterisation
118
Figure 7.4: Optical microscope and SEM images of patterned areas after SU-8 processing indicating the
exposure of CNTs in desired electrode areas. (b) Image taken at 16 µm diameter electrode, (c) image taken at
150 µm diameter electrode, (d) image taken in bond pad area.
7.5. Raman Spectroscopy
Raman spectroscopy was undertaken for two main reasons, firstly to determine the CNT type/quality
and secondly to observe if the CNTs were affected by the SU-8 photolithography step (Fig. 7.1 – Step
3). Figure 7.5 displays the spectra of six separate electrodes that were measured before (Fig. 7.5(a)) and
after (Fig. 7.5(b)) SU-8 processing. The main peaks are labelled as the D peak at 1348 cm-1, G peak at
1580 cm-1, and 2D peak at 2700 cm-1, the peak positions have not shifted as a consequence of the SU-8
processing step. The first result that can be taken from the spectra is that the CNTs grown for this device
are most likely multi-wall CNTs. The lack of radial breathing modes (140-320 cm-1) and the lack of
splitting in the G peak are indicative of MWCNT type, this means that the CNTs grown here are metallic
in nature.13 Also, the CNTs are of relatively high quality and good long-range ordering considering the
growth temperature, with the CNTs prior to SU-8 processing reporting a ID/IG of 0.41 ±0.01 and a ID/I2D
of 0.38 ±0.01 (Fig. 7.5(a)). These values and observations are in line with previous research carried out
investigating CNT growth using a very similar sample architecture (without the protective catalyst

Chapter 7 Novel CNT–Based MEA Design and Characterisation
119
layer) in a PT-CVD system.26,181 These experiments reported growth of MWCNTs, demonstrated by
TEM and Raman spectroscopy, in addition to a ID/IG of between 0.31 and 0.50 for very similar growth
parameters.26,181 The Raman spectrum of the CNTs was altered due to SU-8 processing, with an increase
in ID/IG to 0.60 ±0.01 and an increase in ID/I2D to 0.64 ±0.01 (Fig. 7.6(b)).
Figure 7.5: Raman spectra from six separate electrodes for (a) before SU-8 processing and (b) after SU-8
processing. The main peaks, i.e. D peak – 1348 cm-1, G peak – 1580 cm-1, and 2D peak – 2700 cm-1.
This increase in both values indicates a negative effect on the CNTs due to SU-8 processing, which is
exemplified by Figure 7.6. Specifically, Figure 7.6(b) illustrates the increase in the D peak intensity, in
addition to a broadening of the G peak (most likely caused by an increase in intensity in the D’ peak at
~1610 cm-1) after SU-8 processing.
Figure 7.6: Raman spectra indicating the difference in CNT quality before and after the SU-8 processing
step. (a) Displays the full Raman spectra with important peaks, (b) magnified view of the D peak and G peak
area, indicating the change in D peak intensity due to SU-8 processing.
500 1000 1500 2000 2500 3000 3500
0.0
0.2
0.4
0.6
0.8
1.0
1.2
Raman Shift [cm-1]
Inte
nsi
ty [
a.u
.]
500 1000 1500 2000 2500 3000 3500
0.0
0.2
0.4
0.6
0.8
1.0
1.2
Raman Shift [cm-1]In
ten
sity
[a.u
.]
(a) (b)
D
G2D
D
G 2D
500 1000 1500 2000 2500 3000 3500
0.0
0.2
0.4
0.6
0.8
1.0
Raman Shift [cm-1]
Inte
nsi
ty [
a.u
.]
Pre-SU8
Post-SU8
1200 1400 1600 1800
0.0
0.2
0.4
0.6
0.8
1.0
Raman Shift [cm-1]
Inte
nsi
ty [
a.u
.]
Pre-SU8
Post-SU8
(a) (b)
D
G 2D
D
G

Chapter 7 Novel CNT–Based MEA Design and Characterisation
120
7.6. Electrochemical Characterisation
7.6.1. Impedance Spectroscopy
Following oxygen plasma functionalisation of the device various electrochemical characterisation
experiments were performed. Initially, electrochemical impedance spectroscopy was performed to
allow comparisons with previously characterised devices. The response of one of each electrode size,
150 µm diameter and 16 µm diameter, is displayed in Figure 7.7 and Figure 7.8. The separated Bode
plot (Fig. 7.7) demonstrates that the larger electrode area has a lower |Z| than the smaller electrode area
over the frequency range investigated, which is logical as interfacial impedance has been shown to
reduce with increasing electrode surface area. Additionally, the phase response illustrates a similarity
between these different electrode areas, but the response from the smaller electrode area is shifted
upwards in frequency. The larger electrode area displays a similar phase response with frequency to the
EP Pt electrode, as seen in Fig. 5.8(b), i.e. a more resistive response at higher frequencies (103 Hz – 106
Hz), which is not observed with the smaller electrode area. This phase response is different to that of
the functionalised CNT MEA reported on in Chapter 5, which showed a highly capacitive response.
Also, Figure 7.7 allows determination of the value for |Z| at 1 kHz which has already been stated as
having electrophysiological significance. An interfacial impedance value of 2.77 ±0.21 kΩ (N=4) was
calculated for the 150 µm diameter electrode (N=4) at 1 kHz, which interestingly is comparable to that
of the 20 µm diameter electrode reported in Chapter 5. Additionally, the 16 µm diameter electrode of
the novel functionalised CNT MEA reported an interfacial impedance value of 17.8 ±1.77 kΩ (N=8) at
1 kHz, which is comparable to the commercial EP Pt electrode.
Figure 7.7: Electrochemical impedance spectra of the novel functionalised CNT MEA, showing a separated
Bode plot indicating how both (a) |impedance| and (b) phase change with the applied frequency of signal.
Black squares are response of the 150 µm diameter electrode and red circles are the response of the 16 µm
diameter electrode.
10-1
100
101
102
103
104
105
106
102
103
104
105
106
107
Frequency [Hz]
|Im
ped
an
ce| [Ω
]
150 µm
16 µm
10-1
100
101
102
103
104
105
106
0
10
20
30
40
50
60
70
80
90
Frequency [Hz]
-Ph
ase
[ᵒ]
150 µm
16 µm
(a) (b)

Chapter 7 Novel CNT–Based MEA Design and Characterisation
121
Accompanying the separated Bode plot, a Nyquist plot was produced for both electrode sizes. Figure
7.8(a) displays the response from the 150 µm diameter electrode, where two time constants are
observed, one lower impedance (Fig. 7.8(a) inset) and one larger. Figure 7.8(b) demonstrates the
response from the 16 µm diameter electrode, where again two time constants are shown, although the
lower impedance semicircle is only partially observable (Fig. 7.8(b) inset). Using the information
attained from the Nyquist plot, a potential equivalent circuit diagram was produced for both electrode
sizes (Fig. 7.9).
Figure 7.8: Electrochemical impedance spectra of the novel functionalised CNT MEA, showing the Nyquist
plot for (a) 150 µm diameter electrode and (b) 16 µm diameter electrode.
The observation of two semicircles in the Nyquist plot infers two time constants in the equivalent circuit
as stated, however the production of an equivalent circuit diagram may not be as obvious as in Chapter
5.
Figure 7.9 presents two equivalent circuits that are possible with the observation of two semicircles in
the Nyquist plot. Figure 7.9(a) is the same equivalent circuit as that used in Chapter 5, which is different
to Figure 7.9(b) where two time constants are presented in series. Here, the use of the SU-8
photolithography step makes the decision of which equivalent circuit is likely to be correct more
challenging. Specifically, if the SU-8 has not fully developed or the CNTs are highly densified due to
the SU-8 passivation step, then only the CNTs will be exposed to the solution (not the underlying
tracking metal as well). If this is the case, then the correct equivalent circuit is most likely Figure 7.9(b),
however it could reasonably still be either equivalent circuit.
0.0 5.0x10⁵
1.0x10⁶
1.5x10⁶
2.0x10⁶
0.0
5.0x10⁵
1.0x10⁶
1.5x10⁶
0 1x10³
2x10³
3x10³
4x10³
0
1x10³
2x10³
3x10³
4x10³
Re(Z) [Ω]
-Im
(Z)
[Ω]
0 1x10⁶
2x10⁶
3x10⁶
0
3x10⁵
6x10⁵
9x10⁵
0.0 5.0x10³
1.0x10⁴
1.5x10⁴
2.0x10⁴
0.0
5.0x10³
1.0x10⁴
1.5x10⁴
2.0x10⁴
Re(Z) [Ω]
-Im
(Z)
[Ω]
(a) (b)

Chapter 7 Novel CNT–Based MEA Design and Characterisation
122
Figure 7.9: Potential equivalent circuit models to describe the Nyquist plot produced from the novel
functionalised CNT MEA presented here.
7.6.2. Wide-potential Window Scans
Interestingly, the wide-potential window scans provided information which helped to justify which
equivalent circuit was correct. Figure 7.10 illustrates a potential window scan of four different
electrodes, namely the two tested in Chapter 5 (commercial EP Pt MEA and functionalised CNT MEA)
and the two different electrode sizes (150 µm diameter and 16 µm diameter) on this novel functionalised
CNT MEA. The sudden increase in current at the extremes of the scan, in addition to the peaks in the
scan window, are associated with water electrolysis and oxidation/reduction of the evolved oxygen and
hydrogen, in addition to adsorption/desorption of oxygen and hydrogen on the electrode.175 These are
noted for all of the electrodes apart from the 16 µm diameter electrode on the novel functionalised CNT
MEA (Fig. 7.10 – green). Noble metal electrodes are known to electrolyse water at roughly +/- 1 Volt,
this can be observed with the commercial EP Pt MEA for reference.175 However, CNT electrodes have
been reported to have one of the widest available potential windows of any material, meaning they start
to electrolyse water at much higher potentials. The stable potential window of 4 V observed here is one
of the highest noted in the literature, improving upon the excellent potential windows demonstrated by
boron-doped diamond and graphene.110,145 Therefore, some speculation can be made about the possible
equivalent circuit models for the novel functionalised CNT MEA, when taking this data into account.
Perhaps the 150 µm diameter electrodes resembles Figure 7.9(a), as the water hydrolysis occurs due to
reactions happening at the underlying tracking metal between the CNTs (this is most likely also true for
the functionalised CNT MEA discussed in Chapter 5). Comparatively, the 16 µm diameter electrodes
may resemble Figure 7.9(b) as the undeveloped SU-8/highly densified CNTs may be completely

Chapter 7 Novel CNT–Based MEA Design and Characterisation
123
covering the underlying metal. Nonetheless, there is no definitive way, in this system, to know which
equivalent circuit is correct, however the values for the two time constants are shown in Table 7.1.
Figure 7.10: Wide potential window scans of four different electrodes, commercial EP Pt (black),
functionalised CNT MEA (20 µm diameter electrode - red), novel functionalised CNT MEA (150 µm
diameter electrode - blue), and novel functionalised CNT MEA (16 µm diameter electrode - green). Scans in
PBS, ran at 1 V/s.
-2 -1 0 1 2-90
-60
-30
0
30
60
90
EP Pt
f-CNT (20 µm)
Novel f-CNT (150 µm)
Novel f-CNT (16 µm)
Potential [V (vs. Ag/AgCl)]
Cu
rren
t [µ
A]
-2 -1 0 1 2
Potential [V (vs. Ag/AgCl)]
(a)
(b)

Chapter 7 Novel CNT–Based MEA Design and Characterisation
124
Electrode Size (µm)
Rs (Ω) Rpo/RCNT (Ω) Cc/CCNT (F) Rct/RM (Ω) Cdl/CM (F)
16 n/a 3.82 x 10⁴ 2.44 x 10⁻⁸ 2.22 x 10⁶ 2.66 x 10⁻⁸
150 803 2.35 x 10³ 6.06 x 10⁻⁹ 2.43 x 10⁶ 3.54 x 10⁻⁷
Table 7.1: Equivalent circuit fitting values for both electrode sizes tested on the novel functionalised CNT
MEA.
7.6.3. Response to Dopamine & Interferents
The response to a constant concentration of dopamine (50 µM) with varying scan rate (10 mV/s to 100
mV/s) was determined, similar to the experiment carried out in Section 6.4.1. Again, experiments
looked at the two different electrode diameters previously discussed, 150 µm and 16 µm. Figure 7.11
displays the response from the 150 µm electrode diameter, with obvious oxidation and reduction peaks
present at +255 mV and +179 mV, respectively, for 100 mV/s. This means the peak potential difference
is calculated to be 76 mV, which is close to the ideal value of 30 mV for dopamine (as n=2 – see Eq.
6.1), signifying good electrochemical reversibility for dopamine redox reaction at this electrode.
Moreover, the anodic and cathodic peak currents were calculated and plotted against the scan rate (Fig.
7.11(b)) and the square root of the scan rate (Fig. 7.11(c)), to determine whether the charge transfer is
adsorption or diffusion mediated. Similar to the response of the functionalised CNT MEA in Section
6.4.1, the plots illustrate an adsorption based mechanism as the peak current is linear with scan rate over
the entire range. This adsorption mechanism for the redox reaction of dopamine is consistent with the
use of carbon based electrodes, particularly CNTs.108,210,218 Additionally, the anodic and cathodic slope
values for the linear response, 60.1 pA/(mV/s) and 45.7 pA/(mV/s), agree to within 75%, indicating
good electrochemical reversibility at this electrode for dopamine. A response to 50 µM dopamine was
also measured, using cyclic voltammetry, at electrodes with 16 µm diameter. Figure 7.12 demonstrates
such a response, where the oxidation and reduction peaks can be discerned, yet with some degree of
difficulty. This difficulty makes the peak currents challenging to determine for each scan rate, and thus
the values cannot be calculated with any degree of accuracy. However, the oxidation peak was noticed
to be +258 mV and the reduction peak was +168 mV (at 100 mV/s), resulting in a peak potential
difference of 90 mV. This indicates a lower electrochemical reversibility at this electrode area compared
to the larger area previously stated. Nonetheless, 90 mV represents acceptable reversibility in terms of
rate of charge transfer at this electrode. Following these initial investigations a preliminary differential
pulse voltammetry experiment was carried out, on both electrode sizes, to determine whether they could
record near physiological concentrations of dopamine and how they react to interferents (i.e. ascorbic
acid).

Chapter 7 Novel CNT–Based MEA Design and Characterisation
125
Figure 7.11: Response to 50 µM dopamine by novel functionalised CNT MEA electrode of 150 µm diameter.
(a) Graph illustrating increasing peak current with increasing scan rate, from 10 mV/s to 100 mV/s in 10
mV/s steps. (b) Linear response of peak anodic (black) and cathodic (blue) current to scan rate (R2 = 0.99),
anodic response was y=0.06006x+1.71603, cathodic response was y=-0.04568x-1.50403. (c) Response of peak
current to square root of scan rate.
Figure 7.12: Response to 50 µM dopamine by novel functionalised CNT MEA electrode of 16 µm diameter.
The results of this experiment are presented in Figure 7.13, where the responses of the two different
electrode sizes for the novel functionalised CNT MEA are shown separately. Both electrode sizes
-0.1 0.0 0.1 0.2 0.3 0.4 0.5-40
-20
0
20
40
Potential [V (vs. Ag/AgCl)]
Cu
rren
t [n
A]
100
↑
10
mV/s
30 60 90
-9
-6
-3
0
3
6
9
Scan Rate [mV/s]
Cu
rren
t [n
A]
3 6 9
-9
-6
-3
0
3
6
9
Scan Rate [mV/s1/2]
Cu
rren
t [n
A]
(a)
(b)
(c)
-0.1 0.0 0.1 0.2 0.3 0.4 0.5-10
-5
0
5
10
15
Potential [V (vs. Ag/AgCl)]
Cu
rren
t [n
A] 100
↑
10
mV/s

Chapter 7 Novel CNT–Based MEA Design and Characterisation
126
display a response to PBS (control), to 10 µM dopamine and to 1 mM ascorbic acid. It must be noted
that the concentration of the ascorbic acid is 100 times larger than the dopamine. Figure 7.13(a), which
is the response of the 150 µm diameter electrode on the novel functionalised CNT MEA, shows a clear
separation of the ascorbic acid and dopamine peaks. The ascorbic acid oxidation potential is -64 mV,
with 1mM concentration producing a peak current of 126 nA. The dopamine oxidation is registered at
+142 mV, with 10 µM concentration generating a peak current of 61.3 nA. Here, a clear peak separation
of 206 mV is observed for ascorbic acid and dopamine, which is less than the 270 mV determined in
Chapter 6. However, a substantial reduction in peak width using this novel functionalised CNT MEA
means the analytes can be suitably discerned, this was not the case in Chapter 6 where the CNT MEA
discussed had overlapping of peaks.
Figure 7.13: DPV response of (a) 150 um and (b) 16 um to PBS used as a control (black), dopamine (DA) 10
µM, and ascorbic acid (AA) 1 mM.
Figure 7.13(b) shows the response of the 16 µm diameter electrode on the novel functionalised CNT
MEA, which again shows a distinct, yet smaller, peak for dopamine oxidation. This peak is located at
+141 mV which is only 1 mV different to the response at the 150 µm diameter electrode, and produces
a peak current of 5.05 nA in response to 10 µM dopamine. The voltammogram from the ascorbic acid
(1 mM) generated no significant peak such as that in Figure 7.13(a), however one small peak was
observed at -24 mV which could potentially be assigned to ascorbic acid oxidation. If this is true then
the peak current produced was 1.91 nA for 1 mM ascorbic acid. For both electrode sizes tested on the
novel functionalised CNT MEA the selectivity of dopamine against ascorbic acid was permitted, such
that no peak overlaps occurred at the concentrations tested. Moreover, the sensitivity for dopamine
compared to ascorbic acid appears to be substantially higher as 100 times higher concentration for
ascorbic acid compared to dopamine only caused an increase in current of two-fold (150 µm diameter
electrode).
-0.2 0.0 0.2 0.4
30
60
90
120
150
PBS
DA – 10 µM
AA – 1 mM
Potential [V (vs. Ag/AgCl)]
Cu
rren
t [n
A]
(a) (b)
-0.2 0.0 0.2 0.4
25
30
35
DA – 10 µM
AA – 1 mM
PBS
Potential [V (vs. Ag/AgCl)]
Cu
rren
t [n
A]

Chapter 7 Novel CNT–Based MEA Design and Characterisation
127
7.7. Novel MEA Potential
A number of other experiments can also be performed to exemplify the potential of this novel
functionalised CNT MEA, as detailed in Figure 7.14. These experiments can be divided into 2 main
sections, the first of which is chemical testing. These tests begin with understanding the reproducibility
of the results observed in Figure 7.13. To do this other electrodes must be tested using the same
procedure, this also includes measuring various concentrations to exact sensitivity metrics, similar to
that generated in Chapter 6. Additionally, as with any sensor, common interferents need to be measured
and compared against for selectivity purposes. Here, that would include noradrenaline, uric acid,
serotonin, and DOPAC for dopamine based experiments. Finally, the second section of biological
measurements, namely electrophysiology and electrochemistry using cell cultures, would complete the
picture for the potential use of these novel functionalised CNT MEA devices in research laboratories.
Figure 7.14: Schematic illustrating the future experiments needed to validate the novel functionalised CNT
MEA fabricated here. DA – Dopamine, AA – ascorbic acid, NA – noradrenaline, UA – uric acid, 5-HT –
serotonin, DOPAC – 3,4-Dihydroxyphenylacetic acid.
7.8. Summary
To summarise, this chapter lays the foundations for a novel approach to fabricating a CNT-based MEA
device. This fabrication procedure aimed to remove some the limitations associated with the CNT-based
MEAs that were produced in Chapters 5 & 6, namely the removal of the CNTs from the electrode after
repetitive use and a simplification of the fabrication protocol. To overcome these limitations, a thin
protective layer has been deposited above the Fe catalyst layer to support CNT retainment at the
electrode, this was demonstrated in Figure 7.2. Additionally, the use of SU-8 as the passivation layer,
which is itself photo-patternable, provided a simplification in the fabrication procedure compared to
that described in Chapter 5. Once the device was complete it was observed that the SU-8 layer

Chapter 7 Novel CNT–Based MEA Design and Characterisation
128
deposition had caused a slight detrimental effect to the CNT electrode, shown by an increase in the ID/IG
using Raman spectroscopy.
Two electrode sizes, 16 µm diameter and 150 µm diameter, were tested using electrochemical methods
including impedance spectroscopy, cyclic voltammetry response to dopamine, and differential pulse
voltammetry response to dopamine and ascorbic acid. The impedance spectroscopy Bode plot
demonstrated an interfacial impedance of 2.77 ±0.21 kΩ for the 150 µm diameter electrode and 17.8
±1.77 kΩ for the 16 µm diameter electrode at 1 kHz. The value for the 16 µm diameter here is roughly
6 times larger compared to the CNT MEA described in Chapter 5, however the interfacial impedance
is still an improvement on the commercial EP Pt MEA of a similar size, indicating its potential to
adequately record electrophysiological signals. Also, this novel functionalised CNT-based MEA
displayed two time constants for both electrode sizes, similar to that of the CNT-based MEAs in Chapter
6. However, it was noted that the equivalent circuit diagram for the MEA defined in this chapter may
be different to that outlined in Chapter 5 due to the potential presence of undeveloped SU-8 in the CNT
electrode area. This was postulated due to the wide-potential window scan results from the electrodes
which indicated no water electrolysis in a 4 V scan window for the 16 µm diameter electrode. Therefore,
due to the possible difference in equivalent circuit diagrams between this novel functionalised CNT
MEA design and the CNT-based MEA device in Chapter 5, it is difficult to make direct comparisons
between the two. However, it should be noted that the pore resistance (or CNT resistance) for this novel
CNT MEA design was almost two orders of magnitude higher compared to that calculated in Chapter
5, indicating that there may indeed be undeveloped SU-8 between the CNTs.
The electrochemical response to dopamine using cyclic voltammetry was again an adsorption-based
mechanism, the same as the CNT MEA in Chapter 6. Of note was the peak potential difference for the
150 µm diameter which was much lower (76 mV) compared to the functionalised CNT MEA in Chapter
6 (200 mV), this demonstrates better electrochemical transfer rates at this novel CNT MEA electrode.
Finally, differential pulse voltammetry of dopamine and ascorbic acid provided evidence of improved
selectivity compared to the CNT-based MEA defined in Chapter 6, with clear separation of the peaks
for both biomolecules. Also, this response was observed with an ascorbic acid concentration 100 times
higher than dopamine, which again is an improvement compared to the functionalised CNT MEA in
Chapter 6. As only one measurement has been produced a comparison of sensitivity cannot be made,
but the 5.05 nA response to 10 µM dopamine of the 16 µm diameter electrode here is lower than the
37.9 nA response to the same concentration of dopamine reported by the CNT MEA in Chapter 6,
indicating that the sensitivity of this novel MEA may be comparatively reduced.
Chapter 8 Conclusions & Future Work
129
Chapter 8 – Conclusions & Future Work
Over the past two decades nanomaterials have been used extensively in the area of biology, stimulating
the emergence of the bio-nanotechnology field. CNTs continue to be a material of interest for a number
of applications due to their excellent mechanical, chemical and electrical properties, particularly in the
field of biosensors. Therefore, this thesis was aimed at using CNTs directly grown and functionalised
on a MEA device to detect selective electrochemical signals from dopamine, an important
neurotransmitter in the mammalian central nervous system.
This chapter will summarise the major findings of this project, whilst also providing a comparison of
the results gained with the state-of-the-art devices in this area. Finally, future work will be discussed,
in addition to a critical assessment of the potential for CNT-based MEAs to facilitate electrochemical
detection of neurotransmitters.
The first results chapter (Chapter 4) in this project detailed the investigations made into functionalising
CNTs using exposure to oxygen plasma. As stated previously, oxygen functional groups instil two
properties that are key to the selective electrochemical detection of dopamine, namely the conversion
from hydrophobic to hydrophilic behaviour of CNTs and the electrostatic attraction of dopamine and
repulsion of ascorbic acid (one of the primary electrochemical interferents for dopamine). Oxygen
plasma functionalisation was the technique investigated here as it has the capability to functionalise
CNTs which are already on a device, a property not shared by other functionalisation techniques which
use aggressive components such as acids, oxidisers, and high temperatures. The results demonstrated
functionalisation was possible at exposure times of just a few seconds, in turn modifying the CNT
behaviour from hydrophobic to superhydrophilic, as shown by the reduction in contact angle from 135ᵒ
to 0ᵒ. This was determined to be due to the huge increase in oxygen functionality bonded to the CNT
structure. Using the results gained in Chapter 4, Chapter 5 was aimed at fabricating a functionalised
CNT-based MEA and comparing the fabricated CNT-based MEA to a state-of-the-art commercial
MEA. The fabrication was successful, producing a CNT-based MEA with high quality CNTs prior to
functionalisation. It was demonstrated that oxygen plasma functionalisation of this fabricated device
improved the interfacial impedance values at 1 kHz to produce one the best reported in the literature
(2.75 ±0.19 kΩ), in addition to being an order of magnitude better than state-of-the-art commercial
MEAs (25.6 ±3.82 kΩ). Leading on from this work, Chapter 6 investigated the electrochemical
properties of the functionalised CNT-based MEA fabricated in Chapter 5, in addition to comparing
them with a current state-of-the-art commercial MEA. The electrochemical detection focussed on

Chapter 8 Conclusions & Future Work
130
physiologically relevant concentrations of dopamine (200 nM to 10 µM) and higher concentrations of
common electrochemical interferents, such as ascorbic acid. It was found that the functionalised CNT
MEA generated a much better sensitivity to dopamine compared to the commercial state-of-the-art
MEA (9.48 µA µM-1 mm-2 vs. 0.21 µA µM-1 mm-2), in addition to a lower detection limit (7 nM vs. 770
nM). However, it was also observed that the CNTs were being removed from the surface of the electrode
during sequential runs. Following the recognition of this mechanical limitation, a novel CNT MEA
fabrication procedure was proposed and exacted in Chapter 7. This procedure used a protective layer
deposited on the catalyst to improve the CNT adhesion, in addition to using SU-8 photoresist as the
passivation layer. Preliminary results demonstrated impedance responses roughly 6 times worse for the
novel functionalised CNT MEA compared to the functionalised CNT MEA fabricated in Chapter 5. Yet
the interfacial impedance was similar to the available commercial electrodes discussed in Chapter 5, at
1 kHz, using an electrode of similar geometric surface area. Subsequent to this result the MEAs
electrochemical response to dopamine and ascorbic acid was observed. Results showed complete peak
separation at both electrode sizes tested, indicating selectivity for dopamine against common
electrochemical interferents. Thus, even though the interfacial impedance for these novel CNT MEA
electrodes was higher than the other CNT MEAs fabricated, their ability to separate ascorbic acid and
dopamine signals appears to be much improved.
Overall, the work conducted in this project compares favourably with that available in the literature to
date, as has been discussed in each of the results chapters. The experiments on functionalisation of
CNTs reported full wetting of the CNTs with aqueous solutions, this is a 5° improvement on the best
result to date.50 Additionally, Raman spectroscopy measurements at various points along the vertical
CNT indicated that functionalisation via oxygen plasma is selective, i.e. only the top of the CNT is
functionalised. This observation has not yet been reported in the literature and could be an important
parameter to consider in applications that use functionalised CNTs. This information was used in the
fabrication of a functionalised CNT-based MEA which recorded an interfacial impedance of 2.75 ±0.19
kΩ at 1 kHz using a 20 µm diameter electrode, providing one of the lowest reported values compared
to the available literature (see Fig. 5.14). Finally, when investigating the electrochemical response to
dopamine using the same MEA, a sensitivity value of 9.48 µA µM-1 mm-2 was recorded for dopamine.
Again, this value is one of the best available compared to those in the literature (see Table 6.1), other
reports have observed increased sensitivities of almost three-fold, however these molecularly-imprinted
polymer systems require accumulation times of six minutes, thus limiting their applicability to real-time
measurements.116
Chapter 8 Conclusions & Future Work
131
8.1. Future Work
As a consequence of the results gained during this project, a number of investigations and future projects
could be undertaken. Chapter 4 detailed a rapid functionalisation technique capable of chemically
bonding a large proportion of oxygen functional groups onto CNT structures, using exposure times of
a few seconds to avoid etching of the CNTs. Future work may include investigating different exposure
times to find the optimum which produces the highest number of carboxylate groups, thus increasing
the density of negative charge on the CNT structure. Additionally, as CNTs have a relatively large
surface area, the number of potential bonding sites is high. Therefore, with a high number of carboxylate
groups available on the CNT structure it is possible for covalent bonds to be formed with available
amine groups (-NH2), such as those on proteins. This, in turn, can likely permit covalent bonding of
CNT structures on devices with proteins such as enzymes, allowing fabrication of devices such as
biological fuel cells on a large scale with a high density of enzymes.219
In terms of the functionalised CNT MEA fabricated and characterised in Chapters 5 & 6, the next
obvious step would be to investigate the response of biological samples, such as cell cultures or tissue
slices, using the MEA. The experiments initially should include measurements of biocompatibility, i.e.
is there a toxicological effect of using the MEA and does the exposure to biological samples affect the
MEA itself in any way. Subsequently, investigations of electrophysiological and electrochemical
responses at electrodes on the MEA could be undertaken, with the possibility of doing both
measurements during the same ‘experiment’ to observe any correlations between the results, i.e. does
the electrochemical pathway follow the electrophysiological one. This device’s lifetime will be limited,
however, due to the observed result of CNTs being removed from the electrode area over time.
This leads onto future experimental work that can be carried out on the novel functionalised CNT MEA
developed in Chapter 7. This MEA has demonstrated promising results in terms of interfacial
impedance and electrochemical selectivity towards dopamine and ascorbic acid. More extensive testing
to calculate the sensitivity of the electrode towards dopamine, in addition to other electrochemical
interferents, would be important. As this MEA has ‘wells’ above the electrode, i.e. the passivation layer
is taller than the CNT electrodes, it would most likely be suited to cell culture experiments as the cells
could ‘drop’ into the wells. Moreover, as there are a number of electrodes present on the same device,
this design could be used for ‘lab-on-a-chip’ experiments. This would include functionalising various
electrodes with different selective biomaterials, i.e. enzymes, potentially allowing selective detection
of a large number of biomolecules on a single device. This could be performed by using electrophoretic
deposition of enzymes, a technique that has been used to generate dense packing of enzymes onto
substrates.220

Chapter 8 Conclusions & Future Work
132
Lastly, printing of conductive electrodes is an ever-expanding area of interest with regards to
electrochemical detection. Due to the nature of the printing technique it is possible to deposit material
at specific locations on a substrate, in this case on the electrodes of a MEA. CNTs have been screen-
printed, contact-printed, as well as ink-jet printed to produce electrodes in pre-defined areas.131,221,222
These have in turn been used for electrochemical detection of a number of molecules, including
dopamine and glucose, indicating the possible suitability of using printed CNTs for this application.
8.2. Summary
This final part of this conclusion will attempt to examine the suitability of CNTs, in particular CNT
MEAs, for electrochemical detection purposes. This begins with the fabrication procedure for PT-CVD
grown CNTs, which requires relatively high temperatures, therefore restricting the materials which can
be used. Common substrate and track materials for MEAs, or indeed other biological devices/sensors,
are borosilicate glass and indium tin-oxide, respectively. However, at the temperatures necessary for
CNT growth (between 400ᵒC & 1000ᵒC) borosilicate glass begins to deform and indium tin-oxide
conductivity dramatically reduces. This means these transparent materials cannot be used, thus silicon
and high-temperature resistant metals are needed, this is turn limits the final set-up capability where
any microscope work would need to be carried out in reflection mode. Nonetheless, these PT-CVD
grown CNTs have demonstrated one of the lowest reported interfacial impedance values available in
the literature to date, thus the necessary requirements for the final measurements should be taken into
consideration for any future MEA device designs.
Another important consideration during the fabrication procedure is the wettability of the electrode
material with the solution. Good wettability can improve the access to areas of the material, increasing
the area of the electrode available to the solution.27 This has been particularly well studied with graphene
and CNTs, which are inherently hydrophobic, but through functionalisation procedures can be modified
to become hydrophilic. Here, oxygen plasma functionalisation has been proven to permit full wetting
of CNTs in aqueous solutions, therefore allowing a substantial amount of CNT structure to be accessed
for measurements. This rapid, low cost, and relatively environmentally friendly procedure generates a
hydrophilic material capable of good quality signal recording, with a potential for biocompatibility.51
Thus, currently it is unlikely that there is a functionalisation technique capable of the same output with
such simplicity, indicating its potential for large scale use.
Finally, we examine the potential for CNT-based MEAs to confidently measure electrochemical signals
with biological significance. Currently, electrochemical detection of neurotransmitters is the only way
to generate real-time tonic and phasic measurements. Other techniques which provide high selectivity
and sensitivity, such as spectroelectrochemistry, can be performed on samples taken from the brain but

Chapter 8 Conclusions & Future Work
133
not performed in real-time. Carbon fibre electrodes, which are commonly used, can record from a single
position whereas MEAs have the potential for multi-site detection, as has been clearly demonstrated by
electrophysiology recordings.2 The primary challenge with using MEAs for electrochemical detection
is likely to be the different calibration curves that may be necessary for each electrode. If highly
consistent electrodes can be fabricated there is substantial potential for electrochemical MEAs to
become an integral research tool.
Conclusively, this thesis demonstrates key advantages of using an oxygen plasma functionalised CNT
MEA system for electrochemical detection of dopamine. These advantages include low interfacial
impedance for potential electrophysiological detection, in addition to high sensitivity/selectivity and
low detection limits for electrochemical detection of dopamine. Future work must focus on determining
the biocompatibility of such a device, in addition to proving its ability to measure in situ or in vitro
signals. If these experiments are successful, it is likely that CNT based MEAs could become an
invaluable tool for electrochemical detection of electroactive neurotransmitters.

Chapter 9 References
134
Chapter 9 – References
1. MED Probe MEA. 1–3 (2015). Available at: http://www.med64.com/products/med-probe-mea/.
(Accessed: 25th March 2016)
2. Chen, Y., Menendez-roche, N. & Sher, E. Differential Modulation by the GABA B Receptor
Allosteric Potentiator 2,6-Di-tert-butyl-4-(3-hydroxy-2,2-dimethylpropyl)- phenol (CGP7930 )
of Synaptic Transmission in the Rat Hippocampal CA1 Area. J. Pharmacol. Exp. Ther. 317,
1170–1177 (2006).
3. What is a synapse? 1–4 (2016). Available at: http://cargocollective.com/synapses/what-is-a-
synapse. (Accessed: 25th March 2016)
4. Boncel, S., Walczak, K. Z. & Koziol, K. Dynamics of capillary infiltration of liquids into a
highly aligned multi-walled carbon nanotube film. Beilstein J. Nanotechnol. 2, 311–7 (2011).
5. Tawfick, S. et al. Mechanics of capillary forming of aligned carbon nanotube assemblies.
Langmuir 29, 5190–8 (2013).
6. Poland, C. a et al. Carbon nanotubes introduced into the abdominal cavity of mice show
asbestos-like pathogenicity in a pilot study. Nat. Nanotechnol. 3, 423–8 (2008).
7. Kroto, H., Heath, J., O’Brien, S., Curl, R. & Smalley, R. C60: Buckminsterfullerene. Nature
318, 162–163 (1985).
8. Iijima, S. Helical microtubules of graphitic carbon. Nature 354, 56–58 (1991).
9. Monthioux, M. & Kuznetsov, V. L. Who should be given the credit for the discovery of carbon
nanotubes? Carbon N. Y. 44, 1621–1623 (2006).
10. Iijima, S. & Ichihashi, T. Single-shell carbon nanotubes of 1-nm diameter. Nature 363, 603–605
(1993).
11. Bethune, D. S. et al. cobalt-catalysed growth of carbon nanotubes with single-atomic-layer-
walls. Nature 363, 605–607 (1993).
12. Dresselhaus, M. S. in Carbon Filaments and Nanotubes: Common Origins, Differing
Applications? (eds. Biro, L., Bernardo, C., Tibbetts, G. & Lambin, P.) 11–51 (Kluwer Academic
Publishers, 2001).
13. Saito, R., Hofmann, M., Dresselhaus, G., Jorio, a. & Dresselhaus, M. S. Raman spectroscopy

Chapter 9 References
135
of graphene and carbon nanotubes. Adv. Phys. 60, 413–550 (2011).
14. Terrones, M. Science and Technology of the Twenty-First Century: Synthesis, Properties, and
Applications of Carbon Nanotubes. Annu. Rev. Mater. Res. 33, 419–501 (2003).
15. Dresselhaus, M. S., Dresselhaus, G., Charlier, J. C. & Hernández, E. Electronic, thermal and
mechanical properties of carbon nanotubes. Philos. Trans. A. Math. Phys. Eng. Sci. 362, 2065–
98 (2004).
16. Dresselhaus, M. S., Dresselhaus, G., Saito, R. & Jorio, a. Raman spectroscopy of carbon
nanotubes. Phys. Rep. 409, 47–99 (2005).
17. Scarselli, M., Castrucci, P. & De Crescenzi, M. Electronic and optoelectronic nano-devices
based on carbon nanotubes. J. Phys. Condens. Matter 24, 313202 (2012).
18. Popov, V. Carbon nanotubes: properties and application. Mater. Sci. Eng. R Reports 43, 61–102
(2004).
19. Fonseca, A. & Nagy, J. in Carbon Filaments and Nanotubes: Common Origins, Differing
Applications? (eds. Biro, L., Bernardo, C., Tibbetts, G. & Lambin, P.) 75–84 (Kluwer Academic
Publishers, 2001).
20. Konya, Z. in Carbon Filaments and Nanotubes: Common Origins, Differing Applications? (eds.
Biro, L., Bernardo, C., Tibbetts, G. & Lambin, P.) 85–109 (Kluwer Academic Publishers, 2001).
21. Tessonnier, J.-P. & Su, D. S. Recent progress on the growth mechanism of carbon nanotubes: a
review. ChemSusChem 4, 824–47 (2011).
22. Roy, S. et al. Diameter control of single wall carbon nanotubes synthesized using chemical vapor
deposition. Appl. Surf. Sci. 321, 70–79 (2014).
23. Chen, J.-S., Stolojan, V. & Silva, S. R. P. Towards type-selective carbon nanotube growth at
low substrate temperature via photo-thermal chemical vapour deposition. Carbon N. Y. 84, 409–
418 (2015).
24. Picher, M. et al. Influence of the growth conditions on the defect density of single-walled carbon
nanotubes. Carbon N. Y. 50, 2407–2416 (2012).
25. Hata, K. et al. Water-assisted highly efficient synthesis of impurity-free single-walled carbon
nanotubes. Science 306, 1362–4 (2004).
26. Ahmad, M., Anguita, J., Stolojan, V., Carey, D. & Silva, S. R. P. Efficient Coupling of Optical
Energy for Rapid Catalyzed Nanomaterial Growth: High-Quality Carbon Nanotube Synthesis at
Low Substrate Temperatures. ACS Appl. Mater. Interfaces 5, 3861–3866 (2013).

Chapter 9 References
136
27. Fung, A. O. et al. Electrochemical properties and myocyte interaction of carbon nanotube
microelectrodes. Nano Lett. 10, 4321–7 (2010).
28. Heister, E. et al. Triple functionalisation of single-walled carbon nanotubes with doxorubicin, a
monoclonal antibody, and a fluorescent marker for targeted cancer therapy. Carbon N. Y. 47,
2152–2160 (2009).
29. Javey, A., Guo, J., Wang, Q., Lundstrom, M. & Dai, H. Ballistic carbon nanotube field-effect
transistors. Nat. Lett. 424, 7–10 (2003).
30. White, C. & Todorov, T. Carbon nanotubes as long ballistic conductors. Nature 393, 240–242
(1998).
31. Durkop, T., Getty, S., Cobas, E. & Fuhrer, M. Extraordinary Mobility in Semiconducting Carbon
Nanotubes. Nano Lett. 4, 35–39 (2004).
32. Wei, B. Q., Vajtai, R. & Ajayan, P. M. Reliability and current carrying capacity of carbon
nanotubes. Appl. Phys. Lett. 79, 1172 (2001).
33. Dabera, G. D. M. R. et al. Hybrid carbon nanotube networks as efficient hole extraction layers
for organic photovoltaics. ACS Nano 7, 556–65 (2013).
34. Zanin, H., Saito, E., Ceragioli, H. J., Baranauskas, V. & Corat, E. J. Reduced graphene oxide
and vertically aligned carbon nanotubes superhydrophilic films for supercapacitors devices.
Mater. Res. Bull. 49, 487–493 (2014).
35. Su, Y. & Zhitomirsky, I. Asymmetric electrochemical supercapacitor, based on polypyrrole
coated carbon nanotube electrodes. Appl. Energy 153, 48–55 (2015).
36. Wu, Y. et al. Sensing epinephrine with an ITO electrode modified with an imprinted chitosan
film containing multi-walled carbon nanotubes and a polymerized ionic liquid. Microchim. Acta
180, 1325–1332 (2013).
37. Treacy, M., Ebbesen, T. & Gibson, J. Exceptionally high Young’s modulus observed for
individual carbon nanotubes. Nature 381, 678–680 (1996).
38. Lu, J. Elastic Properties of Carbon Nanotubes and Nanoropes. Phys. Rev. Lett. 79, 1297–1300
(1997).
39. Iijima, S., Brabec, C., Maiti, A. & Bernholc, J. Structural flexibility of carbon nanotubes. J.
Chem. Phys. 104, 2089 (1996).
40. Pozegic, T. R. et al. Low temperature growth of carbon nanotubes on carbon fibre to create a
highly networked fuzzy fibre reinforced composite with superior electrical conductivity. Carbon
N. Y. 74, 319–328 (2014).

Chapter 9 References
137
41. Konsta-Gdoutos, M. S., Metaxa, Z. S. & Shah, S. P. Highly dispersed carbon nanotube
reinforced cement based materials. Cem. Concr. Res. 40, 1052–1059 (2010).
42. Wu, H.-C., Chang, X., Liu, L., Zhao, F. & Zhao, Y. Chemistry of carbon nanotubes in
biomedical applications. J. Mater. Chem. 20, 1036 (2010).
43. King, S. G., McCafferty, L., Stolojan, V. & Silva, S. R. P. Highly aligned arrays of super resilient
carbon nanotubes by steam purification. Carbon N. Y. 84, 130–137 (2015).
44. Zheng, D., Ye, J. & Zhang, W. Some Properties of Sodium Dodecyl Sulfate Functionalized
Multiwalled Carbon Nanotubes Electrode and Its Application on Detection of Dopamine in the
Presence of Ascorbic Acid. Electroanalysis 20, 1811–1818 (2008).
45. Neves, V. et al. Cellular localization, accumulation and trafficking of double-walled carbon
nanotubes in human prostate cancer cells. Nano Res. 5, 223–234 (2012).
46. Lamprecht, C. et al. AFM imaging of functionalized carbon nanotubes on biological
membranes. Nanotechnology 20, 434001 (2009).
47. Song, Y. et al. Label-free colorimetric detection of single nucleotide polymorphism by using
single-walled carbon nanotube intrinsic peroxidase-like activity. Chemistry 16, 3617–21 (2010).
48. Campbell, J., Tessmer, I., Thorp, H. & Erie, D. Atomic force microscopy studies of DNA-
wrapped carbon nanotube structure and binding to quantum dots. J. Am. Chem. Soc. 130, 10648–
10655 (2008).
49. Ramos, S. C. et al. Influence of polar groups on the wetting properties of vertically aligned
multiwalled carbon nanotube surfaces. Theor. Chem. Acc. 130, 1061–1069 (2011).
50. Ramos, S. C. et al. Wettability control on vertically-aligned multi-walled carbon nanotube
surfaces with oxygen pulsed DC plasma and CO2 laser treatments. Diam. Relat. Mater. 19, 752–
755 (2010).
51. Lobo, A. O. et al. Increasing mouse embryonic fibroblast cells adhesion on superhydrophilic
vertically aligned carbon nanotube films. Mater. Sci. Eng. C 31, 1505–1511 (2011).
52. Jan, E. et al. Layered carbon nanotube-polyelectrolyte electrodes outperform traditional neural
interface materials. Nano Lett. 9, 4012–8 (2009).
53. Heister, E. et al. Higher Dispersion Efficacy of Functionalized Carbon Nanotubes in Chemical
and Biological Environments. ACS Nano 4, 2615–2626 (2010).
54. Agüí, L., Yáñez-Sedeño, P. & Pingarrón, J. M. Role of carbon nanotubes in electroanalytical

Chapter 9 References
138
chemistry: a review. Anal. Chim. Acta 622, 11–47 (2008).
55. Liu, J., Chou, A., Rahmat, W., Paddon-Row, M. & Gooding, J. Achieving Direct Electrical
Connection to Glucose Oxidase Using Aligned Single Walled Carbon Nanotube Arrays.
Electroanalysis 17, 38–46 (2005).
56. Ali Kamyabi, M., Hajari, N., Turner, A. P. F. & Tiwari, A. A high-performance glucose
biosensor using covalently immobilised glucose oxidase on a poly(2,6-diaminopyridine)/carbon
nanotube electrode. Talanta 116, 801–8 (2013).
57. Moumene, M., Rochefort, D. & Mohamedi, M. Electrochemical Functionalization as a
Promising Avenue for Glucose Oxidase Immobilization at Carbon Nanotubes: Enhanced Direct
Electron Transfer. Int. J. Electrochem. Sci. 8, 2009–2022 (2013).
58. Njagi, J., Chernov, M. M., Leiter, J. C. & Andreescu, S. Amperometric detection of dopamine
in vivo with an enzyme based carbon fiber microbiosensor. Anal. Chem. 82, 989–96 (2010).
59. Wisitsoraat, A. et al. High sensitivity electrochemical cholesterol sensor utilizing a vertically
aligned carbon nanotube electrode with electropolymerized enzyme immobilization. Sensors
(Basel). 9, 8658–68 (2009).
60. Qian, L. & Yang, X. Composite film of carbon nanotubes and chitosan for preparation of
amperometric hydrogen peroxide biosensor. Talanta 68, 721–7 (2006).
61. Cabral, M. F., Sgobbi, L. F., Kataoka, E. M. & Machado, S. a S. On the behavior of
acetylcholinesterase immobilized on carbon nanotubes in the presence of inhibitors. Colloids
Surf. B. Biointerfaces 111C, 30–35 (2013).
62. Gehr, P., Brain, J., Nemoto, I. & Bloom, S. Behavior of magnetic particles in hamster lungs:
estimates of clearance and cytoplasmic motility. J. Appl. Physiol. 55, 1196–1202 (1983).
63. Donaldson, K., Beswick, P. H. & Gilmour, P. S. Free radical activity associated with the surface
of particles: a unifying factor in determining biological activity? Toxicol. Lett. 88, 293–298
(1996).
64. Oberdorster, G., Ferin, J. & Lehnert, B. E. Correlation between Particle Size, In Vivo Particle
Persistence, and Lung Injury. Environ. Health Perspect. 173–179 (1994).
65. Carlson, C. et al. Unique Cellular Interaction of Silver Nanoparticles: Size-Dependent
Generation of Reactive Oxygen Species. J. Phys. Chem. B 112, 13608–13619 (2008).
66. Napierska, D. et al. Size-dependent cytotoxicity of monodisperse silica nanoparticles in human
endothelial cells. Small 5, 846–53 (2009).
67. Pan, Y. et al. Size-dependent cytotoxicity of gold nanoparticles. Small 3, 1941–9 (2007).

Chapter 9 References
139
68. De Jong, W. H. et al. Particle size-dependent organ distribution of gold nanoparticles after
intravenous administration. Biomaterials 29, 1912–9 (2008).
69. Nel, A. et al. Nanomaterial Toxicity Testing in the 21st Century : Use of a Predictive
Toxicological Approach and High-Throughput Screening. Acc. Chem. Res. 46, 607–621 (2013).
70. Krug, H. F. Nanosafety research--are we on the right track? Angew. Chem. Int. Ed. Engl. 53,
12304–19 (2014).
71. Donaldson, K. et al. Carbon nanotubes: a review of their properties in relation to pulmonary
toxicology and workplace safety. Toxicol. Sci. 92, 5–22 (2006).
72. Muller, J. et al. Structural defects play a major role in the acute lung toxicity of multiwall carbon
nanotubes: toxicological aspects. Chem. Res. Toxicol. 21, 1698–1705 (2008).
73. Ma-Hock, L., Treumann, S., Strauss, V. & Landsiedel, R. Inhalation toxicity of multi-wall
carbon nanotubes in rats exposed for 3 months. Toxicol. Sci. 112, 468–481 (2009).
74. Shvedova, A. A. et al. Inhalation vs. aspiration of single-walled carbon nanotubes in C57BL/6
mice: inflammation, fibrosis, oxidative stress, and mutagenesis. Am. J. Physiol. Lung Cell Mol.
Physiol. 26505, 552–565 (2008).
75. Mercer, R. R. et al. Extrapulmonary transport of MWCNT following inhalation exposure. Part.
Fibre Toxicol. 10, (2013).
76. Sargent, L. M. et al. Promotion of lung adenocarcinoma following inhalation exposure to multi-
walled carbon nanotubes. Part. Fibre Toxicol. 11, 1–18 (2014).
77. Christou, A., Stec, A. a, Ahmed, W., Aschberger, K. & Amenta, V. A review of exposure and
toxicological aspects of carbon nanotubes, and as additives to fire retardants in polymers. Crit.
Rev. Toxicol. 46, 74–95 (2016).
78. Mercer, R. R. et al. Distribution and fibrotic response following inhalation exposure to multi-
walled carbon nanotubes. Part. Fibre Toxicol. 10, (2013).
79. Erdely, A. et al. Carbon nanotube dosimetry: from workplace exposure assessment to inhalation
toxicology. Part. Fibre Toxicol. 10, 1–14 (2013).
80. Dong, H., Zhu, Z., Ju, H. & Yan, F. Triplex signal amplification for electrochemical DNA
biosensing by coupling probe-gold nanoparticles-graphene modified electrode with enzyme
functionalized carbon sphere as tracer. Biosens. Bioelectron. 33, 228–32 (2012).
81. Xu, Y. et al. Unraveling the Role of Hydrogen Peroxide in α-Synuclein Aggregation Using an

Chapter 9 References
140
Ultrasensitive Nanoplasmonic Probe. Anal. Chem. 87, 1968–73 (2015).
82. Howes, P. D., Chandrawati, R. & Stevens, M. M. Colloidal nanoparticles as advanced biological
sensors. Science (80-. ). 346, 53–63 (2014).
83. Liu, Y. et al. Development of gold nanoparticle-sheathed glass capillary nanoelectrodes for
sensitive detection of cerebral dopamine. Biosens. Bioelectron. 63, 262–8 (2015).
84. Elghanian, R., Storhoff, J., Mucic, R., Letsinger, R. L. & Mirkin, C. A. Selective colorimetric
detection of polynucleotides based on the distance-dependent optical properties of gold
nanoparticles. Science (80-. ). 277, 1078–1081 (1997).
85. Nam, J., Thaxton, C. & Mirkin, C. Nanoparticle-based bio-bar codes for the ultrasensitive
detection of proteins. Science (80-. ). 301, 1884–1887 (2003).
86. Georganopoulou, D. et al. Nanoparticle-based detection in cerebral spinal fluid of a soluble
pathogenic biomarker for Alzheimer’s disease. Proc. Natl. Acad. Sci. U. S. A. 102, 2273–2276
(2005).
87. Wang, J. & Qu, X. Recent progress in nanosensors for sensitive detection of biomolecules.
Nanoscale 5, 3589–3600 (2013).
88. Li, H. & Rothberg, L. Colorimetric detection of DNA sequences based on electrostatic
interactions with unmodified gold nanoparticles. Proc. Natl. Acad. Sci. U. S. A. 101, 14036–
14039 (2004).
89. Xie, X., Xu, W., Li, T. & Liu, X. Colorimetric detection of HIV-1 ribonuclease H activity by
gold nanoparticles. Small 7, 1393–6 (2011).
90. Xie, J. et al. Manipulating the Power of an Additional Phase: A Flower-like Au− Fe3O4 Optical
Nanosensor for Imaging Protease Expressions In vivo. ACS Nano 5, 3043–3051 (2011).
91. Kim, J., Cote, L., Kim, F. & Huang, J. Visualizing graphene based sheets by fluorescence
quenching microscopy. J. Am. Chem. Soc. 260–267 (2009).
92. Chien, C.-T. et al. Tunable photoluminescence from graphene oxide. Angew. Chem. Int. Ed.
Engl. 51, 6662–6 (2012).
93. Wang, X. et al. Ultrasensitive and Selective Detection of a Prognostic Indicator in Early-Stage
Cancer Using Graphene Oxide and Carbon Nanotubes. Adv. Funct. Mater. 20, 3967–3971
(2010).
94. Wang, Y., Li, Z., Hu, D. & Lin, C. Aptamer/graphene oxide nanocomplex for in situ molecular
probing in living cells. J. Am. Chem. Soc. 9274–9276 (2010).

Chapter 9 References
141
95. Tang, Z. et al. Constraint of DNA on functionalized graphene improves its biostability and
specificity. Small 6, 1205–9 (2010).
96. Jung, J. H., Cheon, D. S., Liu, F., Lee, K. B. & Seo, T. S. A graphene oxide based immuno-
biosensor for pathogen detection. Angew. Chem. Int. Ed. Engl. 49, 5708–11 (2010).
97. Liu, Y., Dong, X. & Chen, P. Biological and chemical sensors based on graphene materials.
Chem. Soc. Rev. 41, 2283–307 (2012).
98. Cao, Y., Jin, R. & Mirkin, C. Nanoparticles with Raman spectroscopic fingerprints for DNA and
RNA detection. Science (80-. ). 297, 1536–1541 (2002).
99. Bonanni, A., Ambrosi, A. & Pumera, M. Nucleic acid functionalized graphene for biosensing.
Chemistry 18, 1668–73 (2012).
100. Giovanni, M., Bonanni, A. & Pumera, M. Detection of DNA hybridization on chemically
modified graphene platforms. Analyst 137, 580–3 (2012).
101. Bonanni, A. & Pumera, M. Graphene platform for hairpin-DNA-based impedimetric
genosensing. ACS Nano 2356–2361 (2011).
102. Roy, S. et al. Graphene oxide for electrochemical sensing applications. J. Mater. Chem. 21,
14725 (2011).
103. Kandel, E. & Siegelbaum, S. in Principles of Neural Science (eds. Kandel, E., Schwartz, J. &
Jessel, T.) 175–185 (McGraw-Hill Companies, 2000).
104. Fuxe, K., Manger, P., Genedani, S. & Agnati, L. The nigrostriatal DA pathway and Parkinson’s
disease. J. Neural Transm. S70, 71–83 (2006).
105. Neurons, Brain Chemistry, and Neurotransmission. National Institute of Health 1–10 Available
at: https://science.education.nih.gov/supplements/nih2/addiction/guide/lesson2-1.html.
(Accessed: 30th January 2016)
106. Luo, H., Shi, Z., Li, N., Gu, Z. & Zhuang, Q. Investigation of the electrochemical and
electrocatalytic behavior of single-wall carbon nanotube film on a glassy carbon electrode. Anal.
Chem. 73, 915–20 (2001).
107. Wu, K., Fei, J. & Hu, S. Simultaneous determination of dopamine and serotonin on a glassy
carbon electrode coated with a film of carbon nanotubes. Anal. Biochem. 318, 100–106 (2003).
108. Zhang, P., Wu, F.-H., Zhao, G.-C. & Wei, X.-W. Selective response of dopamine in the presence
of ascorbic acid at multi-walled carbon nanotube modified gold electrode. Bioelectrochemistry
67, 109–14 (2005).
Chapter 9 References
142
109. Gao, F. et al. Highly sensitive and selective detection of dopamine in the presence of ascorbic
acid at graphene oxide modified electrode. Sensors Actuators B Chem. 186, 380–387 (2013).
110. Zhang, Z., Yan, J., Jin, H. & Yin, J. Tuning the reduction extent of electrochemically reduced
graphene oxide electrode film to enhance its detection limit for voltammetric analysis.
Electrochim. Acta 139, 232–237 (2014).
111. Yang, L., Liu, D., Huang, J. & You, T. Simultaneous determination of dopamine, ascorbic acid
and uric acid at electrochemically reduced graphene oxide modified electrode. Sensors
Actuators B Chem. 193, 166–172 (2014).
112. Zheng, S., Huang, Y., Cai, J. & Guo, Y. Nano-Copper-MWCNT-Modified Glassy Carbon
Electrode for Selective Detection of Dopamine. Int. J. Electrochem. Sci. 8, 12296–12307 (2013).
113. Jiang, L.-C. & Zhang, W.-D. Electroanalysis of Dopamine at RuO2 Modified Vertically Aligned
Carbon Nanotube Electrode. Electroanalysis 21, 1811–1815 (2009).
114. Teymourian, H., Salimi, A., Firoozi, S., Korani, A. & Soltanian, S. One-pot hydrothermal
synthesis of zirconium dioxide nanoparticles decorated reduced graphene oxide composite as
high performance electrochemical sensing and biosensing platform. Electrochim. Acta 143,
196–206 (2014).
115. Song, W., Chen, Y., Xu, J., Yang, X.-R. & Tian, D.-B. Dopamine sensor based on molecularly
imprinted electrosynthesized polymers. J. Solid State Electrochem. 14, 1909–1914 (2010).
116. Liu, B., Lian, H., Yin, J. & Sun, X. Dopamine molecularly imprinted electrochemical sensor
based on graphene–chitosan composite. Electrochim. Acta 75, 108–114 (2012).
117. Swamy, B. E. K. & Venton, B. J. Carbon nanotube-modified microelectrodes for simultaneous
detection of dopamine and serotonin in vivo. Analyst 132, 876–84 (2007).
118. Xiang, L., Lin, Y., Yu, P., Su, L. & Mao, L. Laccase-catalyzed oxidation and intramolecular
cyclization of dopamine: A new method for selective determination of dopamine with
laccase/carbon nanotube-based electrochemical biosensors. Electrochim. Acta 52, 4144–4152
(2007).
119. Chefer, V., Thompson, A., Zapata, A. & Shippenberg, T. Overview of brain microdialysis. Curr.
Protoc. Neurosci. 1–35 (2009).
120. Chatterjee, D. & Gerlai, R. High precision liquid chromatography analysis of dopaminergic and
serotoninergic responses to acute alcohol exposure in zebrafish. Behav. Brain Res. 200, 208–
213 (2009).
121. Waters. How Does High Performance Liquid Chromatography Work? 1 (2015). Available at:
http://www.waters.com/waters/en_GB/How-Does-High-Performance-Liquid-
Chromatography-Work?/nav.htm?cid=10049055&locale=en_GB. (Accessed: 27th November

Chapter 9 References
143
2015)
122. Bucher, E. S. & Wightman, R. M. Electrochemical Analysis of Neurotransmitters. Annu. Rev.
Anal. Chem. (Palo Alto. Calif). 8, 239–61 (2015).
123. Belle, A. M., Owesson-White, C., Herr, N. R., Carelli, R. M. & Wightman, R. M. Controlled
iontophoresis coupled with fast-scan cyclic voltammetry/electrophysiology in awake, freely
moving animals. ACS Chem. Neurosci. 4, 761–71 (2013).
124. Swamy, B. & Venton, B. Subsecond detection of physiological adenosine concentrations using
fast-scan cyclic voltammetry. Anal. Chem. 79, 744–750 (2007).
125. Robinson, D., Venton, J., Heien, M. & Wightman, M. Detecting subsecond dopamine release
with fast-scan cyclic voltammetry in vivo. Clin. Chem. 1773, 1763–1773 (2003).
126. Schmidt, A. C., Wang, X., Zhu, Y. & Sombers, L. a. Carbon Nanotube Yarn Electrodes for
Enhanced Detection of Neurotransmitter Dynamics in Live Brain Tissue. ACS Nano 7864–7873
(2013). doi:10.1021/nn402857u
127. Robinson, D. a. The electrical properties of metal microelectrodes. Proc. IEEE 56, 1065–1071
(1968).
128. Hamann, C. H., Hamnett, A. & Vielstich, W. in Electrochemistry 115–133 (Wiley-VCH, 2007).
129. Suzuki, I., Fukuda, M., Shirakawa, K., Jiko, H. & Gotoh, M. Carbon nanotube multi-electrode
array chips for noninvasive real-time measurement of dopamine, action potentials, and
postsynaptic potentials. Biosens. Bioelectron. 49, 270–5 (2013).
130. Chen, C.-H. et al. Hydrophilic modification of neural microelectrode arrays based on multi-
walled carbon nanotubes. Nanotechnology 21, 485501 (2010).
131. Fuchsberger, K. et al. Multiwalled carbon-nanotube-functionalized microelectrode arrays
fabricated by microcontact printing: platform for studying chemical and electrical neuronal
signaling. Small 7, 524–30 (2011).
132. Zhu, C. & Dong, S. Energetic Graphene-Based Electrochemical Analytical Devices in Nucleic
Acid, Protein and Cancer Diagnostics and Detection. Electroanalysis 26, 14–29 (2014).
133. Qiang, L., Vaddiraju, S., Rusling, J. F. & Papadimitrakopoulos, F. Highly sensitive and reusable
Pt-black microfluidic electrodes for long-term electrochemical sensing. Biosens. Bioelectron.
26, 682–8 (2010).
134. Kim, R. & Nam, Y. Electrochemical layer-by-layer approach to fabricate mechanically stable
platinum black microelectrodes using a mussel-inspired polydopamine adhesive. J. Neural Eng.
12, 026010 (2015).

Chapter 9 References
144
135. Gabriel, G. et al. Easily made single-walled carbon nanotube surface microelectrodes for
neuronal applications. Biosens. Bioelectron. 24, 1942–8 (2009).
136. Chen, S. et al. PEDOT/MWCNT composite film coated microelectrode arrays for neural
interface improvement. Sensors Actuators A Phys. 193, 141–148 (2013).
137. Nick, C., Yadav, S., Joshi, R., Schneider, J. J. & Thielemann, C. A three-dimensional
microelectrode array composed of vertically aligned ultra-dense carbon nanotube networks.
Appl. Phys. Lett. 107, 013101 (2015).
138. Gabay, T. et al. Electro-chemical and biological properties of carbon nanotube based multi-
electrode arrays. Nanotechnology 18, 035201 (2007).
139. Wang, K., Fishman, H. a, Dai, H. & Harris, J. S. Neural stimulation with a carbon nanotube
microelectrode array. Nano Lett. 6, 2043–8 (2006).
140. Nick, C., Joshi, R., Schneider, J. J. & Thielemann, C. Three-dimensional carbon nanotube
electrodes for extracellular recording of cardiac myocytes. Biointerphases 7, 58 (2012).
141. Su, H.-C. et al. A cone-shaped 3D carbon nanotube probe for neural recording. Biosens.
Bioelectron. 26, 220–7 (2010).
142. Musa, S. et al. Bottom-up SiO2 embedded carbon nanotube electrodes with superior
performance for integration in implantable neural microsystems. ACS Nano 6, 4615–28 (2012).
143. Chen, Y.-C. et al. An active, flexible carbon nanotube microelectrode array for recording
electrocorticograms. J. Neural Eng. 8, 034001 (2011).
144. Lin, C.-M., Lee, Y.-T., Yeh, S.-R. & Fang, W. Flexible carbon nanotubes electrode for neural
recording. Biosens. Bioelectron. 24, 2791–7 (2009).
145. Piret, G. et al. 3D-nanostructured boron-doped diamond for microelectrode array neural
interfacing. Biomaterials 53, 173–83 (2015).
146. Hébert, C. et al. Microfabrication, characterization and in vivo MRI compatibility of diamond
microelectrodes array for neural interfacing. Mater. Sci. Eng. C 46, 25–31 (2015).
147. David-Pur, M., Bareket-Keren, L., Beit-Yaakov, G., Raz-Prag, D. & Hanein, Y. All-carbon-
nanotube flexible multi-electrode array for neuronal recording and stimulation. Biomed.
Microdevices 16, 43–53 (2014).
148. Patolsky, F., Zheng, G. & Lieber, C. Nanowire sensors for medicine and the life sciences.
Nanomedicine 1, 51–65 (2006).

Chapter 9 References
145
149. Patolsky, F. et al. Electrical detection of single viruses. Proc. Natl. Acad. Sci. U. S. A. 101,
14017–14022 (2004).
150. Cohen-Karni, T., Qing, Q., Li, Q., Fang, Y. & Lieber, C. M. Graphene and nanowire transistors
for cellular interfaces and electrical recording. Nano Lett. 10, 1098–102 (2010).
151. Duan, X. et al. Intracellular recordings of action potentials by an extracellular nanoscale field-
effect transistor. Nat. Nanotechnol. 7, 174–179 (2012).
152. Patolsky, F. et al. Detection, stimulation, and inhibition of neuronal signals with high-density
nanowire transistor arrays. Science 313, 1100–4 (2006).
153. Bernard, C., Ghestem, A., Ismailova, E., Herve, T. & Malliaras, G. G. In vivo recordings of
brain activity using organic transistors. Nat. Commun. 4, 1–7 (2013).
154. Spira, M. E. & Hai, A. Multi-electrode array technologies for neuroscience and cardiology. Nat.
Nanotechnol. 8, 83–94 (2013).
155. Robinson, J. T. et al. Vertical nanowire electrode arrays as a scalable platform for intracellular
interfacing to neuronal circuits. Nat. Nanotechnol. 7, 180–4 (2012).
156. Xie, C., Lin, Z., Hanson, L., Cui, Y. & Cui, B. Intracellular recording of action potentials by
nanopillar electroporation. Nat. Nanotechnol. 7, 185–90 (2012).
157. Hai, A., Shappir, J. & Spira, M. E. In-cell recordings by extracellular microelectrodes. Nat.
Methods 7, 200–2 (2010).
158. Ojovan, S. M. et al. A feasibility study of multi-site,intracellular recordings from mammalian
neurons by extracellular gold mushroom-shaped microelectrodes. Sci. Rep. 5, 14100 (2015).
159. Bakkum, D. J. et al. Tracking axonal action potential propagation on a high-density
microelectrode array across hundreds of sites. Nat. Commun. 4, 2181 (2013).
160. Braeken, D. et al. Open-cell recording of action potentials using active electrode arrays. Lab
Chip 12, 4397–402 (2012).
161. Huys, R. et al. Single-cell recording and stimulation with a 16k micro-nail electrode array
integrated on a 0.18 μm CMOS chip. Lab Chip 12, 1274–80 (2012).
162. Braeken, D. et al. Localized electrical stimulation of in vitro neurons using an array of sub-
cellular sized electrodes. Biosens. Bioelectron. 26, 1474–7 (2010).

Chapter 9 References
146
163. Wang, L. et al. Highly sensitive detection of quantal dopamine secretion from
pheochromocytoma cells using neural microelectrode array electrodeposited with polypyrrole
graphene. ACS Appl. Mater. Interfaces 7, 7619–26 (2015).
164. Lithography: Theory and Application of Photoresists, Developers, Solvents and Etchants.
(MicroChemicals, 2009).
165. Williams, K. R., Gupta, K. & Wasilik, M. Etch Rates for Micromachining Processing — Part II.
J. Microelectromechanical Syst. 12, 761–778 (2003).
166. Wang, F., Bertelsen, C., Skands, G., Pedersen, T. & Hansen, O. Reactive ion etching of polymer
materials for an energy harvesting device. Microelectron. Eng. 97, 227–230 (2012).
167. Teblum, E., Gofer, Y., Pint, C. L. & Nessim, G. D. Role of Catalyst Oxidation State in the
Growth of Vertically Aligned Carbon Nanotubes. J. Phys. Chem. C 116, 24522–24528 (2012).
168. Goldstein, J. et al. Scanning Electron Microscopy and X-ray Microanalysis. (Springer US,
2003).
169. Kopeliovich, D. Scanning Electron Microscope. SubsTech 1–2 (2012). Available at:
http://www.substech.com/dokuwiki/doku.php?id=scanning_electron_microscope. (Accessed:
13th February 2016)
170. McCafferty, L. et al. Decoration of multiwalled carbon nanotubes with protected iron
nanoparticles. Carbon N. Y. 84, 47–55 (2015).
171. Yuan, Y. & Lee, T. R. in Surface Science Techniques (eds. Bracco, G. & Holst, B.) 51, 3–34
(Springer Berlin Heidelberg, 2013).
172. Kimmo, L. Electron Spectroscopy (XPS, AES, UPS). Tampere University of Technology 1–2
(2012). Available at: http://www.tut.fi/en/about-tut/departments/optoelectronics-research-
centre/research/surface-science/electron-spectroscopy/index.htm. (Accessed: 13th February
2016)
173. Ferrari, A. C. & Basko, D. M. Raman spectroscopy as a versatile tool for studying the properties
of graphene. Nat. Nanotechnol. S1–S13 (2013). doi:10.1038/NNANO.2013.46
174. Dresselhaus, M. S., Jorio, A., Hofmann, M., Dresselhaus, G. & Saito, R. Perspectives on carbon
nanotubes and graphene Raman spectroscopy. Nano Lett. 10, 751–8 (2010).
175. Holze, R. in Experimental Electrochemistry (ed. Holze, R.) 77–85 (Wiley-VCH, 2009).
176. Lobo, A. O. et al. Fast functionalization of vertically aligned multiwalled carbon nanotubes
using oxygen plasma. Mater. Lett. 70, 89–93 (2012).

Chapter 9 References
147
177. Felten, A., Bittencourt, C., Pireaux, J. J., Van Lier, G. & Charlier, J. C. Radio-frequency plasma
functionalization of carbon nanotubes surface O[sub 2], NH[sub 3], and CF[sub 4] treatments.
J. Appl. Phys. 98, 074308 (2005).
178. van der Heide, P. in X-Ray Photoelectron Spectroscopy : An Introduction to Principles and
Practices (ed. van der Heide, P.) 1–12 (John Wiley & Sons, 2011).
179. Silva, T. A. et al. Electrochemical behaviour of vertically aligned carbon nanotubes and
graphene oxide nanocomposite as electrode material. Electrochim. Acta 119, 114–119 (2014).
180. Boudou, J., Paredes, J. & Cuesta, A. Oxygen plasma modification of pitch-based isotropic
carbon fibres. Carbon N. Y. 41, 41–56 (2003).
181. Ahmad, M. et al. High Quality Carbon Nanotubes on Conductive Substrates Grown at Low
Temperatures. Adv. Funct. Mater. 25, 4419–4429 (2015).
182. Dresselhaus, M. & Dresselhaus, G. Raman spectroscopy on isolated single wall carbon
nanotubes. Carbon N. Y. 40, 2043–2061 (2002).
183. Campos-Delgado, J. et al. Thermal stability studies of CVD-grown graphene nanoribbons:
Defect annealing and loop formation. Chem. Phys. Lett. 469, 177–182 (2009).
184. Zhao, Y. et al. Patch clamp technique: review of the current state of the art and potential
contributions from nanoengineering. Proc. Inst. Mech. Eng. Part N J. Nanoeng. Nanosyst. 222,
1–11 (2008).
185. Lillard, R. S., Kruger, J., Tait, W. S. & Moran, P. J. Using Local Electrochemical Impedance
Spectroscopy to Examine Coating Failure. Corros. Sci. 51, 251–259 (1994).
186. Liu, C., Bi, Q. & Matthews, A. EIS comparison on corrosion performance of PVD TiN and CrN
coated mild steel in 0.5 N NaCl aqueous solution. Corros. Sci. 43, 1953–1961 (2001).
187. Gui, F. & Kelly, R. G. Performance Assessment and Prediction of Corrosion Prevention
Compounds with Electrochemical Impedance Spectroscopy. Corros. Sci. 61, 119–129 (2005).
188. Wirth, C. T., Hofmann, S. & Robertson, J. Surface properties of vertically aligned carbon
nanotube arrays. Diam. Relat. Mater. 17, 1518–1524 (2008).
189. Bear, M., Connors, B. & Paradiso, M. Neuroscience: Exploring the Brain. (Lippincott Williams
& Wilkins, 2007).
190. Anguita, J. V. et al. Highly Transmissive Carbon Nanotube Forests Grown at Low Substrate
Temperature. Adv. Funct. Mater. 23, 5502–5509 (2013).

Chapter 9 References
148
191. James, C. D., Spence, A. J. H., Dowell-Mesfin, N. M. & Turner, J. N. Extracellular recordings
from patterned neuronal networks using planar microelectrode arrays. IEEE Trans. Biomed.
Eng. 51, 1640–1648 (2004).
192. Della, C. C., Kovacs, G. T. A. & Lewis, E. R. Multi-unit recording from regenerated bullfrog
eighth nerve using implantable silicon-substrate microelectrodes. J. Neurosci. Methods 72, 71–
86 (1997).
193. Keefer, E. W., Botterman, B. R., Romero, M. I., Rossi, A. F. & Gross, G. W. Carbon nanotube
coating improves neuronal recordings. Nat. Nanotechnol. 3, 434–9 (2008).
194. Nam, Y., Musick, K. & Wheeler, B. C. Application of a PDMS microstencil as a replaceable
insulator toward a single-use planar microelectrode array. Biomed. Microdevices 8, 375–81
(2006).
195. Takahashi, H. et al. Microelectrode Array on Folding Polyimide Ribbon for Epidural Mapping
of Functional Evoked Potentials. IEEE Trans. Biomed. Eng. 50, 510–516 (2003).
196. Dimaki, M. et al. Fabrication and characterization of 3D micro- and nanoelectrodes for neuron
recordings. Sensors (Basel). 10, 10339–55 (2010).
197. Márton, G., Bakos, I., Fekete, Z., Ulbert, I. & Pongrácz, A. Durability of high surface area
platinum deposits on microelectrode arrays for acute neural recordings. J. Mater. Sci. Mater.
Med. 25, 931–40 (2014).
198. Czeschik, A., Offenhäusser, A. & Wolfrum, B. Fabrication of MEA-based nanocavity sensor
arrays for extracellular recording of action potentials. Phys. Status Solidi 211, 1462–1466
(2014).
199. Gabriel, G. & Villa, R. Interface impedance improvement with carbon nanotubes. IFMBE Proc.
Vol. 17 296–299 (2007).
200. Owens, A., Denison, T., Versnel, H. & Shamma, S. Multi-electrode array for measuring evoked
potentials from surface of ferret primary auditory cortex. J. Neurosci. Methods 58, 209–220
(1995).
201. Zhang, C. et al. Implantable electrode array with platinum black coating for brain stimulation in
fish. Microsyst. Technol. 21, 139–145 (2013).
202. Kovacs, G., Storment, C. & Rosen, J. Regeneration microelectrode array for peripheral nerve
recording and stimulation. IEEE Trans. Biomed. Eng. 39, 893–902 (1992).
203. Kandel, E., Schwartz, J. & Jessel, T. Principles of Neural Science. (McGraw-Hill Companies,
2000).

Chapter 9 References
149
204. Soin, N., Roy, S. S., Sharma, S., Thundat, T. & McLaughlin, J. a. Electrochemical and oxygen
reduction properties of pristine and nitrogen-doped few layered graphene nanoflakes (FLGs). J.
Solid State Electrochem. 17, 2139–2149 (2013).
205. McCreery, R. L. Advanced carbon electrode materials for molecular electrochemistry. Chem.
Rev. 108, 2646–87 (2008).
206. Ng, A. M. H., Kenry, Teck Lim, C., Low, H. Y. & Loh, K. P. Highly sensitive reduced graphene
oxide microelectrode array sensor. Biosens. Bioelectron. 65C, 265–273 (2014).
207. Samba, R. et al. Application of PEDOT-CNT Microelectrodes for Neurotransmitter Sensing.
Electroanalysis 26, 548–555 (2014).
208. Maouche, N. et al. Molecularly imprinted polypyrrole films: Some key parameters for
electrochemical picomolar detection of dopamine. J. Electroanal. Chem. 685, 21–27 (2012).
209. Valentini, F., Amine, A., Orlanducci, S., Terranova, M. L. & Palleschi, G. Carbon nanotube
purification: preparation and characterization of carbon nanotube paste electrodes. Anal. Chem.
75, 5413–21 (2003).
210. Zhao, J. et al. Carbon nanotube nanoweb-bioelectrode for highly selective dopamine sensing.
ACS Appl. Mater. Interfaces 4, 44–8 (2012).
211. Huang, J., Liu, Y., Hou, H. & You, T. Simultaneous electrochemical determination of dopamine,
uric acid and ascorbic acid using palladium nanoparticle-loaded carbon nanofibers modified
electrode. Biosens. Bioelectron. 24, 632–7 (2008).
212. Tan, L. et al. Nanomolar detection of dopamine in the presence of ascorbic acid at β-
cyclodextrin/graphene nanocomposite platform. Electrochem. commun. 12, 557–560 (2010).
213. Wu, D. et al. Sensitive Electrochemical Sensor for Simultaneous Determination of Dopamine,
Ascorbic Acid, and Uric Acid Enhanced by Amino-group Functionalized Mesoporous Fe3O4
Graphene Sheets. Electrochim. Acta 116, 244–249 (2014).
214. Metz, S., Jiguet, S., Bertsch, A. & Renaud, P. Polyimide and SU-8 microfluidic devices
manufactured by heat-depolymerizable sacrificial material technique. Lab Chip 114–120
(2004).
215. Datta, M. Anodic dissolution of metals at high rates. IBM J. Res. Dev. 37, 207–226 (1993).
216. Dumée, L. F. et al. Small angle X-ray scattering study of carbon nanotube forests densified into
long range patterns by controlled solvent evaporation. J. Colloid Interface Sci. 407, 556–60
(2013).
217. Pint, C. et al. Investigation of optimal parameters for oxide-assisted growth of vertically aligned

Chapter 9 References
150
single-walled carbon nanotubes. J. Phys. Chem. C 113, 4125–4133 (2009).
218. Zhang, M., Gong, K., Zhang, H. & Mao, L. Layer-by-layer assembled carbon nanotubes for
selective determination of dopamine in the presence of ascorbic acid. Biosens. Bioelectron. 20,
1270–6 (2005).
219. Willner, I., Yan, Y.-M., Willner, B. & Tel-Vered, R. Integrated Enzyme-Based Biofuel Cells-A
Review. Fuel Cells 9, 7–24 (2009).
220. Ammam, M. Electrochemical and electrophoretic deposition of enzymes: principles, differences
and application in miniaturized biosensor and biofuel cell electrodes. Biosens. Bioelectron. 58,
121–31 (2014).
221. Lesch, A., Corts-Salazar, F., Amstutz, V., Tacchini, P. & Girault, H. H. Inkjet printed
nanohydrogel coated carbon nanotubes electrodes for matrix independent sensing. Anal. Chem.
87, 1026–1033 (2015).
222. Wang, J. & Musameh, M. Carbon nanotube screen-printed electrochemical sensors. Analyst 129,
1–2 (2004).