electrochemical detection of l-serine and l-phenylalanine
TRANSCRIPT

ORIGINAL
Electrochemical detection of L-serine and L-phenylalanineat bamboo charcoal–carbon nanosphere electrode
Mitali Saha • Soma Das
Received: 13 March 2014 / Accepted: 4 April 2014 / Published online: 23 April 2014
� The Author(s) 2014. This article is published with open access at Springerlink.com
Abstract A carbon nanosphere electrode (CN) has been
fabricated for the electrochemical detection of L-serine and
L-phenylalanine. Electrochemical behavior of amino acids
was investigated using cyclic voltammetry, differential
pulse voltammetry, square wave voltammetry and linear
sweep voltammetry. In optimal conditions, the peak current
of both amino acids on the CN electrode was found to
enhance greatly. A sensitive oxidation peak at 0.085 V was
observed in the determination of L-serine and 0.06 V for
L-phenylalanine. A linearity between the oxidation peak
current and the concentration of both amino acids was
obtained in the range of 1–100 lM (R2 = 0.99783 for
L-serine, 0.99618 for L-phenylalanine). The practical
application of the carbon nanosphere electrode in the
determination of the amino acids possesses high selectivity,
sensitivity and stability.
Keywords Carbon nanospheres � L-Serine �L-Phenylalanine
Introduction
L-Serine is an amino acid which contributes to several
bodily processes, most notably in the functioning of RNA
and DNA, formation of muscles, metabolism of fat/fatty
acids, and the maintenance of a healthy immune system.
L-Serine is also a component of cell membranes and is
vital for the neurotransmission process that takes part
between the brain and the various nerve endings in the
body [1]. A deficiency in serine manifests itself through
such symptoms as delayed cognitive and physical skills
and seizures. Under development of the brain may also be
traced to L-serine deficiency. In recent years, L-serine and
the products of its metabolism have been recognized not
only to be essential for cell proliferation, but also to be
necessary for specific functions in the central nervous
system [2].
L-Phenylalanine is an essential amino acid and used for
the biochemical formation of proteins, coded for DNA.
Phenylalanine is a precursor for tyrosine, the monoamine
signaling molecules dopamine, norepinephrine (noradren-
aline), and epinephrine (adrenaline), and the skin pigment
melanin. L-Phenylalanine is an antagonist at a2d Ca2?
calcium channels with a Ki of 980 nM [3]. At higher doses,
this may play a role in its analgesic and antidepressant
properties. Hyper-phenylalaninemia (HPA) serves as the
most common inherited disorder of amino acid metabolism
[4].
Amino acids are usually analyzed by liquid chromato-
graphic methods [5], FTIR studies [6], differential capac-
itance, radioactive indicators, solid-phase extraction, flow
injection [7, 8] electrochemiluminescence [9]. These
methods are quite accurate, but they are dependent on
multi-step sample clean-up procedures and are therefore
relatively expensive and time consuming. For this reason,
there is an interest in developing faster, simpler and low-
cost procedures for amino acid analysis. In recent years,
electrochemical detection has gained prominence as a
sensitive and selective detection technique for the elec-
troactive compounds. Various electroanalytical methods
and sensors for the detection of amino acids have been
reported [10–14].
M. Saha � S. Das (&)
Department of Chemistry, National Institute of Technology,
Agartala 799055, Tripura, India
e-mail: [email protected]
M. Saha
e-mail: [email protected]
123
J Nanostruct Chem (2014) 4:102
DOI 10.1007/s40097-014-0102-5

In continuation of our earlier studies [15–19], we have
now reported the fabrication of a new L-serine and
L-phenylalanine biosensor based on carbon nanospheres
(CN), which was obtained by pyrolysis of bamboo. Elec-
trochemical studies have been carried out using cyclic
voltammetry (CV), differential pulse voltammetry (DPV),
square wave voltammetry (SWV) and linear sweep vol-
tammetry (LSV) for the detection of L-serine and L-phen-
ylalanine in phosphate buffer solution (PBS) at pH 6.8 and
7, respectively. The studies revealed that the nanosphere-
modified electrode showed excellent sensitivity, selectiv-
ity, high stability, low potential along with a fast response
towards the detection of these amino acids.
Experimental section
Reagents and apparatus
L-Serine, L-phenylalanine, sodium dihydrogen phosphate
(NaH2PO4) and disodium hydrogen phosphate (Na2HPO4)
and phosphoric acid (H3PO4) were purchased from Sigma
Aldrich. Pharmaceutical samples (Medett Products, India)
of L-serine and L-phenylalanine were used for real sample
analysis. All solutions were prepared with deionized water.
Bamboo was carbonized in muffle furnace (Tanco, PL
Tandon & Company). The structure and morphology of CN
were characterized by scanning electron microscope
(SEM) (Hitachi X650, Japan), transmission electron
microscope (TEM) (JEOL JEM 1400) and atomic force
microscopy (AFM) (afm ? Anasys). X-ray diffraction
(XRD) patterns were recorded with JSO ISO DEBYE-
FLEX 2002 model X-ray powder diffractometer. Electro-
chemical studies were performed using a mini potentiostat
(Dropsens lstat 100). Pocket-sized pH meter (HANNA
instrument) was used to maintain the pH of the sample
solution.
250 ml 0.1 M PBS (pH 7) was prepared by mixing
0.22 g of Na2HPO4 and 0.3 g of NaH2PO4 in 250 ml
deionized water and adjusted the pH by the addition of
H3PO4. The stock solution of 100 ml 10-3 M L-serine was
prepared by dissolving 0.010 g L-serine in 100 ml of PBS
(pH 6.8) and 100 ml 10-3 M L-phenylalanine was prepared
by dissolving 0.016 g of L-phenylalanine in 100 ml of PBS
(pH 7). Standard solutions were prepared by diluting the
stock solution in PBS by maintaining the pH. Deionized
water was used throughout this study.
Preparation, functionalization and characterization
of carbon nanospheres from bamboo (CN)
CN was prepared by our own reported method [16] by
carbonizing the pieces of bamboo at 600–650 �C under
insufficient flow of air in a muffle furnace. For purification,
carbon soot was collected in a thimble and then placed in a
soxhlet extractor for sequential purification with petroleum
ether, acetone, ethyl alcohol and finally with water.
Unburnt bamboo and other unwanted form of carbon can
be removed by this method. For functionalization, 250 ml
2 M HNO3 was mixed with the carbon soot and stirred for
several minutes and then kept undisturbed overnight. To
remove excess nitrate, it was then repeatedly dissolved in
water and then evaporated to dryness. Complete removal of
nitrate was confirmed by Griess’s test [20]. For further
purification, it was re-precipitated with alcohol and water.
It was then characterized by SEM, TEM, AFM, XRD.
Fabrication of CN electrode
As reported earlier [19], the CN electrode was designed
like the commercially available standard electrode
DS110CNT. It was fabricated on Teflon material contain-
ing three silver wires, where both working and counter
electrodes were made of CN and third silver wire was acted
as reference electrode. For the fabrication of the electrode,
polystyrene solution was first prepared in chloroform (9:1
ratio). Then, CN was mixed with polystyrene solution
using mechanical stirrer followed by sonication. A drop of
the slurry was then deposited as a very fine thin film on the
two silver wires, serving as working and counter elec-
trodes. The electrode has a dimension of
3.5 9 1.0 9 0.5 cm (length 9 width 9 height) and it was
ideal for working with 50 ll volume like the standard
electrode.
L-Serine and L-phenylalanine detection with fabricated
CN electrode
For the detection of L-serine, electrochemical studies such
as CV, DPV, and LSV studies were performed with the
sample solutions in phosphate buffer solution at CN elec-
trode and CV, SWV and LSV studies were performed for
L-phenylalanine detection. pH 6.8 was maintained for
L-serine detection and pH 7 was maintained for L-phenyl-
alanine detection. To optimize the conditions of electro-
chemical detection of both the amino acids at CN
electrode, effect of pH, scan rate, time interval were
studied in detail. Then, the linearity, detection limit, sen-
sitivity, reproducibility and stability of the sensor were also
investigated. To determine the selectivity of the sensor, the
effect of the presence of some small biomolecules on the
current responses of L-serine and L-phenylalanine at CN
electrode was evaluated under optimized experimental
conditions. The utility of the CN electrode was tested by
determining the amino acids in some pharmaceutical
samples.
102 Page 2 of 9 J Nanostruct Chem (2014) 4:102
123

Results and discussion
Characterizations of CN
As reported earlier [16], surface morphological studies
were done by SEM, TEM studies. Figure 1a shows the
SEM image of carbon nanospheres in the range of
300–600 nm. Figure 1b shows the TEM image of uni-
formly distributed carbon nanospheres and it clearly indi-
cates the formation of carbon nano particles of spherical
like structures. AFM image in Fig. 2a further confirms the
formation of carbon nanospheres. XRD pattern of CN
(Fig. 2b) shows two intensed peak at 25� and 44� which
were assigned for (002) and (001) reflections, respectively,
and confirms CN formation.
Effect of pH on the peak current of L-serine
and L-phenylalanine at CN electrode
Effect of solution pH on the oxidation of 10-5 M L-serine
and L-phenylalanine at CN-modified electrode was investi-
gated by LSV in the pH range from 6.5 to 8.5 by mixing
Na2HPO4, NaH2PO4 and H3PO4. Figure 3a, b show that
there is a gradual decrease of the oxidation peak current with
the increasing pH for both amino acids, beyond the value of
6.8 for L-serine and 7 for L-phenylalanine. I/lA vs. pH graph
shows that for L-serine, maximum peak current is observed
at pH 6.8 and for L-phenylalanine at pH 7. Therefore, the pH
6.8 and 7 were chosen for the subsequent analytical experi-
ments for L-serine and L-phenylalanine, respectively.
CV studies to determine the effect of scan rate
on the peak current and peak potential of L-serine
and L-phenylalanine at CN electrode
In both cases, CV studies were performed with 10-5 M
L-serine (pH 6.8) and L-phenylalanine (pH 7) solutions in
PBS at 100 mV s-1 on bare silver electrode (Blank)
(Fig. 4). No peak current was observed at the potential
range 0.05–0.09 V, which indicates that on bare silver
electrode no reactions took place.
The effect of the scan rate on the electrochemical
detection of L-serine and L-phenylalanine at the CN elec-
trode was investigated by voltammetric techniques.
Figure 5a, b displays the overlaps of cyclic voltagrams of
10-5 M L-serine (pH 6.8) and L-phenylalanine (pH 7.0),
respectively, at various scan rates in PBS, while the inset
shows the 3D representation of CVs. The current (I/lA) vs.
Fig. 1 a SEM image of carbon
nanospheres (CN), b TEM
image of carbon nanospheres
(CN)
Fig. 2 a AFM image of carbon
nanospheres (CN), b XRD
pattern of carbon nanospheres
(CN)
J Nanostruct Chem (2014) 4:102 Page 3 of 9 102
123

scan rate (m/mV s-1) plot, shown in the inset, exhibits a
linear relationship with R2 = 0.99589 for L-serine and
R2 = 0.99719 for L-phenylalanine.
The influence of scan rate was investigated within the
range of 50–140 mV s-1 for L-serine and 50–150 mV s-1
for L-phenylalanine. The linearity was observed over the
entire range of scan rates studied and it indicates that the
electrochemical kinetics reaction is adsorption controlled
[21]. Potential required for the detection of L-serine on CN
electrode was found to be 0.085 V and for L-phenylalanine
is 0.06 V.
DPV, LSV and SWV studies to determine the effect
of time interval on the peak current and peak potential
of L-serine and L-phenylalanine at CN electrode
Beside CV studies, other electrochemical studies were also
performed to check the nature of peak current and peak
potential and also to check the maximum accumulation
time for both the amino acids. Interestingly, it was
observed that sharp intense peaks were obtained without
changing the peak potential.
Figure 6a, b shows the DPV and LSV 2D and 3D plots
of 10-5 M L-serine at various time intervals (2–10 min)
and at 22 mV s-1 for DPV (t pulse = 0.07 s), 100 mV s-1
for LSV scan rate in PBS, maintaining the pH at 6.8. A
good linear relationship between current and the entire
range of time interval studied was observed in each case.
I=lA ¼ 4:22 þ 0:23 min; R2 ¼ 0:99438;
SD ¼ 0:089; N ¼ 5 DPVð Þ;
I=lA ¼ 1:28 þ 0:055 min; R2 ¼ 0:99589;
SD ¼ 0:018; N ¼ 5 LSVð Þ:
Figure 7a, b shows the SWV and LSV 2D and 3D plots
of 10-5 M L-phenylalanine in PBS (pH 7) with various
time intervals. For SWV studies, the frequency was
adjusted to 12 Hz and Eampl = 0.010 V and LSV was
performed at a scan rate of 100 mV s-1. For both SWV
and LSV, the studies were conducted up to 20 min and here
also, a good linear relationship between current and the
time interval was observed in each case.
I=lA ¼ 20:656 þ 0:536 min;R2 ¼ 0:99719;
SD ¼ 0:278;N ¼ 8 SWVð Þ
I=lA ¼ 20:426 þ 0:183 min; R2 ¼ 0:99822;
SD ¼ 0:070; N ¼ 10 LSVð Þ:
In each and every case, the peak current increases lin-
early with time up to a certain period of time, but when
these studies were conducted over a more extended time
interval range then there was a breakdown in the linearity
relationship which may be due to the stabilization of cur-
rent with time. Therefore, for 10-5 M L-serine and
L-phenylalanine, the maximum accumulation times, 10 and
20 min, respectively, were employed.
Linearity, detection limit, stability and sensitivity
of the L-serine and L-phenylalanine sensor
Figure 8a shows the CV of different concentrations of
L-serine at pH 6.8 and Fig. 8b shows the LSV of different
concentrations of L-phenylalanine in PBS at pH 7. As LSV
studies gave more intensed peak than CV in case of
Fig. 3 a Effect of solution pH
on the oxidation peak current of
10-5 M L-serine in PBS (pH
6.8) at 100 mV s-1. b Effect of
solution pH on the oxidation
peak current of 10-5 M
L-phenylalanine in PBS (pH 7)
at 100 mV s-1
Fig. 4 CVs of 10-5 M L-serine and L-phenylalanine at silver
electrode in PBS at 100 mV s-1 scan rate (blank)
102 Page 4 of 9 J Nanostruct Chem (2014) 4:102
123

L-phenylalanine, therefore LSV studies were performed for
LOD, sensitivity determination. Both the figures showed that
the current increases linearly with the increase of concentra-
tions of L-serine and L-phenylalanine. Calibration plots (inset)
showed a linear dependence of the anodic peak current of
concentrations in range of 1–100 lM in both the cases.
I=lA ¼ 6:824 þ 0:664 lM; R2 ¼ 0:99783;
SD ¼ 0:144; N ¼ 24 L - serineð Þ
I=lA ¼ 4:748 þ 0:482 lM, R2 ¼ 0:99618;
SD ¼ 0:092; N ¼ 17 L - phenylalanineð Þ:
The active surface area of CNA electrode was calculated
with the help of CV studies of 5 9 10-4 M K4[Fe(CN)6] in
0.1 M H2SO4 as a redox probe at various scan rate
and using Randles–Sevcik equation, IP = (2.69 9 105)
n3/2AD1/2 C m1/2, where n is the number of electrons partic-
ipating in the redox reaction, A is the electroactive surface
area (cm2), D is the diffusion coefficient (cm2 s-1), C is the
concentration of the redox probe molecule (mol cm-3) and mis the scan rate (mV s-1). The calculated electroactive sur-
face area of CN electrode was found to be 0.125 cm2, where
C = 5 9 10-4 M, D = 7.1 9 10-6 cm2 s-1, n = 1 for
[Fe(CN)6]3-/4-system.
The sensitivity was calculated using the slope of the
current versus concentration calibration plot (Fig. 8a, b
inset) divided by the active surface area of CN according to
the following equation [22]:
Fig. 5 a 2D and 3D plots of CVs of 10-5 M L-Serine in PBS (pH 6.8)
at various scan rates (50, 80, 100, 120 and 140 mV s-1) on CN-
modified electrode. Inset the plot of peak current (I/lA) versus scan
rate (m/mV s-1). b 2D and 3D plots of CVs of 10-5 M
L-phenylalanine in PBS (pH 7) at various scan rates (50, 80, 100,
120, 140 and 150 mV s-1) on CN-modified electrode. Inset the plot
of peak current (I/lA) versus scan rate (m/mV s-1)
J Nanostruct Chem (2014) 4:102 Page 5 of 9 102
123

Sensitivity
¼ slope of the plot=active surface area of the electrode
ð1Þ
The sensitivity of the CN L-serine sensor was calculated
to be *5.21 lA lM-1 cm-2 (slope = 0.664 lA lM-1)
and L-phenylalanine to be *3.83 lA lM-1 cm-2
(slope = 0.482 lA lM-1).
The limit of detection (LOD) for both amino acids was
calculated using the following equation: LOD ¼ 3 s=m;
where s is the standard deviation of the peak currents of the
blank (five runs), and m is the slope of the calibration curve
[23], and the values were found to be 0.54 lM for L-serine
and 1 lM for L-phenylalanine.
Series of five successive LSV measurements with
10-5 M L-serine (pH = 6.8) and L-phenylalanine in PBS
(pH = 7), each recorded on a new modified CN electrode,
yielded relative standard deviations of 2.8 and 2.5 %,
respectively (Fig. 9). The results indicate that CN electrode
provides good reproducibility towards oxidation of both
Fig. 6 a 2D and 3D plots of DPVs of 10-5 M L-serine at CN
electrode in PBS (pH 6.8) in various time interval (2, 4, 6, 8 and
10 min) at 22 mV s-1 scan rate (t pulse = 0.07 s). Inset the plot of
peak current (I/lA) versus time interval (t/min). b 2D and 3D plots of
LSVs of 10-5 M L-serine at CN electrode in PBS (pH 6.8) in various
time interval (2, 4, 6, 8 and 10 min) at 100 mV s-1 scan rate. Inset the
plot of peak current (I/lA) versus time interval (t/min)
102 Page 6 of 9 J Nanostruct Chem (2014) 4:102
123
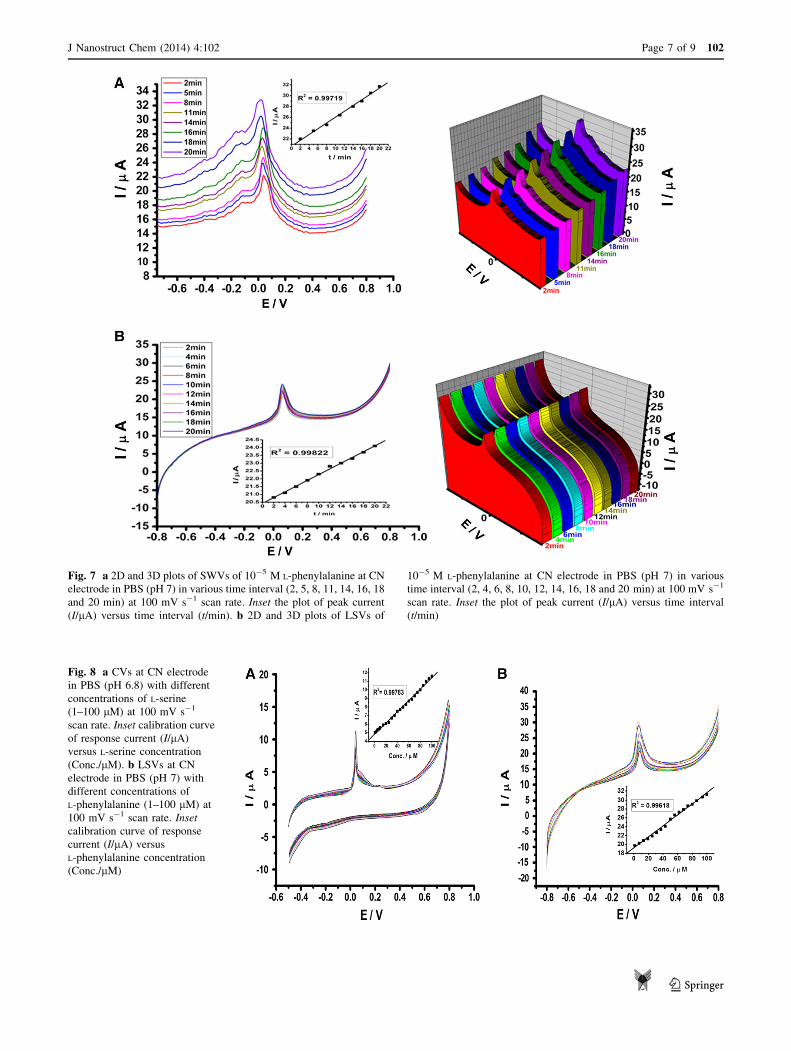
Fig. 7 a 2D and 3D plots of SWVs of 10-5 M L-phenylalanine at CN
electrode in PBS (pH 7) in various time interval (2, 5, 8, 11, 14, 16, 18
and 20 min) at 100 mV s-1 scan rate. Inset the plot of peak current
(I/lA) versus time interval (t/min). b 2D and 3D plots of LSVs of
10-5 M L-phenylalanine at CN electrode in PBS (pH 7) in various
time interval (2, 4, 6, 8, 10, 12, 14, 16, 18 and 20 min) at 100 mV s-1
scan rate. Inset the plot of peak current (I/lA) versus time interval
(t/min)
Fig. 8 a CVs at CN electrode
in PBS (pH 6.8) with different
concentrations of L-serine
(1–100 lM) at 100 mV s-1
scan rate. Inset calibration curve
of response current (I/lA)
versus L-serine concentration
(Conc./lM). b LSVs at CN
electrode in PBS (pH 7) with
different concentrations of
L-phenylalanine (1–100 lM) at
100 mV s-1 scan rate. Inset
calibration curve of response
current (I/lA) versus
L-phenylalanine concentration
(Conc./lM)
J Nanostruct Chem (2014) 4:102 Page 7 of 9 102
123

amino acids. The stability of the amino acid sensor was
also explored when the modified electrode was stored in air
for 15 days, where the current response of 10-5 M L-serine
and L-phenylalanine was found to be stable maintaining
*90 % of its initial intensity.
Interference
During the electrochemical studies of a sensor, it is
necessary to conduct the experiments at a particular
potential, which can only drive the reaction of interest.
Under optimized experimental conditions described above,
the effects of some small biomolecules on the current
responses of 10-5 M L-serine and L-phenylalanine have
been evaluated. Uric acid, vitamin C, dopamine, L-alanine,
glycine, tryptophan, and tyrosine have no influence on the
current response at CN electrode in PBS at pH 6.8 and 7.
The experimental results (Tables 1, 2) showed that ten
times of each substance had almost no interference with the
determination of L-serine and L-phenylalanine. So, it can be
concluded that the proposed method is able to assay both
the amino acids in the presence of interfering substances
and hence it can be considered specific. The average signal
change was found to be 0.7051 % for L-serine and 0.675 %
for L-phenylalanine.
Determination of amino acids in pharmaceutical
samples
L-Serine and L-phenylalanine were determined in some
pharmaceutical samples (Medett Products, India) using the
proposed method. Preparation of sample solution was as
same as mentioned in the ‘‘Reagents and apparatus’’
10-5 M sample solution was prepared in PBS at desired pH
and LSV studies were performed. Table 3 summarizes
the results obtained from voltammetric determination of
L-serine and L-phenylalanine along with the certified values
of the analyzed pharmaceutical products.
The above results suggest that CN electrode is very
reliable and sensitive enough for the determination of these
amino acids ion real samples.
Fig. 9 Stability of the responses for 10-5 M L-serine (a) and 10-5 M
L-phenylalanine (b), obtained at five different modified CN electrode.
For L-serine N = 5, RSD = 2.8 % and for L-phenylalanine N = 5,
RSD = 2.5 %
Table 1 Influence of interfering species on the voltammetric
response of 10-5 M L-serine at CN electrode
L-Serine (10-5 M) ? interfering
species (10-4 M)
Observed
potential
(V)
Signal
change
(%)
Average
signal
change (%)
L-Serine 0.0852 0
L-Serine ? uric acid 0.0855 0.352
L-Serine ? vitamin-C 0.086 0.939
L-Serine ? dopamine 0.0859 0.939 0.7051
L-Serine ? L-alanine 0.0847 0.587
L-Serine ? glycine 0.0852 0
L-Serine ? tryptophan 0.0845 0.828
L-Serine ? tyrosine 0.0863 1.291
Table 2 Influence of interfering species on the voltammetric
response of 10-5 M L-phenylalanine at CN electrode
L-Serine (10-5 M) ? interfering
species (10-4 M)
Observed
potential
(V)
Signal
change
(%)
Average
signal
change (%)
L-Phenylalanine 0.0613 0
L-Phenylalanine ? uric acid 0.0617 0.652
L-Phenylalanine ? Vitamin-C 0.0611 0.326
L-Phenylalanine ? dopamine 0.0621 1.305 0.675
L-Phenylalanine ? L-alanine 0.0616 0.489
L-Phenylalanine ? glycine 0.0615 0.326
L-Phenylalanine ? tryptophan 0.0609 0.652
L-Phenylalanine ? tyrosine 0.0607 0.978
102 Page 8 of 9 J Nanostruct Chem (2014) 4:102
123

Conclusions
In this study, a carbon nanosphere-modified electrode was
prepared and it was applied for the detection of L-serine
and L-phenylalanine using CV, DPV, SWV and LSV. The
prepared electrode was found to have excellent electro-
catalytic activity towards both the amino acids’ detection.
In both the cases, the oxidation peak current was linearly
proportional to its concentration over the range from 10-4
to 10-6 M (1–100 lM) with a very low detection limit
(correlation coefficient of 0.99783 for L-serine and 0.99618
for L-phenylalanine). This modified sensor showed excel-
lent sensitivity, selectivity and strong stability. This paper
also demonstrates the suitability of CN electrode for fast
analysis of L-serine and L-phenylalanine in standard solu-
tions as well as in commercial pharmaceutical products.
Acknowledgments The authors are grateful to the Director, NIT
Agartala to allow for publishing the results. IIT, Kanpur is greatly
acknowledged for characterization like SEM, TEM, AFM, etc.
Authors are also thankful to AICTE, New Delhi for financial support.
Conflict of interest The authors declare that they have no com-
peting interests.
Author contributions SD has been involved in experimental
works. SD has also made substantial contributions to the analysis and
interpretation of data. SD and MS carried out the manuscript prepa-
ration. MS has given final approval of the version to be published.
Open Access This article is distributed under the terms of the
Creative Commons Attribution License which permits any use, dis-
tribution, and reproduction in any medium, provided the original
author(s) and the source are credited.
References
1. Elsila, J.E., Dworkin, J.P., Bernstein, M.P., Martin, M.P., Sand-
ford, S.A.: Mechanisms of amino acid formation in interstellar ice
analogs. Astrophys. J. 660, 911–918 (2007)
2. deKoning, T.J., Snell, K., Duran, M., Berger, R., Poll-The, B.T.,
Surtees, R.: L-serine in disease and development. Biochem. J.
371, 653–661 (2003)
3. Mortell, K.H., Anderson, D.J., Lynch, J.J., Sherry, L.N., Kathy
Sarris, McDonald, H., Reza, S., Scott, B., Prisca, H., Lee, C.H.,
Michael, F.J., Murali, G.: Structure–activity relationships of
a-amino acid ligands for the a2d subunit of voltage-gated cal-
cium channels. Bioorg. Med. Chem. Lett. 16(5), 1138–1141 (2006)
4. Nelson, D.L., Cox, M.M.: Lehninger, Principles of Biochemistry,
3rd edn. Worth Publishing, New York (2000). ISBN 1-57259-
153-6
5. Heftmann, E.: Chromatography, Fundamentals and Applications
of Chromatography and Related Differential Migration Methods
Part B: Applications, 5th edn. Elsevier, Amsterdam (1992)
6. Li, H.Q., Chen, A., Roscoe, S.G., Lipkowski, J.: Electrochemical
and FTIR studies of L-phenylalanine adsorption at the Au(111)
electrode. J. Electroanal. Chem. 500, 299–310 (2001)
7. Grudpan, K., Kamfoo, K.: Flow injection dialysis for the deter-
mination of anions using ion chromatography. Talanta 49,
1023–1026 (1999)
8. Alwarthan, A.A.: Determination of ascorbic-acid by flow-injec-
tion with chemiluminescence detection. Analyst 118, 639–642
(1993)
9. Agater, I.B., Jewsbury, R.A.: Direct chemiluminescence deter-
mination of ascorbic acid using flow injection analysis. Anal.
Chim. Acta 356, 289–294 (1997)
10. Keyvanfard, M., Shakeri, R., Maleh, H.K., Alizad, K.: Highly
selective and sensitive voltammetric sensor based on modified
multiwall carbon nanotube paste electrode for simultaneous
determination of ascorbic acid, acetaminophen and tryptophan.
Mater. Sci. Eng. C 33, 811–816 (2013)
11. Daud, N., Yusof, N.A., Tee, T.W., Abdullah, A.H.: Electro-
chemical sensor for As(III) utilizing CNTs/leucine/nafion modi-
fied electrode. Int. J. Electrochem. Sci. 7, 175–185 (2012)
12. Akhtar, P., Too, C.O., Wallace, G.G.: Detection of amino acids at
conducting electroactive polymer modified electrodes using flow
injection analysis. Part II. Use of microelectrodes. Anal. Chim.
Acta 339, 211–223 (1997)
13. Li, H., Li, T., Wang, E.: Electrocatalytic oxidation and flow
detection of cysteine at an aquocobalamin adsorbed glassy carbon
electrode. Talanta 42, 885–888 (1995)
14. Tony, T., Ronald, J.M., Praveen, M., Zineb, M., Swamy, B.E.K.:
Multi-walled carbon nanotube modified carbon paste electrode as
an electrochemical sensor for the determination of epinephrine in
the presence of ascorbic acid and uric acid. Mater. Sci. Eng. C 33,
3294–3302 (2013)
15. Das, S., Saha, M.: Non enzymatic electrochemical detection of
glucose at rice starch-nanoparticles modified electrode. Int.
J. Pharm. Bio. Sci. 4, 967–975 (2013)
16. Das, S., Saha, M.: Preparation of carbon nanosphere from bam-
boo and its use in water purification. Curr. Trends Tech. Sci. 2,
174–177 (2013)
17. Das, S., Saha, M.: Electrochemical studies of carbon nanotube
obtained from coconut oil as non enzymatic glucose biosensor.
Adv. Sci. Eng. Med. 5, 645–648 (2013)
18. Sonkar, S.K., Saxena, M., Saha, M., Sarkar, S.: Carbon nano-
cubes and nanobricks from pyrolysis of rice. J. Nanosci. Nano-
tech. 10, 1–4 (2010)
19. Saha, M., Das, S.: Fabrication of a nonenzymatic cholesterol
biosensor using carbon nanotubes from coconut oil. J. Nanostruct.
Chem. 4, 94–102 (2014). doi:10.1007/s40097-014-0094-1
20. Heines, V.: Peter Griess discoverer of diazo compounds. J. Chem.
Educ. 35, 187–191 (1958)
21. Swartz, E., Krull, I.S.: Analytical Method Development and
Validation. Marcel Dekkar, New York (1997)
22. Tian, H., Jia, M., Zhang, M., Hu, J.: Nonenzymatic glucose
sensor based on nickel ion implanted-modified indium tin oxide
electrode. Electrochim. Acta 96, 285–290 (2013)
23. Dar, G.N., Umar, A., Zaidi, S.A., Ibrahim, A.A., Abaker, M.,
Baskoutas, S., Al-Assir, M.S.: Ce doped ZnO nanorods for the
detection of hazardous chemical. Sens. Actuat. B Chem. 173,
72–75 (2012)
Table 3 Results obtained for the determination of L-serine and
L-phenylalanine in pharmaceutical products using modified CN
electrode
Sample CN-modified
sensor (g)
Certified
value (g)
Recovery
(%)
Bias
(%)
L-Serine 1.47 ± 0.02a 1.5 98 2
L-Phenylalanine 1.46 ± 0.01a 1.5 97.3 2.6
a Average of five determinations
J Nanostruct Chem (2014) 4:102 Page 9 of 9 102
123